Zhou.Zhiheng
Architecture Portfolio / Saga University
• PROFILE: Zhou.Zhiheng
Birth:
Email:
Phone:
• Education
1999.9.30
22738091@edu.cc.saga-u.ac.jp
+81 08039009061
2017-2022 Undergraduate course
Zhejiang Sci-Tech University - Architecture Department
2022-2024 Pre-doctoral course
Saga University - Architectural and environmental design course
• Internship
Shanghai Design Institute (SDI)
Jizhu Commune Design Studio
Greentown
Fiverr architectural drawing part-time
• Skill
SPASS / Origin / QGIS / Rhino / Grasshopper / ArchiCAD / Sketchup / PS / AI / InDesign / Pr / Blender / Vray / Enscape / Lumion /
• Awards
2020 TaiDa Cup National Top 15
2020 Render of the year Student track winner
2021 Zhejiang Rural Design Competition Gold Award
2021 The First "Into the National Traditional Village Park" Top 15


• Furniture for Festival Teamwork (3 persons / Member) 2023.1 - 2023.4
• Plateau Kindergarten
(8 persons / Leadership) 2022.10 - 2023.1
• Montage Hotel
work 2021.3 - 2021.5
• Oriental Utopia Hotel
• One-person work
- 2021.10
Spatiotemporal Land Use/ Land Cover Changes and Impact on Urban Thermal Environments: Analyzing Cool Island Intensity Variations Teamwork (3 persons / Student first author) 2023.9 - 2024.3
PUSH & PULL

Furniture for festival
Teamwork (3 persons / Member)
2023.1 - 2023.4
Location:
Typology:
Size:
Structure:
Arita / Saga / Japan
Furniture 0.6m 2 Wood & Steel
• LOCATION
This project is located in Arita, Kyushu, Japan. The site is close to the centre crossroad of Arita Pottery Festival, only ten minutes' walk from Arita Station, with many houses on the north side, and a natural mountain range on the south side, which has a great view of the city.


Kyushu - Japan

• SITE DETAILS


The site was originally the entrance of a warehouse on the side of a pottery shop, and the owner wanted to open a new pottery shop inside the warehouse, but the door of the warehouse was not visible from the main road, we will design an outdoor pottery display booth to attract people to enter the warehouse from the main road.
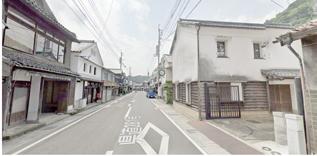
The Arita Pottery Festival is a big annual market happening every April to May, attracting over 1 million visitors. With over 600 shops, visitors can find everything from plates to art pieces.

• FESTIVAL PHOTOS (DISADVANTAGES)


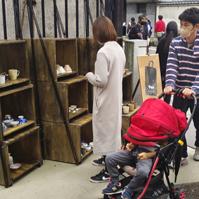
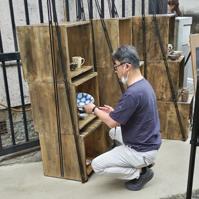
From the photos, Some disadvantages of the pottery festival are shown. First, the high-saturation plastic container and sheds seriously damaged the surrounding antique atmosphere. Second, the pottery was stacked in Inside the container, it is not conducive to display or selection, People can only view and select the top layer of pottery.
• DISPLAY & SELLING METHODS

In the Pottery Festival, there are eight main ways of displaying and selling, each with its own characteristics, for example, 'ladder display' is good for displaying but not good for storing, and 'reverse stacking' is the opposite. 'Semi-Wrap' is good for management but has little space for display, 'Rear' is the opposite.
Kyushu - Japan

• CONCEPT
For this project, we need to design a portable and transformable outdoor pottery display platform to attract poeple from the main road.
The sidedoor of the warehouse is narrow and small, we hope to lead people in. The cabinet we designed can be transformed into a ladder. When multiple ladders are arranged together with different slopes, Leading Curves are formed that make people want to follow and enter.


 Cabinet form (storage)
Ladder Form (display)
Pushcart form (moving)
• DETAILS
サラネジ : 首下長19mm 下半径Φ 4.2mm
展示箱縦板 : 杉無垢材 30×450×450mm 側支柱 : 鉄筋丸鋼長さ 2020mm φ5mm 塗料 オイルステイン
C Channel : アルミニウム SV136 10×450×7 mm
ボール : アルミニウム 半径 7 mm
サラネジ : 首下長38mm 下半径Φ 6mm


The most important and difficult part of this project is the design of the slide rail, how to make the heavy wooden display box filled with pottery to slide steadily and smoothly is the biggest problem we faced.
At first we tried to use wood to make the rail, and made them smoother by adding lubricant, but the friction between wood and wood was still too high.
So we changed to steel slide rail, which also had a lot of friction at first, finally we solved the problem by adding small steel balls to the rail, and the heavy box slid smoothly with the help of a row of these rolling steel balls.
For the sliding structure, a 'C Channel' structure was chosen, which prevents the exhibition box from swinging from side to side when the structure is too tight.
スライド構造には、展示ボックスの左右の揺れを防ぐ とともに、傾斜がきついときに押したり引いたりするの Channel」という構造を選びました。
• SITE PLAN
PUSH & PULL
People moving line
Backyard Pottery shop & Cafe Pottery shop Warehouse
Originalshelf
Indoor display
281 Prefecture Road Cashier Pantry
Entrance
Oudoor display

目線の高さ コ ヒースタンド


Stand Coffeeには製作と販売二つ機能の屋台を作り ました。展示ボックスの高さを一つ400mmに規定し ました。2階の800mmには販売員が材料の一部を収 納し、人がカップに手を伸ばしやすい,3段目の 1200mmでは販売員が立ってコーヒーを入れ、人が カップに手を伸ばしやすい。
coffee stand 展示台では焼き物の高さを考慮して、人の目線に 合わせ、手を伸ばして取りやすいように箱の高さを 450mmに指定しました。
As the width of the site is narrow, multiple stands are lined up to guide customers into the space where curved surfaces have been created, drawing the eye to the stands and creating a dynamic space even in a narrow space.
支える
展示ボックス
ユニークなサインとして存在し,お客様を引き付ける。






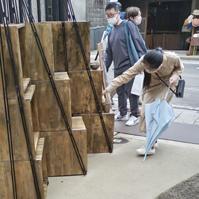
PUSH & PULL
• SCALE
Considering the height of the pottery on the exhibition stand, the height of the box was specified at 450 mm to match people's eye level and make it easier for them to reach out and pick it up.
目線の高さ

展示台では焼き物の高さを考慮して、人の目線に 合わせ、手を伸ばして取りやすいように箱の高さを 450mmに指定しました。


PROJECT 02
KINDERGARTEN & RANCH CENTER

Plateau Kindergarten
Teamwork (8 persons / Leadership) 2022.10 - 2023.1
Location:
Typology:
Size:
Structure:
Xinjiang / China
Kindergarten & ranch center
2000m 2
Brick and Concrete •


In Hejing County, Xinjiang, West China, people living in mountain areas make a living by grazing. Adults need to graze outside for a long time. Children at home are often left unattended. At the same time, the scattered villages also lack a center, so the client hopes to provide the local villagers a full-care kindergarten and a ranch service center, which solved the problem of child care on one hand, and became a service center for the surrounding herdsmen on the other.
• TRADITIONAL BUILDING STYLE: AYWAN

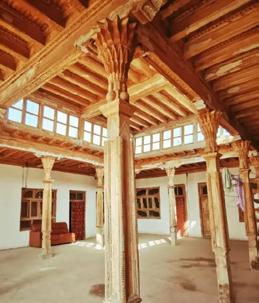
In order to solve winter wind problem, the local herdsmen created an architectural form called 'Aywan'. In Aywan, the roof has high side windows, and there are no windows around the room, using heat pressure ventilation and wind pressure ventilation to
Steel support
maintain indoor air circulation in winter.
Aywan space is spacious and closed, surrounded by earth platforms about 500mm high, which is equivalent to an indoor courtyard, providing the functions of meeting guests and living.

Steel support
Steel support
Steel support


• SPACE GENERATION
• LIGHT & VENTILATION
 1.The layout of the function modules.
ranch sevice center dormitory kingergarten
4. Generate narrow yards along the north of the arc wall.
5.The compact layout centered on courtyards.
6.Generate Aywans ,helping the stack ventilation.
9.Solar roofs.
8.Small concave windows.
7.Generate the sunshade verandas.
10.Layout of external environment.
11.The generation of microtopography.
12.Windbreak with vegetations.
2.Wind is guided by the arc contour.
3. Generate courtyards. courtyard pluck wind skylight lighting courtyard pluck wind solar panels courtyard pluck wind pebble bed
• PASSIVE ENERGY SAVING STRATEGIES
1. Curved wall wind guide


3. Deep small window


1. Ramed earth wall


3. Compact layout


2. Courtyard windshield


4. Vegetation windshield


2. Pebble floor heat storage


4. Microclimate regulation


• Wind & Sand Protection
When dealing with strong sandstorms, curved walls are used to guide the wind, while green plants are used to slow down the wind speed, and a 'buffer courtyard' is built around the building to isolate the sandstorms. Ayiwang's high side windows and recessed small windows are used in architectural details to maintain good ventilation
NNW wind


• Winter Warming Methods:
First of all, we use two materials with large specific heat capacity: rammed earth and pebble as building materials. These two materials are very common in the local area, and the construction method is also very simple. At the same time, we compact the building layout, and then adjust the temperature by adding green plants.

• Summer Shading Protection:
We take advantage of the compact layout of the building to form cold alleys and building self-shading. At the same time, use high side windows to introduce diffuse light
• Local Architectural Features:
Local climate is hot, in order to maintain good indoor ventilation, people will build lattice walls on the room where the fruits are dried. At the same time, the distance between the buildings will be very close to create shade.
1. Cold alley


1. Ventilation lattice wall


2. Building self-shading


2. Compact building complex


Ranch sevice center entrance


VISUAL STUDIES

Montage Hotel
One-person work
2021.3 - 2021.5
Location:
Typology:
Size:
Structure:
Zhejiang / China Hotel
26000m 2 reinforced concrete
• MOVIE LONG-SHOT THEORY (RESEARCH BACKGROUND)
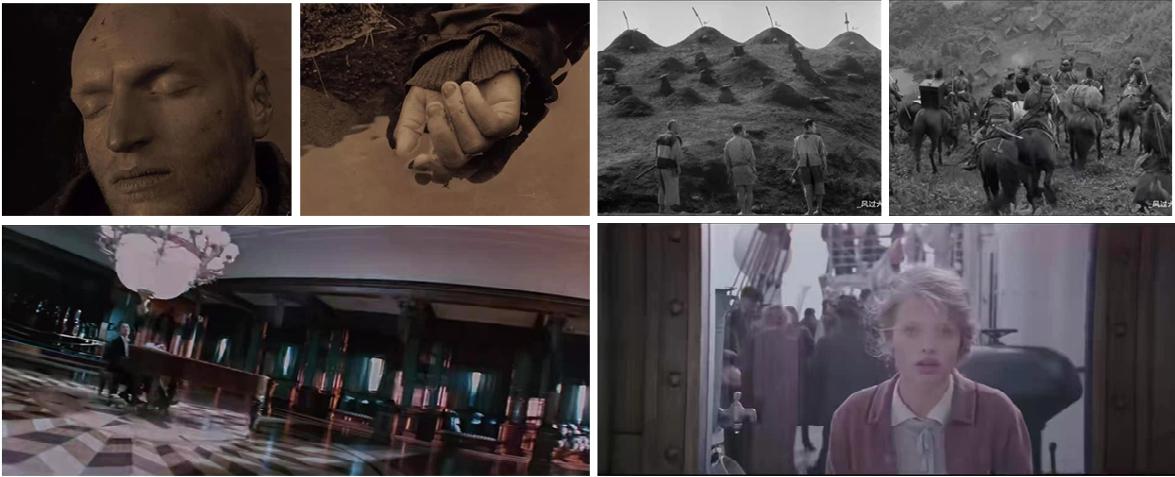
When people watch a movie, the movie's frame composition, colour elements, sound design, etc., many different techniques create an immersive atmosphere for the audience. One technique that is particularly important is the 'long shot', which is characterised by long, fixed shots.
In architectural space, the Acropolis design is based on a "long shot" spatial experience, as one walks around the Acropolis, the view is always active, like watching a film, so we wanted to discover the movie rules to define a set of architectural design rules.
 movie long shot
Acropolis movie-like space

• RESEARCH PURPOSE


Research methodology
Studying viewer perception changes in films requires grasping Camera Move, affecting perspective, and Role Move, altering in-frame elements. Applying these as Elements Move in architecture, we use Screen(Space) Elements for researching. This enhances spaces by blending film techniques with people movement.
• RESEARCH METHODS
I chose films by director Hou Hsiaohsien as typical examples for my case study. These films make extensive use of long shots.
First of all, I screen a clip of the whole film, and clips with obvious long shots will be retained by me, then I used PR software, tracking the characters, and abstracting each character with obvious movement into a point, and then importing the video into Kinovea, a motion analysis software, to analyse and export its motion data, and finally summing up the five laws of motion of the picture elements.
1. Changes in the same direction usually occur in groups of multiple elements
2. The end of a group of same direction movements is usually accompanied by the beginning of another group of reverse movements
3. A noticeable difference in the speed of movement of the elements.
4. A group of same-direction movement is interspersed with a small amount of reverse movement.
5. There are always some stable or regular elements in the picture.
By learning the long take technique in movie shooting, So that when designing the continuous space in the building, the arrangement of architectural elements can make the human vision always be in an active situation, so that the architectural space can attract and guide the human vision more positively.

Relationship between space and movie
The concept of continuous space splits into linear and open spaces, impacting architectural design. Linear space guides visitors along a set path, unfolding an architectural story, while open space allows for free exploration, representing movement freedom. These spaces coexist, with linear paths embedded in open areas, highlighting a symbiotic relationship between structure and freedom.


• MOVIE CASE STUDY
This case study selects Taiwanese director Hou Hsiao-hsien's film "Love in the Wind" as a reference for composition and editing.
Thanks to Hou Hsiao-hsien's skillful use of long shots and actor arrangement, the quiet but not boring feeling he expresses is exactly what I need. I intercepted the typical composition and actor arrangement screen extracted from the whole film for research.


• INSPRIATION FROM SITE RESEARCH
when I was walking around in the site, a hidden path caught my attention, which was like a perfectly mini-movie
The space is full of dramatic changes: at the beginning of the road there is a pond with very muddy water on the left, then the trees gradually thicken, the pond on the left becomes a rice field, the path gradually narrows, and finally the trees are so dense that you need to bend over to walk, suddenly There was a small waterfall in front of


you, stepping on slippery stones to cross the river, and there were beautiful flowers on the other side. At this time, everyone took out their mobile phones to take pictures. Think of the human eye as a camera, and that hidden path experience is a well-shot short film.

Characters
First level environment (close-up)
Second-level environment (far view, background)
Movement of characters
• MOVIE ANALYSIS METHOD
I extracted the image of the actor with a black rectangle, the first level environment (close-up) was extracted as gray, and the second-level environment (far view, background) was extracted with white, The movement of the characters is
represented by a red dotted line, in order to more clearly study the law of character movement and the skills of composition and editing in the film.

A scene in a film is made of fixed and moving shots, the moving shots give a sense of motion and the fixed shots give a sense of calm. In the architectural space, the moving camera represents a continuous movement, while the fixed camera represents the movement of the sight, in this way we can study each other between the film technique and the architectural space. •




• SPACE ORGANIZATION
After learning the composition and actor scheduling techniques in the movie, I began to arrange my own architectural space, extract some typical shots in the movie to restore, and create a dynamic effect similar to the Acropolis by people walking in the space. A building is like an actor, constantly appearing or disappearing in people's field of vision.

blocks composition


The semi-outdoor space in the picture frame uses the wall lines on both sides to guide people into the next picture frame
Very "long" fixed shot, actors will continue to move in and out of the screen, so that a fixed camera can also constantly conveying information
As people approach, the buildings on both sides withdraw from the field of vision, which is regarded as the exit of the people, and the picture frame at the far end is strengthened.
The buildings on both sides are used as picture frames, framing the mountain view
• Wind and Sand Protection

1. Determine the location of the tree within the site

5. Consolidate blocks, retain suitable curves and volumes


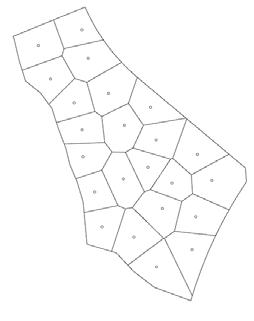
2. Build tree-centered Thiessen polygons

6. Move, rotate, zoom and other operations according to the extracted movie shots


3. Create a surface with straight edges

7. Determine the camera position, connect the camera positions into a line, and form a road


4. Offset surfaces to form blocks

8. Raise a corner of the building to determine the gravity of each composition


In the picture frame, the building on the left is the gravity of the picture, supplemented by the buildings in the distance to increase the sense of depth
As soon as the sight turns, the building on the right appears impressively, grabbing the gravity of the picture and becoming the protagonist, and the distant view is not blocked.
Once again form the cooperation between the picture frame and the near, medium and longterm vision
Close-up of buildings with repeated changes
It ends with an empty shot of a mountain view
TRANSFORMING TRADITIONAL SPACE

• Oriental Utopia Hotel
Location:
Typology:
Size:
Structure:

Tao Yuanming
One-person work
2021.8 - 2021.10
Zhejiang / China Hotel 21000m 2 reinforced concrete

Painting about Peach blossom utopia
• PEACH BLOSSOM UTOPIA
In ancient China, a poet named Tao Yuanming wrote 'The Peach Blossom Utopia' when the country was on the verge of collapse and his own ideals were shattered. This fictional article depicts a fisherman who got lost and strayed into a cave. In this cave, There is a beautiful village. The people inside are separated from the outside world. They don't know the war and disaster outside. People live happily and peacefully, fishermen left a few days later, but he had never found the way back to the village again.

• SITE

Ancient manuscripts

The site is located at the foot of the mountain, with lush vegetation and superior natural environment. The north side is a mountain, the south side is a low forest, the east side is a natural reservoir, and the west side is railway traffic. It is far from the city center and is a quiet place to live.
 Aerial view


 1. Entrance
3. Water fountain
6. Type A house
2. Peach Pond
5. Stone wall


• SPACE SERIES ANALYSIS
This design draws inspiration from fishermen's discovery of Peach Blossom Utopia, aiming to immerse hotel guests in a similar journey of discovery. As guests progress from the hotel entrance to the lobby, the increasing number of peach trees and strategic architectural elements mimic the fishermen's passage


through a narrowing cave into a beautiful village, culminating in a sudden reveal of the hotel's scenic beauty. This journey from the mundane to the magical mirrors the original tale's transition from the ordinary to the extraordinary, enhancing guests' experience through a crafted narrative of discovery and wonder.


 9. Type D house
11. Street Garden
8. Road fork
7. Type B house
10. Water feature
12. Type C house
The mountain gradually rises
The villa area has a wide view
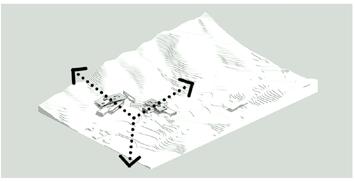
Organise walking routes Form two building axes
Model aerial photo
Entrance strengthens the axes


• BUILDING TYPE
The hotel is divided into two settlements in space arrangement, The standard room area and the villa area, the standard room area is transformed into the Jiangnan Township Traditional form, which reproduces the spatial form of the water bank.
The villa area is divided into three types, with the form of hanging hops to deal with the mountain, form a variable vertical space


For different groups of demand, the villa area has three different forms.
Type A is suitable for 1 to 2 people traveling separately, and the wide public activity area gives each person to create enough comfort and distance.
Type B is suitable for multiple families or many couples, each has a separate bedroom with a public living room.
Type C is suitable for a big family, and many generations live together.


THESIS & RESEARCH

Spatiotemporal Land Use/ Land Cover Changes and Impact on Urban Thermal Environments: Analyzing Cool Island Intensity Variations
Teamwork (3 persons / Student first author)
2023.9 - 2024.3
• Abstract
This study examines the spatiotemporal evolution of land use/land cover (LULC) in Hangzhou city, focusing on its seasonal impacts on the urban thermal environment and urban cool island (UCI) effects. It particularly investigates how distance gradients and the water body shape index (WBSI) influence land surface temperature (LST) in the urban core. Highlighted are the region's climatic characteristics, with hot summers and cold winters, which underscore significant seasonal varia-tions in LST. Addressing a gap in existing UCI research, the analysis extends beyond the typical large-scale planning focus to include small-scale, high-resolution aspects. Employing remote sensing and geographic information system analysis techniques, it analyzes seasonal dynamics in Hangzhou's central urban area. High-resolution LST data, obtained through singlechannel in-version and resolution enhancement algorithms, are crucial to this analysis. Using the maximum likelihood classification method, land use/land cover from 19902020 is analyzed. This analysis reveals potential drivers of urban thermal environment changes, such as the expansion of resi-dential and commercial areas and the reduction in green spaces. Different regions in LST data are delineated to assess the cool island effect, and the complexity of water body boundaries is quan-tified using the water body shape index. Spatial and temporal patterns of LST changes are inves-tigated using multivariate regression and time-series analysis models. Significant changes in LULC over the past 30 years in Hangzhou, closely correlating with a continuous rise in LST, are identified. However, it is noted that temperatures in blue-green areas remain consistently low. The intensity of the cool island effect from large water bodies is found to diminish with distance, whereas the complexity of their boundaries enhances this effect. Additionally, the regulatory role of the cool island effect is observed to vary seasonally, being most pronounced in summer and less so in autumn and winter, thereby demonstrating a positive impact. In conclusion, land use changes are underscored as key drivers impacting the urban thermal environment. It also finds that spatial factors and seasonal variations significantly affect the intensity of the cool island effect. These findings provide valuable scientific evidence for urban planning and climate change adaptation, emphasizing the importance of balancing natural elements with the built environment in urban design.
Keywords: Urban Cool Islands; Land-Use/Land-Cover (LULC); Land Surface Temperature (LST); Spatial Variability; Distance Gradient; Water Body Shape Index (WBSI)
and pocket parks, totaling over 300 parks and green spaces exceeding 4,000 m2. The heart-
land of Hangzhou, bordering Xihu, Shangcheng,
• Research Area and Data Source
West Lake, the city boasts a diverse park system, including wilderness, urban, community, 98 and pocket parks, totaling over 300 parks and green spaces exceeding 4,000 m2. The heart- 99 land of Hangzhou, bordering Xihu, Shangcheng, Xiacheng, and Jianggan districts, is char- 100 acterized by unique ecological functions and rich cultural values, making it an ideal sub- 101 ject for investigation. The extensive waters and vegetation of West Lake significantly in- 102 fluence the urban environment, acting as a vital buffer zone for the thermal milieu. The 103 district, as shown in Figure 1, represents Hangzhou's core metropolitan area, notable for 104 its substantial population and size.


It is crucial to comprehensively account for the factors impacting urban cool island
effects to enhance the research's comprehensiveness and accuracy. This study goes be-
yond analyzing land use types, incorporating meteorological conditions, building and
population density, green space configurations, and water body characteristics. Data on 136 these elements were sourced from meteorological stations, satellite imagery, population 137 censuses, and field investigations, and processed using spatial analysis and statistical 138 models. Climate conditions, building distributions, population patterns, and blue -green 139 space configurations exhibit intricate relationships with the cool island phenomenon. In- 140 corporating these factors reveals the mechanisms behind cool island formation, verifies 141 research accuracy, and enhances the comprehensiveness and authenticity of the results.
Consequently, this study integrates a wide range of factors beyond land use types for a
more holistic and precise understanding of urban cool island effects, thereby informing
Hangzhou is situated along the southern bank of the Yangtze River Delta and down-stream of the Qiantang River, spanning from 118°20'E to 120°44'E longitudinally and 29°11'N to 30°34'N latitudinally. The region has a humid subtropical climate character-ized by hot summers. Renowned for its rich natural resources and unique urban layout, Hangzhou stands as a critical eco-garden city in China. As of 2020, Hangzhou's urban green coverage rate reached 40.29%, with 406 parks covering approximately 6,686.53 km2. The city's core area, covering about 312.43 km2, provides essential ecological services and leisure space. Additionally, as the core city of the southern wing of the Yangtze River Delta, it spans 16,596 km2 and has a population of approximately 11,936,000. Centered around West Lake, the city boasts a diverse park system, including wilderness, urban, community, and pocket parks, totaling over 300 parks and green spaces exceeding 4,000 m2. The heartland of Hangzhou, bordering Xihu, Shangcheng, Xiacheng, and Jianggan districts, is characterized by unique ecological functions and rich cultural values, making it an ideal subject for investigation. The extensive waters and vegetation of West Lake significantly influence the urban environment, acting as a vital buffer zone for the thermal milieu. The district, as shown in Figure 1, represents Hangzhou's core metropolitan area, notable for its substantial population and size.
from 1990 to 2020. These images were carefully selected based
As detailed in Tables 1 and 2, the study utilized high-quality Landsat 5, 7, and 8 satellite images from 1990 to 2020. These images were carefully selected based on their clarity and minimal atmospheric interference. Preprocessing steps like cloud and shadow removal, atmospheric correction, and topographic normalization ensured data completeness and accuracy. Image data from February, May, August, and November of each year were selected to capture seasonal variations, as sourced from the USGS Earth Explorer website (https://earthexplorer.usgs.gov/). Landsat 5 images have a resolution of 30x30 m, with their thermal infrared bands resampled to match the spectral band resolutions. Landsat 7 provides a 30-meter spatial resolution for its spectral bands. Additionally, Landsat 7 features the Enhanced Thematic Mapper Plus (ETM+) sensor, enhancing the image quality compared to Landsat 5. Furthermore, Landsat 7's thermal infrared bands have a 60-meter resolution, between the 30-meter resolution of its spectral bands and Landsat 8's 100-meter thermal infrared resolution. Landsat 8 offers a 30 m resolution for spectral bands and a 100 m resolution for thermal infrared bands. The images underwent radiative and atmospheric calibrations.
Land surface temperature (LST) data were derived by combining Landsat 5's TM, Landsat 7's ETM+, and Landsat 8's OLI and TIRS sensor data, using an improved mono-window algorithm. This seasonal and annual data facilitated comprehensive analyses of land cover transformations and temperature shifts in Hangzhou and its environs.
• Land Use and Land Cover Indicators and Spatial Index Variations
1990 to 2020. These images were carefully selected based
atmospheric interference. Pre -processing steps like clou
atmospheric correction, and topographic normalization ensu
Over the past 30 years, Hangzhou has undergone significant changes in land use and land cover (LULC), reflecting its dynamic urbanization and demographic evolution. These transformations were comprehensively analyzed using the maximum likelihood supervised classification approach applied to Landsat image data from 1990, 2000, 2010, and 2020. The overall accuracies and Kappa coefficients of this analysis, ranging from 0.86 to 0.95 (0.95, 0.86, 0.89, and 0.88, respectively), underscore the reliability of the classi-fication techniques used.
accuracy. Image data from February, May, August, and 113 were selected to capture seasonal variations, as sourced fro 114 website (https://earthexplorer.usgs.gov/). Landsat 5 ima 115 30x30 m, with their thermal infrared bands resampled to 116 resolutions. Landsat 7 provides a 30 -meter spatial resolutio
Additionally, Landsat 7 features the Enhanced Thematic M
enhancing the image quality compared to Landsat 5. Fur
infrared bands have a 60 -meter resolution, between t


The specific LULC changes detailed in Figure above include a dramatic de-cline in arable land, a significant expansion of residential and commercial areas, an initial decrease followed by a recovery of forested areas, a substantial expansion of infrastructure, particularly roads, and a fluctuation in industrial land use. Water bodies remained rela-tively stable, demonstrating effective resource management amid urban growth.
Notable transitions between LULC types over the decades, as shown in the Sankey Diagram in Figure left, include a persistence of commercial land use, the transformation of green fields into residential and commercial areas, and the conversion of commercial and cropland areas into residential zones.
The LULC changes, as illustrated in Figures 3, 4, and Table 4, and depicted in the 284 land-use and land-cover maps and the LULC type change matrix, highlight Hangzhou's 285 transition from an agricultural landscape to a modern urbanized city. This transition has 286 been driven by economic growth, increasing population, and evolving urban planning 287 strategies. The spatial distribution of these changes indicates a more pronounced trans- 288 formation in the central and eastern parts of the city. Meanwhile, the outskirts have largely 289 retained their natural and agricultural characteristics. 290
• Spatiotemporal Variabilities Characteristics in Land Surface Temperatures of Hangzhou Core Area over the Past 30 Years
Using a single-channel algorithm, surface temperatures in Hangzhou were extracted from Landsat satellite imagery for the years 1990, 2000, 2010, and 2020. Median and mean temperature values for each land use type for each season in these years were selected as reference indices. Density segmentation methods were used to ana-lyze the distribution of surface temperatures in Hangzhou across various seasons and pe-riods, as illustrated in Figures right. The analysis revealed that major water bodies in Hangzhou, notably West Lake, were significant cool island areas in summer, with surface temperatures approximately 2.1°C lower than the surrounding urban developed areas.
The specific LULC changes detailed in Figure 3 and Table 4 include a dramatic de- 291 cline in arable land, a significant expansion of residential and commercial areas, an initial 292 decrease followed by a recovery of forested areas, a substantial expansion of infrastruc- 293 ture, particularly roads, and a fluctuation in industrial land use. Water bodies remained 294 relatively stable, demonstrating effective resource management amid urban growth. 295
Spatial and temporal analysis of surface temperature patterns across the four seasons from 1990 to 2020 showed that the proportion of cool temperature zones in spring con-sistently exceeded other temperature zones in all classified areas. This trend highlights the strong correlation between urban heat island effects and seasonal changes, with the cool-ing effect most significant in summer at West Lake, followed by spring and autumn, and least noticeable in winter.
Notable transitions between LULC types over the decades, as shown in the Sankey 296 Diagram in Figure 4, include a persistence of commercial land use, the transformation of 297 green fields into residential and commercial areas, and the conversion of commercial and 298 cropland areas into residential zones.
4.2.
Statistical analysis from 1990 to 2020 indicated an upward trend in the rate of change of surface temperatures for all land use categories, except water bodies. For example, the average summer temperature in forested areas increased from 25.28°C in 1990 to 26.52°C in 2020. In contrast, temperature fluctuations in water bodies and forests were relatively stable, with a standard deviation controlled below 0.8°C, reflecting their lower degree of urbanization. The data also reflected the monsoon climate characteristics of Hangzhou, with a significant temperature difference between summer and winter in 2020.
Using a single-channel algorithm, surface temperatures in Hangzhou were extracted 302 from Landsat satellite imagery for the years 1990, 2000, 2010, and 2020. Median and mean 303 temperature values for each land use type for each season in these years were selected as 304 reference indices, as detailed in Table 5. Density segmentation methods were used to an- 305 alyze the distribution of surface temperatures in Hangzhou across various seasons and 306


The spatial variability analysis of Land Surface Temperature (LST) revealed distinct spatial patterns linking urban expansion with an increase in surface temperature. These patterns illustrate heat accumulation in urban materials and the significant impact of re-duced vegetation on the intensity of the Urban Heat Island (UHI) effect. With Land Use/Land Cover (LULC) changes, LST is generally higher in urban construction and in-dustrial areas, and lower in green spaces and water bodies, especially around the West Lake area.
For instance, as depicted in Figure below, the analy-sis shows that alongside regional LULC changes, there are corresponding shifts in LST across different zones. The analysis of the link between urban expansion and increased LST confirms that LST is typically higher in urban construction and industrial areas. The analysis reveals that green spaces and water bodies, especially around the West Lake, play a significant role in modulating LST, generally maintaining lower temperatures. Directional analysis indicates that LST varies in certain directions, influenced by average Water Body Shape Index (WBSI) and seasonal LST data.
In summary, the relationship between urban expansion and increased LST, the mod-ulating effect of green spaces and water bodies on LST, and the impact of LULC changes on LST distribution are key factors influencing the intensity of the urban heat island effect. Seasonality and directionality also play crucial roles in influencing LST distribution.
• Spatial Influence of Distance Gradient Variations on UCI Phenomena Sustainability
(a) 1990 sumer LST of Hangzhou Core Urban Area

(b) 2000 sumer LST of Hangzhou Core Urban Area
(c) 2010 sumer LST of Hangzhou Core Urban Area
(d) 2020 sumer LST of Hangzhou Core Urban Area
• Analysis of Water Body Shape Index (WBSI) Morphological Characteristics
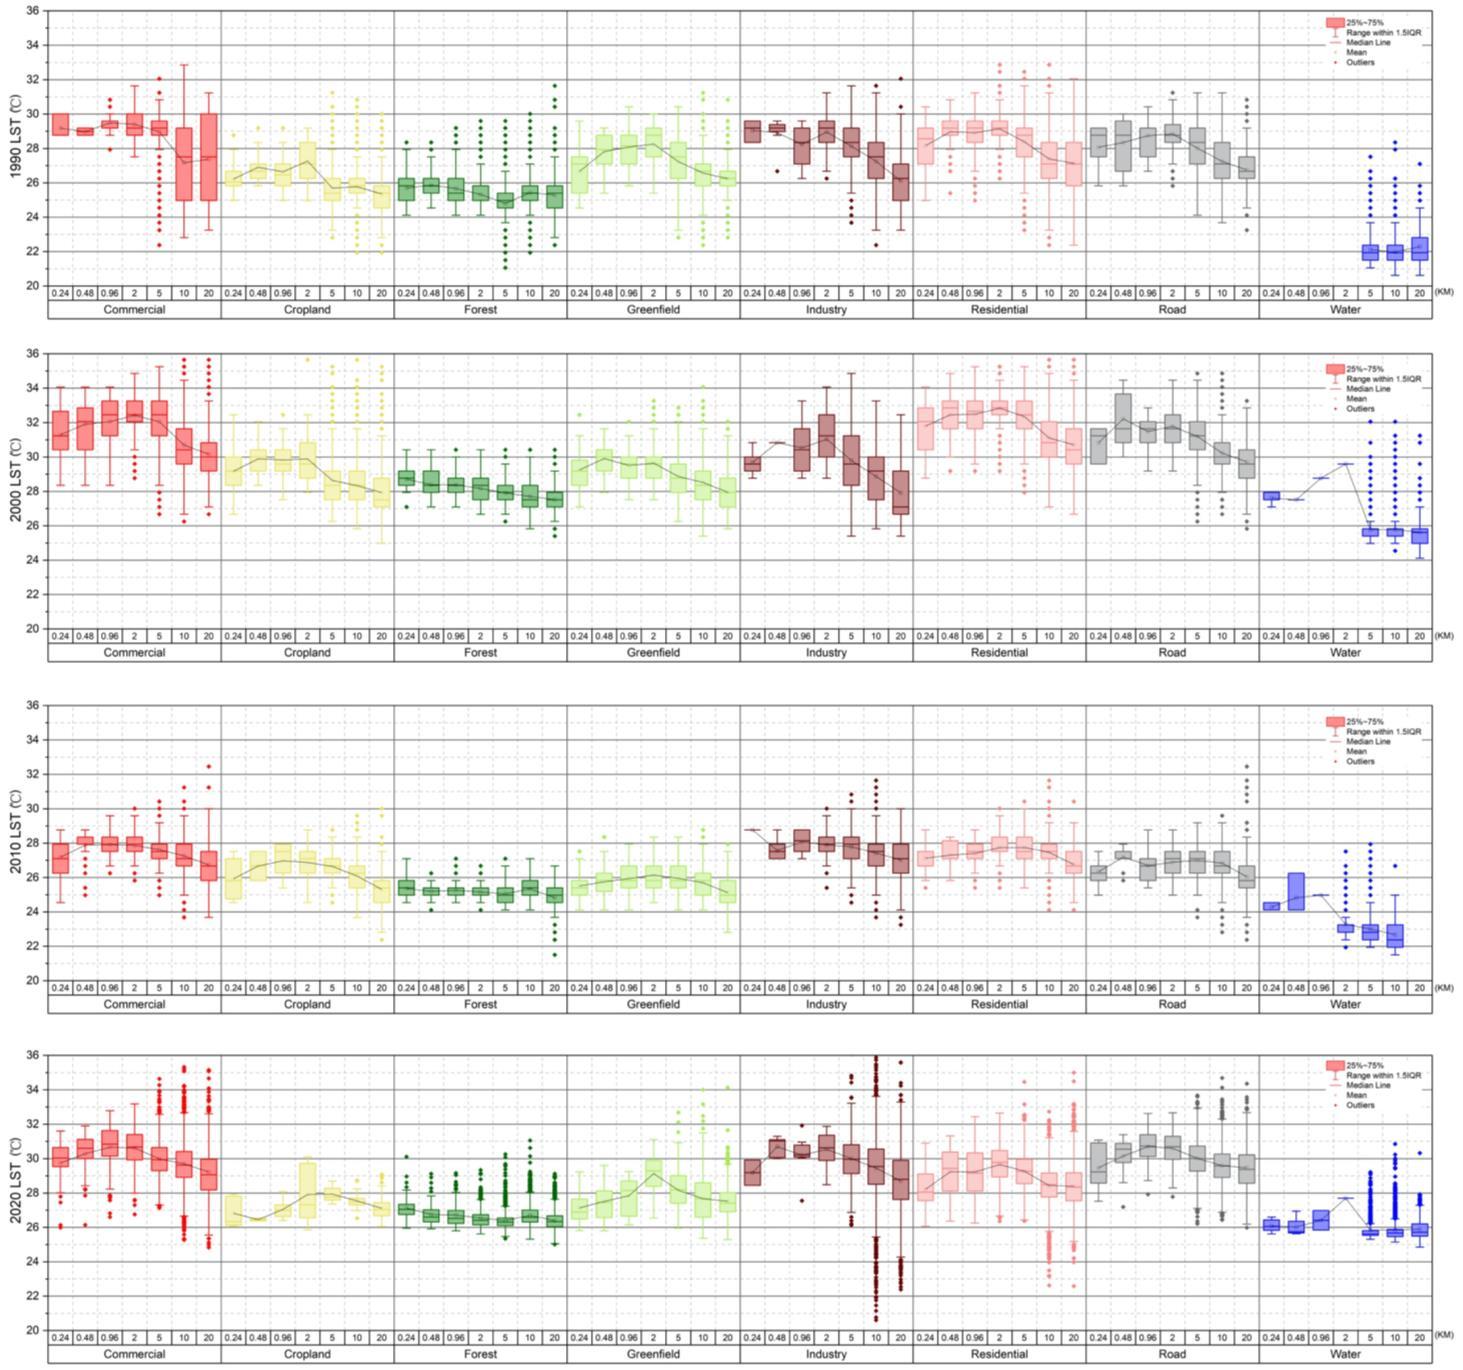
Through the quantitative analysis of multi-seasonal data, the study reveals varying manifestations of UHI and UCI across different seasons. UHI effects are more pronounced in spring and summer, while autumn and winter display a more balanced characteristic between UHI and UCI.
Taking summer as an example, Figure below illustrates the distribution of LST across various Land Use and Land Cover (LULC) types along a distance gradient. The results show that the summer Urban Cool Island (UCI) effect, represented by West Lake's water body, reduces the peak impact range on commercial, residential, industrial, and road are-as from two kilometers to within one kilometer. This reflects the intensified Urban Heat Island (UHI) effect due to urbanization, whic h reduces the influence of cool islands on the urban thermal environment.
• Conclusion and Recommendations
This research links urbanization to higher temperatures, especially in summer and winter, underscoring the cooling role of vegetation and water in cities. It finds that urban heat decreases with distance from water bodies, influenced by their shape. Highlighting the importance of integrating green spaces and water in urban planning, the study suggests these elements are crucial for combating urban warming. It advocates for sustainable urban development that considers land use and seasonal changes to mitigate climate effects.
(a) 1990 sumer LST of Hangzhou Core Urban Area
(b) 2000 sumer LST of Hangzhou Core Urban Area
(c) 2010 sumer LST of Hangzhou Core Urban Area
(d) 2020 sumer LST of Hangzhou Core Urban Area
10. The maximum and minimum sectoral WBSI values are 1.48 (WNW) and 1.25 (SSE), 412 respectively, with mean LST temperature differentials exceeding 1°C. This finding indi- 413
3D ART & DRAWING
• 3D art • Watercolor • Calligraphy


Zhou.Zhiheng
Thanks for reading : )
