
16 minute read
Monitoring & Metering


SOARING GAS PRICES – CAN SMART METERS HELP?
Steep gas prices are front of mind for many energy managers at the moment. Some housing associations, developers and managing agents operating heat networks have mentioned incoming kWh rate increases of up to 292% in recent months.
This level of increase presents a dilemma for energy managers when it comes to setting end-user heat tariffs: is it better to follow the exact pattern of the market, accepting a short period of steep pricing in the hope that things will improve in 2022, or should they spread the upsurge over a longer period, with a risk that customers will be paying over the market rate come 2023-24?
There is no easy answer to this. Analysts are currently predicting that, while prices should drop back down in 2022, it may be mid-2023 before they return to 2021 levels. Whatever energy managers decide, many residents in heat network properties are still going to see an annual increase of about £240 in their heat bills. While comparable to the price rises consumers running traditional gas boilers will experience, this is nonetheless likely to cause real hardship for some.
It might seem counterintuitive, then, to think about investing in smart metering technology as we head into what some are calling an energy crisis. Who wants to load yet more costs onto a scheme right now? However, given that the information smart meters provide is known to stimulate positive behaviour changes that significantly reduce personal energy consumption – and therefore costs and emissions – it’s well worth considering. At a time when housing providers need to be seen to be doing something practical to help, this is a very constructive, measurable, and accountable way of demonstrating care for their residents, while also fulfilling corporate sustainability goals.
Moreover, the positive benefits of energy-consumption data can be further multiplied if it’s provided in an accessible and convenient way. The latest data from our own web-based metering and billing solution for heat networks demonstrates this clearly. Such smart metering technology provides residents with a completely paperless experience, enabling them to view, monitor and manage their energy account from any internet-connected device, at any time, and from any location. Its usage figures tell an interesting story about the difference easy access to energy consumption data makes to people’s heating habits.
Firstly, over a third (35%) of page views on the app are from residents reviewing their energy usage. This is substantially more than any other type of activity such as viewing their balance (24%) or paying a bill (6%), indicating the great interest that people have in monitoring how much energy they’re using when they’re given the opportunity to see it. It appears to have the same appeal as counting steps on a smart watch!
In comparison, residents in creditbilled properties have no real-time view of their consumption data; once a bill arrives a month-and-a-half after the fact, it’s very hard to know what behavioural changes could have made a difference, and by how much. This inevitably results in inertia.
Secondly, we can see that access to real-time usage information often has a clear and dramatic impact on levels of consumption. At a development of 50 residential units in North London, monthly energy usage over four months from July to October 2021 was between 21% and 43% lower than that of a comparable 46-unit South-London site that is credit billed. At another 89-unit property in South London, the difference was even more pronounced; usage was 29% to 55% lower each month compared to a similar 84-unit credit-billed property in Wembley. It’s not hard to see how such sizeable differences in consumption levels can make a real impact on people’s bills when gas prices are as high as they are today.
Another benefit of smart metering technology is that it gives energy managers real-time data about occupancy levels and peak-usage times, as well as alerting them to any potential issues within the network. This can help them to quickly identify and rectify any costly inefficiencies – particularly crucial at a time of spiralling energy costs.
Despite all the savings that smart metering can generate, it can still be hard to justify the cost at a time when everyone is feeling the pinch. However, the good news is that using a web-app can slash the upfront CapEx investment by up to 60% compared to installing In-Home Display devices. Furthermore, with less hardware to maintain, operational and replacement costs (OpEx and RepEx) can be cut by around half as well.
It’s interesting to note that virtually all (99.2%) customers using the web-app choose to pay for their energy online, with the vast majority (77.1%) accessing the webapp via their smartphone. This indicates how much people nowadays tend to prefer online methods of engagement, meaning that providing a digital payment option is essential. However, it’s also important to ensure that alternatives are available for people that don’t have internet access. The COVID pandemic has highlighted the fact that not everyone has use of a smart device and/or WiFi. For those that don’t, many of whom may be vulnerable for various reasons, there can be serious knock-on effects for school, work and homelife. www.insite-energy.co.uk
REPORT TO THE HEAD TEACHER’S STUDY!
It’s all very well to write about what portable energy loggers (PELs) can do and the sort of benefits they might provide but how do things work out in a real application? To answer that question, an 11-day energy monitoring exercise was carried out at a secondary school in Kent. Julian Grant of Chauvin Arnoux discusses the results.
Tight budgets that always seem to be getting tighter are a way of life for almost every organisation and business, but arguably schools have some of the tightest budgets of all. It’s vital, therefore, that they squeeze the maximum possible value out of every pound they spend and, as energy bills make up a significant proportion of that expenditure, it’s clear that energy efficiency is a major concern.
With this in mind, a secondary school with 700 pupils was offered a period of energy monitoring with the objective of identifying areas where efficiency could be improved, and savings could be made. The school governors responded enthusiastically, and arrangements were made to install a Chauvin Arnoux PEL103 portable energy logger at the school’s main incomer.
This innovative instrument uses flexible current transformers and clampon connections, and has a magnetic base for rapid mounting, which meant that it could be installed quickly and

Figure 1: Phase currents over the monitoring period
easily with a minimum of disruption. It was left in place for eleven days, thereby capturing comprehensive data for school days and for weekends.
The results were both interesting and useful. One of the first things noted was that there was a substantial imbalance of phase currents, as can be seen in Figure 1. The peak current on one phase was 219.2 A, compared with 172.8 A on the second phase and 150.3 A on the third. This clearly shows that the loads in the school, most of which are single-phase, are badly distributed across the phases. This is undesirable as imbalance increases the current in the neutral conductor and can result in excessive heating. Current imbalance can also lead to local voltage imbalance at various points in the installation, which may affect the efficient operation of three-phase loads like motors.
Also notable was the high level of harmonics in the supply system. As Figure 2 shows, the third and fifth harmonics were particularly high. Given the growing numbers of ‘electronic’ loads in today’s schools this is not surprising: personal computers, office equipment and LED lighting tend to introduce third harmonics, while uninterruptible power supplies (UPSs) and servers are a common source of fifth harmonics. Nevertheless, the harmonics are potentially problematic as, once again, they can lead to unexpected heating in neutral conductors, and can also cause electronic equipment to malfunction.
By far the most startling revelation from the monitoring results, however, can be seen by referring again to Figure 1. As would be expected, this shows that the peak current is drawn from the supply during the day on weekdays when the school is occupied. However, the results also show that in the evenings and at the weekends, when the school is closed, a current of around 30 A per phase is still being drawn. While some of this probably relates to things like emergency lighting and is therefore unavoidable, the overall figure was unexpectedly high.
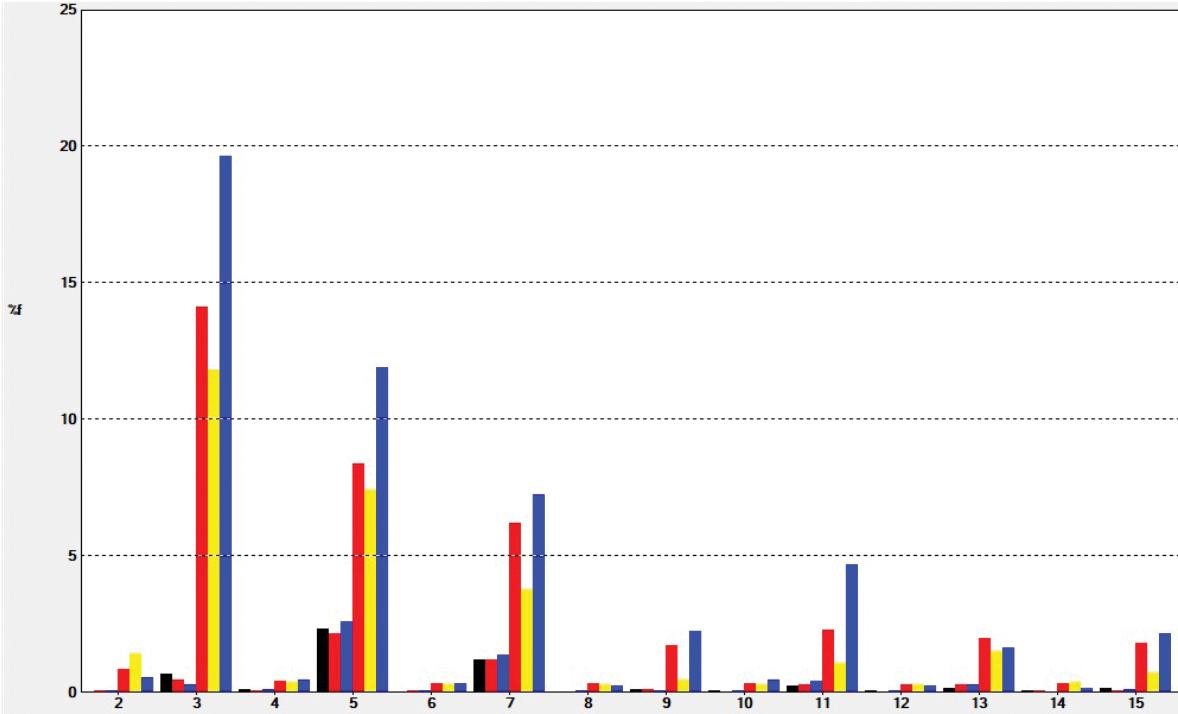
Figure 2 – Harmonic levels
In fact, the school investigated this out-of-hours consumption and found that the portable electric space heaters, which were being used to supplement the poorly performing HVAC system in part of the school, were often being left on during the night and at the weekend. This is a perfect example of a quick energy saving fix at zero cost since all that was necessary was to ask the teachers to be more diligent in switching the heaters off at the end of the day!
One final parameter that was carefully evaluated during the monitoring period was power factor, but this was found to be good at all times, with little opportunity for further improvement. This was probably because the school had few inductive loads, and those few were balanced out by capacitive loads such as LED lighting. In other applications and even in other schools this may not be the case, so careful attention should always be given to the power factor results when a monitoring exercise is carried out.
The power system monitoring exercise at the Kent school clearly identified some issues of concern but unfortunately, shortly after it was completed, the advent of the COVID pandemic meant that the governors and staff were beset by more pressing challenges which prevented immediate action on its results. Nevertheless, the exercise has produced some clear recommendations for the future, which should provide large benefits.
The first – turning off portable heaters out of hours – has already been implemented but this is only an interim solution. Longer term, larger energy savings will be achieved by upgrading the HVAC system so that heaters are not needed at all. There may also be other unnecessary out-of-hours loads, such as lighting and computers left on when not needed, and it would be worthwhile for the school to check on these and, for example, fit automatic lighting controls that respond to room occupancy, and time switches to turn off supplies to computers at the end of the day.
The high level of harmonics should certainly be addressed. It would be beneficial to identify the individual sources and, where necessary, fit filters. The result will be cleaner supplies, reduced cable heating and longer equipment life. Finally, it would definitely be worthwhile to look at redistributing the singlephase loads on the power system to provide better balance between phases. Again, this would reduce heating in neutral conductors, and help to ensure that any three-phase loads on the system operate efficiently.
Monitoring power quality and usage at the Kent school was an exercise which was easy and inexpensive to carry out, and which did not affect the normal operation of the school in any way. It did, however, provide results and insights that will allow the school to use electrical energy more efficiently and to reduce its energy bills. It can be confidently stated, therefore, that the answer to the question posed in the introduction about how useful portable energy loggers are in real applications is that they are very useful indeed! www.chauvin-arnoux.co.uk

www.energymanagermagazine.co.uk
A HELPING HAND FOR LOCAL AUTHORITIES RESPONDING TO THE CLIMATE EMERGENCY
Industry comment by Craig Mellor, Director, Deer Technology Ltd
Local authorities and combined authorities have a key role to play in addressing the global climate emergency. Indeed, it is estimated that 82% of UK emissions are within the scope of influence of LAs. Now the UK Government has published the national Net Zero Strategy and
Heat and Buildings Strategy, there is a better understanding of what is expected of local government – though Westminster has not imposed local Net Zero strategy targets. In many cases, however, LAs have already set their own goals and local Net Zero Strategies. Alongside the challenges facing LAs, there are also opportunities, most notably in the form of grant funding. For example:
• Public Sector Decarbonisation Scheme
Phase 3 – £1.425 billion over the period 2022/2023 to 2024/2025 to support heat decarbonisation and energy efficiency measures in public sector buildings.
• Social Housing
Decarbonisation Fund – £800m for energy-efficiency improvements to social housing. Considerable investments are expected to be made in replacing gas-fired boilers with air-source heat pumps (ASHPs) powered by (hopefully) sustainably generated electricity. These retrofits to the existing housing stock will improve energy efficiency, contribute to decarbonisation and, of course, help steer the UK towards its target of achieving Net Zero by 2050. An additional benefit of energyefficient ASHPs for social housing is that they help to alleviate the problem of fuel poverty. Although household electricity bills will increase due to consumption by the ASHP, these households will no longer be using gas-fired heating and should pay less overall for their energy.
In a similar vein, millions of pounds of funding will help to accelerate the adoption of electric vehicles. If EV charging points are installed for social housing properties, electricity bills will increase again, even though the household’s expenditure on petrol or diesel will either fall or be eliminated.

Despite the net savings, householders with newly-installed ASHPs and EV charging points are likely to be concerned at the rise in electricity bills. One way to help quell concern is with better meter reading and improved visibility of consumption data. More on this later.
From a local authority’s point of view, there are many possible approaches to decarbonisation and improving energy efficiency, a few examples of which are: switch to sustainable sources of energy; use energy more efficiently; cut waste; and do things differently so as to use less energy. Whatever changes are made, it is important to have accurate measurements of consumption before and after, otherwise the true scale of the benefits will never be known.
Let us consider, for example, electricity consumption in a small block of flats. Each household will have its own electricity meter, plus there will be a meter for electricity consumption in communal areas – such as lighting for the exterior, hall and corridors, and lifts if the building has them. When a housing association can see patterns of consumption, households that use more energy can be identified so they can be helped to reduce consumption. If one household’s consumption is particularly high or low, it could be an indication of energy theft. Were the housing association to upgrade all communal lighting from incandescent and fluorescent lamps to LED lamps, the ‘before and after’ data could help inform decisions about how quickly other properties should be retrofitted with LED lighting.
Looking beyond the social housing example above, local authorities need to improve energy efficiency and decarbonise their entire estates. These might include town halls, offices, sports and leisure facilities, entertainment centres, schools, libraries, commercial premises, and museums and galleries. The size of the challenge is formidable but the potential benefits are substantial.
Earlier we hinted at the importance of metering and the visibility of consumption data, for which remote meter reading has much to offer. But there is another benefit of up-grading meters for remote reading: reduced carbon emission associated with meter readings. With conventional meters, somebody needs to travel in a van to the meter’s location and back again. Despite multiple meters being read during the course of each trip, the carbon dioxide emissions per meter add up over time. We have calculated that if 100 meters are read per week, the greenhouse gas emission associated with the van over a period of five years could amount to 31.2 tonnes of CO2e (carbon dioxide equivalent). COST-EFFECTIVE DECARBONISATION
It has to be said that smart metering has not lived up to expectations. The roll-out has been slow, compatibility issues have persisted, and poor signal coverage means some smart meters only operate as dumb meters.
Fortunately, Deer Technology’s LimpetReader offers a cost-effective and environmentally-friendly alternative. This clever, battery-powered optoelectronic device is attached to an existing analogue meter’s faceplate with optical tape or adhesive. Installation only takes around 10 minutes because there is no need to dismantle the meter or interrupt the supply. The meter’s register remains visible should a visual read be necessary, and dual-register meters have one LimpetReader for each register.
If a LimpetReader is removed or tampered with, this can be identified via the data out-put, which helps to detect and deter energy theft.
Carbon dioxide emissions associated with meter readings are eliminated because vans never need to be used for meter readings. The patented LimpetReader is unique among automated reading systems in that readings are classified as ‘visual’ for regulatory purposes.
Each ultra-compact LimpetReader device incorporates multiple microcameras for imaging the register. The images are date- and timestamped before being transmitted to Deer Technology’s secure server.
Images are sent to the server via the mobile phone network using proven GSM technology. Up to 16 LimpetReader devices can be linked to a single AutoReader transmitter, which is ideal for housing associations with multiple tenants in a single building.
Once the individual images have been uploaded to the server, they are stitched together to create a highquality, distortion-free image of the meter’s register. Software then converts the register image to a numerical value, which is stored with the image. Data and images can be accessed by the customer in a variety of ways, depending on the requirements. Deer Technology’s comprehensive service covers everything from installation through to data management.
We estimate that Local authorities in Great Britain have more than a million analogue electricity meters that could be converted to smart meters using LimpetReader devices, greatly assisting decarbonisation. Already LimpetReaders are being used very effectively in numerous applications in social housing, sports and leisure facilities, offices and commercial premises throughout the UK.
So far we have discussed electricity metering but LimpetReaders are equally applicable to water metering. Water consumption has a carbon footprint – think of the energy required for processing and pumping fresh water and waste water. Monitoring water consumption is a powerful way to identify leaks so they can repaired quickly and wastage minimised.
Furthermore, leaking hot water taps will result in additional carbon dioxide emissions due to the energy required to heat the wasted water. We have calculated that a hot water tap left running for a year would cost around £10,600 and result in 25.2 tonnes of CO2e emissions. Again, it is thought local authority estates have millions of potential applications for retrofitting LimpetReader devices to water meters.
Find out more about Deer Technology’s LimpetReader for remote meter reading at https://deertechnology.com, telephone 01639 363146 or email hello@deertechnology.com


