SETTING THE COURSE TO LOW CARBON SHIPPING

ZERO CARBON OUTLOOK

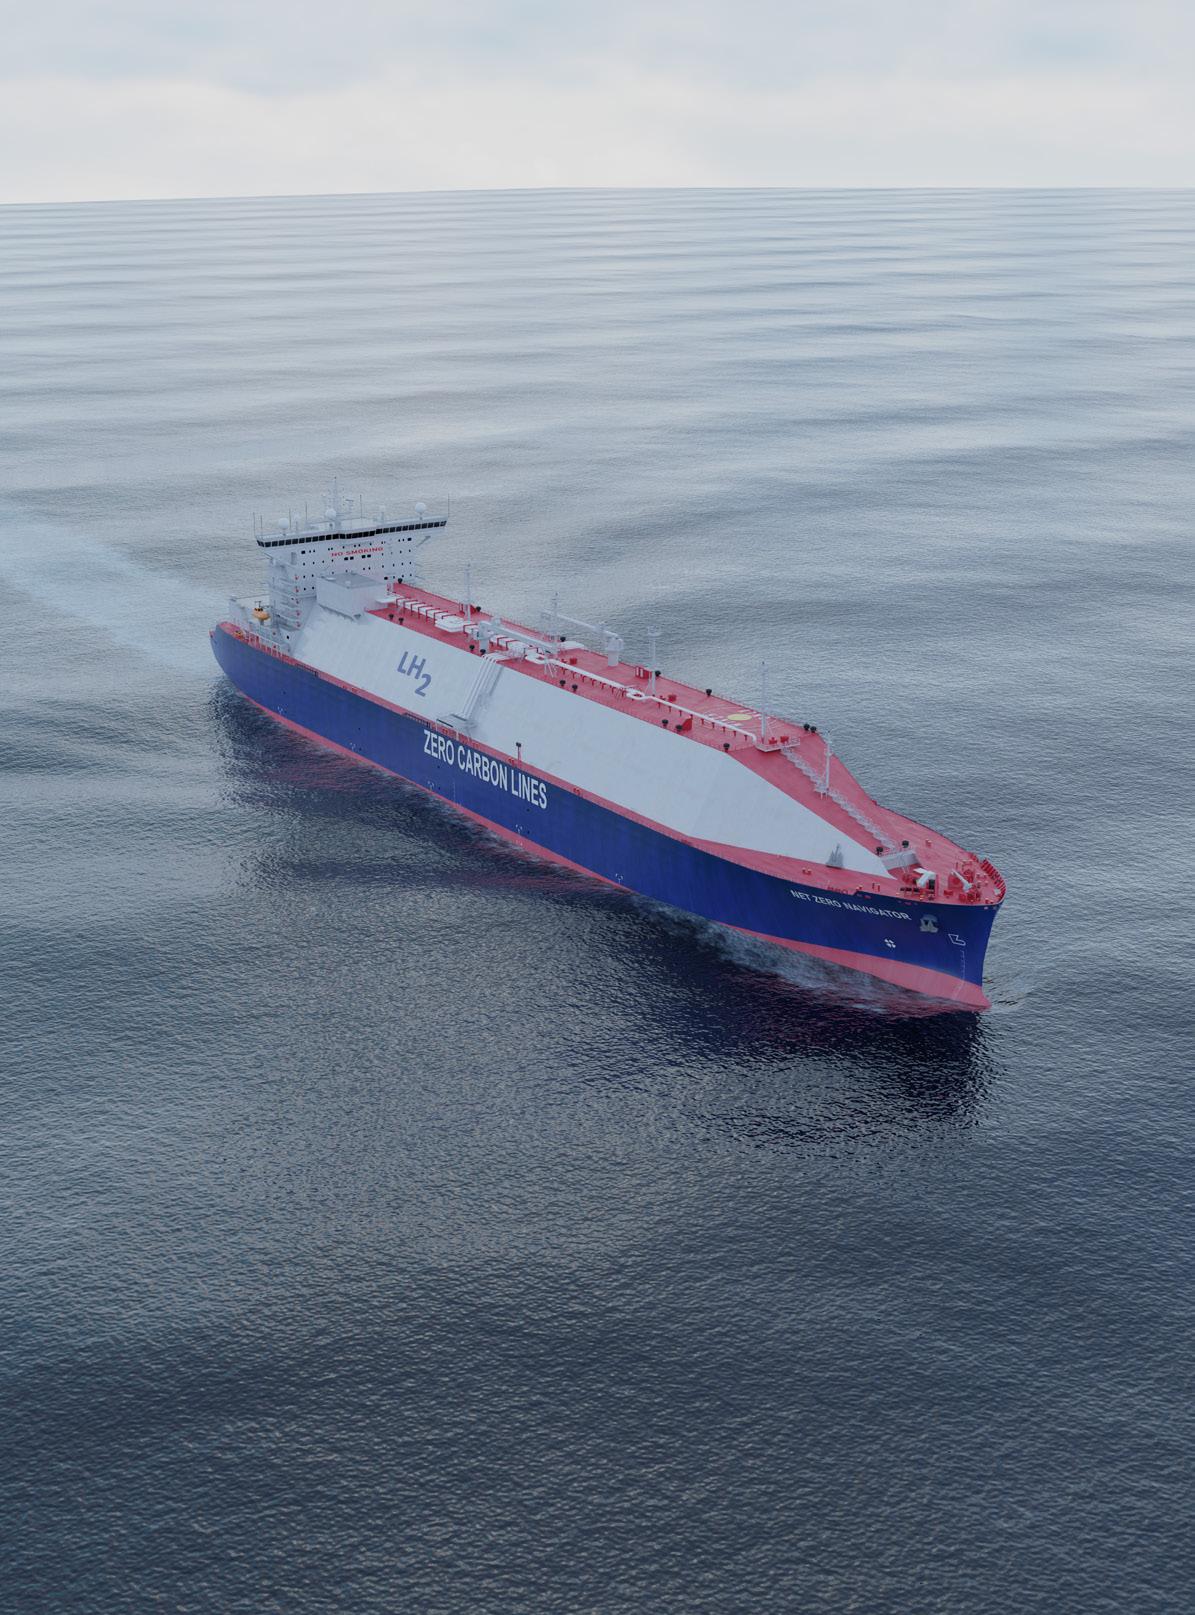
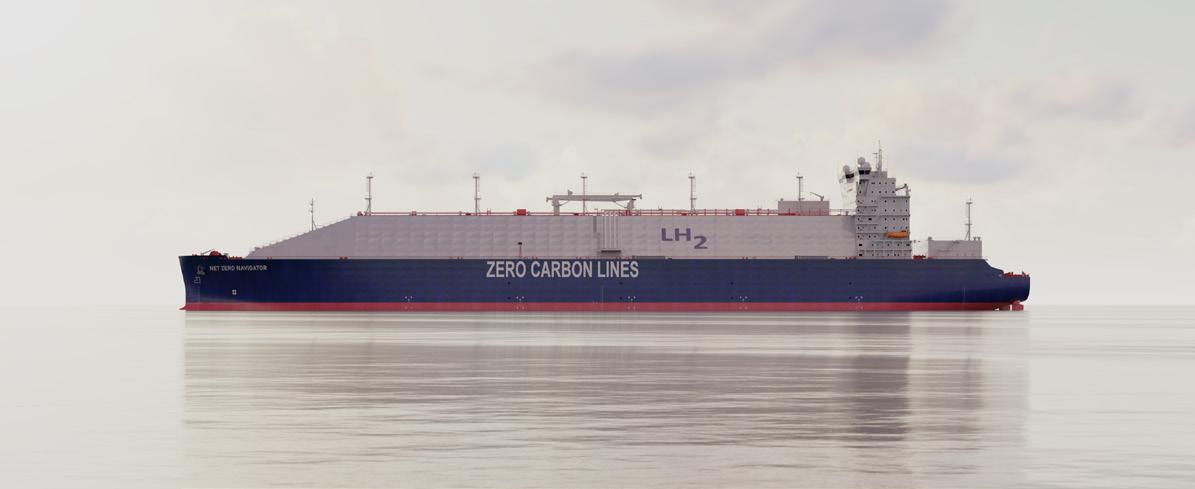
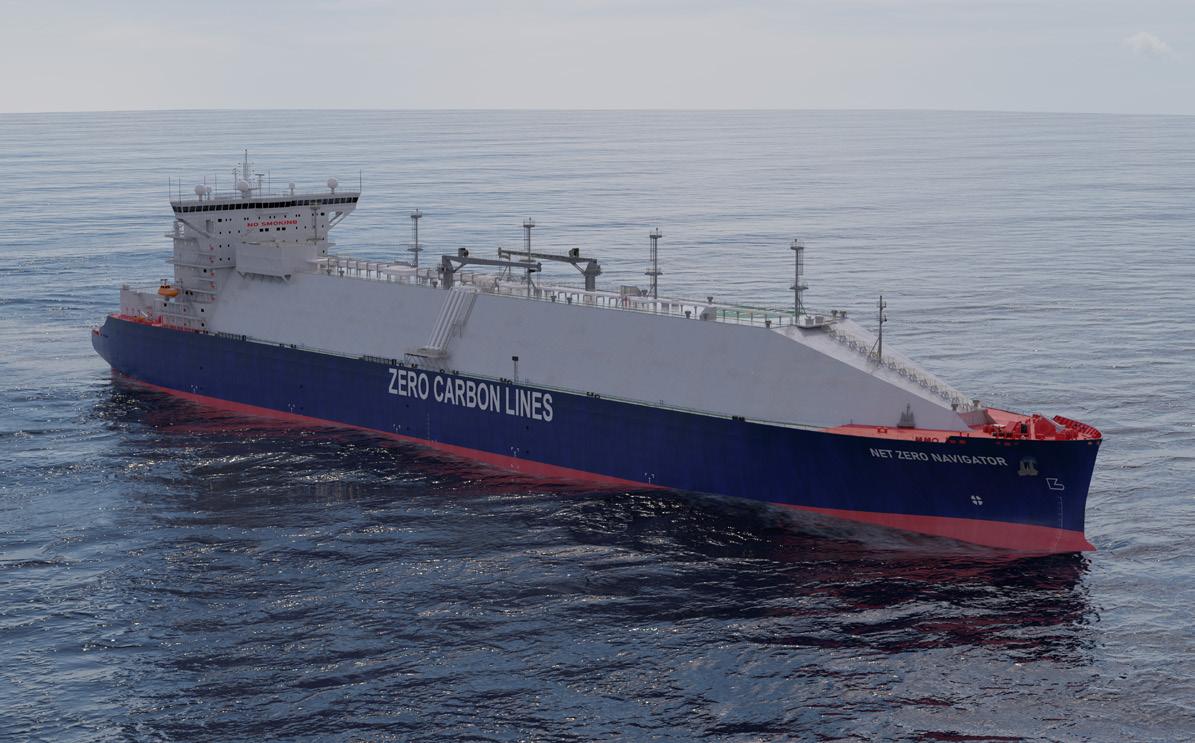
The vessel is a conceptual design of a liquid hydrogen carrier, approximately 80,000 cubic meters (m3) in capacity. Hydrogen is billed as one of the potential future fuels for eliminating greenhouse gas (GHG) emissions from shipping because it either burns without emitting anything other than water vapor, or can be used in hydrogen fuel cells to generate electricity directly.
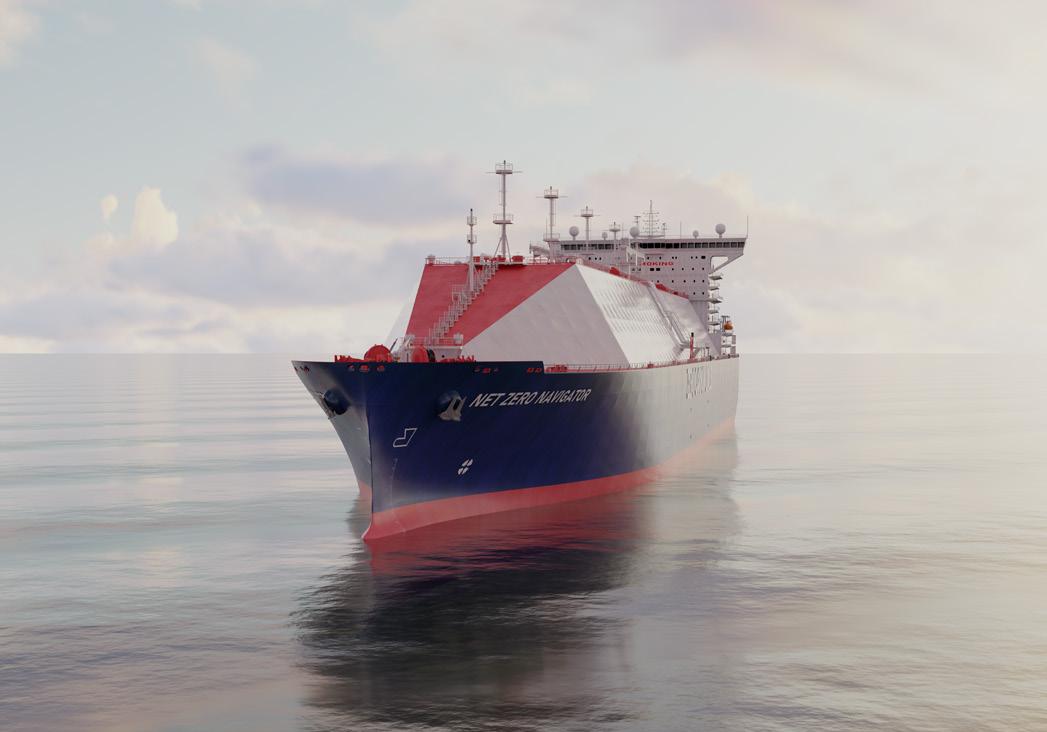
The Net Zero Navigator was heavily inspired by the National Aeronautics and Space Administration (NASA) and space-age technologies involving hydrogen. Its large spherical hydrogen storage tanks were developed by NASA, along with its hydrogen fuel cells and batteries, which were used for power generation on the space shuttle.
This vessel requires special spherical tanks because hydrogen gas is notoriously difficult to store safely at significant quantities. The typical solution is to store the hydrogen in a liquid form at -253° C. These temperatures are achieved with a complicated refrigeration system and highly sophisticated insulation, which is why the design features such prominent metal sheathing.
This publication was prepared by a group of contributors including: Georgios Plevrakis, Panos Koutsourakis, Stergios Stamopoulos, Jatin Sarvaiya, Ilias Soultanias, Shankar Vaidhyanathan, Nathan Seward, Tao Shen, Anna Zhu, Revekka Koliniati, Andreas Kalamidas, Daniel Barcarolo, Ioannis Dimakopoulos, Ai-Nian Zhang, Hamid Daiyan, Aditya Bose, Sarah Bell, Lindsay Bass, Shannon Crisafulli, and Jesse Lashbrook, in collaboration with Maritime Strategies International and Herbert Engineering.
INTRODUCTION . . . . . . . . . . . . . . . . . . . . . . . . . . . . . . . . . . . . . . . . . . . . . . . . . . . . . . . . . 1
CURRENT MARKET OUTLOOK . . . . . . . . . . . . . . . . . . . . . . . . . . . . . . . . . . . . . . . . . . . . 3
2 .1
2 .2
CURRENT STATE OF THE MARKET . . . . . . . . . . . . . . . . . . . . . . . . . . . . . . . . . . . . . . . . . . . . . . . . . . .3
ZERO-CARBON FUTURE OF THE GLOBAL SHIPPING INDUSTRY . . . . . . . . . . . . . . . . . . . . . . . . . 13
2 3 ADDRESSING FUTURE CLIMATE RISKS 15
OVERVIEW OF TWO EMERGING VALUE CHAINS: HYDROGEN AND CARBON . . . . . 18
3 .1 EXPLORING THE HYDROGEN VALUE CHAIN AND HYDROGEN-BASED FUELS . . . . . . . . . . . . . 19
3 .2
NET-ZERO APPROACH FOR HYDROGEN IN SHIPPING . . . . . . . . . . . . . . . . . . . . . . . . . . . . . . . . 28
3 .3 ROLE OF CARBON CAPTURE AND STORAGE . . . . . . . . . . . . . . . . . . . . . . . . . . . . . . . . . . . . . . . . 34
3 .4 ROLE OF DROP-IN TRANSITION FUELS . . . . . . . . . . . . . . . . . . . . . . . . . . . . . . . . . . . . . . . . . . . . 43
3 .5 THE ROLE OF ENERGY STORAGE . . . . . . . . . . . . . . . . . . . . . . . . . . . . . . . . . . . . . . . . . . . . . . . . . 47
CARBON MARKETS AND PRICING MECHANISMS . . . . . . . . . . . . . . . . . . . . . . . . . . . 55
4 .1 GLOBAL CARBON PRICING . . . . . . . . . . . . . . . . . . . . . . . . . . . . . . . . . . . . . . . . . . . . . . . . . . . . . . . 55
4 .2 TAXING CARBON AND SUBSIDIZING ALTERNATIVE ENERGY SOLUTIONS . . . . . . . . . . . . . . . 56
4 .3
4 .4
ANATOMY OF EMISSIONS TRADING SYSTEMS . . . . . . . . . . . . . . . . . . . . . . . . . . . . . . . . . . . . . . . 59
PROMOTING COOPERATION AND BREAKING IMPASSE . . . . . . . . . . . . . . . . . . . . . . . . . . . . . . . 65
4 5 DECARBONIZING THE MARINE AND OFFSHORE INDUSTRIES THROUGH CARBON PRICING . . . . . . . . . . . . . . . . . . . . . . . . . . . . . . . . . . . . . . . . . . . . . . . . . . . . . . . . . . . . . . . 66
4 .6
THE ROLE OF CARBON OFFSETS IN ACHIEVING NET-ZERO EMISSIONS . . . . . . . . . . . . . . . . . . 71
SCALING ALTERNATIVE ENERGIES AND DRIVING MOMENTUM . . . . . . . . . . . . . . . 76
5 1
5 .2
ALTERNATIVE ENERGIES: SCALING UP THE VALUE CHAIN 76
NEW BUNKERING INFRASTRUCTURE TO SUPPORT THE MOMENTUM . . . . . . . . . . . . . . . . . . . 77
5 .3 THE ROLE OF SUSTAINABLE FINANCE INSTRUMENTS . . . . . . . . . . . . . . . . . . . . . . . . . . . . . . . . 80
5 .4
VALUE-CHAIN ENABLERS . . . . . . . . . . . . . . . . . . . . . . . . . . . . . . . . . . . . . . . . . . . . . . . . . . . . . . . . 84
5 .5 UPDATE OF FUTURE FUEL MIX . . . . . . . . . . . . . . . . . . . . . . . . . . . . . . . . . . . . . . . . . . . . . . . . . . . . 103
. . . . . . . . . . . . . . . . . . . . . . . . . . . . . . . . . . . . . . . . . . . . . . . . . . . . . . . . . . . . . 112
. . . . . . . . . . . . . . . . . . . . . . . . . . . . . . . . . . . . . . . . . . . . . . . . . . . . . . . . 115
. . . . . . . . . . . . . . . . . . . . . . . . . . . . . . . . . . . . . . . . . . . . . . . . . . . . . . . . . . . 117
WHILE ABS USES REASONABLE EFFORTS TO ACCURATELY DESCRIBE AND UPDATE THE INFORMATION IN THIS PUBLICATION, ABS MAKES NO WARRANTIES OR REPRESENTATIONS AS TO ITS ACCURACY, CURRENCY OR COMPLETENESS. ABS ASSUMES NO LIABILITY OR RESPONSIBILITY FOR ANY ERRORS OR OMISSIONS IN THE CONTENT OF THIS PUBLICATION. TO THE EXTENT PERMITTED BY APPLICABLE LAW, EVERYTHING IN THIS PUBLICATION IS PROVIDED WITHOUT WARRANTY OF ANY KIND, EITHER EXPRESS OR IMPLIED, INCLUDING, BUT NOT LIMITED TO, THE IMPLIED WARRANTIES OF MERCHANTABILITY, FITNESS FOR A PARTICULAR PURPOSE, OR NON-INFRINGEMENT. IN NO EVENT WILL ABS BE LIABLE FOR ANY DAMAGES WHATSOEVER, INCLUDING SPECIAL, INDIRECT, CONSEQUENTIAL OR INCIDENTAL DAMAGES OR DAMAGES FOR LOSS OF PROFITS, REVENUE, OR USE, WHETHER BROUGHT IN CONTRACT OR TORT, ARISING OUT OF OR CONNECTED WITH THIS PUBLICATION OR THE USE OR RELIANCE UPON ANY OF THE CONTENT OR ANY INFORMATION CONTAINED HEREIN.
The urgency of finding solutions to the climate change problem is growing as a top priority for both domestic and international policymakers. Around a quarter of the world's greenhouse gas (GHG) emissions are linked to international trade, according to the most recent estimates [1]. As the lifeblood of global trade, the shipping sector faces significant challenges in decarbonizing due to its diversity, which ranges from ferries to massive tankers, as well as the fact that clean fuels such as green hydrogen, ammonia and methanol are not yet available at scale.
Policymakers are considering ways to encourage the shipping industry to use low-carbon modes of transportation. A specific reference to shipping was not included in the Paris Agreement, and some observers believe this omission can be explained by the fact that countries are cooperating with the International Maritime Organization (IMO), which is a specialized agency of the United Nations (U.N.), to reduce the emissions associated with international shipping. Individual countries may include targets for shipping in their national mitigation plans, and they may be able to act more promptly than the IMO. For example, in a new climate plan, the European Union (EU) proposes that the scope of its Emissions Trading System (ETS) be expanded to include carbon dioxide (CO2) emissions from ships, which would be the first time this has been done. In a similar vein, Japan has informed the IMO that it would support a carbon tax that would raise more than $50 billion (B) per year [2], marking a significant step forward by the world's second-largest shipowner nation in addressing emissions from maritime transport. The inclusion of this provision would impose a price on emissions from shipping.
As we evaluate what impact all this may have on our industry, it is helpful to consider how we arrived at this point. Over recent years, ABS, being close to the developments, has reported on the challenges that lie ahead, as GHG reduction targets are set and pathways are considered to meet these targets. In that context, we have explored the boundaries of existing technologies and discussed emerging future solutions identifying the barriers or obstacles that need to be overcome in order for them to present a safe, practical and feasible solution.
As we shifted from 2021 into 2022, we acknowledge that over the last four years our industry has achieved a higher maturity level with regards to the knowledge and awareness of the decarbonization challenge. We started with attempting to define the riddle of decarbonization as we unraveled the technical and operational challenges that were assumed with the introduction of the 2030 and 2050 carbon intensity reduction targets. Regulations that are meant to drive the transition towards those targets have started taking shape and form.
That allowed us to benchmark vessels and fleets in a more precise manner and to explore, with higher fidelity, technological improvement options and fuel pathways that can potentially lead to carbon neutrality. This higher fidelity allowed us to identify policy and regulatory gaps that have to be implemented beyond the maritime industry in order to support shipping on its journey to lower carbon intensity. We were then able to understand that the energy transition requires a robust value chain and we started investigating how energy carriers or fuels should be produced and more importantly what methods we should put in place in order to address carbon neutrality by implementing a life-cycle approach.
At every step of the way, through collaborative research and joint efforts we are exploring the boundaries of what is currently feasible and highlighting areas where more emphasis should be given in order to have safe and sustainable solutions for our decarbonization targets. We examined new energy efficiency technologies (EETs), advancing digitalization in order to increase operational efficiency and ultimately the implementation of new fuels and energy carriers. And through the prism of trade changes due to climate changes and the effect on global routes and associated emissions, we attempted to look ahead into the long-term and estimate the energy mix of the future based on certain scenarios.
Looking ahead through 2022 and beyond it is clear, shipping will likely require value chain adaptations and policies in support of its decarbonization journey, as we identified in the previous editions. In order to achieve net-zero emissions across the value chain by 2050, the energy system will need to be transformed using a wide range of technologies. Energy efficiency, behavioral change, electrification, renewables, hydrogen and hydrogen-based fuels, and carbon capture, utilization and storage (CCUS) are the key pillars of decarbonizing the global maritime energy system.
Hydrogen is a versatile energy carrier, the fundamental building block that is used to produce other energy carriers and supports the transition. A zero-carbon or carbon-neutral value chain will require hydrogen positive energy tokens to be produced utilizing renewable energy sources or nuclear energy. The value chain will also require storage of the hydrogen energy, transportation and possible conversion into other forms and finally distribution and energy conversion through consumption. Although hydrogen can be produced from almost any energy source, the majority of hydrogen used today in oil refining and chemical production comes from fossil fuels, with significant CO2 emissions.
To help address this, an essential component of global efforts to achieve net zero will be CCUS. Since a wide range of technologies will likely transform the way we produce and consume energy, CCUS will need to play a significant role alongside electrification, hydrogen and sustainable bioenergy. In order to achieve net-zero goals, CCUS reduces emissions in key sectors and removes CO2 to balance emissions that cannot be avoided.
Hydrogen fosters cross-value chain collaboration by bringing different stakeholders together which will also help the maritime sector achieve net-zero goals. The associated regulatory pathways will evolve alongside as it influences ship design, technology and operations.
In recognition of this goal, ABS is exploring the two energy transition value chains in this fourth in the series of Setting the Course to Low Carbon Shipping publications.
This publication examines how the maritime sector will be impacted based on the latest trends and developments out of the IMO, technology readiness of low carbon and alternative fuels and the hydrogen and carbon value chain accelerators. It also examines the possible capacity demand and related emissions output trends on a global basis to envision the environments in which targets may be achieved through the prism of those value chains.
Furthermore, we examine how shipping becomes a significant value chain enabler as it supports the transportation of energy and explores technologies that leverage these new energy sources. We once again attempt to explore the boundaries of applicability by looking into conceptual designs of liquefied hydrogen and liquefied CO2 carries and how that could support the value chains. We also evaluate the challenges and considerations of capturing carbon on board.
Examining the technical aspects that were referenced above forms the foundations of a decarbonization strategy. In this document, we are overlaying an extra dimension which includes the view of the value chains. As we examine carbon economics and how the price of carbon presents an extra variable in the decarbonization narrative.
This publication is offered solely to help industry stakeholders make informed decisions and to assist in comprehending the complexity of the task-at-hand and moving forward effectively as they evaluate their options for a transition to low-carbon operations and subsequently a zero-carbon future for shipping.
The shipping industry is currently in an ongoing transition towards decarbonization. Many market actors are accentuating their focus on modern and greener ship designs, operations, alternative fuels, energy efficiency and carbon capture technologies. Green financing, environmental, social and governance (ESG) reporting and European Union (EU) taxonomy are just a few examples of mechanisms that were previously downplayed by the industry and have now become increasingly widespread. Furthermore, there is an increased demand for green or carbonneutral freight, with many companies calling for full neutrality by 2040. As a result, shipowners are engaging more actively with partners in their commercial eco-system (shipyards, designers, original equipment manufacturers, etc.) to ensure that vessels incorporate design elements that facilitate the conversion from fossil-based to zero-carbon marine fuels. For instance, the first ammonia-fuel ready vessel in the world, the ABS-classed suezmax tanker Kriti Future, is currently conventionally fueled. Complying with the ABS Ammonia Ready Level 1 requirements indicates that the vessel is designed to be converted to ammonia fuel in the future [3].
Primarily driven by global decarbonization goals and requirements, accelerated technological change will be crucial for enabling the low-carbon energy transition, and alternative fuels are now viewed as a critical area of long-term technological development in maritime transportation. Although a number of determinants influence the intention to accept, diffuse and use alternative fuels and energies for marine propulsion, an intersection of energy security and energy transition exists, and this will work as a catalyst to drive the required transition.
Singapore 564 824 729 1,283 Singapore 621 1,034 921 2,002 Rotterdam 516 817 681 1,402 Rotterdam 641 1,126 861 3,235 Fujairah 526 871 735 1,212 Fujairah 634 1,131 971 1,919 Houston 554 915 716 480 Houston 671 1,101 858 544
Table 1: The rise in bunker-fuel costs at the beginning of the Ukraine crisis (Source: Affinity Bunker Fuel Prices).
On the regulatory front, the International Maritime Organization’s (IMO’s) Energy Efficiency Existing Ship Index (EEXI) and Carbon Intensity Indicator (CII) will come into force in January 2023. With regards to EEXI this means that ships will have to comply with requirements on their Annual, Intermediate or Renewal Survey (whichever comes first) on that year. At the closure of 2021, the IMO began discussions to revise its 2018 initial greenhouse gas (GHG) strategy for 2050 as a response to the calls from some member States and associations for aligning with netzero goals and the Paris Agreement. Currently, there are calls for net-zero emissions from shipping by 2050 and increased pressure for an acceleration on the market-based measures (MBMs) including a life-cycle approach for maritime fuels. With 2021 United Nations (U.N.) Climate Change Conference of the Parties (COP26) putting emphasis on the GHG emissions from shipping, one could expect an IMO drive towards more ambitious goals; other regional regulations are about to begin putting a price on the carbon emitted (the EU’s Emissions Trading System [ETS]) and the upstream emissions from the fuels used by shipping (FuelEU Maritime).
In the short term, the next significant regulatory impact on shipping can be expected from IMO’s EEXI requirements. The expectation is that virtually all ships will become compliant with EEXI by relying mostly on implementing measures such as limits to engine and shaft power. However, the present expectation is that the power limitations from EEXI will not affect average sailing speeds , this suggests that EEXI alone will not drive vessels to lower sailing speeds. Consequently, one could expect that the current levels of carbon dioxide (CO2) emissions from ships should not be diminished solely by EEXI.
However, with power limitations in place, vessels will have less flexibility to reach the demand of higher speeds being driven by increases in freight rates, which has been one of the influencing factors during the COVID-19 pandemic.
MARCH 7, 2022 HFO 380 LSMGO VLSFO LNG HFO 380 LSMGO VLSFO LNGFrom 2023, the market will face a new dynamic that combines those power limitations with the added operational impact of the CII. While the full extent of the EEXI’s impact remains to be seen, it is likely to be overshadowed by the entry into force of the CII.
Nevertheless, owners have the EEXI and the CII clearly in their sights and this is driving current demand for retrofits that can improve a vessel’s hydrodynamic efficiency, operating profile and options for using alternative fuels, etc. The continuous pressure for energy efficiency and operational improvement to align with CII and the decarbonization trajectory of IMO’s GHG strategy will lead owners to adopt more ambitious technologies in the long term. In the short term, the focus remains on the adoption of more conventional energy efficiency technologies (EETs) like low friction hull coatings, pre and post swirl devices, wake equalizing ducts and higher efficiency propellers, which are being scheduled during upcoming docking opportunities. The stricter mid-term requirements around 2026 will eventually lead owners to consider more aggressive technologies that could deliver higher power savings in the next docking cycles, like air hull lubrication, wind-assisted propulsion and waste heat recovery systems.
The below graphs provide an overview of the current level of adoption of EETs.
2022
Data source: ABS, IHS Markit, Clarksons April 2022
Figure 1: Number of energy-saving devices that can fit to a ship.
Staying on the topic of EETs, many wind propulsion projects are underway, and to this date a total of 18 vessels are known to be fitted with a type of wind propulsion system. The vessels fitted with wind propulsion installations can be categorized in two ways:
• Wind-assisted vessels: In these cases, the wind is considered as being an assistance to the main power generation. Typically, the power delivered by these systems varies from five percent to 20 percent of the total power needs of the vessel. These cases are mostly retrofit cases where sails are fitted on deck without other major modifications to the rest of the hull.
• Wind-propelled vessels: In these cases, the wind delivers a more substantial portion of the total power, typically ranging from 15 percent to 40 percent and to higher values. In these cases, the hull and other systems (rudder, control systems, engine, etc.) are either retrofitted or designed to account for the presence of the wind.
The level of power contribution delivered by the wind depends on many design factors, such as the type of technology, size and type of the vessel and the wind sails system, etc. However, once a vessel is fitted with such a technology, the extent of the fuel savings that one can expect would be dictated by the wind conditions it encounters and by vessel speed itself. Therefore, harvesting the wind via a weather-routing or other type of technology becomes an important factor to maximize the savings delivered by such a system.
Wind propulsion may be a key enabler for the quicker development of alternative fuels in shipping as well. During the uptake of alternative fuels, these fuels are expected to have higher prices and lower availability than the traditional and conventional fuels. As wind propulsion would allow a power saving varying from five percent to 30 percent or higher, a wider adoption of wind propulsion would not only allow for a reduction of emissions (as the fuel consumption is lower) but intrinsically allow for potentially a lower demand for alternative fuels. Therefore, wind propulsion can be seen as an enabler of alternative fuels uptake in the maritime industry.
In the Marine Environmental Protection Committee (MEPC) 77, wind propulsion received a regulatory push from the IMO where the MEPC 1. Circ. 896 was approved by the plenary. This was an updated of a previous circular (MEPC 1. Circ. 815), and the major changes were:
• A better definition on how the force matrix can be calculated: usage of wind tunnel tests, computational fluid dynamics (CFD), and other means to derive the forces and methodology by which the wind profile is taken into account, etc.
• The effective power calculation has changed to account only for the 50 percent higher wind forces delivered by the system. In such a way, the final effective power that goes into the Energy Efficiency Design Index (EEDI) and EEXI calculation is higher than in the previous version. The IMO’s intention with such an amendment is to further incentivize the uptake of wind propulsion.
In addition to EEXI, wind propulsion plays a key role in the CII compliance. The calculation methodology for the EEXI relies on a wind probability matrix which was derived from fixed world shipping routes and is based on a design point. Compared to the EEXI, the reduction in the CII rating for vessels fitted with wind propulsion could be higher as they would benefit from the actual operation of vessels. Therefore, when investing in wind propulsion, it is important to consider both EEXI and CII.
In addition to IMO regulations, regulations are taking shape regionally such as the Fit for 55 package of which the FuelEU for Maritime is part. For this mechanism, in the current form of the draft text, a progressive reward factor is included that would allow shipowners to reduce the final achieved GHG intensity of the fuel mix used by the vessel (GHG Intensity Index) by a given percentage depending on the level of power delivered by the wind. However, there are proposals on the table seeking to include the actual power delivered by the wind as an additional energy source, similar to energy consumption from shore power. In this way, such energy from wind would be seen as a carbonneutral source of energy, hence further lowering the GHG Intensity Index.
In conclusion, wind propulsion is a technology that is increasingly playing a larger role in maritime decarbonization and has the potential to support the transition of the industry from conventional to carbon-free fuels.
The IMO has provided the industry with enough information to gauge the potential impact of the CII until 2026. This level of visibility allowed a recent ABS study to estimate that, if trading remained at 2019 levels, a fairly high percentage of the current fleet would need to undergo either design and/or operational changes to improve their carbon intensity and reach compliance. These levels are shown in the figure to the right where it is possible to observe that up from 43 percent to 71 percent, depending on the ship type, would fall under categories D or E of the CII mechanism by 2026. To avoid such ratings, these vessels would need to undergo improvements to improve their carbon intensity. As a consequence, the CII mechanism is already creating an increased awareness for both energy and operational excellency, where owners are evaluating retrofits, improved maintenance, operational changes, etc.
The rates of carbon reduction required beyond 2026 have not been set; they will depend on finalization of the IMO’s ambition levels and the effectiveness of the EEXI and CII regulations in the interim. However, it can be expected that there will be increased pressure from member States and the industry for higher reduction rates.
Figure 2: Estimated percentage of vessels that will fall in categories D and E by 2026 based on EU MRV data for 2019 from ABS, IHS Markit and Clarkson. *Ro/ro cargo ships, ro/ro vehicle carriers and ro/pax are grouped together.
On the one hand, pressure for more carbon-reducing ambition is coming from international bodies (such as those involved in COP26 discussions); on the other hand, it is coming from the prospect of stricter regional regulation, for example, at the EU level.
The EU member States are implementing the Fit For 55 package, the umbrella regulation that includes the FuelEU, the EU’s ETS extension to the maritime transport sector, an update Energy Taxation Directive and initiatives on the deployment of Alternative Fuels Infrastructure.
The expansion of the EU ETS to the maritime transport sector will bring the cap-and-trade approach to an industry level. For each individual vessel, the implementation will be more like carbon taxation with a payment obligation for each ton of carbon emissions from the vessel. In this instance, the tank-to-wake emissions and the fuel consumption as reported within the EU monitoring, reporting and verification (MRV) framework are only considered.
The FuelEU Maritime mechanism expands carbon-output calculations beyond present tank-to-wake estimates to include well-to-tank emissions which better reflect energy life cycles. The initiative aims to incentivize the use of low-carbon fuels, as well as the shore power connection of specific vessel types (containerships and passenger vessels) and thereby escalate the transition to carbon-neutral shipping.
The FuelEU Maritime initiative makes use of the life-cycle approach on a well-to-wake basis to derive the carbon footprint of fuels including CO2, nitrous oxide (N2O), methane slip and the carbon dioxide equivalent (CO2eq) emissions from electricity used during port stays.
Other European initiatives target the facilitation of this strategy for maritime transportation through shore infrastructure and the internal market in the global ecosystem. The amendments to the Energy Taxation Directive will introduce a bunker levy on heavy pollutant fuels to help incentivize the development of low-carbon fuels. Development of production and distribution capacity for these fuels is the focus of the framework of common measures for EU ports, whereby the commission will fund and facilitate the development of the renewable and lowcarbon fuel and energy sources value chain from production and storage to distribution and bunkering.
The IMO has started (the MEPC 77 and the Intersessional Working Group on Reduction of GHG Emissions from Ships [ISWG-GHG] 9) working towards developing a life-cycle standard for shipping. ISWG-GHG 11 saw member States submit their views on the elements that would need to be included. A wider acceptance between members States on the need of such guidelines was observed and a correspondence group to develop these guidelines will likely be initiated by MEPC 78 and expected to be reporting back during MEPC 79.
Broadly, industry feedback appears to support a new regulation to support counting shipping’s emissions on a wellto-wake basis with, for the sake of homogeneous enforcement and fairness, any regulation on that level applicable to all international shipping.
As the regulators ramp up discussions to increase the scope of regulations, the industry is showing strong signs of its commitment to a greener future for shipping. There has been an increased number of orders for liquefied natural gas (LNG) fueled vessels, a contract for the world’s first methanol-powered containerships, new partnerships to accelerate technology development, a shift in business models and new regulations to accelerate the energy transition.
One example of new partnerships is the Mærsk Mc-Kinney Møller Center for Zero Carbon Shipping based in Copenhagen, where a cross-disciplinary team is collaborating to highlight decarbonization pathways, accelerate the development of lower carbon fuels and power technologies and support the establishment of the regulatory, financial, and commercial support that will enable the transition towards green shipping.
The initiative’s founding partners are ABS, A. P. Møller-Mærsk, Cargill, MAN Energy Solutions, Mitsubishi Heavy Industries, NYK Line and Siemens Energy, a coalition that is effectively showing how cooperation is the key to a zerocarbon future.
While some of the industry’s leading lights are announcing ambitious decarbonization targets and strategies, global efforts to clean up shipping’s commercial ecosystem could benefit from the increased coordination among the various parties involved: shipowners, technology providers, charterers, fuel producers, regulators and so on.
The 2021 orderbook illustrates the strong presence of the dominant sectors of the shipping industry: containerships, tankers and bulk carriers.
In the containership market, there is sustained demand across the spectrum of container capacity: feeder vessels, intermediate, neo-panamax and ultra-large containerships (offering capacities above 10,000 twenty-foot equivalent unit [TEU]).
In the bulk sector, there is notable demand for the handymax sector, while chemical tankers have the highest percentage of demand in the tanker sector. Demand remained steady for liquefied petroleum gas (LPG) and LNG carriers (105 and 77 orders, respectively) in 2022. In a development illustrative of shipping’s green impetus, there was increased demand for low- or zero-carbon technology, with 19 vessels either fitted or with plans to fit wind-assisted propulsion technology.
Generally regarded as the cleanest of the fossil fuels, LNG generates approximately 20 percent less CO2 than fuel oil and about 45 percent less than coal. It is considered by many a transition fuel, forming a bridge between fossil fuels and green energy as indicated by a survey performed with shipowners which is reflected in the figure above. In today’s increasingly ESG-influenced maritime industry, the focus is growing on finding ways that the tank-to-wake portion of using LNG as fuel can be offset.
Hence the emergence and promotion of a green LNG product. An environmentally friendlier version of LNG (from a well-to-tank perspective) is generated using biogas as the feedstock and renewable energy to power liquefaction facilities or by using carbon-capture technologies.
Last year (2021), the global LNG-fueled ship fleet expanded rapidly, with 240 orders recorded. The rise of LNG-fueled container, tanker and cruise ships translates into a rise in the LNG bunker ship fleet. There are now about 694 LNGpowered ships in operation and under construction, and there are about 213 more that are considered LNG-ready.
In January 2021, the first ship-to-ship refueling was carried out; a bunker vessel loaded approximately 6,000 cubic meters (m3) of gas into a newly built LNG-powered containership.
Figure 5: ABS interpretation of the LNG orderbook trend based on various reports (including Shell LNG Outlook 2022 and International Gas Union World LNG Report 2021).
Another gas-related development took place in November at COP26, when the United States (U.S.), the EU and 100 signatory countries in total, announced their Global Methane Pledge to cut the emissions from methane by 30 percent by 2030, compared with 2020 levels [6].
The joint initiative aims to reduce methane fugitive emissions (either leakages or slip) that contribute to the greenhouse effect across all sectors that produce, transport or consume methane, such upstream production, farming, power generation and inefficient energy transport.
A report released last year by the Intergovernmental Panel on Climate Change (IPCC) highlighted the need to regulate methane slip; since 2011, the related atmospheric concentrations of methane emissions have been gradually increasing, reaching an annual value of about 1,866 parts per billion. The report also identified that the global warming potential (GWP) of unburned methane over 100 years is about 30 times higher than CO2; over 20 years, this ratio can expand to 85 times.
During the past couple of years, the industry has seen an increase in the adoption of low-pressure, LNG-burning, Otto-cycle engines, which due to their operating principle have a higher rate of methane slip than high-pressure Diesel-cycle engines that are less prone to methane slip.
With more regulations expected to measure and reduce methane slip, this purchasing trend is expected to reverse. Methane slip is significantly increased when using low-pressure two-stroke and four-stroke engines compared to high-pressure two-stroke models.
After-treatment solutions such as catalysts, exhaust gas recirculation (EGR) and plasma-reduction units are expected to play a significant role in an environment where methane slip is more regulated and low-pressure two- and four-stroke engines are targeted. But most of these technologies are still being developed, so there is limited data on their ability to reduce emissions, additional power requirements and the costs associated with purchasing and operating them.
The effectiveness of catalysts is subject to specific exhaust gas temperatures and the sulfur content in the LNG, pilot fuel and lubrication oil. The location of the catalyst (upstream or downstream of the turbocharger) significantly affects the capital expenditures (capex) and operational expense (opex) of the installation.
Currently, catalysts and plasma-reduction units are the technologies being examined for their ability to reduce methane slip from the four-stroke engines. For two-strokes, combustion-related adjustments (to high-pressure injection) and plasma-reduction technologies are seen as the main solutions for methane slip.
The application of methanol as a marine fuel is only beginning; it was approved for inclusion in the IMO’s Interim Guidelines for Low Flash-Point Fuels in November 2020. Its onboard uses are versatile; it can be used as fuel for internal-combustion engines or as a fuel source for fuel cells.
The key benefits of methanol are that it does not contain sulfur (so its use in engines can comply with IMO requirements for emission-control areas [ECA]) and because it can be stored as a liquid in ambient air conditions the costs for tanks and fuel-gas supply systems are greatly reduced. It also does not produce particulate matter upon combustion.
Dual-fuel engines that use methanol and include a water-injection unit, which mixes water with methanol at the required levels, can reduce nitrogen oxides (NOx) emissions and assure compliance with Tier III levels.
As a marine fuel, methanol has the potential to have a very positive impact on the IMO’s strategic short-term regulations, EEXI and CII, because it produces less CO2 than other fossil fuels per ton of fuel although this is in most cases compensated due to a higher consumption as methanol has a much lower calorific value. For example, methanol’s Carbon Factor (Cf) (1.375) is the lowest among marine gas oil (MGO): 3.206, heavy fuel oil (HFO): 3.114, and LNG: 2.750.
It is a widely shipped commodity and has been used in the chemical industry for many decades. The supply chains for its distribution already exist and are well-positioned to offer methanol as a marine fuel at many ports. There are currently about a dozen vessels engaged in deep-sea trading using methanol-fueled engines. In early 2021, the Danish shipowner Mærsk matched that with an order of 12 methanol-powered containerships to run on green methanol.
Methanol as a marine fuel can be considered renewable or non-renewable, depending on the feedstock used to produce it. Brown or gray methanol has relatively high carbon intensity, as it is mainly produced from coal or natural gas without the use of carbon capture technology.
Blue methanol is produced from natural gas using carbon capture technology, or waste streams and by-products from manufacturing processes. Green methanol is produced from renewable energy sources such as wind and solar power, or from biomass and biodegradable parts of waste production.
-000Metric tons
120,000
100,000 80,000 60,000 40,000 20,000 0
-000Metric Tons
200,000 180,000 160,000 140,000 120,000 100,000 80,000 60,000 40,000 20,000 0
2016 2017 2018
Figure 6: Methanol as a fuel demand and production capacity.
2019 2020 2021 Biodiesel
Methanol Market Services Asia
Others
Methanol-to-Olefins
2019201820172016 Fuel cells
2020
Figure 7: Methanol demand by final use and type.
2021 DME
Gasoline Blending and Combustion
Methyl Chloride (Chloromethane)
Methylamines Methanethiol (Methyl Mercaptan)
Dimethyl Terephthalate (DMT)
Methyl Methacrylate Methyl tert-Butyl Ether (MTBE)
Acetic Acid
Formaldehyde
Methanol Market Services Asia
For shipping, the main green candidates today are biomethanol derived from biomass feedstocks and e-methanol derived from renewable electricity and captured CO2; these both have strong potential to produce neutral well-towake emissions. An overview of biomethanol and e-methanol projects as of 2021 is shown in the following figure.
Figure 8: Overview of biomethanol and e-methanol projects worldwide in 2021 [10].
From a price point of view, e-methanol and biomethanol are not expected to be as attractive as other alternative fuels for years to come. This is mainly due to the lack of large-scale production capacity for the renewable versions of methanol. However, once demand increases and its supply chains mature, the price is expected to drop, perhaps as early as 2030.
The maritime industry is increasingly considering biofuels as one of the main options at hand to reduce the shipping’s carbon footprint. There is growing shipowner activity in all sectors with regard to the testing of biofuels in conventional engines, blends containing biofuels with shares of seven percent to 100 percent or otherwise called B7 to B100.
Operators have become more focused on the sustainability of biofuels and ask questions about the life-cycle consequences of their production.
Currently, there is a limitation to the quantity of biofuels that can be used without having a direct impact on feedstock sustainability, food crops and the natural ecosystem. The main long-term answer is expected to be biomethanol due to its compatibility with current handling, storage and bunkering practices. However, biomethane also is expected to play a key role in the future due to the ever-increasing size of LNG-powered vessels.
Shipping is widely known as one of the most efficient transportation options in terms of emissions per ton transported per kilometer. However, demand for maritime transportation has rapidly increased over the decades, resulting in a proportionate rise in carbon dioxide CO2 emissions from the shipping sector.
International shipping accounted for approximately two percent of global energy-related CO2 emissions in 2020 [1], or about 765 million metric tons of carbon dioxide (Mt CO2) into the atmosphere. This was roughly 1.2 percent less than the previous year when emissions reached a record high of 774 Mt CO2
Annual international shipping emissions have more than doubled since 1990 [2]. The historical CO2 emissions from international shipping worldwide from 1990 to 2018 are shown in the figure below.
UNCTAD Seaborne trade (tnm)
UNCTAD Seaborne trade (t) EEOI (g CO2/tnm) AER (g CO2/dwtnm)
IMO2 IMO3 IMO4
1990 2005
CO2e emissions (t) 1995 201520102000
2008 EEOI
140 120 100 80 60 2020
Figure 10: International shipping emissions and trade metrics, indexed in 2008, for the period 1990-2018, according to the voyage-based allocation of international emissions.
Despite the global challenges faced by the shipping sector due to the COVID pandemic, the CO2 emissions from international shipping remained fairly high. Shipping-related GHG emissions rose by 4.9 percent in 2021, reaching a total that was higher than 2020 or 2019.
According to Simpson Spence Young’s annual industry report, the key driver for the 2021 increase was the recovering world economy, during which demand for durable goods remained firm, while demand for services increased [79]. However, forecasts made at the beginning of the pandemic — that projected emissions to fall in 2020 and 2021 — proved wishful thinking.
Any projections of emissions from shipping are highly dependent on multiple parameters, including fleet growth and demand, improvement of vessel efficiencies and deployment of new technologies. The IMO expects emissions from shipping in 2050 to range from 1,200 Mt CO2/year in its low-emission scenario to 1,700 Mt CO2/year in its highemission scenario [3].
Shipping is being challenged along with all the other industries to reduce emissions to meet decarbonization targets in the decades to come. The IMO’s initial GHG strategy was adopted in April 2018. It included a list of short-, midand long-term measures to meet the IMO’s ambition to reduce CO2 emissions per transport (as an average across international shipping) by at least 40 percent by 2030, and to pursue a 70 percent reduction in carbon intensity while pursuing 50 percent reductions in absolute global GHG emissions by 2050, compared to 2008.
Some countries and several shipping companies believe the new technical and operational measures established by the IMO are not ambitious enough to curb GHG emissions from international shipping in the long term.
(Kiribati, and SolomanThe short-term measures seek to improve the average annual efficiency of the global fleet (through application of the CII) by almost two percent between 2020 and 2026. This was only slightly better than the 1.6 percent improvement achieved between 2000 and 2017. As we established after the publication of our second Setting the Course to Low Carbon Shipping publication in 2020, in order for shipping to achieve its 2050 goals, government policies and incentives will be a critical element to help meet decarbonization objectives.
Shipping’s role in global emissions output, and its potential to contribute to mitigation efforts, gained greater attention at COP26 in Scotland last year when the conference refocused on the wider maritime supply chain’s important role in meeting the goals of the Paris Agreement.
Led by Denmark, 14 nations issued the “Declaration on Zero Emission Shipping by 2050.” With the signatures of major shipping nations including the U.S., United Kingdom (U.K.), Germany, France and Norway, as well as key players in the industry such as Panama, the declaration called for immediate reductions to allow shipping to reach zero emissions by 2050 [4].
However, zero emissions does not equate to no carbon emissions in the literal sense; if it takes precedent in declarations from other transport sectors, the goal is more likely to be net-zero emissions, a goal that is often supported by creating offsets such as carbon sinks (e.g., trees), or through carbon capture.
Alternative fuels will play a dominant role in the decarbonization of the marine and offshore sectors and are expected to yield the most benefits for reducing GHG emissions. However, with the current regulatory framework focused on tank-to-wake emissions rather than those generated during the full life cycle of the fuel (well-to-wake), shifting measurement criteria to the latter is seen as essential for achieving net-zero emissions for shipping.
• Preceded by Cargo Owners for Zero Emission Vessels (coZEV) prior to COP26
• 25 founding companies that have made commitments to spur commercial adoption of emerging technologies
• Members committed to using zero-emission fuels in new and retrofitted vessels by 2030
• Target of >5% deep-sea shipping using zero-emission fuels by 2030
• 10% of cargo volume transported on zero-emission fuels by 2030, 100% by 2040
• 22 signatories to the declaration at COP26
• Facilitates the establishment of partnerships along the value chain (ports, vessel operators, etc.) to accelerate decarbonization through “Green Shipping Corridors”
• Looks to establish six green corridors by 2025, with more added by 2030
• Ships using these corridors would use low-to-zero emission fuels
Figure 12: COP26 developments.
• More than 100 signatories to the pledge
• 30% reduction of methane emissions by 2030 from 2020 level
• Calls for methane emission reduction, not methane (LNG) reduction
• U.S. and EU focusing on mitigation technologies and carbon accounting methodologies
Climate change is becoming more rapid and widespread, with irreversible consequences. Environmental changes and cataclysmic feedback loops are predicted to push ecosystems beyond tipping points, according to the overwhelming weight of scientific evidence. At that point, all efforts toward decarbonization would be rendered ineffective [14].
The most recent nationally determined contributions (NDCs) to decarbonization presented at COP26 still fall short of the Paris Climate Agreement’s 1.5° C target [14]. On current course, the world is expected to warm by 2.4° C, with only the most optimistic scenarios limiting it to 1.8° C (as shown in the following figure).
Full implementation of 2030 NDC
Full implementation of submitted and binding long-term targets and 2030 NDC targets
Best-case scenario; assumes full implementation of all announced targets including net-zero targets
LTSs and NDCs
Figure 13: Global temperature scenarios by 2100 [14].
Without stronger action, the global capacity for mitigation and adaptation will worsen. The world will bear significant costs if we collectively fail to reach net-zero emissions by 2050. Losses of between four percent and 18 percent of global gross domestic product (GDP) [15] are expected with different impacts in different regions if no action is taken to address climate change [16]. The transition to net-zero emissions, in which GHG released into the atmosphere are balanced by their removal, could be as transformative for economies and societies as past industrial revolutions.
As climate change worsens and some economies recover faster than others from COVID-19, disconnects between governments, businesses and households in terms of policy commitments, financial incentives, regulations and immediate needs may amplify the transition's disruptive potential within countries. A sustained lack of coordination among countries would almost certainly have profound geopolitical implications, with rising tensions between strong decarbonization advocates and those who oppose quick strong action by employing tactics such as stalling climate action or greenwashing — the practice of convincing people that a company or authority is more environmentally friendly than it actually is.
Increased Annual Storm Damage to Ports 1.8–7.1 4.5–17.7
Increased Annual Port Disruption Costs 1.1–2.7 3.1–7.6
TOTAL 2 .9–9 .8 7 .6–25 .3
Table 2: Projected costs of sea level rise and stronger storms for ports and shipping in future years (billion $/year).
2050 2100
Investment Cost (billion $ in 2021) 121–176 151–205
Annualized Cost (billion $/year 2021-2100) 4.0–5.8 5.0–6.8
Table 3: Port adaptation costs against projected sea level rise and larger storm surge for selected future years [17].
2050 2100
Sea level rise (m) 0.27 0.84
Increased storm surge height (m) 0.38 0.76
Increased peak wind speed (m/s) 3.0 6.0
Ports, shippers and carriers (billion $)
0.8–1.6 1.9–3.7
Consumers of shipping services (billion $) 0.3–1.1 1.1–3.9
TOTAL (BILLION $) 1 .1–2 .7 3 .1–7 .6
Table 4: Estimated increase in the annual costs of port disruptions due to sea level rise and stronger storms (billion $/year).
Recent research [17] shows that the global shipping and the port industry is at risk of billions in infrastructure damage and trade interruption as a result of climate change impacts. Global temperature increases are expected to cause or exacerbate a number of climate-related hazards, some of which can pose significant physical risks to the shipping and port industries. Notably, these hazards include: sea level rise, severe tropical storms, inland flooding, drought and extreme heat events. By 2100, the shipping industry could be forced to pay an additional $25 billion (B) in additional annual costs due to the effects of climate change if emissions aren't reduced .
Climate change is likely to cause global sea levels to rise and increase the intensity of tropical cyclones through increased wind speeds, wave heights, and rainfall intensity. The Environmental Defense Fund (EDF) report [17] includes estimated costs for two selected years — 2050 and 2100 — by assuming a worst-case climate change scenario Representative Concentration Pathway (RCP8.5). At the current rate of storm damage to ports around the world, the annual global average is estimated at about $3B. Additional annual damages and port disruption costs are expected to reach up to $25.3B by 2100, according to projections in the EDF report (see Table 2).
Additionally, the report estimates the costs of adapting ports to avoid the damages and disruptions described previously, focusing on port elevation as an adaptation strategy. The analysis estimates the cost of elevating all current port areas globally by the same total amount using the same combination of sea level rise and storm surge height assumptions as the RCP8.5 scenarios. An estimated $205B in global investment is needed to safeguard all ports from the expected rise in sea level and storm surge in 2100 (see Table 3). On an annualized basis these costs range from $4B to $6.8B per year.
The same study [17] also informs that under the RCP8.5 scenario, annual economic losses to ports, shippers and carriers due to storm-related disruptions may be $0.8B to $1.6B higher by 2050 than they would be without climate change. By 2100, these additional losses are projected to be $1.9B to $3.7B per year. A $0.3B to $1.1B annual increase in the economic costs of shipping delays is predicted under RCP8.5 by 2050. These added annual costs may reach $1.1B to $3.9B by 2100. Thus, by 2100, climate change at the RCP8.5 level is projected to increase total annual costs associated with storm-related port disruptions by $3.1B to $7.6B (see Table 4).
Limiting greenhouse gas (GHG) emissions is considerably challenging for our society. The task, as we are going to see in the latter parts of this publication, includes scaling up of renewables, electrifying the transportation systems and dealing with the economic fallout that the fossil hydrocarbon industry may face, accounting for approximately seven percent of the world economy [76].
The energy transition that needs to occur as we strive to reach the decarbonization targets will be based on two value chains, the hydrogen and the carbon value chains.
The hydrogen value chain includes all the energy conversion elements. Hydrogen should not be seen just as a molecule of the periodic table or only as a single marine fuel. It is a medium which could be converted into different forms as an energy carrier. Renewable energy via electrolysis can be converted into hydrogen, an energy carrier which could be stored and transported by sea. It can also serve as a medium which can be the building block for green and e-fuels, minimizing the use of fossil fuels.
Fuels Transportation
e-Hydrogen Blue Hydrogen
Liquefaction
Electrolysis of Water
Green Electricity Natural Gas Steam Methane Reforming
Haber-Bosch Process
Synthesis
Carbon Capture
e-Ammonia Blue Ammonia
e-Methanol Blue Methanol
e-Methane Synthesis and Liquefaction
Figure 14: The hydrogen value chain.
Shifting and absorbing captured carbon through carbon sinks or sequestration in soil and ocean will be instrumental in achieving the net-zero goal. In contrast with the hydrogen value chain, which is an energy conversion system, the carbon value chain (alternatively, the system of carbon capture usage and sequestration) is an abatement mechanism. This system creates a separate value chain that intersects with the hydrogen value chain to produce blue coded fuels as renewable energy scales up to meet the future demand. Currently, the carbon chain is a niche sector. However, the need for scaling up may transform carbon into a precious commodity. In both value chains, the maritime and offshore sectors are the connecting links via the transportation of the value chain’s tokens. In essence, the marine and offshore sectors are becoming fundamental enablers of the energy transition and acting as indispensable links for the two value chains.
To achieve the net-zero target, more innovation will be required. Among others, hydrogen is aiding in closing the gap in industries such as heavy-duty transportation, steel manufacturing, fertilizer and methanol production that would be difficult to eliminate otherwise. It will require many players’ involvement in the form of consortia and organizations teaming up to meet the needs along the value chain; development of new facilities or upgrading and retrofitting the existing infrastructure will be crucial to address the emerging transition and physical risks along the way.
Feedstocks Fuel Production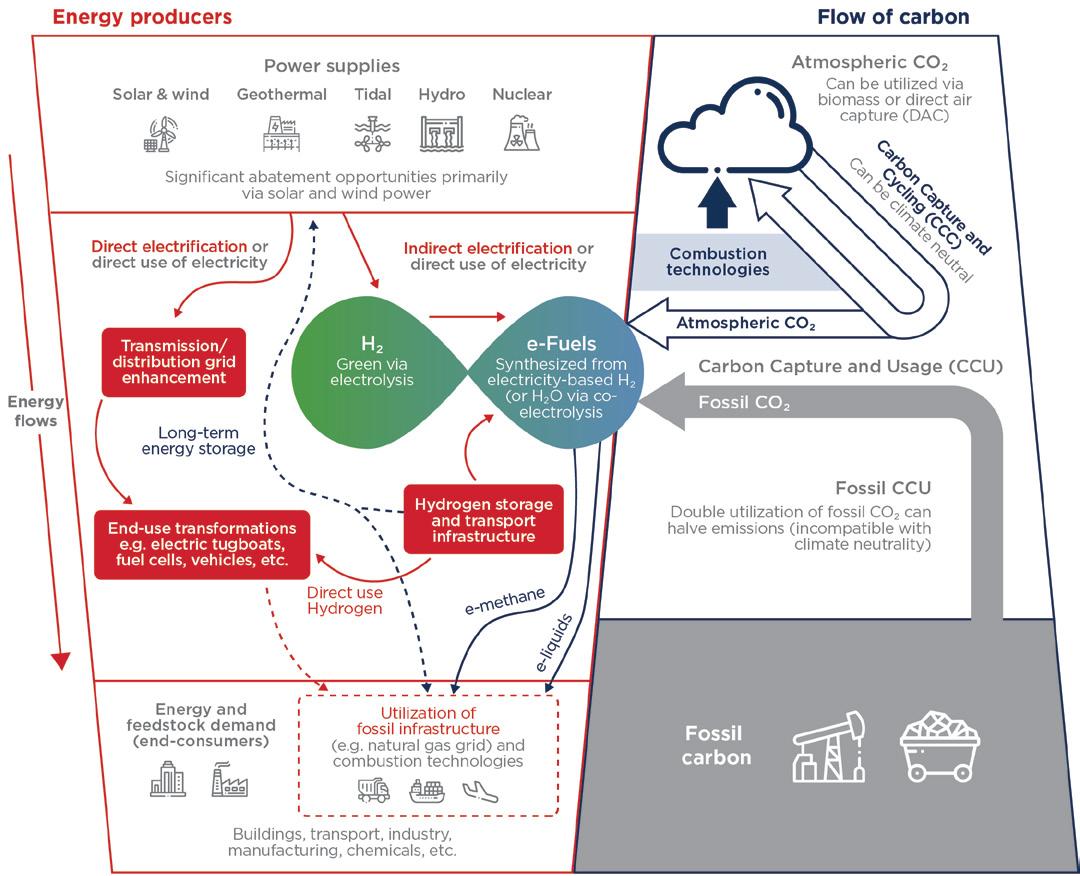
Hydrogen, which has traditionally been used as chemical feedstock in several industries, is now beginning to see wider use as an alternative fuel. It is well suited to produce electro-fuels (e-fuels). A complete overview on hydrogen can be found in recent ABS publications, including: Hydrogen as Marine Fuel Sustainability Whitepaper — June 2021 and the newly released publication, Offshore Hydrogen Production of Green Hydrogen — February 2022.
Furthermore, the role of hydrogen as a marine fuel is expected to have a significant effect on the emerging energy transition. Developments related to hydrogen's transportation, production, safety, standards and regulation are going to be in the spotlight for the years to come.
Figure 15: Hydrogen and carbon value chain (adapted from [18], ABS Whitepaper Hydrogen as Marine Fuel and ABS Whitepaper Carbon Capture, Utilization and Storage).Hydrogen is produced through chemical reactions that separate it from water or hydrocarbons. In industry, it is often referred to by different colors to indicate its origins. The more common sources are:
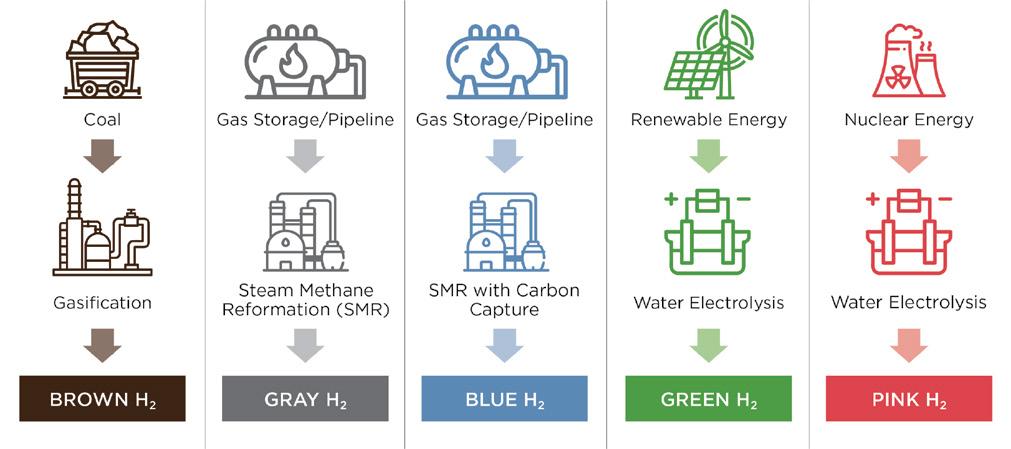
• Brown hydrogen, produced via coal gasification or coal carbonization.
• Gray hydrogen, produced from reaction to the reformation of steam using natural gas.
• Blue hydrogen, produced in the same manner as gray hydrogen but the emissions are captured, resulting in a netzero carbon footprint from the reformation process.
• Green hydrogen, produced from renewable energy sources powering the water-electrolysis process with no carbon emissions.
• Pink hydrogen is generated through electrolysis powered by nuclear energy.
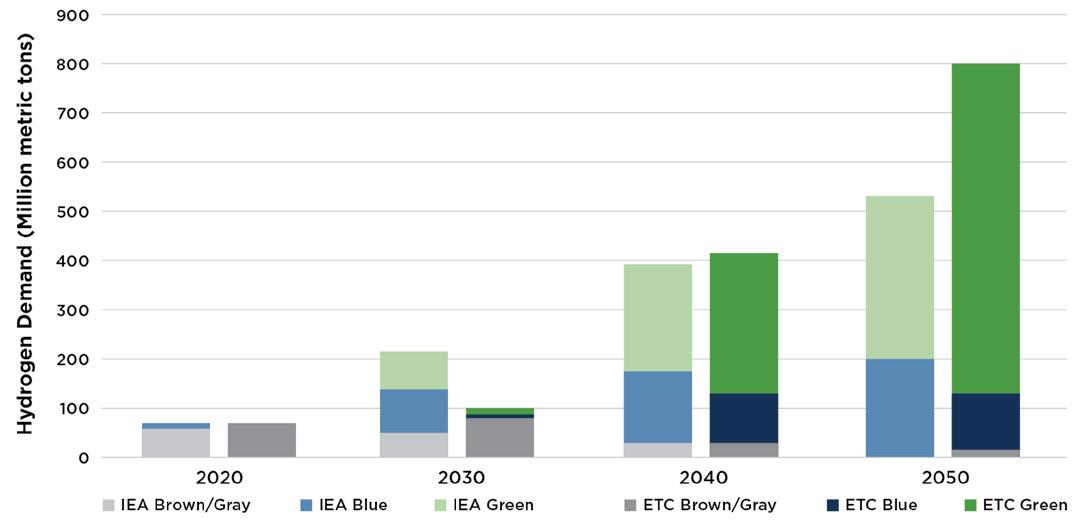
In 2019, global consumption of hydrogen fuel reached about 75 million metric tons (Mt) according to International Energy Agency (IEA). Of that volume, only 1.5 Mt was green hydrogen. A market analysis performed in April 2021 by the Energy Transitions Commission (ETC), a global industry coalition committed to achieving net zero by 2050, indicated that the demand for hydrogen was expected to increase annually by seven to nine percent. This would lead to an estimated demand between 500 and 800 Mt of hydrogen by the year 2050 and fulfill 15 to 20 percent of the global energy demand.
To reach a production level of 500 Mt by 2050, there would need to be 3,000 to 6,000 gigawatts (GW) of newly installed renewable energy sources devoted exclusively to hydrogen production.
Figure 17: Low vs. high demand hydrogen forecasts.
Focusing in particular on the maritime transport sector, the projection for hydrogen demand combined with the production capacity of the projects in the pipeline and forecast based on that, it seems that more capacity will be required to cover the hydrogen needs of the sector in the long term.
Hydrogen that is produced through the use of renewable electricity or electricity that is generated by nuclear power plants relies heavily on electrolysis. Electrolytic systems have been widely used for decades in the industry particularly in processes such electrowinning and electrorefining. At the heart of the system, we find the electrolyzing unit which can use a range of technologies to produce electrolytic work.
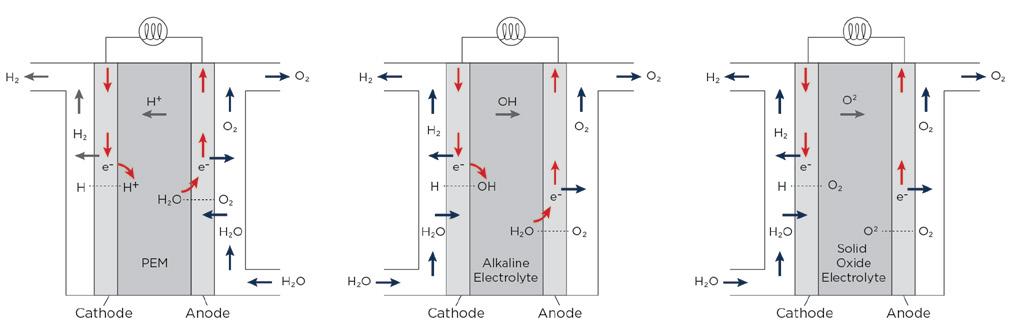
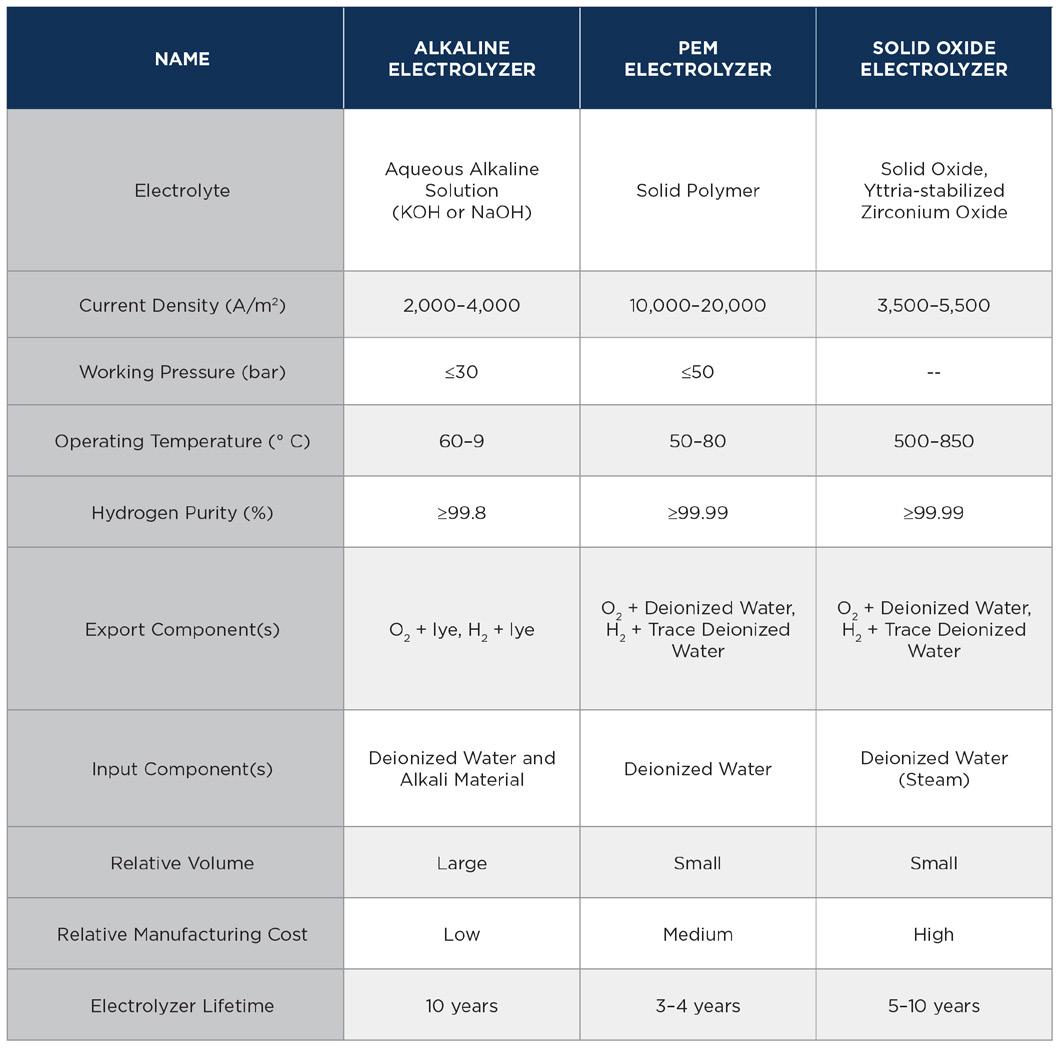
Currently there are three commercially-viable designs of electrolyzers being considered for use in hydrogen production: proton exchange membrane (also known as polymer electrolyte membrane, or PEM) electrolyzers; alkaline electrolyzers (AEC); and solid oxide electrolyzers (SOEC).
Although PEM electrolysis is a mature technology and has a short response time for electrical load change, it is expected to remain relatively expensive because of excessive use of rare or costly metals (Ir, Pt, Ti). SOEC, though much less mature than AEC has significant potential. It is anticipated to reach the same cost as AEC, while it will likely maintain an efficiency advantage.
Figure 18. Common electrolyzer designs. (left: PEM electrolyzer, center: alkaline electrolyzer, right: solid oxide electrolyzer).
Each electrolyzer design has its own unique benefits and drawbacks. The selection of any particular design will influence the design of the complete facility and vice versa. They each require different pre-processing techniques for the supplied water, have different operating conditions, and have different maintenance requirements. In order to understand where each electrolyzer could be optimal, the complete hydrogen production facility must be examined.
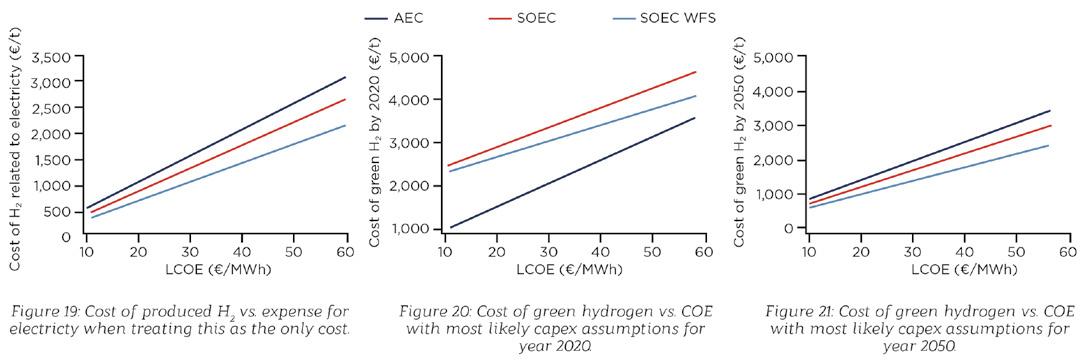
As the building block of other energy carriers, hydrogen will add a significant cost element to the overall costs related to the final energy carriers and ultimately to the economics of the total energy conversion of the value chain. Considering that the production of hydrogen will heavily depend on the electrolysis process, its costs will also be affected similarly. Therefore, it is interesting to look at how electrolysis technologies can define the final cost of fuels produced. For the purposes of this publication we look into proton exchange membrane (also known as polymer electrolyte membrane, or PEM) electrolyzers, alkaline electrolyzers (AEC), and solid oxide electrolyzers (SOEC). The graphs below show the cost of H2 production related to the levelized cost of electricity (LCOE) and the specific electrolysis technology.
We observe that due to the increased efficiency of SOEC, the cost of the final product is expected to be lower than AEC across a wide range of electricity prices. If we account for installation costs (capital expenditure [capex] incurred), AEC performs better in 2020 but as the technology benefits from scale effects and installation cost drops, the expectation is that in 2050, SOEC will provide a more cost-effective solution.
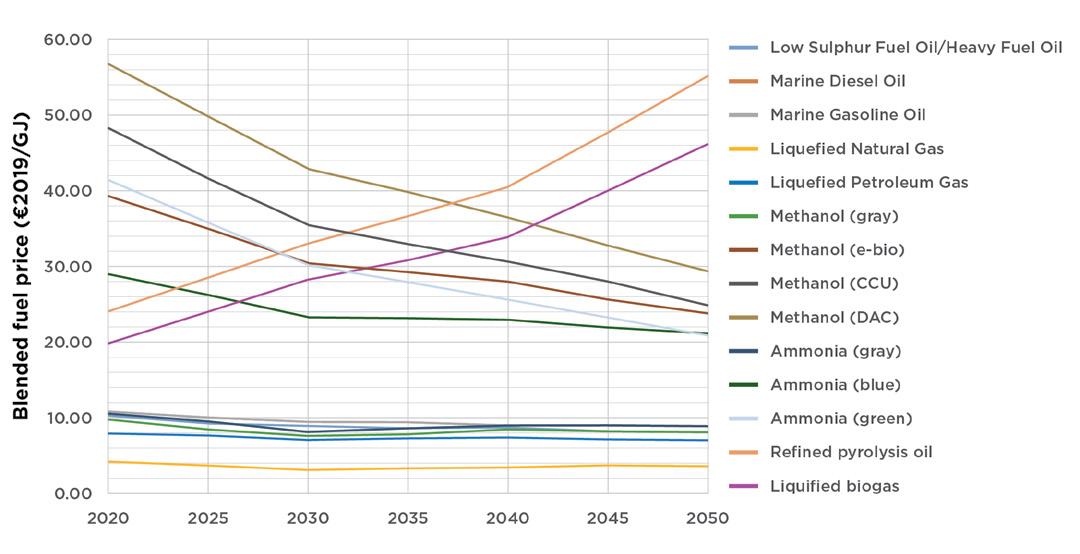
The cost of transitioning to net zero is one of the biggest challenges for shipping companies. As technology continues to evolve and economies of scale are achieved, the cost of the alternative fuels will continue decreasing. However, according to a recent study, the price of alternative fuels will remain more expensive than conventional marine fuels in 2050 [24].
Technical University of Denmark
Figure 22: Blended fuel prices with electro-fuels produced off grid. (Franz, Shapito-Bengtsen and Campion)
Green hydrogen would provide a cleaner source of hydrogen feedstock and fuel for many industries, but realizing this prospect will require significant additional investment and infrastructure. Projects to produce green hydrogen are on the rise and this trend is expected to continue for the years to come, as the production of gray hydrogen has already started to decline.
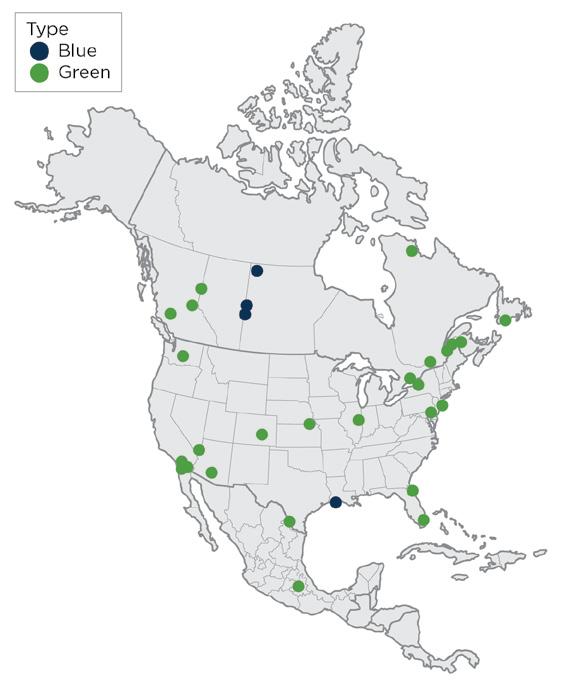
Source (MarE-fuel: Energy efficiencies in synthesizing green fuels and their expected cost – DTU)Figure 23: Overview of operational, under-construction and pending FID blue and green hydrogen projects worldwide.
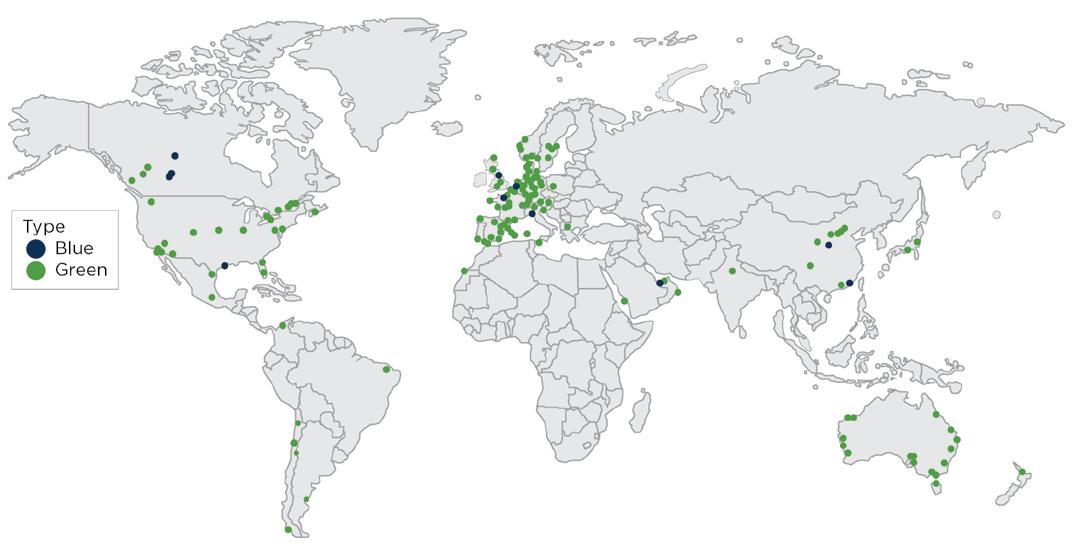
Figure 24: Overview of operational, under-construction and pending FID blue and green hydrogen projects in Europe.
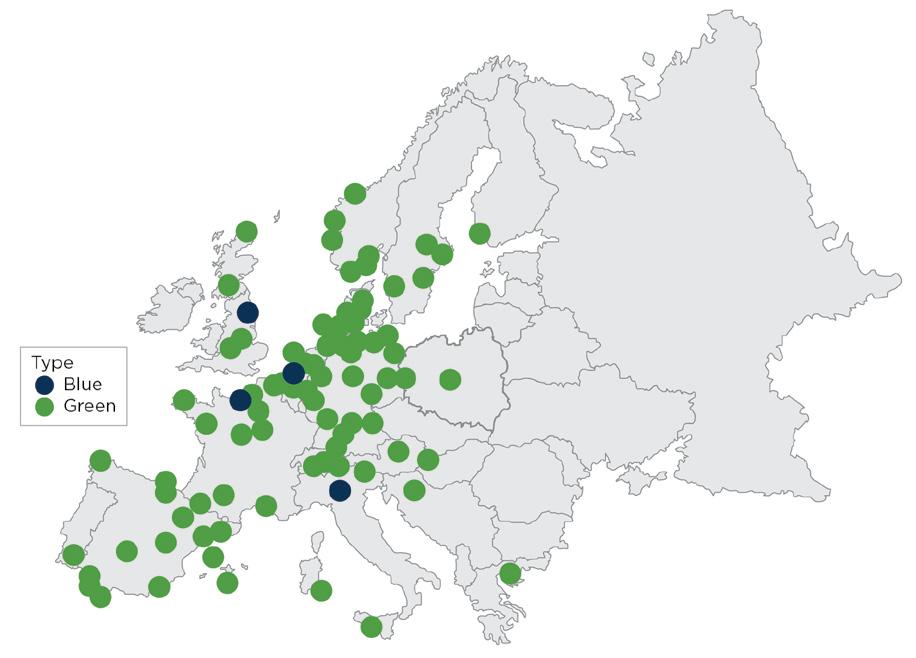
Figure 25: Overview of operational, under-construction and pending FID blue and green hydrogen projects in North America.
Critical to the scaling up of the hydrogen value chain is the development of regional hydrogen hubs to facilitate growth. These are regions in which a clean energy source can be locally scaled and refined. Hydrogen is a perfect candidate for developing hubs, considering the vast array of synthesizing hydrogen to be used as a fuel. Investments have been made by developed governments to establish these hubs, which is critical to the overall success of the global initiative.
The United States (U.S.) government recently approved up to $8 billion (B) for up to four hydrogen hubs. The approval will most certainly be contingent upon geographic competitive advantages. For example, the Gulf Coast is potentially a prime location to have a hydrogen hub developed due to its commercial location. Likewise, the Great Plains have ideal geology for carbon capture and have an abundance of renewable energy in the form of solar and wind. In fact, four states (Colorado, New Mexico, Utah and Wyoming) have come together to develop hydrogen hub and compete for the federal funding. Competitive advantages aside, scaling up of renewables will be necessary for green hydrogen to be a majority of the hydrogen mix in 2050.
Understanding the required energy inputs, and water inputs, cannot be underestimated. Therefore, selection of the location of hydrogen hubs will be a determining factor in its success. As the picture becomes clearer on the necessities of a robust hydrogen economy, it seems more difficult to achieve. The success is not only a function of the investment, but also the location, renewables capacity, water availability, storage capacity, commercial viability of hydrogen in the region and transportation infrastructure. It will be inevitable that the hubs being established will not thrive in all these topics, but valuable lessons will be learned within each hub that will prepare us for long-term success and implementation.
Most of the current pilot and demonstration projects are focused on short-sea shipping and inland shipping, while new designs are mostly for smaller vessels. This is due to hydrogen’s low energy density and the direct effect that this has on a ship's cargo pay load. With the current technologies, the design of hydrogen-fueled ships requires exhaustive optimization of speed, range, operational profile and bunkering frequency.
An overview of the key characteristics of hydrogen as a marine fuel follows:
• Fuel cell technology demonstrated, but not yet commercially available (PEM, solid oxide fuel cell [SOFC])
• Batteries are a complementary technology for fuel cells to shave peak loads and supply power at low loads
• Internal combustion (IC) engines are being demonstrated or developed, but are limited to smaller short-sea shipping
• IC engine development primarily focused on ammonia
• H2 can be blended with other compatible fuels such as methane, or combusted with fuel oil
• Cylindrical or spherical fully refrigerated tank with double wall and vacuum insulation
• Storage Conditions: High pressures between 350 and 700 bar, cryogenic environments below -252.9° C or a combination of high pressure and low temperature may be required to reach higher hydrogen densities
• Current prototype size is 1,250 cubic meters (m3) with larger capacity designs under development
• The boil-off rate (BOR) is one to five percent per day for standard land-based liquid hydrogen storage tanks
• Tank cost is currently the main bottleneck to viability as boil-off gas (BOG) management technology/improved insulation are needed
• Commercially available nitrogen oxides (NOx) reduction system might be required (exhaust gas recirculation [EGR], selective catalytic reduction [SCR] or water injection) to meet Tier III
• Major concerns over space
• Requires 4.5/8 (liquid/compressed gas) times the volume compared to marine gas oil (MGO) and over three times compared to ammonia for the same energy content
• Double structure vacuum insulation requires additional space
• Flammable properties, wide flammability range (increased when mixed with pure oxygen), and hydrogen is a small molecule that is difficult to contain
• Leaks in open or contained spaces can be a serious fire hazard due to quick formation of flammable gas mixture (low activation and ignition energy)
• Flow or agitation of hydrogen gas or liquid can create electrostatic charges resulting in sparks and ignition
• Flames are invisible and burn extremely quickly (deflagration or detonation); detonations can result in extreme pressure increases
• While non-toxic, at high concentrations it can act as an asphyxiant
• Dissipates quickly — so does not pose direct threat to the environment
• No prescriptive rules, only Maritime Safety Committee (MSC) interim recommendations and reference to the International Code of the Construction and Equipment of Ships Carrying Liquefied Gases in Bulk (IGC Code)
• Requires the International Code of Safety for Ship Using Gases or Other Low-flashpoint Fuels (IGF Code) alternative design
• Current regulations and guidance mainly associated with fuel-cell technology
• IMO CCC 7/3/9 Amendments to the IGF Code and Development of Guidelines for Low-Flashpoint Fuels (about hydrogen fuel).
Fuel Cells:
• Annex 1 of IMO CCC 7/15 Draft Maritime Safety Committee (MSC) Circular Interim Guidelines for the Safety of Ships Using Fuel Cell Power Installations
• ABS Guide for Fuel Cell Power Systems for Marine and Offshore Applications
Carriage of Hydrogen in Bulk (Liquefied Hydrogen):
• IMO MSC 420(97) Interim Recommendations for Carriage of Liquefied Hydrogen in Bulk
• ClassNK Guidelines for Liquefied Hydrogen Carriers (2017)
• IEC 60079 — Standard for Explosive Atmospheres
• IEC 61892 — Standard for Mobile and Fixed Offshore Units (Part 7 Electrical Installations — Hazardous Areas)
• ISO 11114 — Gas Cylinders Standard
• ANSI/AIAA G-095A — Guide to Safety of Hydrogen and Hydrogen Systems
• ASME B31-12 — Hydrogen Piping and Pipelines
• NFPA 55 — Compressed Gases & Cryogenic Fluids Code
• NFPA 2 — Hydrogen Technology Code
Estimated Production Costs — 2025
• E-hydrogen: approximately $50/gigajoule (GJ)
• Blue Hydrogen: approximately $30/GJ
• Source: Techno-Economic Model (NavigaTE) Mærsk Mc-Kinney Møller Center for Zero Carbon Shipping
Bunkering prices: ABS Offshore Production Whitepaper — February 2022
• The price of green hydrogen in April 2021 ranged between $3 and $6.55 per kilogram (kg)
• Blue or brown/gray processes, cost between $1.30 and $2.90 per kg and $0.70 and $2.20 per kg, respectively
By 2030, green hydrogen is expected to drop in price to around $2 per kg in most regions with lows of $1 per kg in favorable regions.
Project One:
• Zero Emission Industries, formerly Golden Gate Zero Emission Marine, hydrogen fuel cell catamaran ferry
• PEM fuel cells with 242 kg compressed hydrogen
• 100 kilowatt-hours (kWh) of batteries
Project Two:
• Future Proof Shipping (FPS) — European innovation project Flagships
• Retrofit Project: the internal combustion engine will be removed, and PEM fuel cells, hydrogen storage, battery packs and an electric drive train will be installed
• Total amount of power: approximately 1,200 kw to 200 twenty-foot equivalent unit (TEU) capacity
• BeHydro engines and CMB.TECH's Hydroville ferry
• Dual-fuel hydrogen-diesel engines with power output from 1,000 to 2,670 kW
• Ulstein's SX190 zero-emission offshore supply vessel
• Two megawatts (MW) of PEM fuel cells and diesel engines
Through the participation in joint industry projects (JIPs) and with close collaboration with industry partners, ABS is looking to accelerate the adoption of SOFC technology for power production on marine vessels.
The main benefit of SOFCs is that, through the electrochemical conversion of fuel into electricity, propulsion power can be generated with the same or higher efficiency levels than internal-combustion engines.
ABS is also joining forces with the Mærsk Mc-Kinney Møller Center’s Fuel Cell Working Group to provide regulatory and technical support. The working group’s scope is to investigate the current and future status of fuel-cell technology and suggest a clear pathway for its adoption.
Greener shipping will be a critical piece to help mitigate climate risks and protect the environment. While many believe that a net-zero shipping strategy will be challenging to achieve, there are pathways that could lead to that goal. The problems associated with a net-zero fleet are complex, and a more expansive collaboration across sectors is required. Various external factors such as diverse emission levels, economic impacts, public perception and politics will influence the outcome. Improving the energy and operational efficiency of vessels alone will not result in netzero emissions in the future, so using net-zero fuels will be essential.
The net-zero approach may allow the industry to use fossil-based resources to produce fuels such as hydrogen and ammonia, provided the emissions are captured and stored [71]. This will be critical to producing marine bunker fuels at volume because ensuring access to green energy is the industry's greatest challenge.
Net-zero emissions can be achieved when the amount of GHGs released into the atmosphere equals the amount absorbed by sinks. Net-zero quantification is not easy and requires a life-cycle approach from well-to-wake to ensure that all the emissions are considered. An all-inclusive approach (well-to-wake) to measurement is needed to ensure that all emissions are considered.
Numerous scenarios [125] have been modeled and studied to describe the path towards a climate-neutral world and each of these scenarios have a few critical paths in common which includes the following:
1. Large scale deployment of net-zero carbon fuels [125]
a. Synthetic hydrogen-based fuels which includes green hydrogen (hydrolysis of water using renewable electricity), green ammonia (Haber-Bosch Process using green hydrogen), green methanol (hydrogenation of carbon dioxide (CO2) using green hydrogen)
b. Biofuels (biomethanol, bio-oils, biomethane)
c. Decarbonized fossil fuels using CCUS (blue hydrogen, ammonia, methanol)
2. Secular deployment across sectors (industry, transport and built environments) and particularly the shipping industry is expected to play a leading role in deploying low carbon fuels.
3. Global trade flows of zero-carbon fuels
The IEA 2050 NZE forecasts that the global use of hydrogen will expand to 200 Mt in 2030 and above 500 Mt in 2050 and the low-carbon proportion of the hydrogen will rise from 10 percent to 70 percent in 2030. The interesting assumption is that it is expected that around half of the hydrogen produced will be green hydrogen and the rest blue hydrogen with the ratios varying regionally based on the availability of electrolyzers and renewable energy capacity in the case of green hydrogen. In the case of blue hydrogen, deployment will be heavily dependent on availability of feedstock (economically viable natural gas) and rapid growth in CCUS technology and the carbon value chain.
According to IEA NZE, in 2030, about 100 Mt of hydrogen will be produced using electricity and more than 300 Mt by 2050. In 2050, it is forecasted that shipping will consume approximately 17 percent of the hydrogen fuel, based on which we can estimate that the shipping demand will go up to 60 Mt by 2050.
The global electrolyzers capacity is forecasted to reach 850 GW by 2030 and 3,600 GW by 2050 which translates to an electricity demand of 3,850 terawatt-hour (TWh) and 14,500 TWh. Applying a one percent factor for shipping usage, the electricity demand is estimated to be 650 TWh and 2,465 TWh respectively in 2030 and 2050.
In this scenario, shipping’s share of global hydrogen is assumed to be one percent to four percent of annual consumption in 2100, if we assumed a mid-range of two percent of global demand by 2050. Taking the IEA forecast of 500 Mt in 2050 and applying a two percent deployment assumption for shipping, it is estimated that 10 Mt of hydrogen will be used in shipping. The proportion of green hydrogen according to IEA is expected to be half of the total hydrogen produced and consequently electricity demand will be proportional. This scenario also assumes that hydrogen as a fuel ramps up in the 2050s and reaches a high point in 2090 and stays consistent until 2100. Overall, this model does not consider hydrogen as an important part of the mix till later in the century but it is the only model that takes into consideration the impact of global disruptions like the pandemic and assumes a “health first” attitude in response.
The BP Net Zero in 2050 defines three different scenarios:
1. Rapid: Global temperature is limited to below 2° C by 2100 by reducing GHG emissions from energy use by 70 percent by 2050
2. Net zero: Additional measures over the Rapid Scenario leading to a 95 percent reduction emission by 2050
3. Business-as-usual (BAU): Assuming no change in fuel mix over the medium to long-term
Marine shipping had only a minor increase in energy demand particularly in the business-as-usual scenario and notes that shipping as an industry has many options compared to aviation to diversify its fuel mix which includes hydrogen, ammonia, liquefied natural gas (LNG) and biofuels. Shipping energy demand is expected to stay constant with gradual decarbonization of the fuel mix. The hydrogen demand in the rapid scenario is estimated to be two exajoules (EJ) and, in the net-zero scenario, about four EJ. One EJ is the equivalent of seven million tons or 78 billion cubic meters (m3) of gaseous hydrogen, 990 billion British thermal units (BTUs), 278 TWh of electricity, 170 million barrels of oil or 290 billion cubic feet of natural gas [130].
The Bloomberg New Energy Outlook, published in 2021, describes three long-term scenarios by 2050:
1. Green: green hydrogen dominant scenario with 85 percent of the global energy mix being renewable
2. Gray: fossil fuels (52 percent) are still the dominant energy source but with CCUS playing a major role along with renewables (42 percent)
3. Red: nuclear energy using small modular reactors are the primary energy source (66 percent)
In the green and red scenarios, it is estimated that biofuels and ammonia (based on zero-carbon hydrogen i.e., green hydrogen) will be responsible for between 18 percent and 35 percent reduction in emissions. The Bloomberg scenarios are electricity heavy and estimates between 62,200 TWh and 121,500 TWh for the gray and green scenarios respectively. The green scenario assumes that nearly half of the electricity produced is used for green hydrogen which indicates that the renewable electricity requirement will be 59,300 TWh. The shipping contribution to the usage while growing consistently, is not a major consumer leading to approximately 10 to 15 Mt of consumption by 2050 which represents about one percent of the total hydrogen consumed.
According to the International Renewable Energy Agency (IRENA), green hydrogen-based fuels are expected to play a major role in the decarbonization of the shipping sector to meet the goal of limiting temperature increases to below 1.5° C by 2050. It is estimated that the requirement of green hydrogen will be 46 Mt or 1,800 to 3,800 TWh in terms of electricity of which 74 percent will be used for ammonia production, 16 percent for methanol and the remaining 10 percent as liquid fuel hydrogen. To put this in perspective, the global capacity to produce renewable electricity is projected to reach 8,300 TWh in 2021 [126].
One of the stumbling blocks to deployment of green hydrogen at scale is the challenge of increasing renewable power capacity. Renewable energy sources are geographically and temporally dependent and for it to be cost competitive, it is imperative to devote effort to develop least-cost renewable power plants to allow for production of power fuels.
In the fuel mix scenarios modeled by ABS, the meta-analysis conducted takes into consideration the current fuel mix and new project announcements which are then forecasted into the future. This is considered a more robust methodology since, the forecasting analysis hinges on real projects and not projections based on other economic variables such as trade and gross domestic product (GDP) growth that are subject to a high level of uncertainty when applied down to a sector-level analysis. The base scenario assumes that total energy consumed by the shipping industry will rise from 185 million tonnes (MnT) heavy fuel oil (HFO) equivalent to 237 MnT in 2050. While oilbased fuels still dominate the fuel mix as of 2025 with nearly 80 percent of fuel being oil-based, it is expected to rapidly decelerate and reach about 25 percent of the fuel mix by 2050. Ammonia and hydrogen on the other hand is expected to rapidly take off from being negligible in 2025 to nearly 40 percent of the fuel mix by 2050. Based on our estimates, the increase in hydrogen/ammonia in the fuel mix is from zero Mnt HFO equivalent to a 93.7 Mnt HFO equivalents in 2050. This increase can be described as exponential, and it is contingent upon the maturity of the hydrogen value chain which includes development of renewable energy capacity for green hydrogen and CCUS deployment at scale for blue hydrogen.
Details of the assumptions and results of the fuel mix scenario is explained in the update of future fuel mix section.
Ammonia and hydrogen will be a major part of the rapid decarbonization of the shipping industry in any netzero scenario by 2050. Electricity production, electrolyzers technological maturity, manufacturing capacity and deployment of CCUS at scale are on the critical path for the long-term success of these fuels. While all projections seem to indicate hydrogen and consequently ammonia being a major component of the fuel mix, there are still many uncertainties before these fuels can truly take off. In the short-term biofuels will play a key role in reduction of CO2 from shipping, over the medium and long term, green hydrogen-based fuels which includes ammonia, methanol will start gaining precedence. Renewable ammonia is expected to be the backbone of shipping decarbonization and could represent upwards of 40 percent of the fuel mix in 2050 [127].
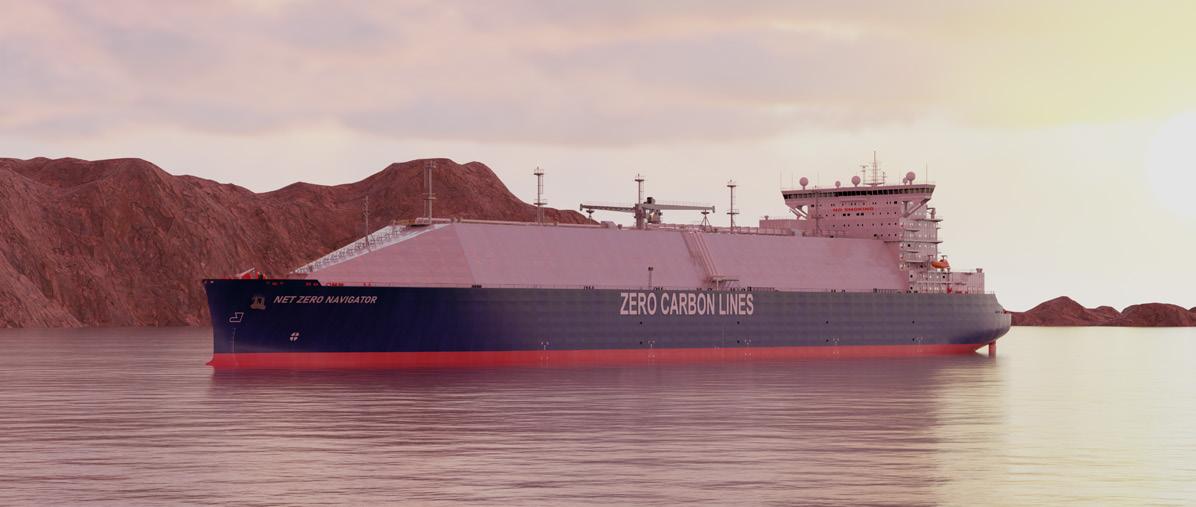
It is common understanding now that carbon capture is vital part of the transition to net zero. It provides solutions for current energy assets, as well a pathway for rapidly scaling up low-emission hydrogen production. However, the capacity of infrastructure may still prove to be a limiting factor used for carbon capture, utilization and storage (CCUS) in the mid- and long-term [21].
Hydrogen, captured carbon and biomass are the most promising elements for making sustainable fuels. They are the key ingredients for creating a set of zero-carbon fuels.
The following figures show the importance of scaling up the production of renewable energy, as well as using fossil fuel-based hydrogen with carbon capture as a transition option.
Alternative fuels such as green ammonia and green hydrogen have immense potential to lower the carbon footprint of shipping. However, one of the challenges of these prospective alternative fuels, is their lower energy content compared to conventional fuel oils such as HFO.
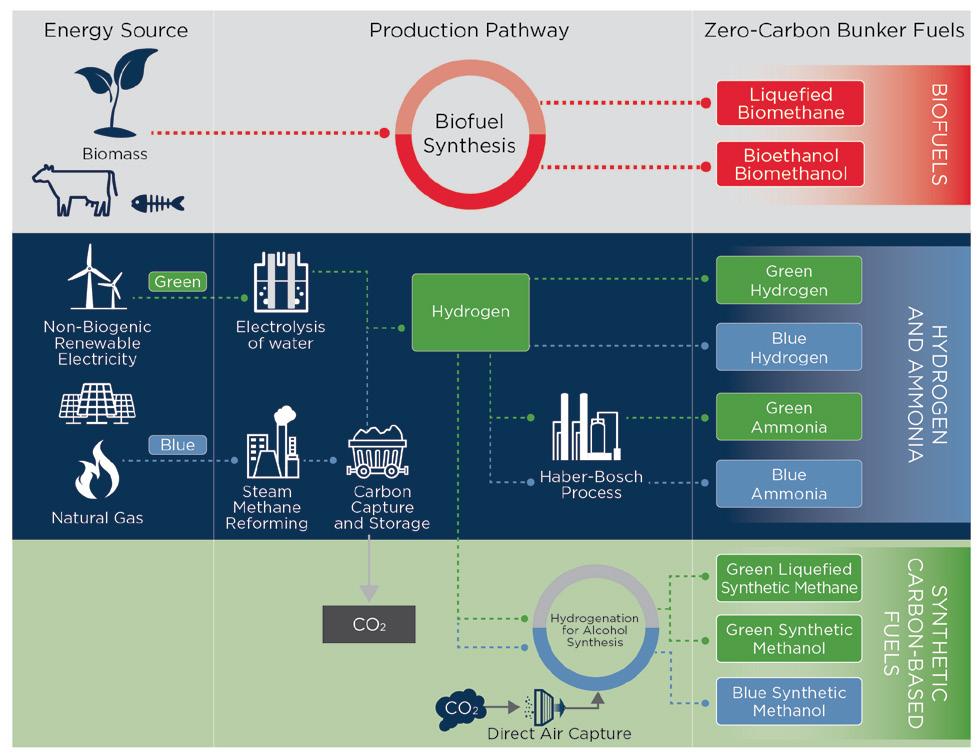
Hydrogen has the highest energy content per mass of all chemical fuels at 120.2 megajoules per kilogram (MJ/kg). In terms of mass energy, it exceeds MGO by 2.8 times, and alcohols by five to six times. Therefore, hydrogen fuel can increase the effective efficiency of an engine and help to reduce specific fuel consumption.
However, due to its lower volumetric energy density, liquid hydrogen may require four times more storage space than MGO or about two times more space than LNG to produce the equivalent amount of energy.
When comparing the energy and required volumes of fuels, it is also important to consider the energy efficiencies of the consumer, or the electrical energy losses in fuel cells. True for all marine fuels, additional volumes of fuel may be required to account for the power lost from the tank to the output shaft.
As more experience is gained from pilot projects, the marine industry is expected to adopt hydrogen as an environmentally-friendly fuel of choice.
Unlike fossil-based petroleum marine fuels, which are exported from resource-rich countries, hydrogen can be produced in any country to secure an energy-independent ecosystem. For this reason, national governments are developing agendas to include it in their energy plans; this may in turn help to quicken the pace of global production, including the amount available for marine fuel.
Figure 26: Main zero-carbon bunker fuel options for shipping [21].Ammonia is carbon-free and its synthesis from renewable power sources is a carbon-free process. Like hydrogen, it can be produced from fossil fuels using green methods such as carbon capture and combined renewable energy, both of which may influence its cost competitiveness.
Currently, ammonia is produced in large scale from the hydrocarbon fuels that are used to produce hydrogen by reforming methane with steam. The nitrogen for production is extracted from the air after liquefaction.
Renewable energy sources can be used to produce hydrogen from the electrolysis of water and later synthesized to ammonia. In this case, ammonia has zero-carbon intensity during production or use. If enough can be produced using carbon-neutral technology, ammonia has a significant potential to help meet International Maritime Organization’s (IMO’s) GHG-reduction targets for 2050.
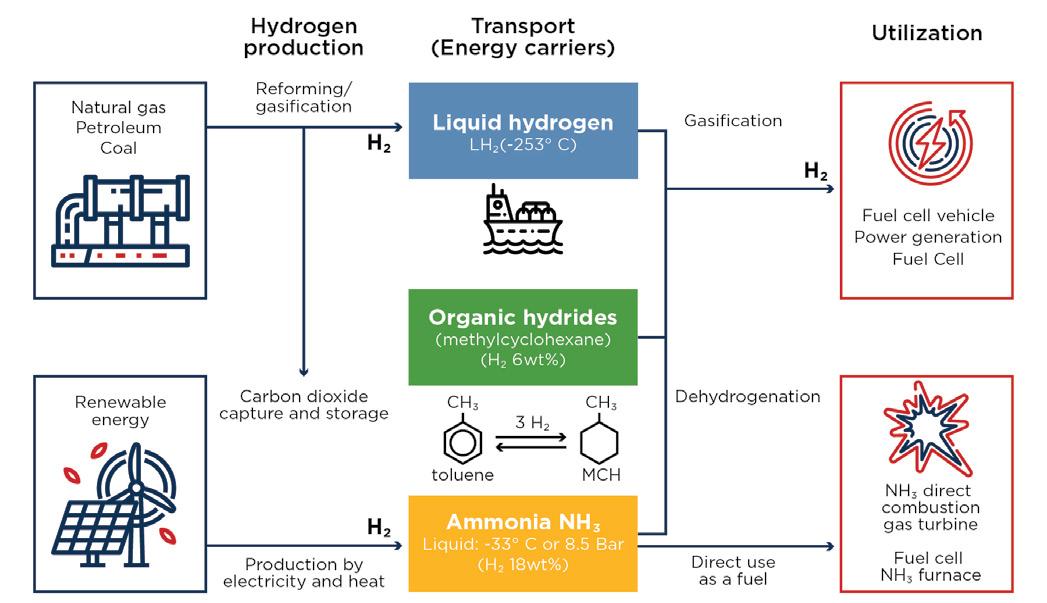
Ammonia has a higher volumetric energy density than liquefied hydrogen, closer to that of methanol, which reduces the need for larger tanks. The size of ammonia storage tanks will be significantly smaller than of those used for liquid hydrogen for the same energy requirement, even more so considering the volume of insulation required.
The fuel characteristics of ammonia enable the use of Type C or prismatic tanks and they require significantly less energy for re-liquefaction than hydrogen or LNG.
Carbon-neutral fuels such as biofuels also have a great potential to support the transition to alternative fuels. Dropin fuels such as biodiesels can be used in increasingly higher percentage blends to lower the emissions from marine vessels with little change to their current operations.
However, some of the current challenges with using drop-in fuels is their limited availability and the high cost of production. With supporting regulation, biodiesels can be a beneficial contributor to lowering GHG emissions in short-sea shipping or between ports, where refueling may be more readily available. The use of biofuels is expected to grow due to its potential similarities to marine petroleum, and the ease of distribution, storage and bunkering.
Figure 27: Hydrogen and ammonia production and use [22].Figure 28: General production life cycle of biofuels [23].
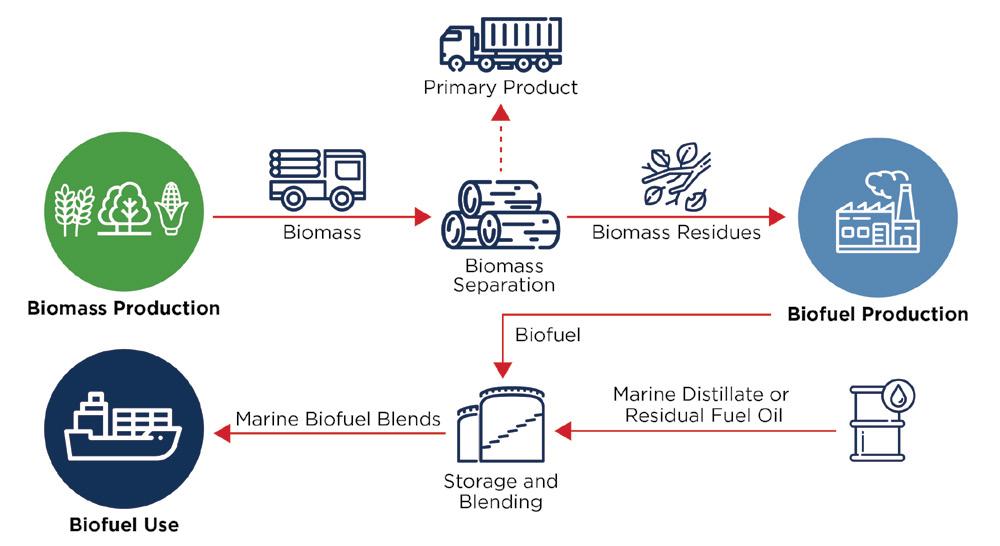
Using renewable energy to produce electro-fuels from hydrogen could reduce the energy required for their production and reduce their life-cycle carbon footprint. This technique can be applied to any of the three fuel pathways used to produce e-LNG, e-methanol or e-diesel.
Electro-fuels have the potential to offer carbon-neutral propulsion and provide carbon-reduction solutions in the medium- to long-term. In addition to fossil and biomass sources, electro-fuels can be produced by carbondioxide recovery (CDR), a technique that converts CO2 to syngas, which in turn can be used to produce bio-LNG or biomethanol.
CDR has the potential to remove CO2 from the atmosphere and use it to produce electro-fuels, minimizing the energy used for fuel production and enhancing their potential to reduce global warming
Methanol’s advantage, over gas fuels that require cryogenic conditions and materials, is its liquid state in ambient conditions and its ability to efficiently repurpose existing infrastructure and vessels, with retrofits. It is significantly easier and more economical to store on board. Retrofitting a vessel’s tanks from conventional fuel oil, ballast or slop to hold liquid methanol fuel is easier than installing cryogenic tanks.
One of the challenges of using methanol as an alternative fuel is its lower energy content than conventional fuel oils. However, as methanol is a liquid at ambient temperature and pressure, fuel tanks can be converted with minor retrofitting to hold the larger volumes required to produce an equivalent amount of energy.
Further, methanol’s use as a marine fuel only may require the existing trade, storage and production activities to be scaled up. Bunkering facilities and fuel-supply systems need to be developed and expanded, and present research is exploring ways to rapidly increase the infrastructure and develop onboard applications and installations.
There is a wide range of fuels with different levels of technology readiness that will provide a more flexible and sustainable energy system. The compatibility of e-methanol and ammonia with present propulsion and powergeneration systems makes them attractive alternatives to other zero-emission fuels.
International shipping is responsible for a large part of the global shipping emissions, and large and very large ships are responsible for about 85 percent of the net GHG emissions associated with international shipping [25]. This figure shows it is crucial to implement measures on an international scale. While there is no current global goal for shipping to become net zero, some countries and regions have been setting targets to achieve net-zero GHG emissions.
An effectively designed international carbonpricing mechanism is considered as part of a number of proposed market-based measures (MBMs) which have been suggested to help drive towards net-zero. To reach a net-zero target by 2050, the average carbon price is forecast at $360/ tCO2 [26]. However, it is assumed that the carbon price can be lowered by up to half provided the revenue is used to support the decarbonization of shipping [26].
The possibility of applying these taxes has been debated at length, making it clear that a global alliance and the political will be required to make alternative clean fuels cost competitive. In addition, the initiative to implement carbon pricing is expected to generate revenue that can be used for financing both research and development activities and infrastructure needs.
The idea of carbon pricing has been gaining traction in recent years, with many countries already using this strategy to reduce climate change and its negative impacts as shown in the figure above. The concept of cap-and-trade carbon pricing is explained in detail in the following sections.
In April 2018, the initial IMO strategy on the reduction of GHG emissions from ships was published with the following goals: reducing CO2 emissions per transport work (carbon intensity) by at least 40 percent by 2030 and reducing the total GHG emissions by at least 50 percent by 2050 [84].
During the Marine Environmental Protection Committee (MEPC) Session 77, held from November 22 to 26, 2021, a proposal was received to expand the IMO’s climate-related ambitions to reach zero GHG emissions by 2050, instead of reducing GHG emissions by 50 percent.
Although the Committee did not support the draft resolution, they agreed that there was a need to review and update the IMO’s initial GHG strategy, including target updates, impact assessments and the future availability of fuels.
It has become clear that the IMO’s carbon emissions reduction targets will get progressively tougher and therefore ship operators and organizations in the industry’s value chains are looking at all options available to expedite their transition towards a low-carbon environment while concurrently serving the ever-growing global demand for trade transport.
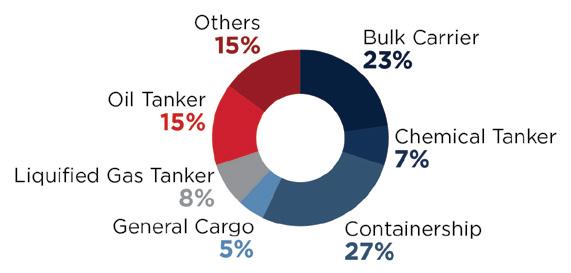
One area earmarked for progress is carbon capture and storage (CCS). According to the Intergovernmental Panel on Climate Change (IPCC) and the IEA, the annual global capacity for carbon capture will need to increase multifold from 50 million metric tons of carbon dioxide (Mt CO2) in 2020 to 800 Mt CO2 per year by 2030 and more than 5,000 Mt CO2 by 2050 [4]. This represents a 16-fold increase by 2030 and a 100-fold increase by 2050 in carbon capture capacity. Fuel transformation should be the fastest adopter of CCUS, because industrial heat is difficult to electrify; and low-carbon fuels are the path of least resistance.
Kearns et al. has estimated that total global storage capacity is between 8,000 gigatons (Gt) and 55,000 Gt and even the lowest estimate far exceeds the 220 Gt of CO2 that is expected to be stored over the period 2020 to 2070 according to the IEA’s Sustainable Development Scenario. About 75 percent of the estimated storage is onshore in deep saline formations and depleted oil and gas fields but there is significant offshore capacity (about 25 percent). The following figures summarize the estimated storage capacity.
Applying the same offshore storage capacity factor to the annual global capacity of carbon capture required, we can calculate that the onshore CCUS market will need to increase to 200 Mt CO2 by 2030 and 1,250 Mt CO2 by 2050.
Figure 29: Voyage based allocation of energy consumption for international shipping [25]. IMO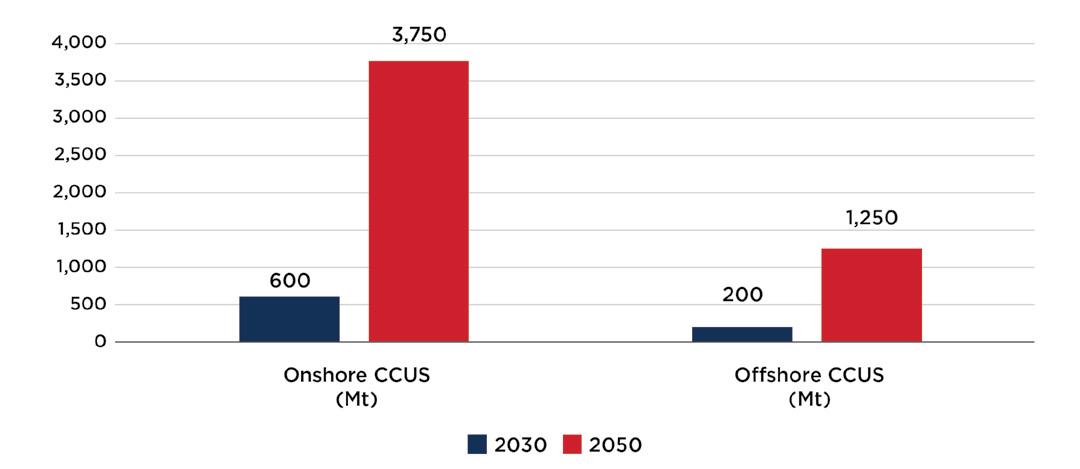
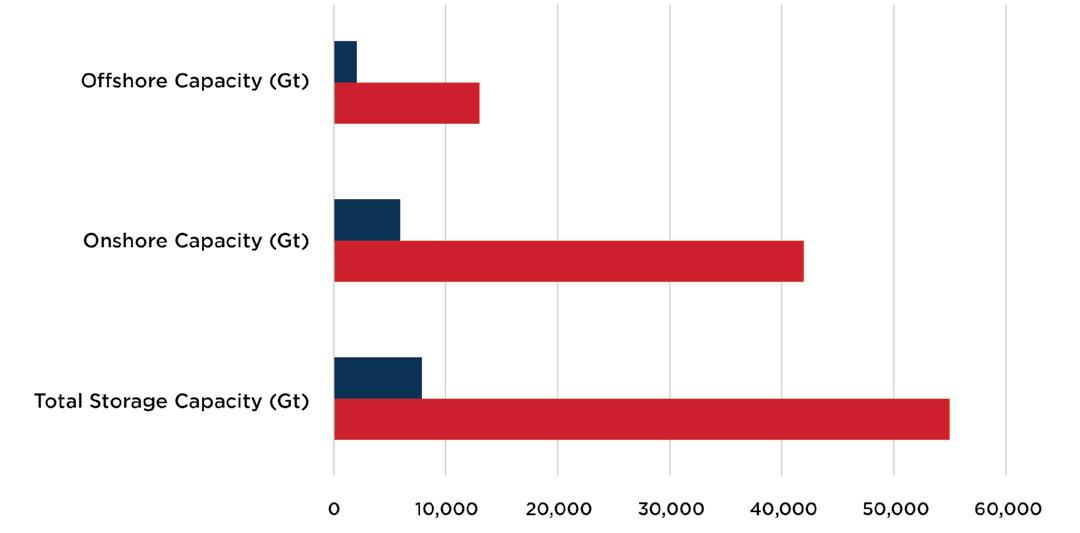
 Figure 30: IEA estimate for onshore vs. offshore CCUS market in Mt of CO2 (2030 and 2050).
Figure 31: Kearns et Al. estimation of global onshore and offshore storage capacity.
Table 6: Summary of Data on Storage Capacity, Onshore and Offshore Capacity. Source: Kearns et. Al, 2017.
Figure 30: IEA estimate for onshore vs. offshore CCUS market in Mt of CO2 (2030 and 2050).
Figure 31: Kearns et Al. estimation of global onshore and offshore storage capacity.
Table 6: Summary of Data on Storage Capacity, Onshore and Offshore Capacity. Source: Kearns et. Al, 2017.
From a shipping industry perspective, the transport of CO2 by ships has a unique business case, particularly for dislocated emitters over long distances and for smaller quantities. Although pipelines are a mature technology, they require a continuous flow of compressed gas and their user costs are highly dependent on distance.
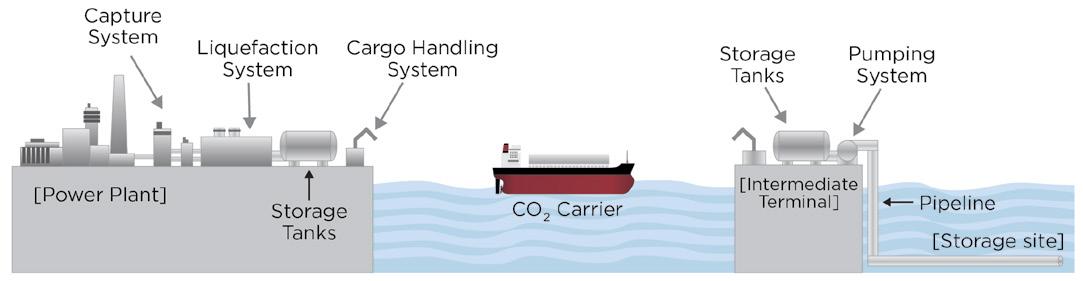
The figure below is a schematic of the CO2 shipping chain from the source to storage. It illustrates the process of CO2 being captured from a power plant, liquified and stored. It is then loaded onto a CO2 carrier and delivered to the final port of destination and connected to the end point transmission line.
The CCUS value chain is extensive and has implications well beyond the shipping industry which will play a very important role of transporting the CO2 from the point of capture to the point of storage (offshore geological storage or enhanced oil recovery [EOR]) or the point of utilization — biological utilization: greenhouse and algae growth, mineralization (construction material); chemical utilization: baking soda, bioethanol, carbon fers, ethanol, fertilizers. The schematic below provides a high-level summary of the carbon value chain from capture to transport to storage and utilization.
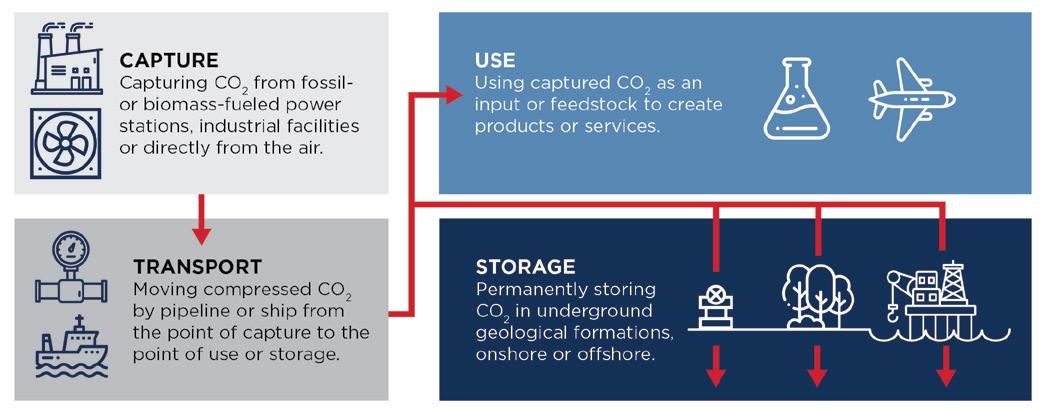
Currently, liquified CO2 shipping is mostly used in the food and beverage industry for capacities varying between 800 m3 and 1,000 m3, but is understood that for CCUS applications, the capacities need to be much larger.
The current market for CO2 utilization is estimated to be 230 Mt CO2 per year and is instrumental in the production process for fertilizers, oil and gas and the food and beverage industries. It is estimated that the CO2 commodity market could increase up to one to seven Gt CO2 per year by 2030 as new routes to carbon utilization are unlocked such as usage in fuels, chemicals and building materials. The utilization value chain is very complex and may not develop as fast as required to help with reducing GHG emissions, requiring the disposal of CO2 to be injected into geological formations [95].
Figure 32: Carbon dioxide shipping chain. Figure 33: Carbon capture value chain.The transportation of CO2 for geologic sequestration will involve the development of infrastructure for both pipelines and shipping and in many cases project economics may dictate against each of these solutions. For example, if the amount of CO2 required to be stored is small or there is inconsistent flow, then pipelines may not be the most appropriate option.
Numerous studies have shown that shipment is economically advantageous over pipelines for distances greater than 700 kilometer (km) and quantities greater than six Mt CO2 per year. As of April 2022, there are four liquid carbon dioxide (LCO2) carriers in operation (mostly in service for the food and beverage industry) and three others currently on order (see table below) by various operators, including the northern lights project specifically to service the burgeoning need for transporting liquid CO2 for offshore sequestration. With carbon capture being a major part of the decarbonization journey of the economy worldwide, the demand for LCO2 carriers, for transportation to the storage site, is expected to increase.
The northern light projects involved developing infrastructure to transport CO2 from capture sites by ship to a terminal in western Norway for intermediate storage before being transported by pipeline for permanent storage in a reservoir 2,600 m (meters) under the seabed. This project is one component of the Norwegian government's CCUS project “Longship” and is expected to have a capacity of 1.5 Mt CO2 per year as part of phase one.
Once the CO2 is captured, it is expected to be transported by newly designed ships, injected and permanently stored 2,600 m below the seabed of the North Sea. The plan is to expand capacity by an additional 3.5 Mt based on the market demand.
There are numerous other projects in the pipeline such as the Acorn CO2 SAPLING project in the United Kingdom (U.K.). Additionally, offshore storage capacity has been identified off the coast of Japan and is considered a fit case for source-sink matching due to the presence of concentrated CO2 emitters near the coastline.
According to a 2018 study by the European Zero Emission Technology and Innovation Platform (ETIP ZEP), it is estimated that 600 vessels will be required for CO2 transport due to the burgeoning CCUS application for supporting the CCUS sector in Europe. Although, the study was European Union (EU) specific, the CO2 vessels will support the development of the carbon value chain all over the world.
As of April 2022, there have been three vessels ordered for offshore sequestration purposes and if the market follows the IEA estimation of needing a 16-fold increase in CCUS capacity by 2030 and a 100-fold increase by 2050, we can estimate that the number of vessels required will be 48 in 2030 and 300 by 2050. The range varies between 50 to 600 vessels, between 2030 to 2050, the specific number is not as important as the overall trend upwards.
The ships currently on order are expected to be launched by 2023 and 2024 and are expected to satisfy future demand which is a major assumption, since this is a singular data point which could be an underestimation of future need. If additional ships are ordered, which is likely, considering the expected growth of this market, the size of the LCO2 market could grow to two to three times the current estimate.
In response to the growing demand, Hyundai Heavy Industry (HHI) and Korea Shipbuilding & Offshore Engineering Co, Ltd (KSOE) have developed a design for a new 40,000 m3 LCO2 carrier design.
ABS and Daewoo Shipbuilding & Marine Engineering Co., Ltd (DSME) are developing designs for a 70,000 m3 very large LCO2 carrier and have recently obtained design approval. The vessel measures 853 ft in length and with a beam of approximately 145 ft, making it the largest LCO2 carrier that has been certified by a classification society.
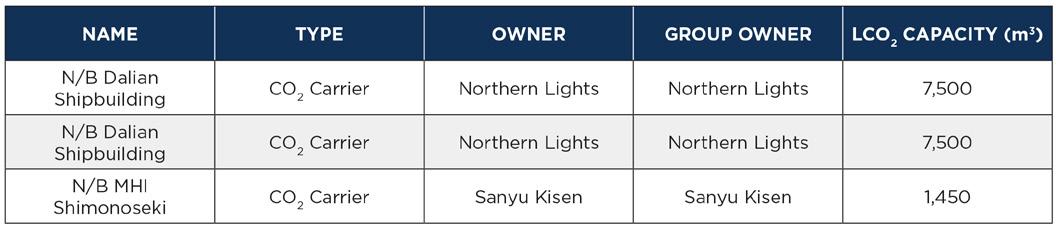 Table 7: LCO2 carriers ordered for CCUS service as of April 2022.
As the size of the vessels get larger, the number of vessels may reduce, but the total capacity required will follow the market trend, leading to a greater need for LCO2 carriers. There are several assumptions and variables in estimating the size of the market such as CCUS market size, projects announced and the success of those projects, economic climate and disruptions such as COVID and it is still uncertain how big the market will eventually be, but as and when new projects are announced and source-to-sink matching is done, it is apparent that a new vessel will be required to satisfy the demand for offshore storage.
In addition, the CO2 utilization market is nascent and there is large variability in the expected growth of the market, pulling in additional demand and leading to further growth in the size of the LCO2 vessel market.
Figure 34: LCO2 Carrier Estimates (2022–2050).
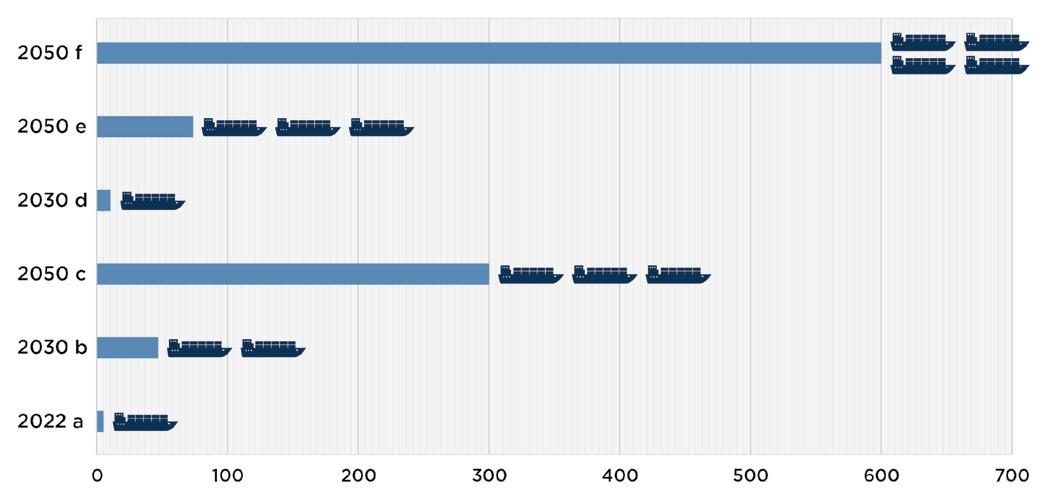
a. The number of vessels ordered for carbon storage application (Northern Lights (2) and Sanyu Kisen)
b. Represents a 16-fold increase to meet the IEA estimated total CCUS requirement of 800 million tonnes per annum (mtpa) from 50 mtpa in 2020
c. Represents a 100-fold increase to meet the IEA estimated total CCUS requirement of 5,000 mtpa from 50 mtpa in 2020
d. Represents a four-fold increase to indicative of the offshore proportion of the total CCUS market which is assumed to be indicative of the need for LCO2 carrier by 2030 (200 Mt CO2 out of 800 Mt CO2)
e. Represents a 25-fold increase to indicative of the offshore proportion of the total CCUS market which is assumed to be indicative of the need for LCO2 carrier by 2050 (1,250 Mt CO2 out of 5,000 Mt CO2)
f. EU Zero Emission Technology and Innovation Platform Study Estimate, 2018
Also, it is possible that the offshore sequestration market may take off quicker than the onshore market due to permitting complexities near population centers and the need for pipelines to transport the CO2. Although onshore storage capacity is extensive, it may not convert into viable projects and depending on the momentum of initial project successes, offshore projects may provide a path for accelerating the deployment of LCO2 vessels, as an important piece of the CO2 value chain.
In terms of technical feasibility, the long-distance transportation of CO2 poses no more risk than natural gas transmission, since the asset technology is mature and many CO2 pipeline networks already exist. However, pipeline transportation cost is very dependent on distance, so shipping is being for considered for specific situations.
One of the drawbacks of using shipping is the need for a liquefaction facility at the point of origin; in comparison, CO2 can be compressed to its super critical phase and then transported via pipeline. In addition, shipping’s CO2 transport technology is not yet considered mature, with only a few commercial projects currently operational.
With CCUS expected to take off dramatically during this decade, it is a very important part of the solution mix to achieve the goal of net zero. As more offshore CCUS projects come online and the carbon value chain matures, it is very likely that the demand for LCO2 carriers will increase and will be a key part of its success.
For shipping to decarbonize, choosing the right pathway will be complex; but all pathways will require the use of carbon capture technologies at scale and low-carbon fuels. The carbon technologies include: CCUS, direct air capture, and bioenergy with CCS, which is the process of capturing and storing CO2
Carbon can be separated using several methods, including membranes, solid sorbents and liquid sorbents, all of which have been proven effective in onshore carbon capture projects.
Chemical absorption is the most common purification technology. The absorption process works by contacting CO2 with a chemical in an absorption column.
Physical separation is currently the main capture method used in natural gas processing with most of the large-scale gas processing plants using proprietary solvents.
The membrane separation process is used to separate the CO2 from the gas mixture by using a polymer membrane. It consumes less energy, so the cost is cheaper than other types of CCUS.
Oxy-fuel separation involves the combustion of fuel using nearly pure oxygen and the subsequent capture of the CO2 emitted.
Calcium looping is a technology that involves CO2 capture at a high temperature using two main reactors. In the first reactor, lime (CaO) is used as a sorbent to capture CO2 from a gas stream to form calcium carbonate (CaCO3).
Chemical looping is similar two-reactor technology. In the first reactor, small particles of metal are used to bind oxygen from the air to form a metal outside, which is then transported to the second reactor where it reacts with fuel, producing energy and a concentrated stream of CO2, regenerating the reduced form of the metal.
Direct separation involves the capture of CO2 process emissions from cement production by indirectly heating the limestone using a special calciner. This technology strips CO2 directly from the limestone, without mixing it with other combustion gases, thus considerably reducing energy costs related to gas separation.
The capture of CO2 can occur pre-combustion (syngas), post combustion (end-of-pipe solutions) and by using oxyfuels. The captured CO2 is then compressed into a liquid state and transported by pipeline, ship or truck.
The post-combustion method captures the CO2 after the fuel is combusted and produces a product that will require additional drying, purification and compression before transportation. This is the most mature technology, but the low partial pressure of the CO2 in the flue gas is a big downside.
Pre-combustion capture involves transforming the fuel into an intermediate non-carbonaceous form called syngas, which is mostly composed of H2 and CO2. The CO2 is captured before being combusted and the H2 is the fuel, when combusted, that releases water vapor.
Oxy-combustion is when the burners are modified to burn fuel in pure oxygen, instead of air leading to a pure CO2 stream (the nitrogen oxides are prevented and there is no need for CO2/N2 separation) and increased energy efficiency. The downsides are the need for large amounts of O2 and high combustion chamber temperatures.
Figure 35: CO2 Separation Technologies.DAC technologies directly capture CO2 from the atmosphere instead of a point source, such as a power plant with higher CO2 concentrations, and can be stored in deep geological formations, utilized in food processing or combined with hydrogen to produce syn-fuels.
The two commonly used technologies are liquid and solid DAC. In the case of liquid DAC, the air passes through a caustic solution such as a hydroxide solution which removes the CO2, then the chemicals are recycled into the process and the air is pumped back into the atmosphere without the CO2. Solid DAC uses sorbents filters that bind the CO2 to the surface of the filter. The filters are heated to a high temperature, releasing the bound CO2 as concentrated CO2, which can then be captured for storage or utilization. The CO2 in the atmosphere is of low concentration when compared to flue gas from an industrial source and hence, the energy needs are higher and decarbonization of the energy source is paramount to truly make the process net negative.
Capture costs currently vary between $100 per tonne to $1,000 per tonne which makes it very expensive, and the costs can only be reduced with additional deployment. As of 2021, there are 19 DAC plants operating worldwide, capturing about 0.01 Mt CO2 per year, with advanced developments underway in the U.S. which could reach nearly one Mt CO2 per year. In September 2021, a four kiloton (Kt) CO2 per year plant came online in Iceland that stores the CO2 in basalt formations. The IEA’s 2050 net-zero emissions scenario requires DAC to be scaled up to 85 Mt CO2 per year by 2030 and 980 Mt CO2 per year by 2050.
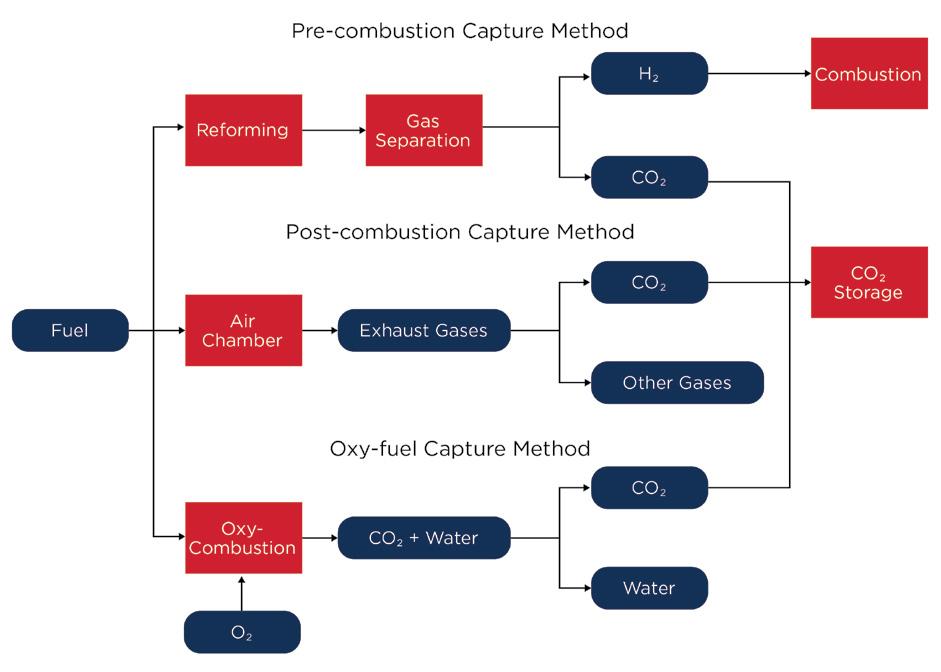
Figure 37: CO2 capture by direct air capture in the net-zero scenario, 2020-2030.
IEA (2022). Direct Air Capture: A key technology for net zero. All rights reserved.
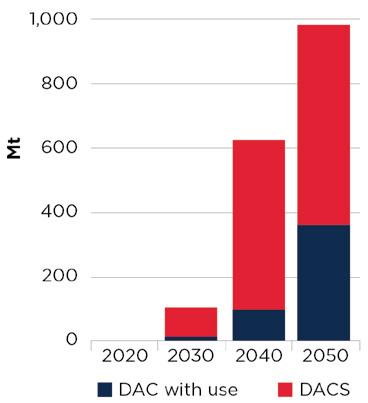 Figure 36: Three carbon capture approaches.
DAC is receiving great attention from private and public sectors. Private companies, particularly in the transportation sector, are very supportive of DAC and many are investing to become carbon neutral by 2050.
DAC has a very important role to play, but it is still very nascent as of 2021 and the volumes of removal are magnitudes lower that what is currently required. As the technology is further deployed and there are reductions in the cost of removal, DAC will become an important part of the energy transition journey [96].
As established in numerous studies, the most promising low-carbon fuels include ammonia, methanol, hydrogen, methane and bio-oils. Many of these would require CCS to achieve low-carbon status; for example, blue hydrogen is manufactured through a process of steam methane reforming with carbon capture.
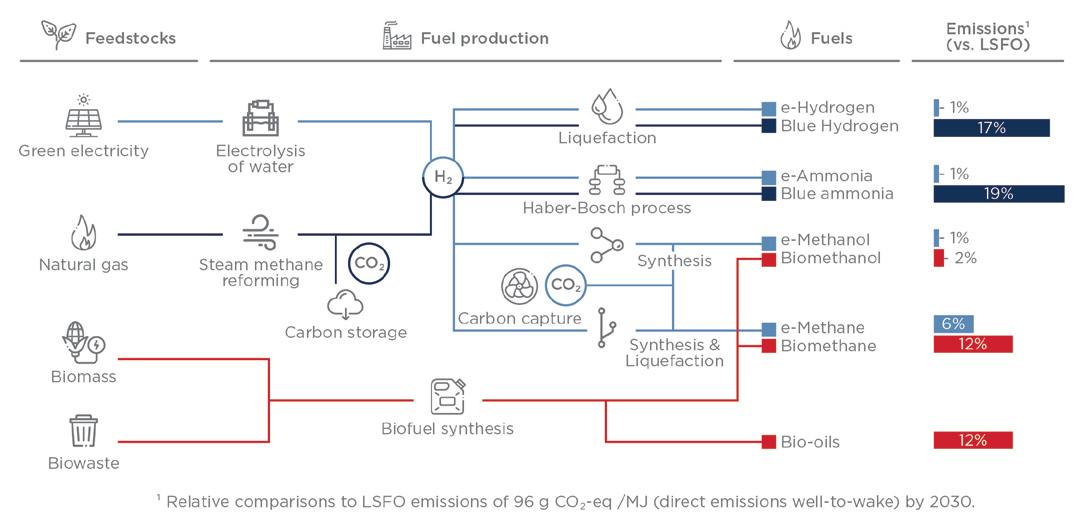
Blue hydrogen’s biggest challenge will be controlling the upstream fugitive methane emissions from the production and transmission of natural gas; these may eventually prevent it from being considered a low-carbon fuel when the entire supply chain is taken into consideration.
Methane has a 20-year global warming potential (GWP) which is 86 times higher than CO2; its 100-year GWP is 25 times higher than CO2. A GWP is defined as the heat that is absorbed by any GHG in the atmosphere, as a multiple of the heat that would be absorbed by the same mass of CO2
Methane’s GWP rates it among the super pollutants. Over the medium term, controlling it will play an outsized role in keeping the average change in global temperature below 1.5° C compared to pre-industrial levels, a target set in the Paris Accord [88].
Creating the green types of hydrogen, ammonia, methanol and methane all require the use of renewable energy; the main restriction to their production will be building the capacity to create enough renewable energy.
The cleanest pathway to decarbonization, in comparison to low-sulfur fuel oil (LSFO) is renewable electricity, but the cost of electrolyzers, a system that uses electricity to break water in hydrogen and oxygen, and any bottlenecks caused by a limited capacity to produce renewable energy will prevent its growth.
Figure 38: Overview of different fuel production pathways. Mærsk Mc-Kinney Møller Center for Zero Carbon ShippingAccording to a recent report, the amount of financing required for shipping to meet net zero by 2050 is about $2.4 trillion (T), with $1.7T alone needed to develop alternative fuels [89]. Most of the expenditure will be required of the energy and chemical industries to produce hydrogen feedstock, for fuel synthesis, storage and distribution.
Shipping is expected to invest about $200 million (M) on new engines and onboard storage solutions. This anticipated capital outlay will be a huge market opportunity for the fuel manufacturers but also for those freight operators that get ahead of the curve in transitioning towards alternative low-carbon fuel operations as it is expected that many climate-conscious consumers may be willing to pay a small carbon premium, which will create a new equilibrium in the marketplace from a pricing standpoint.
The alternative fuels market is a huge opportunity for the oil and gas industry, as well as for engine and turbine manufacturers.
Control system manufacturers that design onboard CCUS devices will need to find ways to make their products more cost competitive and resolve the CO2 storage, power consumption and space issues on vessels. Once they are proven to be technically feasible, end-of-pipe solutions will be rapidly deployed to support decarbonization.
Reprinted with permission from, “Global Shipping’s Net zero Transformation Challenge” © 2022 Boston Consulting
Figure 39: The total global investment required, 2020–2050.
As an end-of-pipe solution to reduce vessel emissions, CCUS is still in its infancy; present land-based CCUS equipment cannot be used on ships because its power consumption and space requirements are huge challenges.
In addition, the system’s capture efficiencies are not proven, and storage on board is difficult. Solidification to minimize the impact of ocean waves has been proposed [90].
Integrating a CCUS system on board would involve additional capital and operational costs from retrofitting and there would need to be a clear value chain established for captured carbon for it to be economically viable [91].
However, a few operational projects have shown promise. Mitsubishi Heavy Industries has begun verification testing of a marine-based CO2 capture system as part of its “CC-Ocean” project in partnership with Kawasaki Kisen Kaisha, Ltd. (“K” Line) [92]. It was the world’s first demonstration test to be conducted during ocean navigation, and the captured stream produced a purity of 99.99 percent, a quality that can be used in several applications.
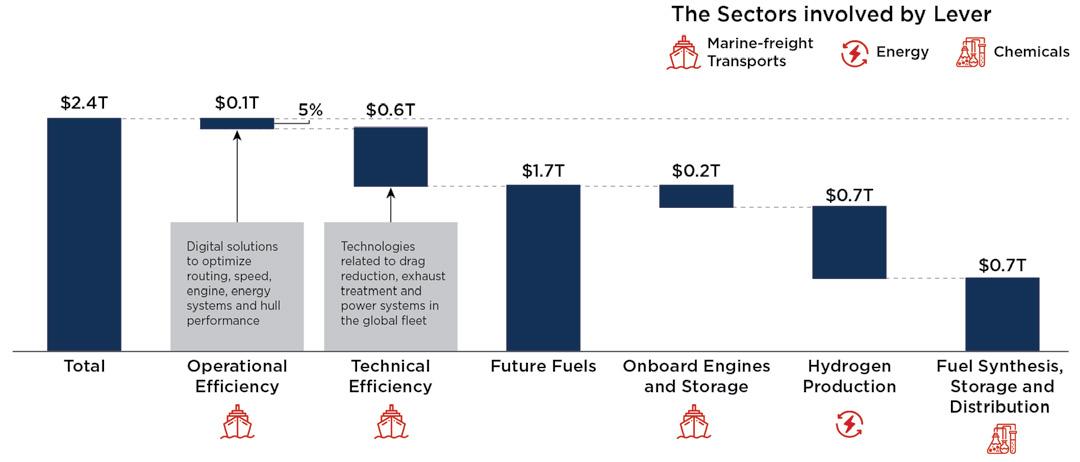
As the world aggressively decarbonizes and the CO2 supply chain matures, the role of CCUS will only grow. The growth of CCUS could help fill demand for more long-distance transportation and bring the shipping industry to the forefront.
With the shipping industry having played a major role in developing the marine supply chains for natural gases, it is only a matter of time before its services become indispensable to the CO2 supply chain.
In addition, the development of alternative fuels to decarbonize sectors that are difficult to abate, which include long-distance shipping, will give CCUS an important role in building the hydrogen and ammonia economies. Shipping will be a key component in the long-distance transport of ammonia.
Efforts to put CCUS on board vessels are very much in their infancy; with just a few pilot studies executed, it has a long way to go before it can be considered a viable technology. However, there are a few green shoots and it will move up the maturity scale very quickly with more adoption.
One of the transitional strategies to address the emissions-reduction goals of the IMO and other regulatory bodies is to identify the biofuels that could be readily used in two-stroke or four-stroke marine diesel engines with minimum or zero modifications.
Apart from acting as a drop-in, carbon-neutral solution that can support the transition of the existing fleet to lower carbon intensity, biomass can also provide the required carbon for synthesizing other carbon-neutral fuels, supporting the conversion of hydrogen to other energy carriers such as methanol.
Processes such as gasification of waste biomass, will provide the required carbon molecules that can be used in order to convert hydrogen produced by renewable energy sources into other carbon-neutral fuels such as methanol. Similar processes can be used to deliver synthetic natural gas (SNG).
Regarding bio-oil fuel blends, an increasing number of shipowners have started to test biofuel blends, as the degree of carbon reductions can be determined by the ratio of the biofuel blended into the fossil fuel of choice. Industry is presently focused on the onboard testing of higher blend ratios (B20-50). These blends mainly consist of a percentage (20 to 50 percent) of fatty acid methyl esters (FAME) blended into a very low sulfur fuel oil (VLSFO). ABS is helping shipowners to measure the related exhaust-gas emissions in a number of projects.
Using biofuels can reduce a significant amount of the well-to-tank part of the overall GHG emissions. However, an exhaustive life-cycle analysis must be carried out to ensure all parts of biofuel production — such as feedstocks, conversion technology and transportation processes — are sourced and conducted in the most sustainable way possible.
Biofuels are classified in four distinct categories based on the feedstock used for their production.
These include:
• First generation biofuels are derived from food crops
• Second generation biofuels are based on (non-food) biomass, which include lignocellulosic feedstock and different kinds of waste products
• Third generation biofuels are based on algae — the technology to produce this category of biofuel is in the research phase.
• Fourth generation biofuels are also in the research phase; the goal is for them to be developed using genetically modified micro-organisms and crops as feedstocks
According to the International Council on Clean Transportation (ICCT), the most important factor in the production process that determines a sustainability rating for each biofuel is the feedstock. As such, the first generation of biofuels are less likely to be used to support the maritime industry’s demand for cleaner fuels, as this also would have a direct impact on the areas available for food production.
The second generation is a more appealing option because waste products are used as feedstock; however, the availability, quality and quantity of these feedstocks can add complexity to the production of biofuels. Here are some other factors restricting the rapid uptake of biofuels in the maritime industry:
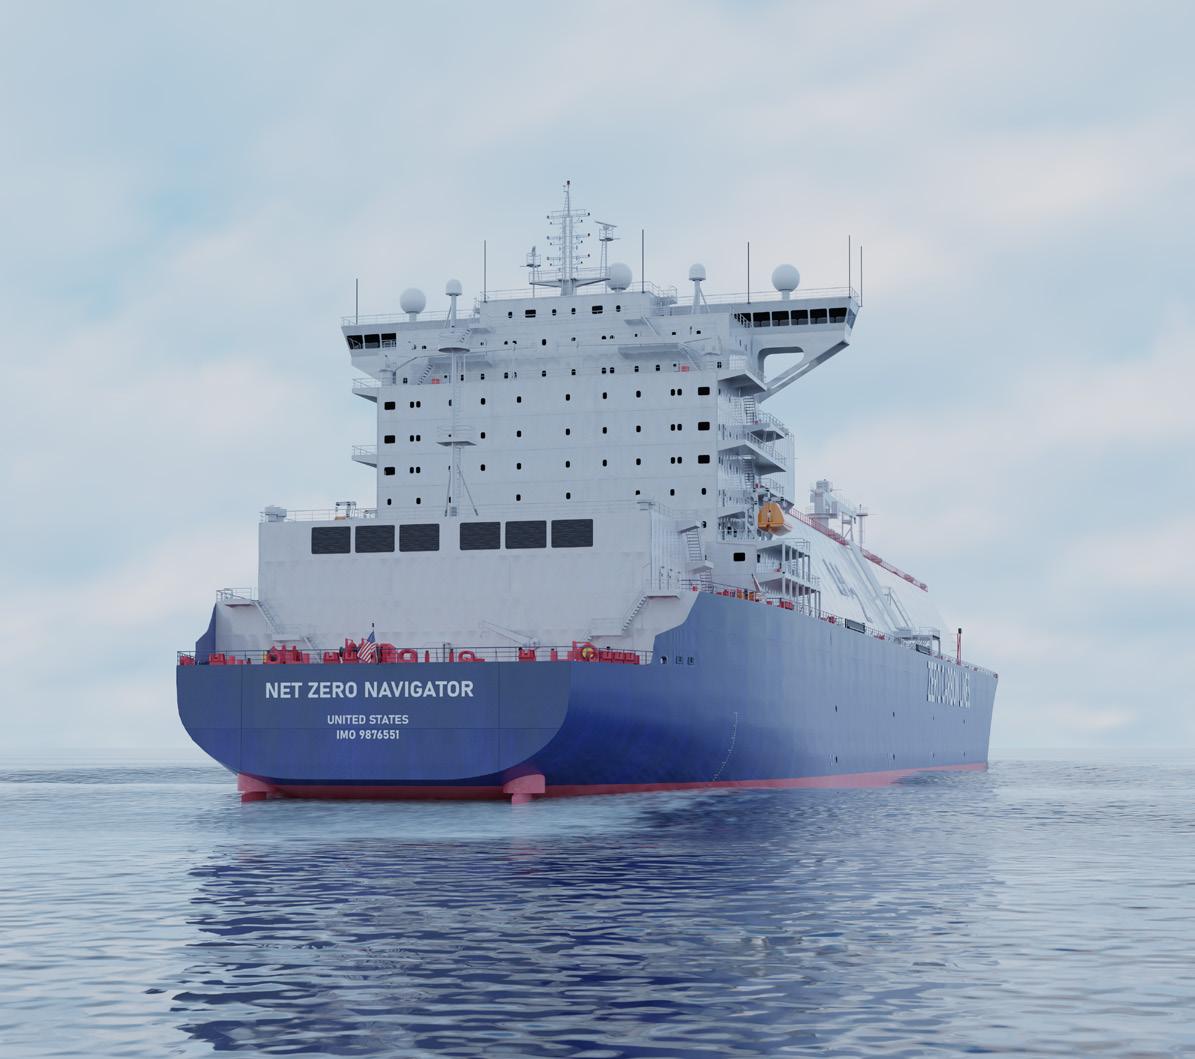
1. The potential effect of carbon deposits in the combustion chamber, depending on the percentage blended.
2. Water contamination can lead to higher microbial growth and gelling at low temperatures.
3. Maintenance considerations for biofuel storage tanks — microbial infestation can have a significant impact on tank structure and coating.
4. Scaling up the biofuel supply chains will require a significant amount of time — availability at scale is still questionable.
5. Other industries (especially hard-to-abate sectors) will compete for biofuel quantities.
On the other hand, biofuels can be used as drop-in fuels that can be readily used in existing engines without modification and the inherent downtime. Additionally, their transport, handling and storage operations are simple and cost-effective. Below is a holistic overview of biofuels, production pathways and biomass feedstock groups.
In terms of price, biofuels are expected to have competitive and, in some cases, lower prices than associated e-fuels, mainly due to the lower power requirements required for their synthesis. The following figure illustrates the expected price ranges for biofuels, e-fuels and traditional fuels, following different modeling scenarios. It shows the price advantage of biofuels in 2030 compared to their e-fuel equivalents.
Biofuels are expected to drop marginally in price approaching 2050, while the price of e-fuels are expected to fall significantly (due to increased efficiency and lower technology costs). Nonetheless, biofuels will remain attractive in 2050.
Figure 40: Production pathways and biomass-feedstock sources [28].Figure 41: Comparison of costs for alternative fuel options.
Biomass-based diesels make up a growing share of the world’s production of biofuel. According to collaborative work by the Organization for Economic Cooperation and Development and the United Nations’ (U.N.’) Food and Agriculture Organization (OECD-FAO), their Agricultural Outlook 2019 to 2029 expects the global production of biodiesel to increase from 11 billion gallons in 2020 to 12.15 billion by 2029. However, this level of production may depend on the support of government policy, a factor that could impede or accelerate the biofuel agenda.
For that production growth to be achieved, high-level influence from policy and regulation may be required. The current amount of feedstock available for biofuels is limited due to competition with the agricultural, automotive, aviation, plastic and chemical, cement and building material industries and many more [29]. In practice, all industries will be competing for carbon-neutral feedstocks; this will create an increased demand for carbon feedstocks and possibly increased investment into direct air capture.
Overall, the availability of feedstock and fuel may vary depending on conditions associated with location, season, regulations and the environment. According to a recent model developed by Zero Carbon Shipping, biofuel supply is expected to grow until 2050; biomethanol is expected to dominate the supply by 2045 (which can be seen in the figure below).
Biofuels have different fuel properties than traditional fossil fuels (different heating values, iodine and cetane values, etc.). Because biofuel properties deviate from the fuels that engines were designed for, there can be a slight increase in nitrogen oxides (NOx) and other exhaust-gas emissions. Most biofuels follow a defined set of standards to keep their fuel properties within a manageable range. Some of the standards include: EN14214 and ASTM D6751; for blends ASTM D6751 and EN16709.
Engine manufacturers are unable to test every biofuel and blend for practical reasons, so they cannot suggest how using some fuels will affect their engines. Overall, calculating the effects of using biofuels on an engine, and the resultant exhaust-gas emissions, is made even more complex by the different injection systems and combustion temperatures. That is why many shipowners perform extensive testing of biofuels and their blends to ensure that NO x and other emissions stay within limits during operation.
The unsaturated fatty acids contained in several biofuels can have a direct influence on NOx emissions and according to International Convention for the Prevention of Pollution from Ships (MARPOL) Annex VI (Reg. 18.3.2.2), “non-petroleum fuels shall not cause an engine to excess applicable NOx emission limit.”
There are some biofuels that are not readily compatible with marine engines or whose use would require lower blending percentages. Among those is pyrolysis oil, which due to its properties cannot be readily used in marine engines or supply systems, hydrothermal liquefaction fuels and FAME. Lately, it has been found that pyrolysis oil can be treated with hydrogen to increase its lower calorific value (LCV), making it compatible with the marine engines of today.
When considering drop-in fuels for a fleet’s decarbonization strategy, shipowners need to take life-cycle emissions into account. While on a tank-to-wake basis most bio/drop-in fuels have similar CO2 and carbon dioxide equivalent (CO2eq) emissions, their production pathways may result in lower emissions from the well-to-tank component of their life cycle.
However, the industry currently lacks internationally accepted standards on how to measure the life-cycle impact of maritime fuels. Many standards are being used, among which are the GREET model, RED II (in relation to FuelEU), U.K. DEFRA and others.
For the same fuel and production pathway, these models can produce different assessments of life-cycle emissions; one standard may return a carbon-neutral assessment, while another assesses the same fuel as having a higher lifecycle impact than traditional fuels.
The reasons for this are known and include different assumptions in the models, different boundaries for life-cycle analysis, attributional versus consequential life-cycle analysis, etc.
Increasingly, customers are becoming more aware of the life-cycle emissions of specific products. And as the main conduit for international trade, maritime shipping needs to integrate its emissions into those of the full logistics supply chain.
In that sense, the industry would benefit from the creation of a commonly accepted international standard. Currently, the IMO is looking at introducing dedicated life-cycle GHG and carbon intensity guidelines for marine fuels, which could impact other IMO regulations.
In parallel, the industry is working towards a fuller integration of the supply chains from different modes of transport, such as those envisioned by the Global Logistics Emissions Council’s framework [30].
As we explore the hydrogen value chain, we identify that the frequent intermittency of renewable energy power is a challenge for the expansion of renewable energy sources. Therefore, energy storage systems are considered a solution that would help the intermittency problem, provide constant power when required and support the value chain. In this section we examine some technologies that are in different stages of maturity or development, and we also discuss how the same technologies can provide decarbonization opportunities for ships.
Lithium-ion (Li-ion) batteries are presently dominating the maritime industry’s energy storage systems (ESS) market because they are an efficient way to store and distribute electrical energy on vessels. Nevertheless, the technology has many limitations, including:
• The requirement for complex monitoring equipment and crew training regimes (they must be operated within a specific range of temperatures and voltages).
• Susceptibility to thermal runaway; rising temperature can cause a self-sustaining chemical reaction, which ultimately can lead to battery failure and increased risks of explosion or fire.
• Extensive battery management and fire protection systems are needed.
• The theoretical energy and power density of Li-ion batteries is hard to reach, limiting their potential for use in the maritime industry, where higher power and energy levels can be needed.
• The accommodation space for these systems can have a direct effect on cargo payloads and engine room arrangements. Containerized Li-ion batteries are, however, a rather practical solution for smaller container vessels.
The safety risks and energy limitations of Li-ion batteries is driving research and development for alternative battery technologies, such as the Metal-Air, Redox Flow, and the ammonia-related and solid-state ranges of batteries.
There are several technologies in development, with Li-ion currently being the most common (see table below); the only other technology currently deployed for marine use is the molten salt battery variety [129].
Flow batteries
Capital requirement x Technology risk
Advanced Lead Acid batteries2 Hydrogen
Synthetic natural gas
Adiabatic CAES1
Supercapacitor Superconducting magnetic energy storage (SMES)
Flywheel (low speed)
Compressed-air energy storage (CAES)
Sodium-sulfur (NaS) batteries
Lithium-Ion batteries
Molten salt Pumped hydro storage (PHS)
Research
Development Demonstration Deployment
1. CAES compressed-air energy storage
2. Valve regulated Lead Add batteries is a mature technology
Mature Technology
Legend: Mechanical storage
Electro-chemical storage
Thermal storage
Electrical storage Chemical storage
A comparison of the pros and cons, research status and associated data for promising battery types can be seen in the tables on the following pages [129].
PHS1
CAES2
Flywheels
NaS battery3
Li-ion battery4
Flow battery
Supercapacitor
SMES5
Molten salt
Hydrogen
SNG6
Commercial, large scale, efficient, scalable in power rating
Cost, flexible sizing, large scale, leverages existing gas turbine technology
Power density, efficient, scalable
Efficient, density (power and energy), cycling (vs. other battery)
Efficient, density (power and energy), mature for mobility
Independent energy and power sizing, scalable, long lifespan
High power density, efficient and responsive
Low energy density, availability of sites, depends on availability of water
Lack of suitable geology, low energy density, need to heat the air with gas, possible exposure to natural gas prices
Cost, low energy density
Safety, discharge rate (vs. other battery), must be kept hot
Cost, safety
Cost (more complex balance of system), reduced efficiency
Low energy density, cost ($/kWh), voltage changes
High power density, efficient and responsive
Commercial, large scale
High energy density, versatility of hydrogen carrier
High energy density, leverage current infrastructure
Low energy density, cost ($/kWh), not widely demonstrated
Niche for concentrating solar power plants
Low round-trip efficiency, cost, safety
Low round-trip efficiency, cost
Table 8: Pros and cons of selected electricity storage technologies.
1. PHS: pumped hydro storage; 2. CAES: compressed-air energy storage; 3. NaS: sodium-sulfur; 4. Li-ion: lithiumion; 5. SMES: superconducting magnetic energy storage; 6. SNG: synthetic natural gas. Source: A.T. Kearney Energy Transition Institute analysis; IRENA (2012), “Electricity Storage — Technology Brief”.
Source: Energy Transition Institute
Table 9: Battery technology data.
indicates theoretical value, ** indicates no established value
Table 10: Battery rate of charge comparison.
*Current metal-air batteries are recharged mechanically by replacing the anodes and electrolyte
**Redox flow batteries can also be recharged mechanically by replacing the electrolytes in addition to standard charging methods.
The price per kilowatt-hour (kWh) for lithium batteries has dropped dramatically in the last decade (see following table); because they are likely to fall even further, it will be difficult for competing technologies to capture market share, leaving Li-ion battery technology as the frontrunner for the foreseeable future.
Battery Type Lithium Ion Metal-Air Redox Flow Ammonia Solid State Rate of Charge Fast Medium** Slow FastBattery Cost ( € /kWh)
1,200
1,000 800 600 400 200 0
1,054 519 360 211 180
Year 2015 2020 2025 2030 2035
Figure 44: Lithium-ion battery price outlook.
With the maritime industry’s decarbonization journey well underway, interest in ESS is rising, especially for shortsea shipping operators. The electrification of vessels is proving to be a very promising decarbonization pathway, particularly when used with low-carbon fuels such as hydrogen, ammonia, methanol and LNG.
For owners considering the electrification of their ships, there are three main technology options currently available:
1. Diesel-electric generators: These combust diesel to generate the electricity to drive an electric engine that moves the ship’s propeller [83].
2. Hybrid drives: Batteries supplement the fuels used in the internal-combustion engine. They store energy and allow the vessel to switch to electricity for short periods of time [83].
3. Fully electric drives: All energy is derived from batteries [83].
Currently, battery technologies are in the nascent stages of their development for maritime use; their low energy density currently precludes them from being used for longer distances due to the prohibitive battery sizes that would be needed.
Another barrier to their adoption for wider marine use is that the onshore charging infrastructure has yet to be developed, this would require port operators to make significant investments ahead of the market [83].
In hybrid systems, ESS can be used for peak shaving purposes to assist diesel engines that are working at optimal loads. All the above ESS options have the potential to reduce fuel consumption and have a significant impact on onboard energy efficiency, especially when the systems are coupled with renewable energy sources, such as solar panels or wind harnessing devices.
Even though some ESS technologies will need to mature before a wider application will be possible, the market appears confident in the promise they hold. The size of the European market for electric ships, for example, is projected to almost triple to $5.3B by 2030 (from $1.6B in 2020); lithium-ion (Li-ion) batteries are expected to be the most dominant technology, followed by electro-solar, lead acid and fuel cells.
As illustrated in the chart below, the number of ships with batteries increased significantly between 2010 and 2021; there were eight ships with these technologies in 2010, while there are currently 436 ships either in operation or on order.
0 1,000 2,000 3,000 4,000 5,000 6,000
2030 2028
Number of Ships
500 450 400 350 300
Figure 45: Size of the European market for fully electric ships from 2018 to 2020, with a forecast through 2030, by power source (in million $).
Statista
436
2021*
A recent report (2022) from the IMO’s Low-Carbon Global Industry Alliance found batteries to have the lowest potential to contribute to global warming when compared to other alternative fuels (green hydrogen, blue hydrogen/ammonia, biofuels from non-waste sources and energy carriers). Most of the alternative fuels investigated were typically low carbon, depending on the production pathway.
While electric motors do not produce emissions at the point of release, they have the potential to simply transfer the generation of emissions from mobile to stationary sources, i.e., from marine engines to power plants. In this context, the original source of the electric power is very important; if the grid is dirty — i.e., the power is generated from coal/natural gas without CCS — the electricity is far less likely to be considered a low-carbon source of power.
Figure 46: Number of ships with batteries in operation and on order worldwide from 2010 to 2021. Lithium-ion battery Lead-acid battery Electro-solar Fuel cells“Green” fuels (H2, NH3, CH4, CH3OH)
“Blue” fuels (H2, NH3)
H2 from plastic waste
Biofuels (bio-CH4 bioethanol, biodiesel) from organic waste
1st generation biofuels (bioethanol, biodiesel) from non-waste resources
Indication of likely relevance: L(ow)/M(edium)/H(igh)
a Potentially med for CH2/CH3OH and NH3 due to, respectively, fugitive CH4 and N2O emissions
b Potentially low GWP for H2 if using CCS
c Assuming cut-o rule assigning zero upstream impact to waste substrate
d If carbon emissions from plastic waste are simply vented (instead of captured)
e High impact due to LUC emissions
f Depends on mix of technologies used for electricity generation (low impact for renewables and nuclear); impact per tonne-km is favorably influenced by comparatively higher power train e ciency
Figure 47: Global emission-related impact categories and indicators, with indication of likely relevance.
The evolution of battery technologies is currently being driven by the automotive industry, where Li-ion batteries are the dominant type. Li-ion batteries also appear to be the most prominent technology for current maritime applications; ferries and tugs are the first mover ship types due to the low distances they travel and their lower power applications.
In addition, there are some interesting early developments in the electrification of cargo ships, where startups are looking at the potential for battery swapping to the solve the current problems associated with sizes and weights of the current technologies [97]. These projects are working on building batteries in standard 20 feet (ft) shipping containers to allow for quick replacements during port visits. As smaller ships operate at multiple ports for each transit, this solution is seen as having potential [97].
An important constraint on the low-carbon potential of electrification is the life-cycle impact of battery production. The raw materials needed to produce Li-ion batteries (e.g., lithium and cobalt) require significant quantities of energy and water to be used in their extraction; the disposal of these batteries can also have a detrimental impact on the environment.
It will be important for policymakers and international organizations to regulate the recycling of battery systems and incentivize a greener extraction process for the associated raw materials. Additionally, an increase in crossindustry demand for ESS is expected to challenge the supply of materials such as lithium, cobalt and nickel.
The growing number of ESS-equipped vessels has given rise to innovative battery charging concepts, including wireless methods.
Just as with modern smartphones, several technology providers are offering wireless charging options for ships sailing on short- to medium-length routes; some of these options promise safer charging operations (eliminating the risk of connection/disconnection damage), a reduction in maintenance costs and shorter charging times.
Below are recent examples of electric-powered vessels with indicative power capacities [98].
1. Stena Jutlandica — 50,000 kWh, ferry operated between cities in Sweden and Denmark.
2. AIDAperla — 10,000 kWh, a German cruise line, which can carry more than 4,000 passengers and crew.
3. Ellen — 4,300 kWh, Danish ferry
4. Project e5 — 4,000 kWh, Japanese fuel-supply vessel
5. Guangzhou tanker — 2,400 kWh, Chinese coal transportation vessel
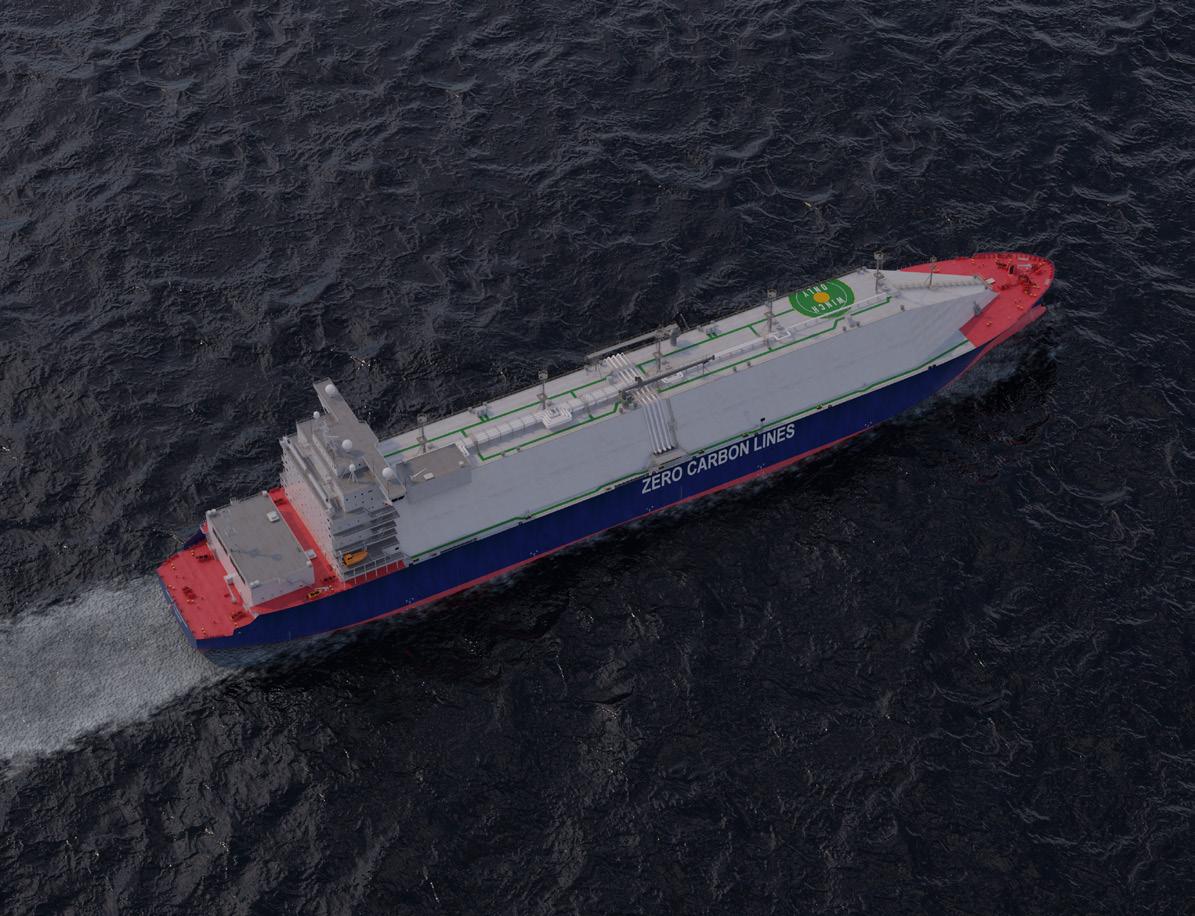
With numerous electrification projects operational, and more under construction, ESS solutions are expected to play a bigger role in the world’s marine decarbonization pathways.
While much progress needs to be made, wider adoption of ESS is expected to create a domino effect that will lead to the electrification of the maritime power requirements in some sectors: as adoption escalates battery technologies will improve; renewable energy capacity will expand; and the impetus will grow to build the charging infrastructure.
The IMO’s aggressive decarbonization targets and commitments by major freight charterers such as Amazon and Ikea to zero-carbon ocean shipping by 2040 [99] should drive greater adoption of ESS. The barriers to maritime deployment can be expected to fall and, ultimately, ESS use should mirror that of many land-based industries: in other words — demand-driven deployment as, when and where required.
Putting a price on the volume of the carbon dioxide (CO2) emitted allows the external costs associated with greenhouse gas (GHG) emissions to be captured and tied to their sources. These are significant costs for which the public indirectly pays, such as crop damage, healthcare costs from heat waves and droughts and property losses due to flooding and rising sea levels.
By putting a price on carbon, those who are responsible and able to prevent GHG emissions can shoulder more of the financial burden for the harm they cause. A price also gives emitters a financial incentive to change their practices and reduce their emissions, rather than dictating how reducing emissions should be achieved.
This way environmental goals are achieved by society in the most flexible and cost-efficient way possible.
An adequate price for GHG emissions is essential to incorporate the costs of climate change into the widest possible range of economic decision-making, and to encourage the development of environmentally-friendly technologies and practices. Clean technologies and market innovation can be fueled by new, low-carbon economic drivers, if the financial investments needed to stimulate them can be mobilized.
Carbon pricing's potential role in the transition to a low-carbon economy is gaining acceptance from governments and businesses alike. Climate policies that include mechanisms such as carbon pricing account for transition risks and opportunities, allowing for the reassessment of strategies to stimulate clean technology and market innovation.
Many of today’s businesses use internal carbon calculations to evaluate the potential impact of mandatory carbon prices on their operations, and to identify potential climate risks and revenue opportunities.
Finally, long-term investors use carbon pricing to assess the impact of climate change policies on their investment portfolios, allowing them to reassess investment strategies and reallocate capital to low-carbon or climate-resilient activities.
The illustration below highlights the five main types of carbon pricing; these options continue to be fine-tuned, adapting to new circumstances and incorporating lessons learned.
Figure 48: The main types of carbon pricing [32].
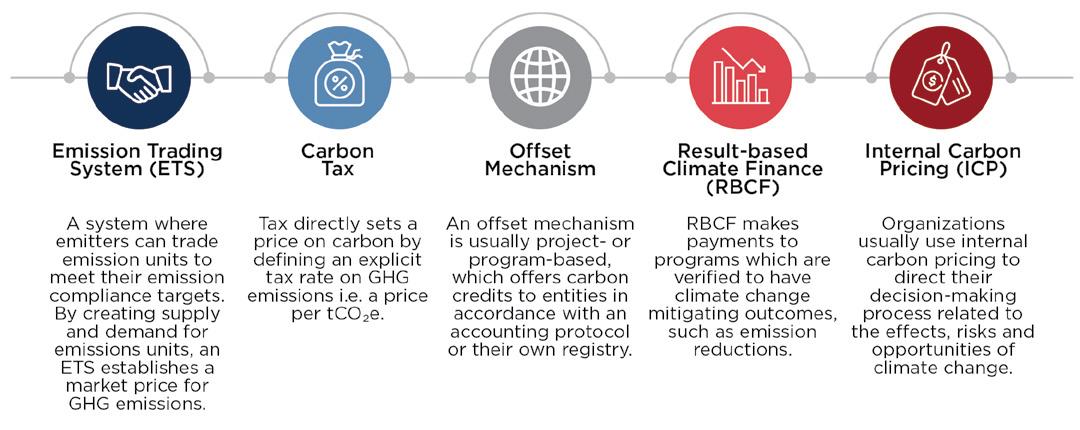
A carbon tax is a fee on each unit of CO2 and is indicative of the social cost of these carbon emissions. There is economic theory to support carbon pricing as a potentially effective and powerful tool for incentivizing reducing and removing emissions at the lowest possible cost. It also drives behavioral change, technological innovation and investment decisions — particularly in the private sector.
Carbon pricing imposed by governments, whether through an emissions trading system (ETS) or a carbon tax, can be an economically efficient method of reducing emissions, as it allows for selecting the least expensive options. A cap-and-trade program caps the maximum amount of CO2 allowed; for industries looking to expand, a finite carbon market will be available to buy carbon credits.
As of 2021, nearly 27 national and sub-national jurisdictions have implemented a carbon tax instrument, with many additional jurisdictions scheduled to implement and a few more taking it into consideration. This does not include the jurisdictions that have an ETS.
The non-ETS schemes are estimated to cover nearly 2.99 gigatons (Gt) of carbon dioxide equivalent (CO2e) emissions, or roughly 5.5 percent of the global GHG emissions.
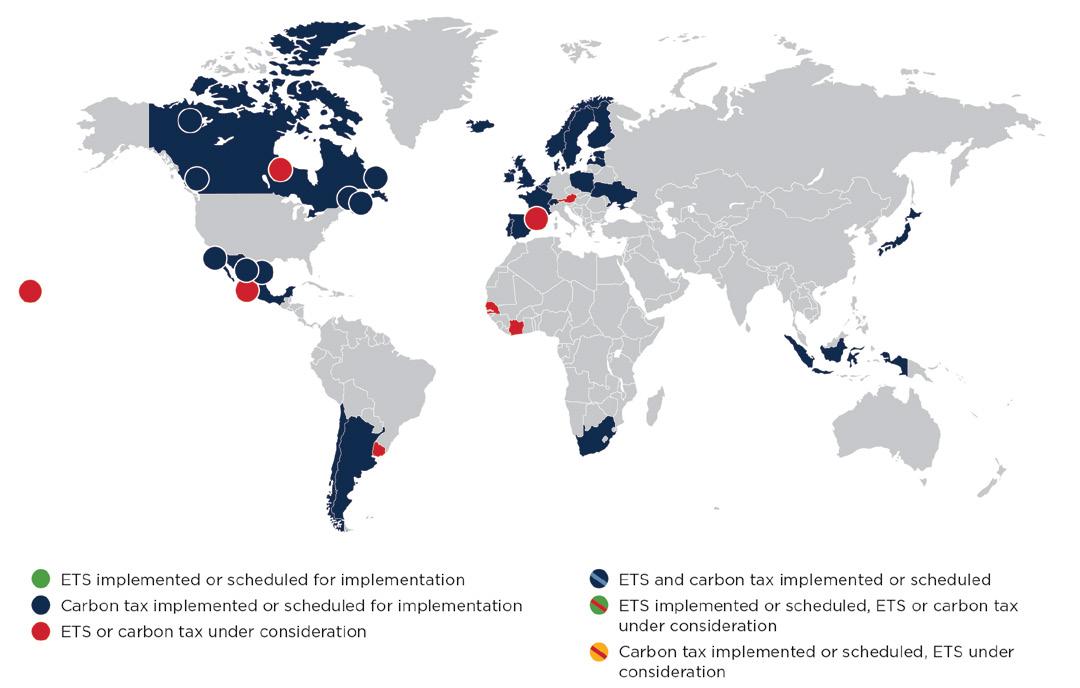 Figure 49: Summary map of regional, national and subnational carbon pricing initiative [33].
Bank
Figure 49: Summary map of regional, national and subnational carbon pricing initiative [33].
Bank
The United States (U.S.) currently does not have a carbon tax, but there have been numerous proposals at the federal level, ranging from $20 to $160 per ton [34]. Carbon tax as a policy is difficult to legislate in many jurisdictions because it is a regressive tax that will disproportionately impact relatively poorer people. Hence, it is currently in implementation in generally rich or middle-income countries, with the U.S. being an exception.
While the U.S. does have a cap-and-trade program in a few of the sub-national jurisdictions (California, Massachusetts, Virginia, Oregon and Washington), there is no federal cap-and-trade program, nor is there a federal mechanism for carbon taxes.
Globally, the level of carbon taxes levied as of April 2021 ranges from a maximum of $137 per ton in Sweden to $1 per ton in Poland [35].
The initiative in Sweden is one example of a case where it has been shown that carbon emissions can be decoupled from economic growth [36]. There, GHG emissions fell by 26 percent between 1990 and 2017, while gross domestic product (GDP) grew cumulatively by 78 percent over the same period. Sweden is a great case study on creating economic incentives to push the economy down a sustainable path without impacting the prospects for economic growth.
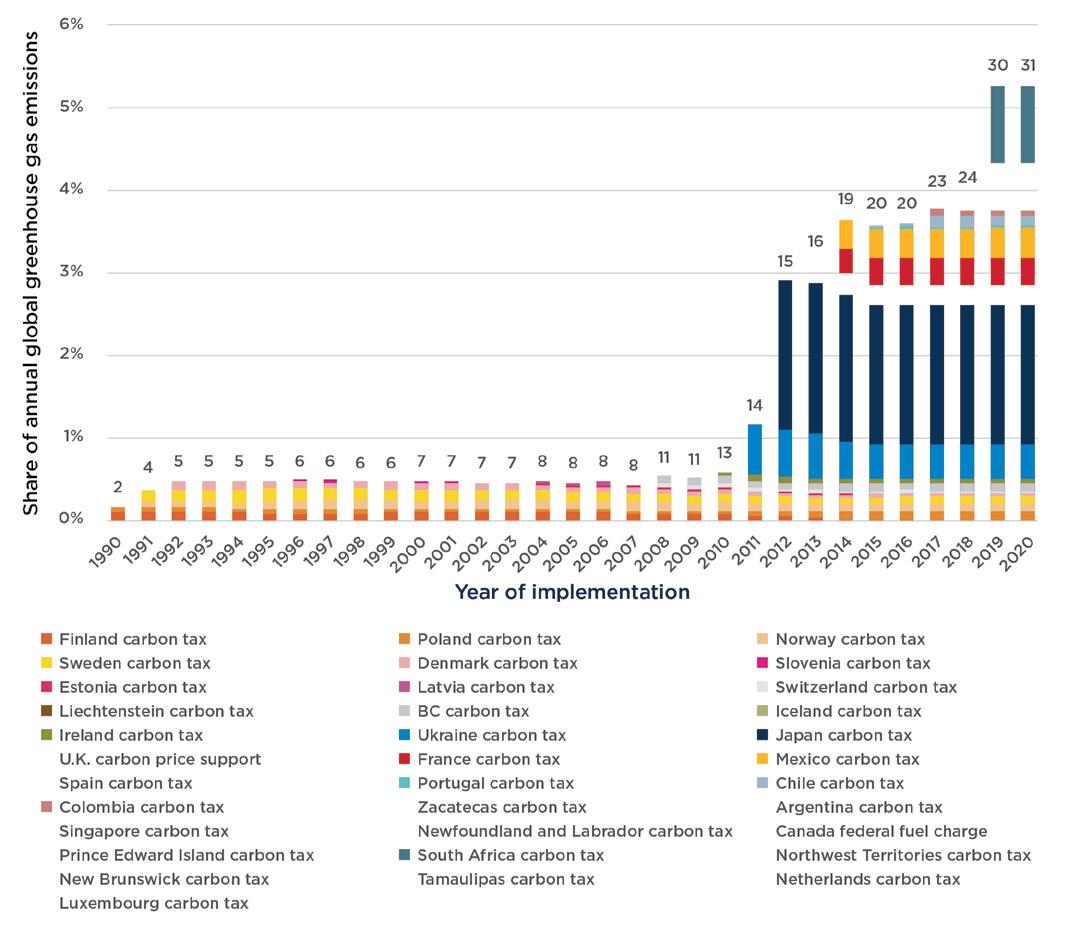 Figure 50: Share of global GHG emissions covered under selected regional, national and subnational carbon pricing initiatives [33].
World Bank
Figure 50: Share of global GHG emissions covered under selected regional, national and subnational carbon pricing initiatives [33].
World Bank
With the ETS and carbon tax already in place and many other proposals in the works, there is no shortage of carbon pricing options. The maritime industry is making a good faith effort to help the International Maritime Organization (IMO) reach its global goals for reducing carbon emissions and the various carbon pricing mechanisms will play an important role.
The International Chamber of Shipping (ICS), which represents 80 percent of the world’s merchant fleet, recently submitted a proposal to the IMO that recommended the creation of a climate fund using a global levy on the carbon emissions from ships. The proposal includes a mandatory contribution from ships greater than 5,000 Gt) trading globally. The levy will be used to close the carbon emissions gap between conventional and low-carbon fuels, while the capital raised will be used to develop the infrastructure for ammonia and hydrogen bunkering at ports.
Figure 51: Economic growth and GHG emissions decouple in Sweden from 1990 to 2017.
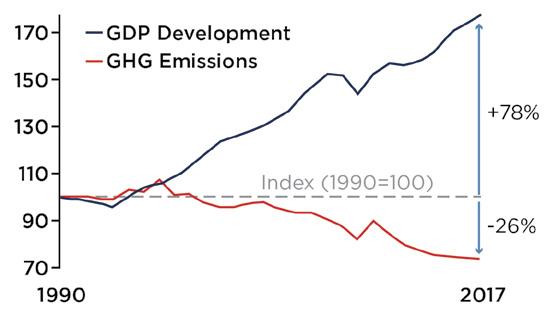
While zero-carbon fuels are not commercially viable at present, the fund will help to reduce the cost of alternative fuels and close the price gap with traditional carbon-based varietals.
Currently, the European Union Emissions Trading System (EU ETS) program creates a market-based mechanism, but its influence applies only to the EU, which represents about 7.5 percent of global shipping GHG emissions, making the case for a global levy. The above proposed ICS global levy is in addition to a proposed fund of $5 billion (B) to fuel research and development of alternative zero-carbon fuels [37].
According to the Center for Zero Carbon Shipping, a flat carbon levy of $250 per ton of GHG would raise $3.7 trillion (T) by 2050. In the same study, different modelling assumptions imply estimates for annual carbon revenues from international shipping that range from an average of $40B to $60B [38].
According to another study from the Getting to Zero Coalition, the average carbon price would need to be around $191 per ton of CO2 and reach a maximum of $358 per ton of CO2 by 2050 to fully decarbonize international shipping. By this measure, if all revenues were recycled to support the decarbonization of shipping, this could reduce the carbon price by up to half, to an average of $96 per ton of CO2 and a maximum of $179 per ton of CO2 (but this would leave no revenue for other purposes, such as enabling an equitable transition) [26]. It is, however, in alignment with the ICS goals and has a similar goal of helping bridge the gap between conventional and low-carbon fuels [39].
In addition, some Pacific Island nations, which are the most vulnerable to effects of climate change, have proposed a carbon price of $100 per ton on bunker fuel; this has been strongly opposed by emerging economies.
The proposals and actions of the IMO, the ICS (the biggest merchant shipping trade group), Mærsk and the EU clearly highlight the direction in which carbon pricing is heading for shipping and how it will impact the industry.
Alternative fuels will play a critical role in shipping’s decarbonization journey; the cost of fuels and lack of related infrastructure at ports are the biggest impediment to the transition. In the next few years, a global levy on carbon emissions and more regional mechanisms are expected to enter into force to help shipping align with IMO’s goal of reducing carbon intensity by 40 percent by 2030 and absolute emissions by 50 percent by 2050 [40].
An ETS, also referred to as a cap-and-trade system, is an efficient way to reduce GHG emissions. These systems are generally managed by governing jurisdictions or bodies that set limits on the amount of GHGs allowed and allowances are distributed to entities within the system.
The entities which exceed their allowed emissions need to purchase an extra allowance unit from the entities that emit less than their allocation. By creating supply and demand for emission allowances, an ETS creates a market price for GHG emissions, which is a form of a carbon price.
The cap on the emissions ensures that emitters will try to keep their output within their allocated carbon budget. If they are unable to do so, they have to pay a price for the excess emissions they generate by purchasing carbon credits or allowance units from the market.
Figure 52: Carbon pricing map 2021 [27].
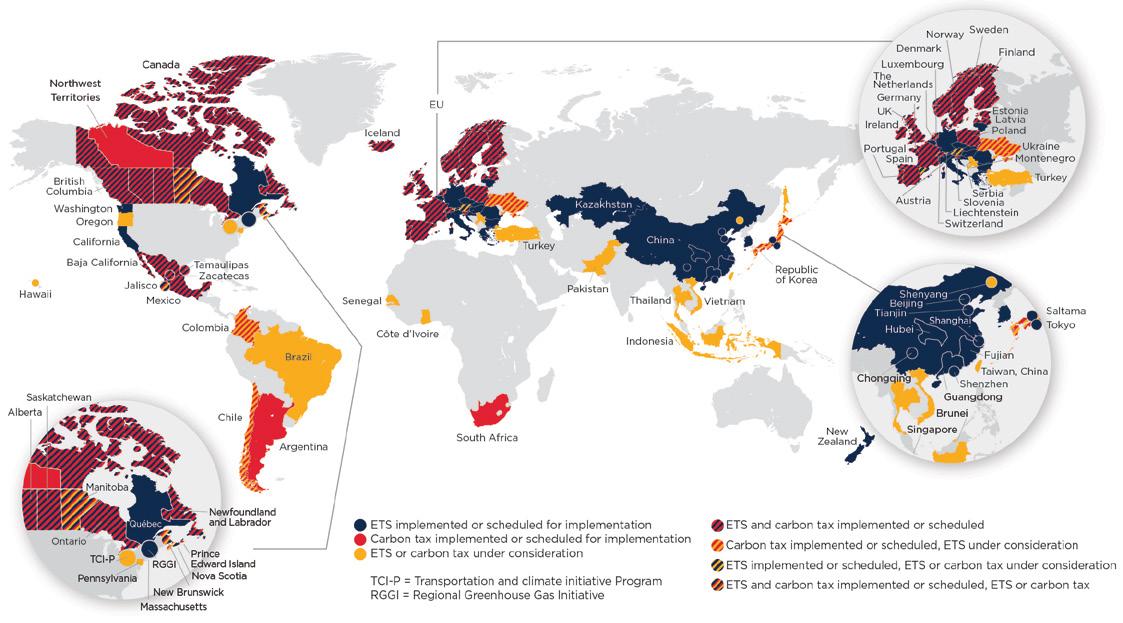
With more and more countries embracing net-zero commitments to combat climate change and start their journey of decarbonization, a growing number of national trading systems have been created to control carbon emissions.
In 2021, 64 carbon pricing instruments were active worldwide, including 30 ETS (see figure above) [27]. For instance, China launched the national ETS in February 2021 and started trading in July; it is now the largest carbon market in the world.
The price per ton of carbon emitted experienced tremendous growth in 2021 in all major ETS, raising expectations for a tighter emissions trading policy (see figure on following page).
World BankFigure 53: Carbon Prices as of April 1, 2021 [27].
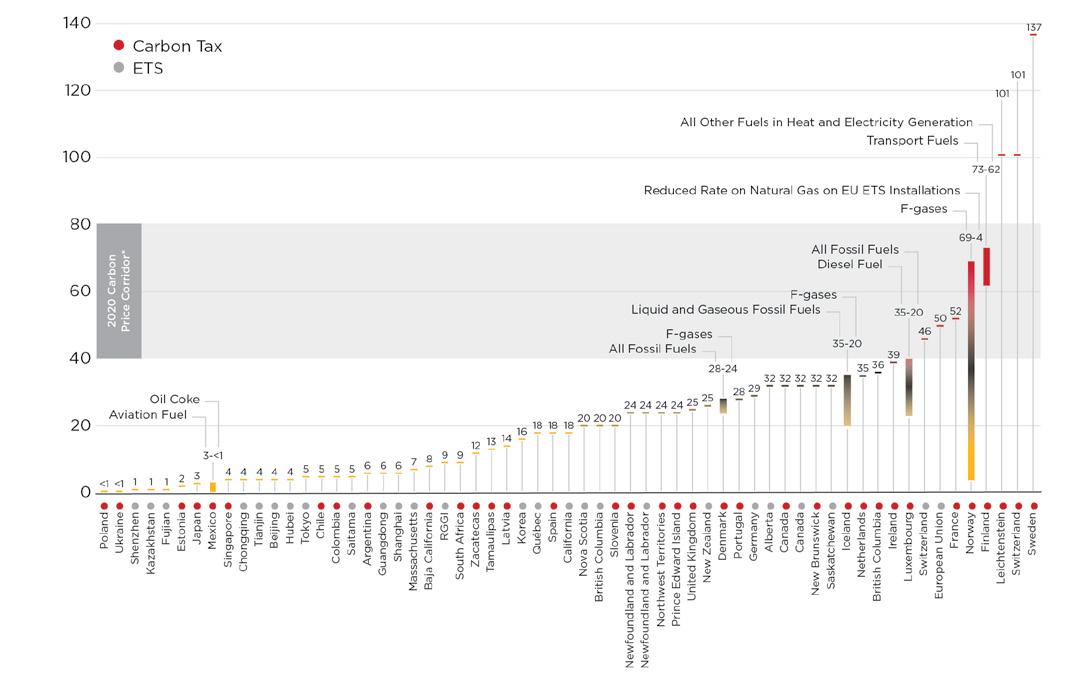
Nominal prices on April 1, 2021, shown for illustrative purpose only. China national ETS, Mexico pilot ETS and UK ETS are not shown in this graph as price information is not available for those initiatives. Prices are not necessarily comparable between carbon pricing initiatives because of differences in the sectors covered and allocation methods applied. specific exemptions. and different compensation methods. *The 2020 carbon price corridor is the recommendation of the World Bank's 2017 High-Level Commission on Carbon Prices Report.
The different jurisdictions have applied market-specific designs for each ETS, including geographical scopes, industrial sectors, types of emissions, allocations, etc. These trading systems can be categorized into remit levels: supranational, national, regional and city level, as shown in the figure below.
Figure 54: Levels of ETS [41].
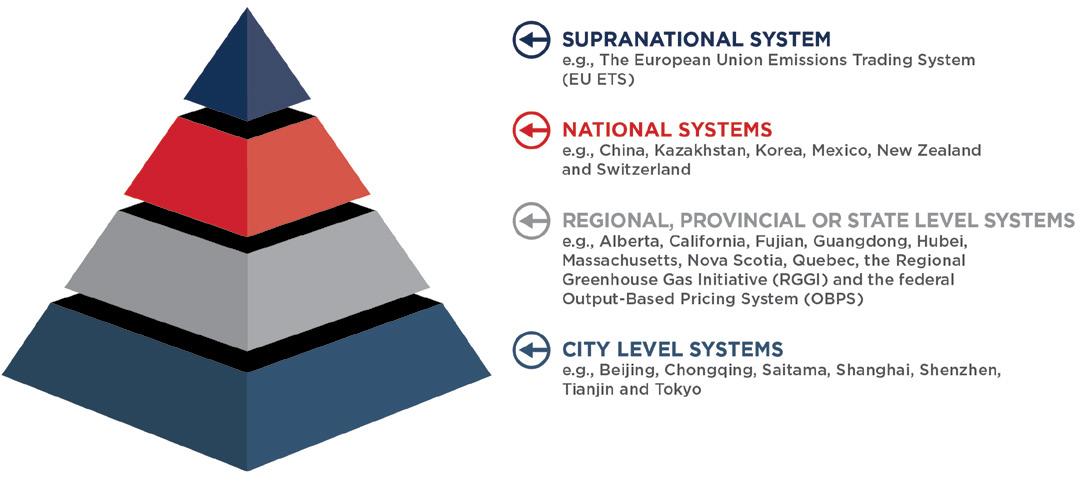 World Bank
Launched in 2005, the EU ETS is the world’s first supranational ETS, which includes 27 EU member States and three states from the European Economic Area-European Free Trade Association (EEA-EFTA): Iceland, Liechtenstein and Norway. The EU ETS is one of the EU’s key policies for reducing carbon emissions. It has already completed three phases from 2005 to 2020; the fourth phase started in January 2021. The history is briefly recapped in the figure below.
Phase 1 worked as a pilot phase to test price formation and build up the monitoring, reporting and verification schemes for emissions.
The cap of the emission was estimated due to lack of data. Phase 1 was aimed to ensure EU member States met their commitments under the Kyoto Protocol.
Business could only trade on units generated under the Kyoto Protocol mechanisms clean development mechanism (CDM).
Phase 2 2008 2012
Phase 2 had the same period as the first commitments period under the Kyoto Protocol. Aviation emissions were included in EU ETS at the end of this period.
Phase 2 allowed trading on both CDM and joint implementation (JI) emission reduction units.
Phase 3 had the same period as the second commitments period under the Kyoto Protocol.
An EU-wide cap replaced the previous national caps.
During Phase 3, auctioning was set as the default method for allocating allowances instead of free allocation. More sectors and gases were included in this phase.
A more ambitious cap of EU ETS was initiated by announcement of the European Green Deal recovery package and new 2030 mitigation targets.
EU ETS planned to include the marine transport sector, and possibly road transport and buildings.
Figure 55: Four Phases of EU ETS [42].
It is a typical cap-and-trade system, covering CO2 emissions from the industry, power and aviation sectors, nitrous oxide (N2O) from certain chemical sectors and perfluorocarbons from aluminum production.
Similar to other cap-and-trade systems, the legislation for the EU ETS sets the annual cap, which in turn determines the number of allowances in this market; the cap is also designed to be reduced each year to gradually cut the emissions.
These allowances are allocated to participants for free or sold through auctions. The free allocations are given to the sectors (such as industry and aviation) based on benchmarking and historical data. Then, the EU ETS allows participants to trade their allowances on the market to ensure their compliance with the regulation.
Fines and penalties are applied to participants who fail to comply with their allowance limit at the end of the year.
National ETSs have been introduced in several countries, with more being considered and scheduled for the coming years.
In January 2021, the U.K. stopped participating in the EU ETS and launched U.K. ETS after leaving the EU. The U.K. ETS covers emissions from the power sector, other energy intensive industries and aviation.
Additionally, a German ETS was launched in 2021 in line with the Fuel Emissions Trading Act, which covers all heating and transport fuels that are not under the regulation of the EU ETS. The allowances being sold in the German ETS have a fixed price, and auctions are expected to begin in 2026.
In the same year, China’s national ETS gained attention from observers. The China ETS is currently limited to the CO2 emissions from the power sector, as well as combined heat and power and captive power plants from other sectors. It opted for the free allocation of allowances, which are distributed according to benchmarking results.
Regional and city-level trading systems are considered to be subnational ETSs.
For instance, the Regional Greenhouse Gas Initiative (RGGI), the first mandatory ETS in the U.S., was implemented in 2009 with collaboration from 10 states in the northeast and mid-Atlantic areas of the country. This carbon market covers CO2 emissions from power plants, and allowances are distributed to the states through quarterly auctions.
The inclusion of Pennsylvania, which would significantly affect the size of RGGI, is currently under review.
In Japan, the Tokyo ETS operates under a slightly different mechanism. As the country’s first mandatory ETS, it covers large CO2 emitters from the power, industry and building sectors. An emissions baseline is given to each facility, which is determined by historical performance and a compliance factor determined by regulators.
Extra credits are given to facilities which emit below the baseline and those credits can either be traded to others or banked for future compliance.
If the European Council votes to formally extend the EU ETS to shipping beginning from 2023, the maritime industry will get its first taste of what a low-carbon economy looks like.
Despite its status as a regional regulation, the EU ETS will have a significant impact on international and intra-EU shipping. It will initially raise costs for shipowners and will usher in a carbon market that could in part reshape vessel financing and operations.
While the long-term effects should be positive for the environment, the establishment of a maritime carbon market will create as many challenges as opportunities.
The EU ETS, which would apply to all ships of 5,000 gt or more, will put a price on carbon and lower the cap on emissions every year. Its goal is to align the EU ETS with the EU's ambition to reach a mandatory 55 percent reduction in net emissions by 2030, as part of the continent’s Fit for 55 package.
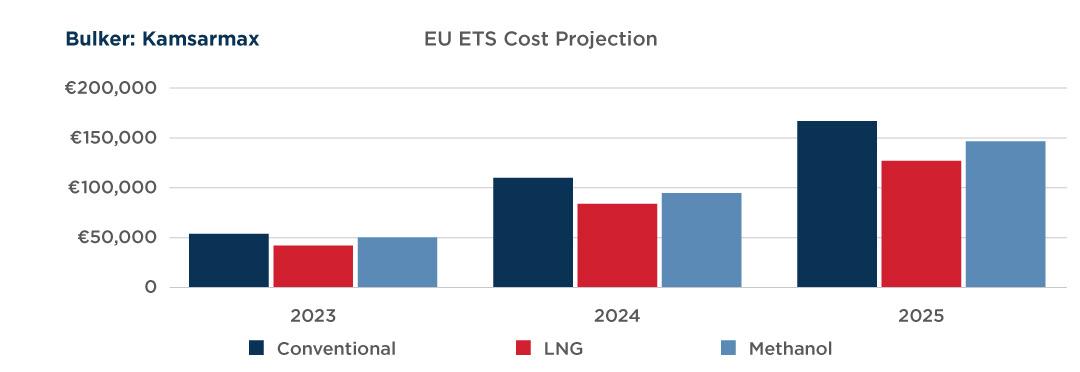
The EU ETS makes the party responsible for the operation of the ship under the International Safety Management (ISM) Code liable for its CO2 emissions. The scope of the EU ETS expansion includes 50 percent of emissions from vessels arriving at and departing from EU ports on international voyages.
Shipping is scheduled to be phased into the EU ETS from 2023, with a wider inclusion by 2025. During the first three years of operation, carbon will not be traded; the EU ETS will effectively be a tax on vessel emissions. The first year will require the owner to surrender allowances equivalent to 33.3 percent of verified emissions, increasing to 66.6 percent in the second year and 100 percent by 2025.
The penalties include fines levied against shipping companies and the blacklisting of vessels for non-compliance.
The initial proposed regulation drafts for EU ETS in maritime and FuelEU, along with their amendments during the public consultation phase, provide us a guideline for an initial impact assessment for some typical vessel types that are trading in Europe and are likely to be affected by these measures. The different vessel configurations with alternative fuels like liquefied natural gas (LNG) and methanol will have a different economic impact from such measures, which make the various business cases for energy transition to alternative and low-carbon fuels a viable solution in the mid- and long-term.
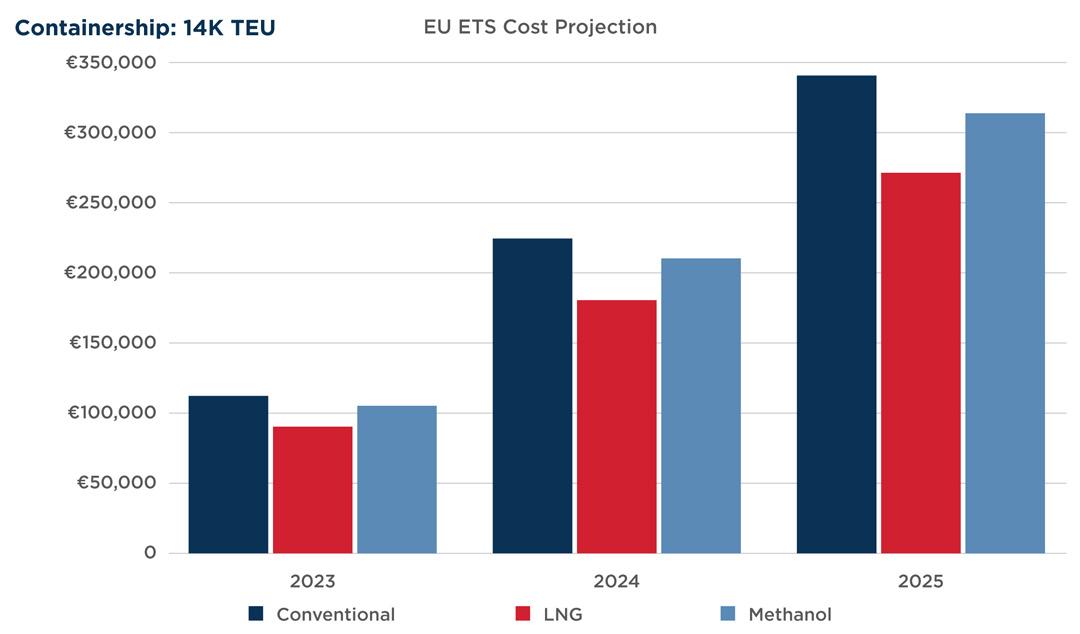
To understand the impact of the EU ETS, ABS modeled a representative kamsarmax bulk carrier, calculating the direct impact of carbon emissions, fuel carbon intensity and consumption for voyages in, out and within European ports under the phased adoption from 2023 to 2025.
For this vessel to use heavy fuel oil (HFO), the owner would be required to surrender allowances equivalent to €330k in 2023 through 2025. With no carbon trading taking place, the emissions are a straightforward calculation based on EU monitoring, reporting and verification (MRV) data, rather than a variable amount.
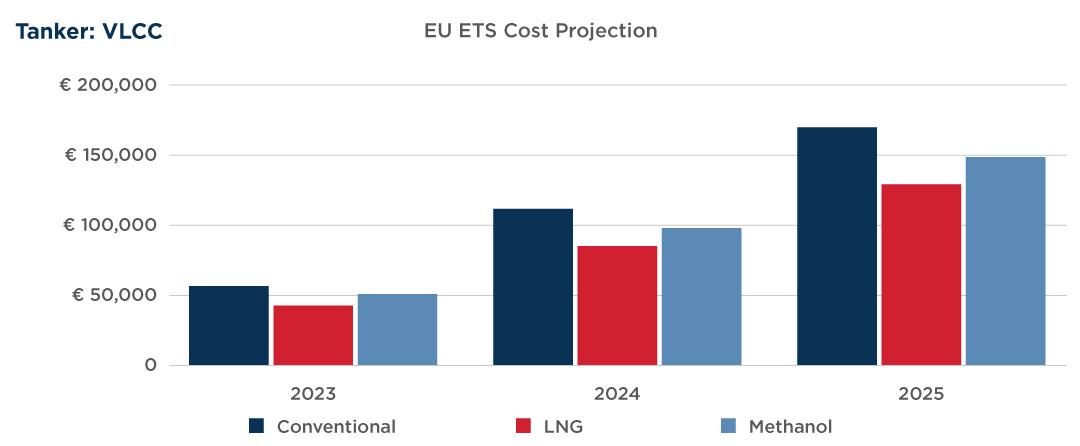
The clear challenge is that shipowners — especially operators of smaller fleets who are less able to implement energy efficiency measures, or to consolidate or pool emissions across a fleet — may find their operational costs increasing sharply.
For an operator of a very large crude carrier (VLCC) with a high Carbon Intensity Indicator (CII) performance using conventional fuel, owners could be called upon to surrender €340k by 2025, a similar level to that for a large LNG carrier, according to ABS analysis. The operator of a 14,000 twenty-foot equivalent unit (TEU) containership with a high CII performance could be liable for as much as €700k in allowances by the end of 2026.
The situation is further complicated by the closely related FuelEU Maritime proposal. Designed to accelerate the maritime industry's decarbonization through the adoption of renewable and low-carbon fuels and technologies, it will apply a goal-based reduction of GHG energy intensity from 2025.
A further complication is that FuelEU Maritime employs a well-to-wake or life-cycle assessment methodology to measure the carbon intensity of fuels from production to consumption, whereas the EU ETS employs the tank-towake measure currently used by the IMO.
Under FuelEU Maritime, the kamsarmax would incur penalties immediately if powered by methanol or HFO, but those would only start from 2035 if it was powered by dual fuel/LNG. If the VLCC was powered by dual fuel/LNG, it would start incurring penalties around 2035, while dual fuel/methanol and HFO fall into the deficit range. A similar performance is expected for the 14,000 TEU containership powered by dual fuel/LNG.
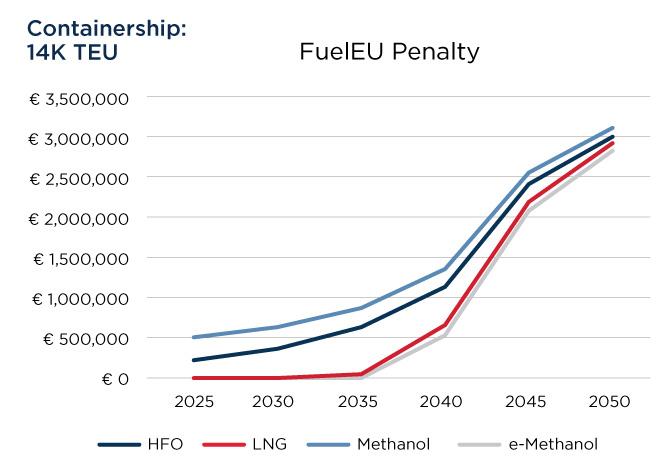
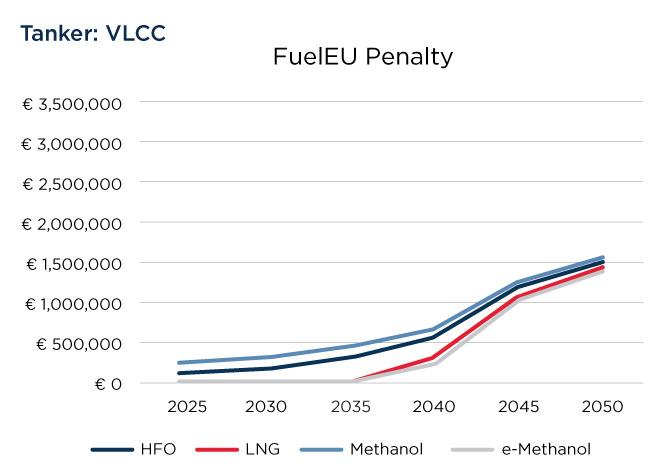
The fines under the FuelEU Maritime penalty scheme are derived from a GHG intensity limit that tightens over time and could represent significant additional capital costs; non-compliance with the requirements of FuelEU could add up to €1.5m in penalties by 2040. However, FuelEU Maritime allows for pooling of carbon intensity, meaning owners can average emissions across a fleet and hedge by borrowing intensity allowances from next year to compensate for shortages.
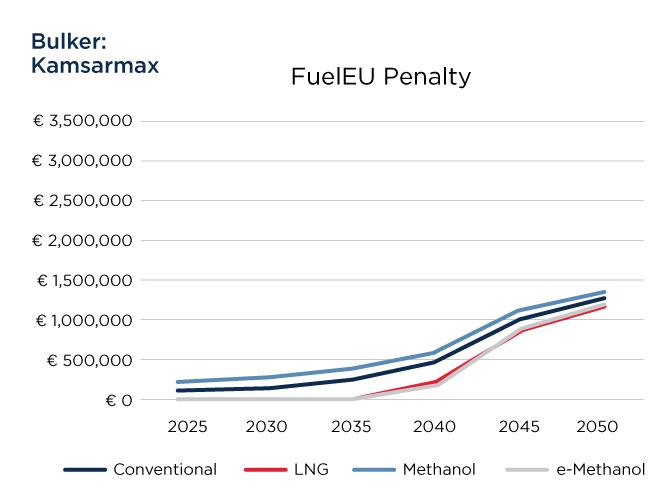
For the operators of larger fleets, every year they spend in surplus is an opportunity to offset their wider carbon footprint, pool efforts across their fleet or even consolidate operations with smaller owners, for whom the regulatory burden proves too onerous. Cash-rich owners already have made investments in renewable energy to provide similar revenue and offsetting opportunities.
Once the EU ETS becomes fully tradable, further opportunities will arise in financial markets and ship finance, as well as in the new carbon and hydrogen markets that will develop as regulation and market forces drive the decarbonized maritime economy.
The challenge presented by climate change is one that impacts every country and will require global cooperation. If there are countries that seek to benefit from the decarbonization efforts of others to solve climate change, all countries will lose their incentive to reduce carbon emissions [43]. Therefore, global decarbonization efforts are currently at an impasse, and solving climate change will require a high degree of global cooperation.
The decarbonization of the maritime industry can be accelerated by some initiatives, such as those that adopt energy efficiency measures, alternative fuels, global carbon pricing, and those that provide incentives to first movers. A carbon pricing mechanism that adequately measures the social and environmental cost of carbon could be a useful policy instrument for an international common commitment.
A global carbon price has not gained much attention in international negotiations until now. An agreement would provide an important step for international cooperation on mitigation efforts and it could effectively address the negative social externalities. It would also require countries to price their domestic carbon emissions at least as high, on average, as the agreed-upon global carbon price.
Each country would need to commit to applying a charge on the use of fossil fuels which ultimately meets the global carbon price reached by international consensus [43]. This commitment would also have to involve reciprocity to create incentives for cooperation and break the current impasse in climate negotiations [43].
The maritime industry and regulatory bodies such as the IMO would have to coordinate their work and set up a form of global carbon pricing. Such a scheme would need to overcome the objections of many nations to marketbased measures (MBMs) and mandatory levies [44].
The figure below examines the ways in which global carbon pricing can play an important role in promoting international cooperation.
A global carbon price along with appropriate industrial collaboration and global regulation, are important in realizing zero carbon shipping by 2050.
Reduce gaps by combining industry action and global carbon pricing
To pave the way to a zero carbon future, a global carbon pricing regulation should combine with lower costs of fuels and green financing, and higher consumer’s demand and energy e ciency adoption.
The design of a carbon pricing is crucial
If revenue is given back to the sector, a global carbon price between $50 150/tCO2eq can assist both developing countries, as well as early adopters of alternate fuels.
Figure 56: Role of a global carbon price in achieving decarbonization of the maritime industry [11].Building a consensus on a global carbon price would yield the following benefits:
• It would promote the concept of burden sharing and common responsibility, which would encourage multiple countries and sectors to take action at national and local levels.
• Unlike other mechanisms, pricing would not require stringent regulations and would be more market driven. This would provide increased flexibility to the different stakeholders.
• It would also provide a higher degree of certainty for the trajectory of industry decarbonization.
Building decarbonization pathways, developing low-carbon technology and upscaling supply-side infrastructure are all capital-intensive programs for which pricing mechanisms can provide funds, incentivizing both research and development and the early adopters who bear the biggest financial risks.
Carbon-pricing mechanisms are the means by which shipping’s emissions goals can be achieved; for example, they would be an effective way to meet the IMO’s carbon-reduction goals for 2050 [112].
At the global level, the regulations for pricing and implementation have yet to be set. Early decarbonization initiatives have focused on short-term policy measures aimed at technical and operational areas. However, carbon pricing has the potential to be a medium- and long-term solution for the IMO.
Today’s carbon-pricing initiatives are applied through two main vehicles, an ETS or a carbon tax [113].
The ETS mechanism is based on a cap-and-trade principle that allows business owners to participate in the purchase and sale of carbon allowances, which are decided by imposing a cap on emissions within the scheme’s jurisdiction [113].
The price of the tradable allowances is determined by the number of allowances generated by the system’s overperformers and demand from the underperformers; these can be controlled by adjusting the cap. This mechanism is not suitable for raising funds for research and development, as any trading is mutual trade among the business owners.
A carbon levy is a direct or indirect tax imposed on the emissions generated by a business owner. Unlike the capand-trade method, there is no limit on emissions and their cost is borne by business owners and not controlled by market forces. The revenue can be used for research and development, and the amount can be controlled by adjusting the tax.
While there is no global carbon tax, it exists at the local level in Norway for the offshore industry and it is about to be applied to the maritime industry in Europe from 2023.
The ICS, supported by International Association of Dry Cargo Shipowners (INTERCARGO), has proposed an international levy to the United Nations (U.N.), as well as MBMs, to encourage the adoption and market penetration of e-fuels by developing bunkering infrastructure from the IMO’s climate fund [114].
A $5B research and development fund has been proposed at the IMO, with money to be raised by implementing a mandatory $2 levy per ton on fuel and to be used to support the development of new propulsion technologies and zero-carbon fuels.
While the IMO has yet to decide whether to impose carbon pricing on ships’ emissions, as a part of the European Green Deal, the EU has included emissions from shipping into the EU ETS effective from 2023 [116] [117]. However, the proposed price for allowances will not be able to fully fund the organization’s decarbonization initiatives.
According to the Poseidon Principles, a global framework created by financial institutions to integrate climate strategies with lending decisions and decarbonize international shipping, implementing carbon pricing will significantly affect the market by reducing the creditworthiness of shipowners [118].
To achieve the IMO’s 2050 target for carbon intensity, even newer ships and those on order will have to be modified or retrofitted to maintain their carbon competitiveness, implying that considerable capital will be needed to upgrade these assets; more conservative assessments will need to be formed for transition risks and earlier depreciations of asset values.
Some critical factors that need to be considered before creating a scheme for pricing carbon include: the scope of the emissions; the political agreement and willingness of the parties, any regulatory loopholes that make it easy to avoid taxation, and the availability and verifiability of the data.
Regional carbon pricing schemes are prone to evasion because of their geographical boundaries. The regulated entities may bypass specific routes and ports to avoid purchasing fuels that are taxed and to skip carbon penalties. To some degree, this type of abuse can be limited by setting carbon prices in line with those imposed on alternative routes, decreasing the incentive to cheat.
While designing a maritime pricing scheme, external factors that influence emissions output, such as market fluctuations, technology and the source of fuel, should be taken into consideration. Shipping, being international in nature, involves cross-border issues that need to be addressed to create a level playing field for all participants.
The EU ETS follows the EU MRV framework [116], in which the regulated entity is the shipping company. The emissions counting covers 50 percent of incoming and outgoing voyages in addition to 100 percent of voyages within the European Economic Area, including port stays. The EU cap-and-trade system is designed to not allow trading allowances with other sectors covered by the ETS.
Conceptually, the ETS is a system that allows participants to reduce emissions where they are most cost effective. But this approach raises the possibility that emission-reducing initiatives will occur in sectors where it is cheaper than the maritime sector, where the cost is estimated to be $400 per ton of CO2
This seems to favor sector-specific cap and linear reduction factors for the maritime sector. However, a closed system is unable to absorb supply and demand shocks in tradable allowances, it is prone to price uncertainty and may result in price volatility if auctioned, necessitating measures to stabilize the price.
The marine EU ETS has yet to be scheduled for trading. Another carbon-pricing mechanism in the pipeline is the FuelEU Maritime initiative [67].
Other upcoming regional schemes that could be linked to form a global maritime ETS network are from the U.S. U.K., China and Japan. Legislation has been introduced in the Natural Resources Committee of the U.S. House of Representatives and is aimed at developing a monitoring system in line with the EU MRV, which could eventually lead to carbon pricing. The reporting data includes CO2 emitted in the U.S. Exclusive Economic Zone by all vessels over 5,000 gt. China’s national ETS is already in place, but it awaits the inclusion of the shipping industry.
Since the EU policy is being implemented earlier, it can help the IMO to accelerate the introduction of carbon pricing at the global level which, for the marine and offshore industries, is likely to emerge from the integration of independent regional pricing schemes. Aligning the features and requirements of those schemes with the IMO’s monitoring system would be a central piece of that integration.
Because a global pricing scheme would naturally include a greater number of vessels, more funds will accumulate, potentially resolving liquidity issues. This would also eliminate the concerns about cross-border carbon leakage and a carbon border adjustment mechanism as there would be no opportunities to buy fuel from countries with laxer carbon prices that would benefit the buyer. The inclusion of the maritime sector into the EU ETS was triggered by an impact assessment conducted by the European Commission (EC 2013); according to the report, an auction-based ETS could reduce the cumulative CO2 emissions from Europe’s maritime sector by 336 million metric tons (Mt) by 2030. The proposed steps for inclusion were designed to navigate any disparities with IMO initiatives.
The IMO’s short- (to 2023), medium- (2023 to 2030) and long-term (post 2030) measures to reduce GHGs are provided in the following table, in comparison with the EU ETS.
The IMO strategies for GHG reduction at a global level include technical measures such as energy-efficient designs and operational indices for ships, alternative fuels, and infrastructural/financial measures such as the International Maritime Research and Development Board (IMRB) fund and MBMs.
Imposing a standard for emission-intensity indices would not assure an absolute reduction in carbon emissions and defining the same for specific types and sizes would pose a significant challenge.
1. Improve EEDI and SEEMP Ship design Standard Complementary
2. Technical and operational energy efficiency for new and existing ships Ship design and operation Standard Complementary
3. Existing Fleet Improvement Program Ship design Standard Complementary
4. Speed optimization and speed reduction Ship operation Standard Complementary
5. Address methane and VOC emissions Ship design Standard Complementary
6. Encourage national action plans Monitoring Voluntary effort by countries None
7. Enhance ITCP Capacity building Voluntary effort by countries None
8. Port infrastructure and renewable onshore power supply Infrastructure Standard Complementary
9. IMRB Fund Research and development Market-based Overlapping
10. Incentives for first movers Deployment Subsidy Complementary
11. Develop guidelines for life-cycle GHG intensity of fuels Monitoring Standard Supportive
12. Promotion of IMO's work on GHG reduction Outreach Joint IMO effort None
13. Undertake GHG emission studies Monitoring Joint IMO effort None
1.
2.
1.
Fuels Standard Complementary
Ship design and operation Standard Complementary
Ship design and operation Market-based Overlapping
ITCP Capacity building
Voluntary effort by countries None
Monitoring Joint IMO effort None
Fuels Standard Complementary
Research, Development and Deployment Subsidy Complementary
Integration of maritime transport in the EU Emissions Trading System).
The nature of the global shipping industry poses issues that would restrict a "polluter pays" principle, such as split incentives that sometimes benefit non-investing entities; the way responsibilities and benefits are shared between the accounting entity and the consignee can also be uneven.
The shipowner, for example, is more closely and continuously connected to the ship and is responsible for construction and retrofit investments, whereas the benefit from these activities primarily goes to the charterers. However, this issue is somewhat resolved by the market competitiveness of hiring rates for ships based on their environmental performance, and by increasing the availability of green financing for emissions-reducing projects.
It is possible to define the fuel supplier as the entity responsible for the emissions, but this approach is more suited to global pricing than regional because it could make the fuel price uncompetitive in the region where carbon pricing is imposed. As a result, fuel purchasers will avoid purchasing in this region, and eventually the revenue from the carbon pricing will decline.
The EU ETS covers ships above 5,000 gt, which is aligned with the IMO fuel data collection system (DCS). This category of ships constitutes 90 percent of all maritime EU CO2 emissions and 55 percent of ships calling ports in the EEA [116]. Including smaller ships would expand the number of polluters paying for their emissions, particularly in the coastal and inland water areas, where shipping activities have a greater impact on the health of local communities.
Carbon markets can have better liquidity and transparency if allowances are allocated by auction instead of by free allowances or grandfathering; however, the auctioning system would cause price uncertainty. Therefore, when introducing the scheme, a gradual change toward an auction format would help to avoid price shocks. For the EU ETS, the phase-in period will see a gradual increase in the percentage of emissions for which allowances must be surrendered.
2023 20% of verified emissions
2024 45% of verified emissions
2025 70% of verified emissions
2026 and onward 100% of verified emissions
Table 12: EU ETS phase scheme.
Repeated failure of surrender may lead to consequences, such as penalties, expulsion, detention and being denied access to the port.
As charterers are responsible for fuel purchases, the carbon price may be imposed on them. In the EU, the carbon price is imposed on the importer or shipper. The mismatch between the charter period and the calendar-based reporting period is a constraint in this regard.
The absence of a pre-determined price also is a constraint to quantifying the carbon price in advance and to include in the charter party.
In a system where regulated entities pay a pre-determined carbon price, creating a common fund to purchase and surrender allowances and handle price fluctuations could help to absorb price shocks. It is estimated by the University Maritime Advisory Services (UMAS) that $1T to $1.4T will be required to build and retrofit ships with improved technology to adopt new fuels and meet the IMO 2050 goal of 50 percent reduction in GHG emissions. To achieve the EU’s ambition of carbon neutrality, $1.4T to $1.9T would be needed to facilitate the adoption of alternative fuels, related infrastructure and energy efficient technologies (EETs).
According to the “Integration of maritime transport into the EU Emissions Trading System” report [100], the EU ETS, if applied on a partially or fully auctioned basis, could accumulate by 2050 approximately between €0.003tn and €0.0043tn based on the carbon price of €30/tCO2 for the European Parliament’s Ocean Fund.
As per a recent report, estimated funds raised in 2030 by the ETS at a €50 ($56) price of per ton of CO2 would be $5B, and $9B at a €103 ($116) price.
The price of carbon, either through a trading scheme or in the form of a levy, needs to be balanced so that it does not become a barrier to continuous ship operation or too weak to create incentives for adopting technology or funds for research and development.
There are other determinants that play critical roles in deciding the carbon price, such as the funds required to encourage the adoption of low-carbon fuels (by improving their price competitiveness) and the user of shipping services. Gradual changes and adjustments in carbon prices will be necessary to avoid price shocks that could detract business owners from adopting low-carbon fuels.
Certainty of a definitive carbon tax helps provide a more robust cost-benefit analysis as decision support to the asset owner as opposed to a market dependent volatile carbon price. A cost-benefit feasibility study is the pre-cursor of any investment project. For a positive outcome of the feasibility study to adopt low-carbon technology, it is necessary to confirm that savings are more than expenses, i.e., the incentives accrued throughout an asset’s life cycle must outweigh the capital investment. Carbon price fluctuation is an obstruction to conducting such analysis.
The free allocation of allowances based on past baseline emissions, known as grandfathering, is suitable for companies with a high baseline, but it does not recognize very recent emission reductions [113].
In general, free allocations are suited to those operators who are prone to cross-border carbon leakage and unable to pass the impact on to their consumers. The potential for carbon leakage is present, but not severe in the marine and offshore industries.
Finding historical data to define a baseline is difficult in shipping due to the disparate types of ships, changing trading areas, owners and operators [113]. Operations and emission intensity are not uniform across the industry, so grandfathering may cause distortions.
On the other hand, benchmarking sector-specific emissions intensity would recognize the efforts of early implementers. By this measure, the emission intensity should be defined carefully because the work output is measured in different ways for different types of ships, such as LNG carriers, dry bulkers, ro/ros, passenger ferries, etc.
For the EU, the number of allowances should be enough to stock the EU Innovation Fund that is intended to support decarbonization initiatives, which include developing alternative fuels such as green hydrogen and its derivatives and new propulsion technologies.
At a global level and in other regions, the International Maritime Research Fund (IMRF), established for the purpose of facilitating green technologies and fuels, has been tasked by the ICS to impose a levy of $2/ton for fuels purchased. This levy could be expected to raise nearly $5B over 10 to 15 years [115].
In the Marine Environmental Protection Committee (MEPC) 76, a mandatory levy of $100 per ton of CO2 for vulnerable countries was proposed by the Republic of the Marshall Islands and the Salomon Islands to be enforced by 2025, followed by adjustments every five years.
Trafigura, a prominent charterer, made a similar proposal for imposing fees and rebates based on the carbon intensity of fuels to assist research and development and the transition of developing states on small islands. Trafigura estimated that pricing at $250-300/tCO2eq, with follow-up adjustments, would compensate for price differentials between conventional fuels and e-fuels.
The scenarios in the European Commission’s 2030 Climate Target Plan forecast renewable and low-carbon fuels to comprise six percent and nine percent, respectively, of the international marine fuel mix in 2030, and 86 to 88 percent by 2050 [117]. The fuels of interest are electrification, biofuels, renewables, other low-carbon fuels and hydrogen derivatives.
•
The proposals in the EC’s Fit for 55 package, which was created to support the EU Green Deal recommended:
• The EU ETS for tank-to-wake emissions.
• The FuelEU Maritime for well-to-wake emissions. (A supply chain for zero-carbon fuels and the power system technologies to use them are not yet mature enough or readily available.)
• A revised directive on alternative fuels infrastructure for enhanced availability of LNG by 2025 and shore-side electricity supply in main EU ports by 2030. (The proposed standard limits the carbon intensity of fuel and compels some ships to use shore power while alongside.)
• A revised directive on energy taxation to remove tax exemptions for the conventional marine fuels sold in the EU for voyages within the EU waters and to facilitate alternative fuels.
A revised renewable-energy directive for achieving a 40 percent share of renewable energy in the fuel mix by 2030 for the transport sector and a 13 percent reduction of GHG intensity by 2030.
Depending on the dynamics of the price for carbon, all these policy options will have different positive impacts on the adoption of low-carbon fuels by narrowing their price differential with conventional fuels; they also have the potential to reduce emissions by improving energy efficiency and reducing fuel consumption.
Emission caps will be adjusted by the number of allowances for emissions and verified by EU MRV data and the number of allowances surrendered.
The annual linear reduction factor by which the emissions cap will be reduced yearly is applied at 4.2 percent and adjusted along with a one-off cap adjustment to achieve the same effect as if it were implemented in 2021 and in alignment with the other sectors under the EU ETS, i.e., 61 percent emission reduction by 2030 in comparison with the 2005 level.
A periodical review every five years from 2023 will provide feedback to the EC regarding the results, effectiveness and progress of the EU ETS and IMO instruments.
A voluntary carbon market for the marine and offshore sectors is in its nascent stage. A private-sector led taskforce — Scaling Voluntary Carbon Markets — has been created and includes an advisor to U.K. Prime Minister for the 2021 U.N. Climate Change Conference of the Parties (COP26), Standard Chartered, the Institute of International Finance and a former commissioner to the U.S. Securities and Exchange Commission (SEC).
The taskforce is working on development of key action items that will be important to build the voluntary carbon market as published in its consultation document in November 2020.
Carbon offsetting can be broadly defined as an action or process of compensating for the CO2 emissions that arise from industrial or other human activity, by participating in schemes designed to make equivalent reductions of CO2 in the atmosphere.
In contrast to compliance markets for carbon, the voluntary carbon market is not regulated, and no one is compelled to participate. It remains extremely fragmented with unequal practices.
Numerous certification labels exist; however, the trend to increase the transparency of the associated value chain continues [45].
Given the complexities of the voluntary carbon market, businesses seeking to achieve net-zero or carbon-neutral status are advised to participate in high-quality carbon offsetting programs to reach their decarbonization commitments, as illustrated in the Code of Best Practices by the International Carbon Reduction & Offset Alliance (ICROA) [45].
Additionally, the use of third-party verification or certification labels helps to increase the transparency of the trading process by monitoring and reporting the amount of carbon reduction a carbon offset achieves.
The various stakeholders and their roles are depicted in the diagram below. Each stakeholder group interacts with others to build an offset cycle.
Independent body certifying the quality of the project. Has to be accredited by a certification label.
Assist the developer in setting up their project, helps them write the Project Initial Note (PIN)/Project Design Document (PDD).
Either people setting up the project, working on the field, or entities owning the financial risk of the project.
Certify the quality of emissions reduction depending on various criteria (social, environmental).
Assist operators and developers in the purchase/selling process of carbon credits.
Figure 57: Stakeholders in a carbon offset program.
A project starts with the appointment of developers, who are responsible for setting up the project [46]. They work with auditors, consultants and certification labels to finalize and issue the project. For example, the project’s scope can be to replace a fossil-fired power generation plant with a renewable energy solution, or it could be to improve a system of forest management or develop a carbon capture sequestration/storage system.
Consultants help project developers explore potential opportunities, estimate the emission reductions, plan ways to achieve them and develop the Project Initial Note (PIN)/Project Design Document (PDD).
Certification labels provide standards and criteria to ensure the quality of a project with various sets of rules, such as Verified Carbon Standard (VCS), the Gold Standard and the American Carbon Registry (ACR) [47]. Before issuance, a third-party auditor accredited by the certification labels should verify the emission reductions estimated by the project.
When a project is ready to be issued, operators provide a link between project developers and the final client. Brokers buy carbon credits from a retailer trader and market them to an end buyer, usually with a commission. The final clients can be service companies, individuals or local authorities who want to offset their carbon footprint through carbon credits [45].
Either a company, local authority or individual that wants to o set its emissions. O er partnerships or strategy consulting to corporates or emissions calculation tools to individuals and o setting solutions online.The road to net zero is difficult. According to a report by the Science Based Targets initiative (SBTi), offsetting is critical for a company to reach net-zero targets, but it cannot substitute scientific methods to reduce emissions from the value chain [48]. The report illustrates the importance of using carbon offsets to neutralize the residual emissions, which are the unabated emissions of a company due to technical or economic constraints [48]. In short, carbon offsets can provide negative emissions to neutralize the portion of emissions that companies are unable to eliminate on their own.
The British Standards Institution (BSI) published the PAS 2060 standard in 2010 to help organizations demonstrate the credibility and veracity of their carbon-neutrality claims and to increase customer confidence. It outlines procedures for quantifying, reducing and offsetting GHG emissions in a specific business sector. These can be used for activities, products, services, structures, projects, cities or events.
While businesses can calculate their carbon footprints, purchase credits and declare carbon neutrality, the PAS 2060 standard establishes a framework for accuracy and certification, which is becoming increasingly critical as society works toward a net-zero world by 2050 (see figure below).
The standard's primary benefits include:
• It is the only globally-recognized certification for the carbon neutrality of organizations.
• It assists businesses in quantifying their carbon footprint and then helps them to reduce emissions through a 12-month review.
• It encourages the support of the climate-finance projects that add social and environmental value.
• It helps businesses demonstrate a voluntary and amicable commitment to climate action
GHG emissions based on accurate measurement data
Emissions through a target-driven carbon management plan
Excess emissions, often by purchasing carbon credits
Through qualifying explanatory statements and public discourse
Figure 58: Basic principles of PAS 2060 composed of four key stages.
Contrary to popular belief, not all carbon offsets are equal. There are two basic types: emission reductions and carbon removal. Simply put, traditional offsets work to retain emitted carbon. Carbon removals entail the removal of carbon from the system.
Figure 59: Two basic types of carbon offsets [49].
As a result, this reveals the many issues with carbon offsets.
1. Additionality: Would that carbon have been offset if the credit was not generated?
2. Leakage: What is the risk of displacing activities that cause GHG emissions from the project site to another site?
3. Verification: Can the offset be verified through a registry and science-based methodology?
4. Permanence: What is the risk of stored carbon being re-released into the atmosphere?
Many businesses, particularly those in sectors that are difficult to abate, need to offset their emissions to meet decarbonization targets, resulting in a surge in demand for credible offsets. The credibility of voluntary carbon credits in transition plans will be scrutinized more closely.
To facilitate global decarbonization, a large, transparent, verifiable and robust voluntary carbon market is required, one that encourages genuine action with high environmental integrity.
Voluntary carbon markets can also play an important role in lowering the cost curves for emerging climate technologies, allowing them to enter the market earlier and be used in direct decarbonization efforts.
To reach net zero by 2050 or earlier, businesses are increasingly committing to neutralize emissions they cannot abate by permanently removing carbon. This may not be sufficient, however, as, ideally, in addition to decarbonizing operations and value chains in line with scientific consensus, businesses also should consider compensating and neutralizing their emissions on the path to net zero.
Staying within the carbon budget has a positive impact on communities in emerging markets and developing countries by encouraging the protection and restoration of natural carbon sinks and the financing of new removal and carbon-reduction technologies.
Rather than focusing solely on net zero as a destination, forward-thinking companies need to go above and beyond. This is referred to as the “High Ambition Path to Net Zero” (as shown in the following figure).
Company A emissions
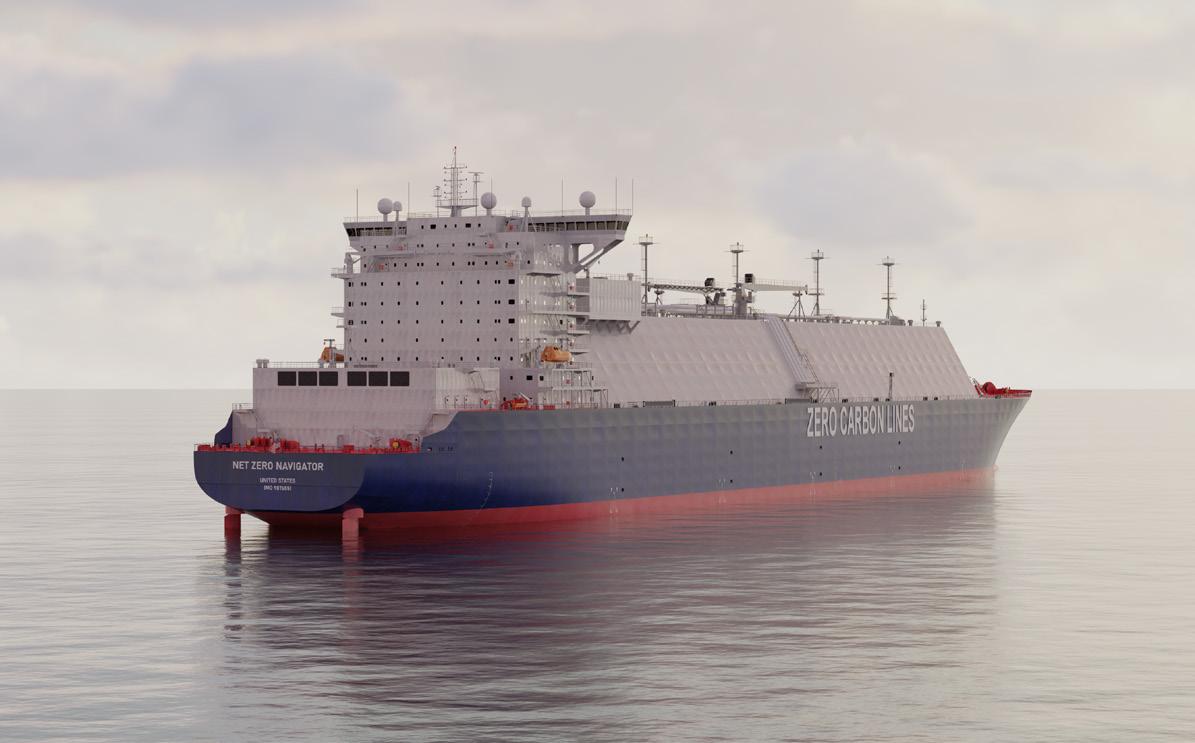
Tonnes CO2e
Decarbonize your own operations and value chain in line with scientific consensus
Decarbonize, and increasingly neutralize unabatable emissions to reach Net Zero as endpoint
Decarbonize, and neutralize and compensate all emissions on the path to Net Zero
Impact on global CO2e budget
• Drastically lower the rate with which the total stock of CO2e in the atmosphere increases by decarbonizing your own value chain until it can go no further
• Drastically lower the rate with which the total stock of CO2e in the atmosphere increases by decarbonizing your own value chain until it can go no further
• Reduce total stock of CO2e in the atmosphere by increasingly removing CO2e from it over time
Use of carbon credits
• None
• High-quality removal credits
• Drastically lower the rate with which the total stock of CO2e in the atmosphere increases by decarbonizing your own value chain until it can go no further
• Reduce total stock of CO2e in the atmosphere by removing CO2e from it now (through new technology-based removal such as reforestation) or as soon as possible (through new technology-based removal such as direct air capture)
• Support others to avoid emissions and preserve nature (e.g., avoid deforestation) and to reduce emissions (e.g., switch to low-carbon technologies)
• High-quality removal credits
• High-quality avoidance and reduction credits
Paris-aligned 1.5 degree pathway Gross emissions Compensation (avoidance/reduction): Ecouraged Compensation (avoidance/reduction): Expected
Neutralization (removal)
Figure 60: The high ambition path to net zero. [50]
Increased community pressure on environmental matters and for the required actions across all industries and sectors, will likely require action and more regulation to lower emissions and promote the sector’s decarbonization.
In this respect we have seen initiatives toward an aggressive decarbonization trajectory and push toward the proactive adoption of cleaner types of energy from regional or industrial stakeholders such as the European Union (EU), financiers, charterers, port authorities and governments as well as shipowners’ associations. This kind of organic pressure from the markets and local stakeholders is more likely to drive change and decarbonization decisively in the mid-term with initiatives such as market-based measures (MBMs), funding research and promoting experimentation. The required decarbonization will be more readily realized by the decisive adoption of the alternative energy sources, either through renewable and low-carbon fuels, or by direct capture.
One of the forthcoming initiatives, under the FuelEU proposed regulation in Europe, will require all containerships and passenger vessels to connect to shore power when in port, after 2030. With the main goal to eliminate the greenhouse gas (GHG) emissions of the vessels when they are at berth, this requirement opens up the opportunity to use renewable or lower carbon produced electricity, improving even further the carbon footprint of the vessels in port and overall.
In the quest for lower carbon emissions and higher energy efficiencies, electrification of the propulsion drive train and other energy consumers on board vessels, provides a flexible approach to facilitate the adoption of cleaner sources of energy and low-carbon fuels. At the same time, more sophisticated energy efficiency technologies (EETs) harnessing renewable sources of energy are providing the necessary step improvement to lower GHG emissions.
Battery technology is a driving force for the electrification of modern vessels since energy storage is the heart of an electrified power generation system. Batteries can be built and adjusted for any given use, storing and converting electrochemical energy into electrical energy. Lead-acid (PbA), nickel-metal hydride (NiMH) and lithium-ion (Li-ion) are some of the chemical types they use.
Supercapacitors, also known as ultracapacitors, or more technically, electronic, double-layer capacitors (EDLCs), are a type of electrochemical energy storage device that includes electrochemical capacitors (ECs). The future of supercapacitors looks bright, with plans to combine a double-layered interface with existing energy storage technologies. The addition of an electrochemical capacitor to applications running on other hybrid devices has resulted in significant improvements in charge and discharge cycle performance.
The use of supercapacitors is likely to increase on vessels that experience rapid changes in electrical load, such as those with dynamic positioning systems, cranes, active heave compensation, or that drill, mine, or pump cargo, due to their nearly unlimited cycle life, immunity to thermal runaway and symmetrical and rapid charging/ discharging rates.
Fuel cells are another promising technology that with the adoption of low- and zero-carbon fuels such as ammonia and hydrogen, become a great option for energy source and conversion in electrified propulsion configurations, while eliminating significant GHG emissions. The fuel cell is an energy generation technology that uses an electrochemical reaction to convert fuel and air into electricity and water. Electrical energy is produced in the form of direct current (DC) power, similar to an electrochemical battery. The fuel and oxidant are stored outside the cell, unlike a battery, and are transferred into the cell as the reactants are consumed. The fuel cell converts energy rather than storing it, and it can continue operating as long as fuel is available.
ABS is involved in different joint industry projects (JIPs) that investigate the technical and economic feasibility of innovative solid oxide fuel cells (SOFCs) powered by ammonia, among others. At the initial stage, such projects explore the technical feasibility on an experimental basis, with the aim to build a working prototype that can be later developed into a fully functional unit to power commercial applications. Such applications may start from the full power supply to harbor craft such as tugs and launch boats and eventually increase substantially to integrate into hybrid systems of larger vessels with versatile and high-power demand, such as containerships.
With low-carbon fuels as enablers for the long term decarbonization goals, the development of new supply chains is quite challenging, as existing infrastructure may be restricted or not yet adopted in the maritime sector. Propulsion engines, fuel cells and other consumers at large scale are expected in the near future, and the industry needs to prepare the supply chain and infrastructure for these new fuels, addressing a series of safety, technical, environmental and compatibility challenges. The two main fuel components of the hydrogen value chain are ammonia and hydrogen, which pose their own challenges to the transport and overall supply chain. Although they have been carried as liquid cargo for quite some time, especially ammonia without significant challenges, their use as fuels is beyond the current frameworks.
Ammonia, being an easier and safer fuel to handle, has been prioritized for adoption, while there are several bunkering feasibility projects investigating the viability of an ammonia bunker supply chain in major port hubs like Singapore, Rotterdam and others. In Singapore, with the support of the Maritime Port Authority (MPA), there are a couple of different initiatives investigating the feasibility of ammonia bunkering in the port of Singapore, starting from the sourcing of blue and green ammonia, along with the transportation, storage and bunkering. Purpose built ammonia bunker vessels are being designed with ABS having awarded approval in principle (AIP) to two such vessels designed for bunkering operations in Singapore.
At present, the IMO and class societies have requirements for ammonia (NH3) carriers but no detailed prescriptive Rules or regulations to build and class NH3 fueled bunker vessels, and therefore, designs need to apply the International Code for the Construction and Equipment and Ships Carrying Liquefied Gases in Bulk (IGC Code), International Code of Safety for Ships Using Gases or Other Low-flashpoint Fuels (IGF Code) and the International Convention for the Safety of Life at Sea (SOLAS) alternative design process contained therein. The IMO’s IGC Code covers requirements for transportation of anhydrous ammonia in bulk and those requirements can be adopted for fuel storage on proposed ships with some modification for additional risk identified.
Like the marine industry, other industries do not have extensive experience using NH3 as fuel. Ammonia is widely used in refrigeration and farming and there is extensive experience related to hazards of NH3
With the entry into force of IGF Code from January 1, 2017, many other ship types are being built using gases or lowflashpoint fuels for propulsion. The IGF Code currently does not provide prescriptive requirements to cover NH3 as fuel; however, it provides the mechanism to approve alternative technical design arrangements for using NH3 as fuel, pending acceptance by the flag State.
The first step in this process is to perform a preliminary HAZID study at the preliminary design phase of the project to identify high-level risk.
The HAZID study is a technique for early identification of hazards and threats and can be applied at the conceptual or detailed design stage. Early identification and assessment of hazards provides essential input to concept development decisions at a time when a change of design has a minimal cost penalty. A HAZID study is carried out by an experienced multi-discipline team using a structured approach based on a checklist of potential hazards. Potential problems are highlighted for action outside the meeting. Typical hazards considered include environmental, geographical, process, fire and explosion, and health.
This HAZID supports the alternative design process and follows established risk assessment methodologies to satisfy the IGF Code (ammonia as fuel) risk assessment requirements detailed under 4.2.1 and 4.2.3 of the IGF Code as follows:
“4.2.1 A risk assessment shall be conducted to ensure that risks arising from the use of low-flashpoint fuels affecting persons on board, the environment, the structural strength or the integrity of the ship are addressed. Consideration shall be given to the hazards associated with physical layout, operation and maintenance, following any reasonably foreseeable failure.
4.2.3 The risks shall be analyzed using acceptable and recognized risk analysis techniques, and loss of function, component damage, fire, explosion and electric shock shall as a minimum be considered. The analysis shall ensure that risks are eliminated wherever possible. Risks which cannot be eliminated shall be mitigated as necessary. Details of risks, and the means by which they are mitigated, shall be documented to the satisfaction of the Administration.”
This process is to ensure that the requirements of 2.3 of the IGF Code have been met such that the arrangements for ammonia as a fuel meet the intent of the goal and functional requirements of the IGF Code and provide an equivalent level of safety of the relevant chapters.
Establishing robust bunkering infrastructure poses unique challenges due to the capital investment required to not only scale up the production, but also the transportation and storage of any such fuel. With this in mind, the United States (U.S.) Department of Energy (DOE) has established the Hydrogen Shot, which is aimed at reducing the price of hydrogen from $5 to $2 per kilogram (kg) by 2026 and to $1 per kg within one decade.
In the U.S., the DOE has not only established the Hydrogen Shot, which sets the goal, but has also heavily invested in the expansion of hydrogen as a fuel. The recent passage of the bipartisan Infrastructure Bill allocated $9.5B toward the effort, with the allocation being displayed in the following figure.
$1,000,000,000
Figure 62: Clean hydrogen allocation in infrastructure bill.
The allocation certainly informs where two major hurdles are as it relates to implementing clean hydrogen at scale. Much of the spending is allocated toward the development of hydrogen hubs, which are strategically selected locations in which the value chain of the hydrogen economy will interact in close proximity. The established criteria for determining a hub location are feedstock diversity, end-use diversity, geographic diversity, natural gas availability and additional discretionary criteria. The value chain would include the producers, consumers and the connected infrastructure. Key to this list is connected infrastructure, which would be the means by which hydrogen is stored and transported. Central issues regarding transportation and storage that the funding is targeted to assist in solving are:
• Weight and Volume
• Efficiency
• Durability
• Refueling Time
• Cost
Durability, weight and volume and the unique hazards of hydrogen will have major implications in the maritime industry even when compared to other liquefied gases.
In addition to providing financial support, the bill also establishes a framework to develop a national strategy and roadmap for clean hydrogen. The strategy and roadmap will describe the technically and economically feasible steps to be taken to ensure widescale production, processing, delivery, storage and use of clean hydrogen. The inclusion of the strategy and roadmap in the bill affirms the need for continual government involvement at the highest level to ensure the industry can achieve its robust decarbonization goals.
Similar to the U.S., the European Union (EU) has established a flurry of initiatives to assist in scaling up green hydrogen capabilities. The EU took deliberate action in 2020 to commit to hydrogen through incorporating the fuel into the EU strategy for energy system integration. Concurrently, they established the Hydrogen Energy Network, European Clean Hydrogen Alliance, and the Horizon 2020 research program.
The EU’s hydrogen strategy was developed taking into account the goal of hydrogen making up approximately 13 to 14 percent of the energy mix in Europe by 2050. This goal was established acknowledging the gaps of a purely electrified economy run by renewable energy. The EU envisions a society in which renewable hydrogen is commonplace, generated primarily using wind and solar energy. However, this is the ideal solution and in the interim, steps are necessary to ensure a seamless transition from a carbon intensive economy to a carbon neutral one.
Hydrogen Hubs Electrolysis Manufacturing and Recycling R&DThe first of these steps is the further development of low-carbon hydrogen coupled with carbon capture. This step is more complex than meets the eye as the infrastructure for not only hydrogen, but also carbon capture and carbon dioxide (CO2) sequestration needs to be further developed.
The EU strategy for infrastructure development mirrors that of the U.S. through the development of regional hydrogen infrastructure called “Hydrogen Valleys.” This will facilitate the use of decentralized renewable energy sources and the ability to locally develop the production and storage of hydrogen. This approach isolates the specific challenge of transportation, at least on a large scale, to increase feasibility in the near term while further research and development is conducted. Doing so will also spread the capital investment over multiple decades, allowing for the targeted investment of hydrogen throughout the next three decades leading up to 2050.
The necessary capital investment is impressive to say the least, with the EU laying out an investment agenda for an array of activities including electrolyzers, solar and wind energy, carbon capture and storage (CCS), the logistics of hydrogen, and end-use sectors such as the steel industry. The table to the right shows the necessary investment in the various topics by the EU.
Electrolyzers $24B to $42B
Solar and Wind $220B to $340B
CCUS $11B
Logistics $65B
Steel 160 million per mill
As in many other industries, the maritime sector's decarbonization targets must be met by all the partners in the value chain. Financial institutions will play a critical role by using sustainable finance to fund the reduction of emissions. Given that maritime transportation supports a disparate number of sectors — including trade, fishing, offshore, naval operations, passenger transport and tourism, financing their transition to sustainability will be a complex task.
More than 50,000 merchant ships operate globally, transporting a diverse range of cargo. This fleet is registered in more than 150 countries and manned by at least a million seafarers.
Ships are technically sophisticated, high-value assets (larger, high-tech vessels can cost more than $200 million [M] to build), and merchant ship operations generate an estimated annual revenue in excess of $500 billion (B) in freight rates alone [51]. The table below summarizes the main segments of this industry, along with the typical types of ownership and financiers.
Table 13: Maritime transportation segments: vessel types, ownership, financiers [52].
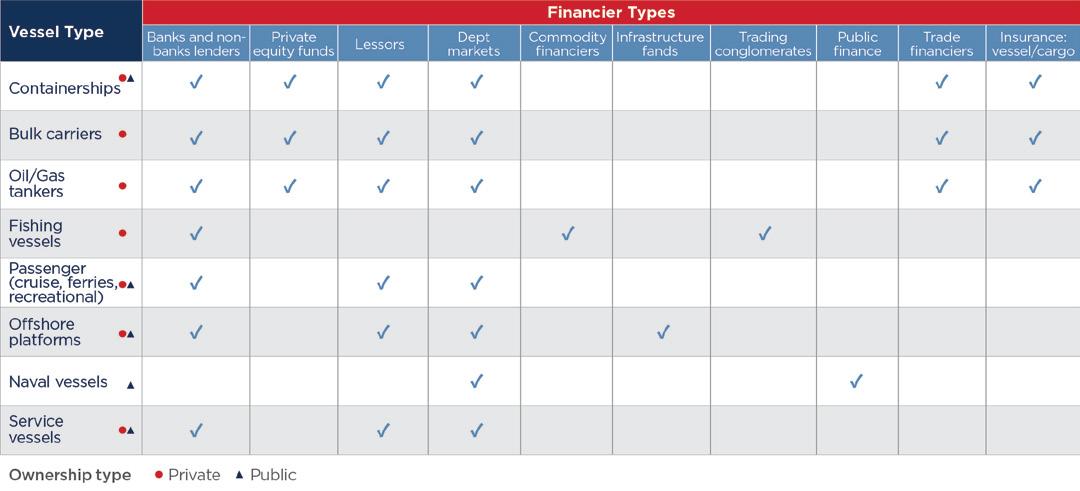
In the offshore sector, as multiple oil and gas fields reach the end of their productive lives and the world transitions to a low-carbon economy and new sources of energy, many offshore platforms and associated infrastructure will become obsolete in the next decade [53]; a recent report estimated that the sector’s cost of decommissioning will reach nearly $100B between 2021 and 2030.
The pressure comes from many sources, including: the United Nations’ (U.N.) Paris Agreement (COP21); state and industry regulators such as the IMO; financial institutions (Poseidon Principles); prominent cargo owners (Sea Cargo Charter); and individual companies’ Scope 3 emission targets, which impact their entire supply chains.
Sustainable debt is one of the fastest-growing asset classes in finance. Within that broad category, there are many different types of debt instruments, some of which are attracting more attention than others. Below are some of the different types of sustainable debt currently driving growth within the asset class and helping to make sustainability a fundamental part of the debt issuance and investment processes.
The world of green, social, sustainable and sustainability-linked (GSSS) bonds is expanding at an incredible pace. GSSS bond issuance reached a record high in 2021; it is now estimated to account for more than 11 percent of the global bonds issued, up from less than seven percent in 2020.
The issuance of GSSS bonds is expected to pass the trillion-dollar barrier for the second consecutive year in 2022, reaching $1.35 trillion (T) [54]. Though sustainable debt remains a small portion of the total debt market, the $1.6T issued in 2021 is comparable to Canada's gross domestic product (GDP) in 2020.
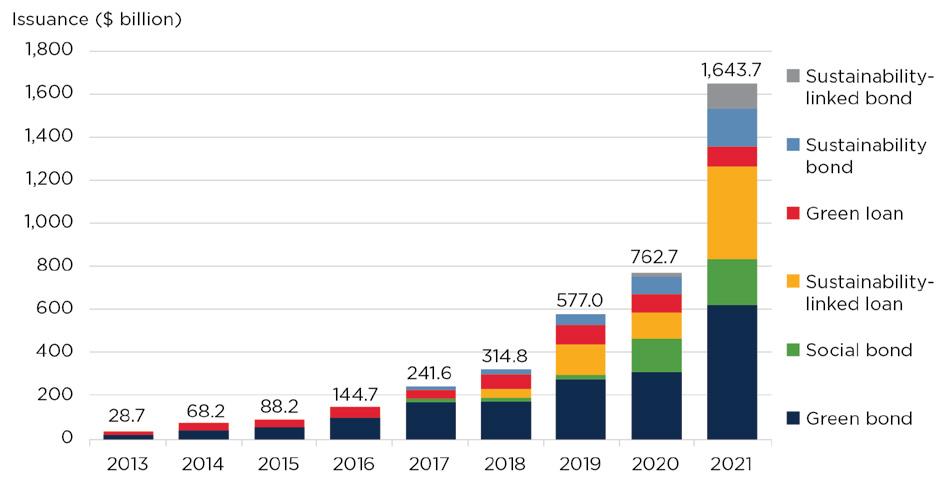
Most of the green debt being issued at the moment is in the form of proceeds-based instruments such as green bonds — the “G” in GSSS. These include any type of debt instrument from which the proceeds are used solely to finance projects with a clear environmental benefit. In other words, they are activity based.
While most people think of green bonds in terms of solar or wind energy, they also can be used to finance anything from conserving biodiversity and natural resources to pollution control.
However, GSSS encompasses much more than just green bonds, and not all forms of sustainable finance attract the same level of investor interest.
Consider transition bonds, which fund projects such as natural-gas power plants and are more environmentally friendly than coal, but do not qualify as green energy.
Figure 63: Annual sustainable debt issuance from 2013 to 2021 [55].Interest in transition bonds waned in 2021; less than $5B were issued, amid growing skepticism among investors about whether these projects and sectors represented genuine efforts to decarbonize the global economy or whether they simply represented “transition washing.”
“A sustainable financial system is one that creates, values and transacts financial assets in ways that shape real wealth to serve the long-term needs of an inclusive, environmentally sustainable economy.” [56]
Sustainable finance encompasses all financial activities that target sustainability — across asset classes (including equity, debt [bonds and loans], commodities or derivatives), products and services; these activities can also include corporate loans and retail mutual funds that invest in sustainable companies.
Green finance refers to sustainable finance that is focused on environmental risks and opportunities, most frequently (but not always) climate change. Additional green topics include waste management, water usage, the conservation of natural habitats and activities that prevent the loss of biodiversity.
Climate finance is an umbrella term that encompasses all financial flows associated with climate change, whether for mitigation or adaptation; it has been historically more associated with public-sector than private-sector funding.
Sustainable finance has been rapidly gaining popularity, both in its broadest sense and in relation to its subtypes, such as green or climate finance. Its growth can be measured in many ways, from the amount of sustainable assets under management to the proliferation of specific financial instruments.
Given the growing awareness of sustainability, some financial firms have been inclined to label their offerings or practices as sustainable without harmonizing definitions. Industry standards and oversight have evolved organically and as a result of regulatory action.
Additionally, there is growing agreement on how to incorporate environmental, social and governance (ESG) factors into lending and investing practices, specifically in the form of portfolio scores and metrics. The use of specific, defined and labeled sustainable financial instruments, such as green bonds, has also grown in popularity.
The trend in sustainable finance transactions, products and offerings is being driven by many parts of the financial system, including: mainstream banks, insurers, asset managers and owners, stock exchanges, rating agencies, etc. — some of which create dedicated sustainability divisions. There also has been an increase in the number of smaller, pure-play green or ESG financial firms.
As is the case with conventional corporate loans, green or sustainability loans are typically the result of an agreement between a small number of banks and a borrowing company. Green and other sustainability bonds are used to raise capital by private and public entities and like other types of bonds, they are underwritten by banks and traded on secondary markets.
Sustainable or green-fund products are available to institutional and retail investors. These may be sustainable instruments (for example, a bond fund comprised entirely of green bonds) or other assets (e.g., shares of sustainable companies).
In general, sustainable financial products are classified into three broad categories. In the first, the proceeds are designated and ring-fenced for long-term use (e.g., green bonds). Next, there are financial instruments that are linked to sustainability targets; for example, through interest-rate penalties or rewards for meeting specified targets. In the last set of products, sustainability again serves as selection criteria, such as inclusion in a sustainable equity fund or through targeted engagement with a company's management.
The key difference between green and sustainability-linked financial instruments (such as bonds and loans) is how proceeds are used.
Figure 64: Approaches to key decision-making in sustainable finance instruments [57].
As with green bonds, green loans are relevant for borrowers who have a clear asset base that qualifies as green, such as renewable energy, low-carbon transportation projects or energy-efficiency investments.

The sustainability-linked bonds or loans approach allows the borrower to use the loan for general corporate purposes, with pricing and possibly other terms tied to improved long-term sustainability performance (see figure below). This type of loan is appropriate for a company that wants to link its cost of capital to its sustainability performance [57].
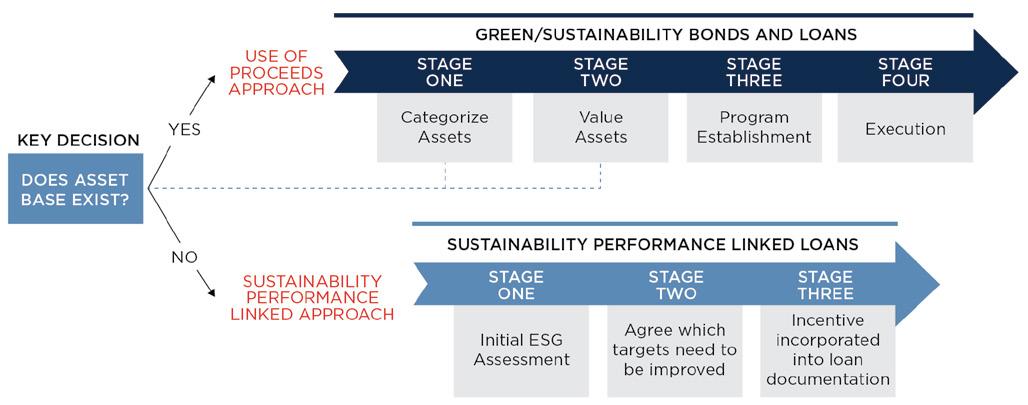
Figure 65: Use of proceeds from sustainable finance [57].
It is expected that players in the maritime and offshore value chains will become more receptive to these types of sustainable finance products as climate change and sustainable development become more prominent in their corporate strategies and risk assessments.
A growing portion of regulatory activity relating to sustainable finance is focused on the underlying economic activity being financed, rather than on financial products or disclosures.
Additionally, regulators have been working to better define sustainable activities. In this regard, the EU has advanced the furthest. The EU taxonomy, which was first published in draft form in March 2020, establishes performance thresholds (referred to as “technical screening criteria”) for economic activities, sector by sector and subsector by subsector.
The taxonomy is agnostic regarding financial instruments and funding mechanisms. Once it is implemented, any investment or lending for a recognized activity counts as sustainable, whether it is a loan, a green bond or project financing.
The EU’s taxonomy is notable for its level of precision in defining each subsector. To qualify as green, activities must make a significant contribution to at least one of six environmental goals: climate-change mitigation; adaptation to climate change; sustainable use and protection of water and marine resources; transition to a circular economy; pollution prevention and control; and protection and restoration of biodiversity and ecosystems.
A condition of their inclusion is that they also must explicitly avoid harming any of the other five objectives.
The proportion of financial activities that incorporate sustainability is expected to continue growing, as stakeholder, government and peer pressure intensifies, and sustainability becomes normalized in society.
However, for sustainable finance to develop further, additional action may be required, not only on harmonization and regulatory oversight, but also on more fundamental items such as cross-comparable measures of non-financial impact.
The development of a holistic infrastructure ecosystem for the hydrogen value chain will be the key enabler for the adoption of the low- and zero-carbon alternative fuels like hydrogen and ammonia. The transportation of hydrogen is a key element of this value chain and fundamental to its development, similar to the production facilities and energy consumers.
The initial development of liquid hydrogen carriers, in the early prototype stages, is focusing on two different size categories, of 25,000 cubic meters (m3) and 80,000 m3, both using double-wall, spherical tanks carrying liquid hydrogen (LH2) at ambient temperatures and -253° C.
The smaller size ship is based on a slightly larger version of the spherical tanks currently being built by the National Aeronautics and Space Administration (NASA) for land-based hydrogen storage, while the larger ship represents a reasonable extension of current technology to apply the same concepts to the approximate capacity of the current largest size range of liquefied petroleum gas (LPG) carriers. Boil-off rate (BOR) is a significant issue for liquid hydrogen considering the very low temperatures required, and special tank design, as well as special refrigeration required to control this boil-off. The latest integrated refrigeration and storage (IRAS) under development by NASA has been considered for these concept designs.
Hydrogen, a highly volatile gas, remains in its critical phase for a vast range of pressure values at temperatures above -240° C. So, the best density of hydrogen as a compressed gas at ambient temperatures that can be achieved by pressure vessels is around 50 kg/m3 at 700 bar and ambient temperatures. This is currently possible only in very small, hightensile steel or carbon-reinforced plastic bottles. Tanks for this pressure level typically hold only a few hundred kg of H2 and are not suitable for large shipboard tanks. Instead, the density of liquid hydrogen at -253° C and ambient pressure is approximately 73 kg/m3. This makes liquid hydrogen (LH2) at cryogenic temperatures the only practical way to store and transport large quantities of this gas, even ignoring the complications and risk inherent in high-pressure storage. Liquid hydrogen can only be stored in double-walled steel tanks with vacuum insulation if BOR is to be minimized prior to refrigeration.
The IRAS through a helium refrigerator is needed in addition to the effective insulation in order to achieve zero BOR. This is not re-liquefaction of the boil-off, but rather refrigeration of the liquid H2 to a temperature below the boiling point to minimize the boil-off. Helium refrigerators of sufficient capacity are available, but their capital expenditure (capex) can be significant. Small helium losses from the refrigerator are unavoidable, so regular helium replenishment should be considered.
Zero BOR does not mean zero hydrogen leaks, as hydrogen tends to leak through any non-welded joint due to the small molecular size, even when sub-cooled and densified. Furthermore, the small molecular size is responsible for steel embrittlement. These characteristics impose design constraints to the storage system in terms of general architecture and material choices. High-strength steels are the alloys most vulnerable to hydrogen embrittlement, thus the use of lower strength steels and reduction of residual and applied stress are paramount to avoid fracture due to hydrogen embrittlement.
Currently, the scaling of vacuum-insulated tanks beyond 5,000 m3 is a challenge. In principle, the potential BOR reduces as the tank volume goes up, since heat transfer is proportional to the tank surface, while BOR is expressed in terms of a percentage of the tank volumetric capacity. However, larger tanks would exacerbate issues with insulation quality control and appropriate refrigeration throughout the liquid volume.
Tank shape also has an effect on BOR, with spheres having the best surface to volume ratio. Cylindrical tanks can also be used but the surface to volume ratio (and thus the BOR) progressively gets worse as the length to diameter ratio grows bigger.
Cargo transfer is a significant aspect of the operation that requires a similar level of insulation performance of the piping and pumps as used for the storage tanks, but to minimize BOR during transfer it is also essential that pipe run lengths are kept to a bare minimum. Inerting hydrogen lines is also an issue. Although, for methane, inerting is typically done via nitrogen (N2) which can be generated on board via a nitrogen generator, inerting of LH2 piping cannot be done by N2 since N2 will freeze/solidify, therefore helium may need to be supplied for LH2 piping systems.
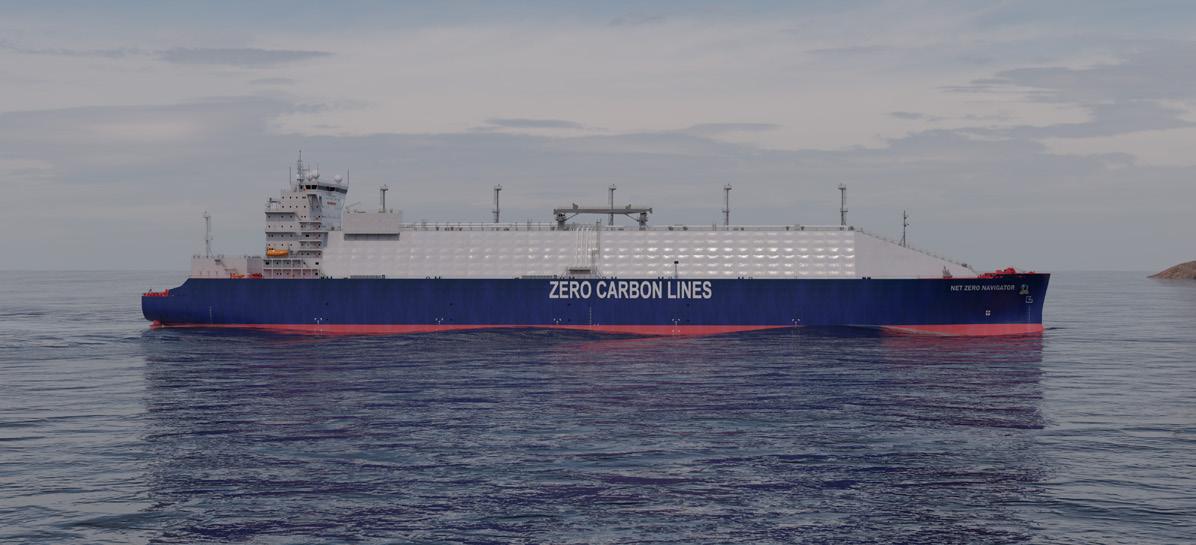
Capex can be very significant both in terms of vacuum-insulated tanks and a refrigeration system. Capex of a helium refrigeration system is proportional to its rated capacity, so optimizing the insulation of the storage tanks also means reducing the size of the refrigeration plant and associated cost. Tank capex is instead proportional to the tank volumetric capacity as well as the insulation system. Typically, a perlite insulated tank of 1,000 m3 costs in the range of $3M. The same tank might need a 1.4 kW helium refrigeration system, with an associated capex of approximately $1.5M to $2M.
In terms of ship design, it is important that radiation heat transfer is kept to a minimum. Several techniques have been employed to achieve this, the simplest of which is to use highly reflective paint for the external tank shell. If the tanks are completely internal to the ship, similar techniques might also be beneficial for the deck above.
Length Overall 198.681 m
Length Between Par�culars 203.471 m
Breadth, Molded 32.200 m
Depth, Molded 17.950 m
Cb at Design Dra� 0.770
Dra�, Design 7.823 m
Lightship 25,877.5 MT
Deadweight at Design Dra� 13,653.4 MT
Displacement at Design Dra� 39,530.9 MT
Main Engine, Installed 6660 kW
Main Engine, NCR 5994 kW
Auxiliary Engine 3242 kW
Total Power, Installed 13143 kW
Speed 16.2 knots
Fuel Consump�on, Propulsion 40.0 MT/day
Cargo Refrigera�on 900 kW
TANK CAPACITIES
Ballast 26092.7 m3
LNG 1307.0 m3 MDO 600.0 m3 LH2 24910.0 m3
Range at Design Dra� & Speed 6000 n. Miles
25K m3 LH2 Carrier
25K m3 LH2 Carrier SHT: 1/1
DATE: April 22, 2022 REV: 0
This design incorporates advanced technologies similar to those employed by NASA for its hydrogen storage extension program at the Kennedy Space Center in Cape Canaveral, Florida. However, to reflect the feasibility of current technology to realize such design, the ship’s main and auxiliary engines are powered by liquefied natural gas (LNG), which is stored in membrane tanks at the bow. The main engine is sized to meet the maximum propulsion power capacity of 6.7 megawatts (MW), plus 3.2 MW for auxiliaries. The LH2 storage system features NASA’s IRAS to achieve zero boil-off, on the knowledge that, even at current LNG prices, venting of hydrogen cargo would not only be dangerous but also significantly more expensive than the methane needed by the cargo refrigeration system and associated capex. Cargo refrigeration is provided by a helium plant needing around 1.0 MW of electrical power. The propulsion power is provided to twin high-performance propellers matched to rudder bulbs, having assumed that the remaining auxiliaries’ power would be in the range of 0.85 MW while sailing. The main engine and fuel tank capacity are sized to provide enough power to the vessel to sail at 16.2 knots with a 20 percent sea margin for 15.5 days, covering 6,000 nautical miles with the full auxiliary load of 1.85 MW.
We are showing the liquid hydrogen stored in spherical double-skin steel tanks insulated with low-vacuum glass bubble. These are 12.1 meters (m) in external radius and 10.6 m in internal radius with 25 millimeters (mm)-thick internal and external shells, and they weigh around 1,500 million metric tons (Mt) each. The tanks are protected from direct sun irradiation by a top and main deck painted in high-reflective white paint, ensuring a maximum temperature of the tanks outer shell of 54° C when the ambient temperature reaches 45° C. Cargo temperature is maintained at -253° C. BOR calculation shows that a value of 0.11 percent is achievable in absence of IRAS at ambient pressure. However, high maximum allowable working pressure (MAWP) of 6.2 bar gauge (90 psig) is the driving factor for the wall thickness.
Damage stability is ensured by separating each spherical tank hold from the neighboring ones. Furthermore, the LH2 inner tanks are designed so that they would be fully contained within the ship’s B/5 IMO damage boundaries, ensuring that any collision would at worse cause an increase of the BOR which the vessel would have to contain with a combination of over-pressure, refrigeration and controlled cargo venting/flaring.
Loading conditions for all LH2 carriers are challenging due to the extreme ratio of cargo weight/volume. This implies that even at full load departure the vessel would have to use part of the large SWB capacity in order to ensure control of trim, propeller immersion and structural strength. It is also for this reason that the hull features a twin propeller with a gondola stern similar to the hulls of modern LNG carriers so that a shallow draft would help minimize the need for SWB. Further design optimization might be achieved converting some of the SWB tanks to permanent FWB.
Length Overall 290.000 m
Length Between Particulars 297.000 m
Breadth, Molded 47.000 m
Depth, Molded 26.200 m
Cb at Design Draft 0.770
Draft, Design 11.500 m
Lightship 46,237.3 MT
Deadweight at Design Draft 78,072.9 MT
Displacement at Design Draft 124,310.2 MT
Fuel Cell Capacity 14900
Battery Capacity 166800 kWh
Propulsion Motors 8500
Contrarotating Pods 5400
Speed 16.2
Fuel Consumption, Propulsion 24.0 MT/day
Auxiliary Power 1000
TANK CAPACITIES Ballast 83611.3
LH2 79403.5
Range at Design Draft
Speed 6000
80K m3
DATE: April 22, 2022 REV: 0
SHT: 1/1
Similar to the 25,000 m3 LH2 carrier, this vessel capacity might become required once the hydrogen market is more established.
This design also incorporates a twin screw gondola stern to maintain propulsion efficiency and alleviate the need for permanent ballast, but it is fully electric with all power provided by hydrogen-fueled proton exchange membrane fuel cells (PEM-FC) fuel cells and load-balancing batteries. The fuel cells are sized to meet the maximum power capacity of 1.0 MW for auxiliaries and 13.9 MW for propulsion, giving a total of 14.9 MW. The propulsion power is provided to a pair of contra-rotating propellers, driven by conventional shafts directly connected to electric motors with a maximum power equal to 4.25 MW each, and a second pair of propellers on steerable pods also driven by electric motors with a maximum power equal to 2.7 MW each. There is a minimum installed battery capacity of about 169 MWh which is used for power conditioning, dynamic energy stability, and hybrid operations for maintaining speed in a seaway. All hydrogen needed for the PEM-FC is provided by the cargo boil-off, controlled by a small 0.5 MW refrigeration plant.
This PEM-FC/battery set is sufficient to provide enough power to the motors to take the 20 percent sea margin for 15.5 days at 16.2 knots, even with the full auxiliary load, thus providing the same 6,000 nautical miles range. The LH2 is stored in spherical double-skin E690 steel tanks insulated with a low-vacuum glass bubble. These are 16.6 m in external radius, 15.6 m internal radius, 40 mm thick internal and external shells and weigh around 2,500 Mt each. BOR is estimated to be 0.39 percent which is sufficient to provide gaseous hydrogen to the PEM-FC working at full power at ambient pressure. The small IRAS helium plant is activated to lower BOR when lower PEM-FC output is needed. Intact stability, damage stability and cargo protection are similar to those of the 25,000 LH2 carrier.
Over the last few years, the maritime industry has been exploring ways to implement zero-carbon fuels — such as ammonia, blue hydrogen, biofuels and e-fuels (e-ammonia, e-hydrogen, e-methanol. e-diesel, e-LNG) — and align with the IMO’s GHG goals, which translates to an 85 percent reduction in CO2 emissions per ship by 2050.
However, the technology readiness level (TRL) for many of these technologies is currently quite low. The fuels are not cost-competitive without a bridging subsidy that allows operators to use them at scale. In addition, some of these lowcarbon fuels may be low carbon at the point of use, but that assessment does not take into consideration the life-cycle emissions of the full production process (upstream, midstream fugitive emissions, etc.).
According to the IMO, the future price of alternative fuels with (blue hydrogen) and without carbon (green hydrogen) are estimated to have “marginal abatement” costs of €258/ ton and €416/ ton, respectively.
Fuel-saving measures such as the optimization of propellers, wind power and solar panels alone cannot reduce CO2 emissions by 85 percent per vessel. Hence, using alternative fuels would be very expensive.
Another option under consideration is ship-based carbon capture systems (SBCC), which involve capturing the postcombustion CO2 from traditional fuel-based vessels such as diesel, LNG, and marine gas oil (MGO). The CO2 is then liquified and stored temporarily on board a vessel before being permanently sequestered in geological sites (onshore or offshore). The rate at which CO2 emissions are reduced is higher than any fuel-saving measures [101].
Luo and Wang (Luo and Wang, 2017) conducted a study on a 17 MW diesel-fueled ship and concluded that SBCC was a feasible technology with an estimated cost of €77.50/ton with a 73 percent capture rate; this would increase to €163.07/ ton and with a 90 percent capture rate if additional equipment was installed [102].
Feenstra et al. [103] discussed the conceptual design and integration of an SBCC system on board a diesel and LNG ship. The two reference ships were a 1.28 MW inland ship fueled by LNG and diesel and a three MW cargo ship fueled by LNG. This study concluded that the SBCC concept was most cost-efficient when implemented on LNG-fueled ships.
The cost of carbon capture was calculated to be €120/ton using monoethanolamine (MEA) as the capture solvent and €98/ton using piperazine. The authors also concluded that heat from the exhaust gas could be transferred to the SBCC process to achieve a higher capture efficiency.
In 2020, Monteiro et al. [104] analyzed SBCC implementation on three LNG fueled ships: a one MW inland ship; an eight MW dredger; and a 36 MW cruise ship. MEA was the capture solvent and the capture rates with heat integration between the CO2 product and the LNG were calculated at 75 percent, 54 percent and 69 percent, respectively.
The cost of CO2 capture in these three cases was estimated to be €301/ton, €115/ton and €154/ton, respectively, depending on the scale of the system and the availability of heat.
Additionally, in 2021, Stec et al. [105] researched using SBCC on a medium-range tanker running on heavy fuel oil (HFO) with a power of 9.96 MW using MEA as the solvent. It was found that the CO2 capture rate ranged between 31.4 percent and 56.5 percent, depending on the ambient conditions.
There were multiple other studies conducted in the past two years. In 2021, Long et al. [106] conducted a study using SBCC on a three MW diesel-fueled ship and found that, with MEA as the solvent, up to 87.4 percent capture was achieved; using an advanced solvent (a mixture of MEA+PZ, MDEA +PZ) made it possible to capture up to 88.9 percent and 90 percent, respectively, of the CO2. An advanced process configuration with MDEA+PZ as the solvent, increased the capture rate again to 94.7 percent.
Awoyomi et al. [107] analyzed the SBCC technology on board an LNG-fueled ship with a power of 10.3 MW using aqueous ammonia as the capture solvent. Here, the capture rate was between 60 percent and 90 percent, with the cost of capture between $149 and $117 per ton, respectively.
Ammonia does have a few advantages, such as no corrosion problems, higher loading capacity, multipollutant capture and production of value-added products as by-products. The downsides are slow kinetics and high volatility leading to larger SBCC equipment.
In March 2022, the Monaco-based tanker operator, Scorpio Tankers Inc., signed a memorandum of understanding (MOU) with Carbon Ridge, a California-based company, to develop an onboard carbon-capture system. Carbon Ridge is a startup working on commercializing current gas-separation technologies without having to make large structural modifications [108].
In 2021, the South Korean shipbuilder, Daewoo Shipbuilding & Marine Engineering Co., Ltd, developed a technology that collects and stores the CO2 output from ship operations. It uses an ammonia water-absorbent and the capture was verified by Hi Air Korea [109]. Also in 2021, the Japanese shipping company Kawasaki Kisen Kaisha, Ltd. separated and captured CO2 from a coal carrier [108].
In Europe, the Dutch maritime technology company, Value Maritime, has developed an onboard CO2 capture and storage solution that has the option of charging a CO2 battery, which then can be offloaded and used to support crop growth. This is an example of a truly circular solution [110].
The technology enabling the adoption of carbon capture on board is focused primarily around post-combustion capture which captures carbon dioxide from the exhaust gas after the combustion of fossil fuel, as opposed to precombustion and oxy-fuel methods that are not suitable for retrofits on existing vessels. During the post-combustion capture, the 11 to 13 percent carbon content of the exhaust gases is isolated and stored separately for further disposal.
• Amine Absorption of the carbon in post-combustion is achieved by the mixing of the absorbent solution of MEA that captures the carbon dioxide and later is regenerated by recirculation through heat recovery exchange, producing water and CO2 that is purified and liquified for storage on board.
This technology is well developed and has a TRL of nine, meaning it has already been proven in a shoreside operational environment. However, it has mainly been installed on large-scale land applications, and it would have to be scaled down for ship-sized applications. It can have a very high capture rate, between 90 and 98 percent. The variable capture capability might make it more competitive in the early years of the GHG regulations, but still future-compatible with the increased regulations with only additional operating expense (opex) and possibly no additional capex.
On board ship, this technology would perform better if the ship were already fitted with exhaust scrubbers to limit the sulfur oxide (SOx) and particulate entering the carbon capture system. The carbon capture system would use electrical power supplied by the auxiliary engines or shaft generator, and heat energy from the engines and/ or the boiler.
• Chemical absorption with sodium hydroxide as the absorbent captures the carbon in the exhausts to produce water and sodium carbonate (Na2CO3), which is further processed with calcium oxide for the end product of a solid that can be stored on board.
It has been tested in a lab, but not yet in the real world with the highest capture rate at 78 percent, but this is variable based on many factors, such as exhaust flow rate and time the carbon is in contact with the sodium hydroxide. This method can be more convenient than the liquid carbon storage since it requires no special tanks and takes up less space on board than storing it as a liquid or gas. Additionally, there could be less complications in storing the carbon by-product, and it might also be easier to dispose of as a solid.
• Cryogenic separation generates higher purity of LCO2 by cooling the exhaust gases to the frost or de-sublimation point of CO2 in a heat exchanger. With this technology still in development stage, the significant power demand makes this technology more suitable for LNG carriers, where LNG can be used as a coolant.
• Absorption technology captures the CO2 with the use of conventional absorbent materials like zeolites, carbon materials and amine-based solids. These are later processed to remove the absorbed carbon and further purify before storage on board.
• Membrane separation is a simple technology, whereby the gas passes through a polymeric, metallic or ceramic membrane for the separation of the CO2 driven by the pressure difference.
The CO2 captured through any of the technologies above is further pressurized and cooled for storage, which requires compression to at least six bar and refrigeration to keep the CO2 in liquid form. Although low-temperature CO2 liquefaction is not a simple process aboard ship, liquid CO2 near the triple point occupies 561 times less volume than gaseous CO2. At ambient temperature, even if compressed to the same pressure as that necessary to liquefy it, gaseous CO2 would still occupy 94 times more volume than liquid CO2 of the same mass.
The CCS concept designs take into account three common ship types and sizes. To avoid overly penalizing the concept of onboard carbon capture and storage, the CO2 storage capacity has been set at 24 days of normal operation on marine diesel oil (MDO) fuel or less. Only a rudimentary arrangement of CCS equipment and CO2 storage has been developed. The concept designs could theoretically be applied as a conversion, but the 90 percent capture rates suggest that new ship construction is a better option.
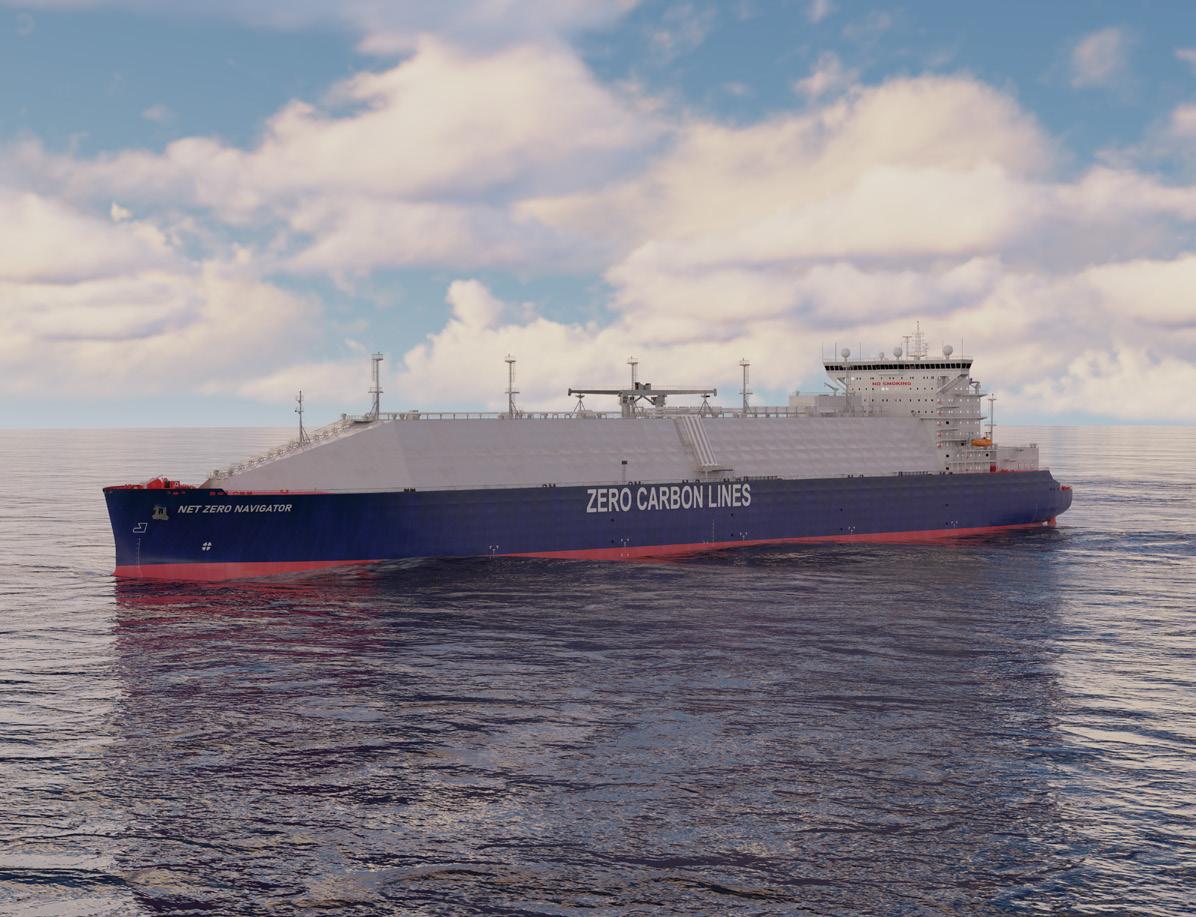
The concept designs presented below are integrating the monoethanolamine absorption CCS system with its dedicated system components outlined in the illustrations. The subsystems may include SOx scrubber, exhaust blower, MEA CO2 absorber, water wash scrubber, MEA CO2 stripper, CO2 compressor skid, CO2 refrigerant skid and the liquid CO2 storage tanks.
While the SO x scrubber, exhaust blower and MEA CO2 absorber are dimensioned for the total exhaust flow, the water wash scrubber is sized for the exhaust flow minus the CO2 captured, and the remainder of equipment listed above (except for the storage tanks) are dimensioned to the expected CO2 production rate and the predetermined voyage durations.
Ideally, the exhaust blower should be placed near the funnel, but exact proximity placement is not critical. The exhaust blower shall boost the exhaust to overcome the backpressure induced by the MEA absorber and water wash scrubbers, with the tie in to be just downstream of the SOx scrubber. A bypass valve should be installed downstream of the tie-in to allow exhaust gases to emit from the SOx scrubber should maintenance or repairs need to be performed on the CCS system.
The integration of CCS to the ultramax bulk carrier design is quite challenging, with all equipment located around the ship’s funnel location and over the fan tail. A new funnel superstructure will need to be erected to accommodate the new system components. The new housing required shall consist of a new partial deck over the fan tail, with foundations for the CO2 storage tanks Port and Starboard (P&S) over the fan tail, as close to the ship sides as practical. The CO2 compressor and refrigeration skids can be installed stacked over the fantail on centerline. Voyage duration based on captured CO2 capacity is 18 days; however, the CO2 production rate for this concept is only 50 percent storage tank capacity and could be resized to accommodate longer voyage durations. The profile above highlights areas affected. The sketch below illustrates proposed equipment placement. The table below the sketch gives estimated system performance metrics and proposed system component sizing parameters. The SOx scrubber is shown to be an inline installation and installed in the funnel as intended. Both the MEA absorber and water wash scrubbers can be installed on either side of the funnel on the same frame or directly astern of the funnel on centerline.
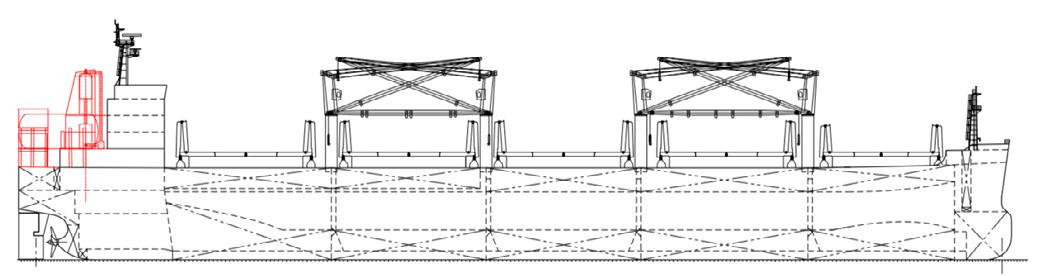
Main Engine 85 Percent MCR 6,640 kW
Assumed Electrical Base Demand 1,172 kW
Voyage Duration 24 Days
Fuel Burned w/o CCS 31.1 Mt/day
Fuel Burned w/ CCS 32.6 Mt/day
Additional Fuel Demand for CCS 1.5 Mt/day
Additional Power Demand for CCS 380 kW
Additional Steam Demand for CCS 9.3 Mt/day
CO2 Captured per Day 50.1 Mt/day
CO2 Storage
1,140 m3 (570 m3 x2 Tanks)
1,065
kW
The Ultramax Bulk Carrier with 50 Percent CCS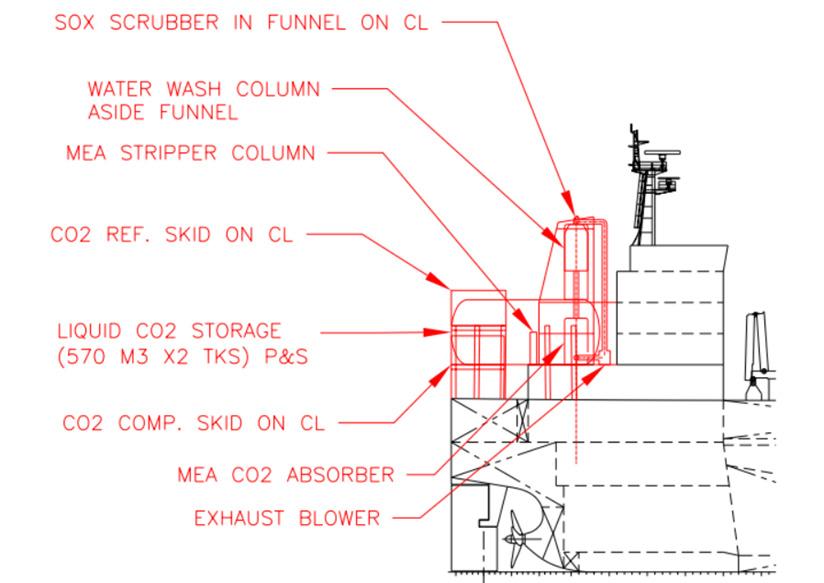
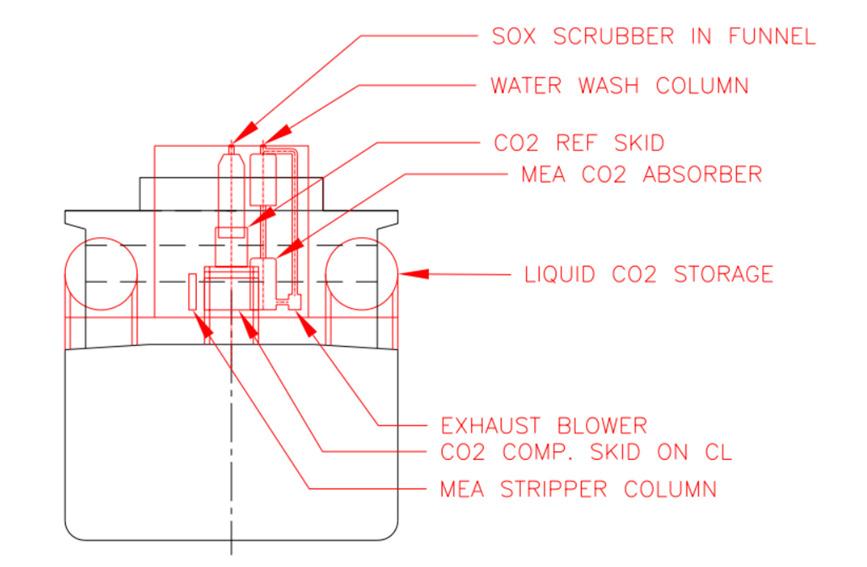
What is particularly different here is the size of the storage tanks. Similar to the 50 percent CCS concept above, the voyage duration was shortened for 18 days due to space constraints and stability concerns. The retrofit would require a new system housing and new deck to be built over the fan tail and widened to the full breadth of the ship to enable installation of the storage tanks.
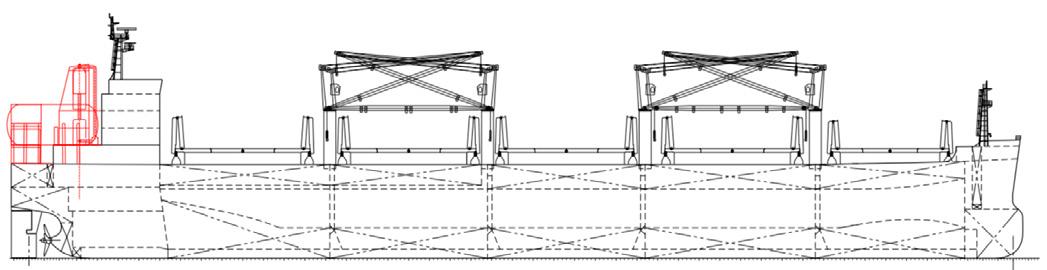
Main Engine 85 Percent MCR 6,640 kW
Assumed Electrical Base Demand 1,172 kW
Voyage Duration 24 Days
Fuel Burned w/o CCS 31.1 Mt/day
Fuel Burned w/ CCS 33.4 Mt/day
Additional Fuel Demand for CCS 2.4 Mt/day
Additional Power Demand for CCS 500 kW
Additional Steam Demand for CCS 16.9 Mt/day
CO2 Captured per Day 91.6 Mt/day
Liquid CO2 Storage Tank Capacity 2,080 m3 (1040 m3 x2 Tanks)
Exhaust Blower/SOx
Exhaust Capacity 30,250 m3/hr
Water Wash Scrubber Exhaust Capacity 28,303 m3/hr
CO2 Compressor Skid Capacity 1,947 m3/hr
CO2 Refrigeration Skid Capacity 338 kW (Ref.)
The Ultramax Bulk Carrier with 90 Percent CCS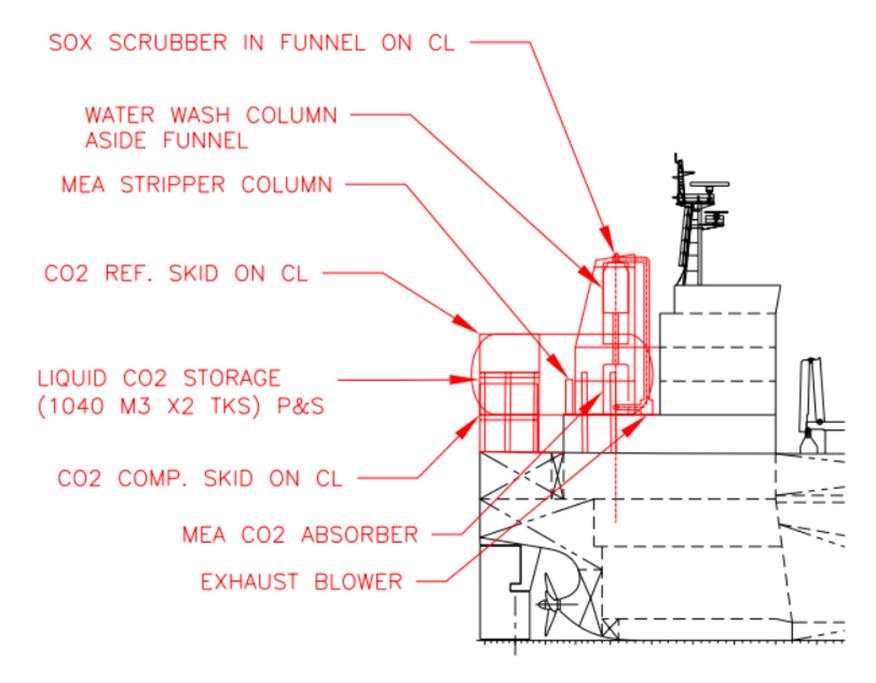
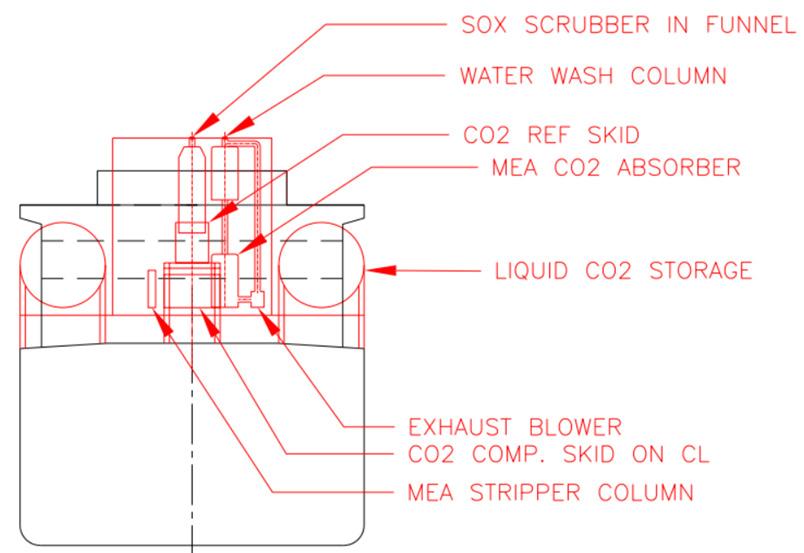
The new suezmax tanker with CCS will need a new funnel superstructure to accommodate placement of system components. The SOx scrubber will be placed in the funnel as intended. Both the MEA Absorber and Water Wash Scrubbers can be installed on either side of the funnel on the same frame or directly astern of the funnel on centerline as it is shown in the sketch below. The rest of the equipment can be installed forward of the superstructure, with the CO2 compressor and refrigeration skids above the cargo tanks, P&S of the pipe rack. The liquid CO2 storage tank also can be placed forward of the CO2 compressor and refrigeration skids, over the cargo tanks, P&S of the pipe rack. The optimal position of the storage tanks would be aft of the cargo manifold, or alternatively forward of the manifold. The voyage duration was assumed to be 24 days; although, there is sufficient space to enlarge or add more tanks to accommodate longer voyages; limited by stability and cargo constraints. Forward of the superstructure, equipment will need to be rated explosion proof for installation in hazardous zones.
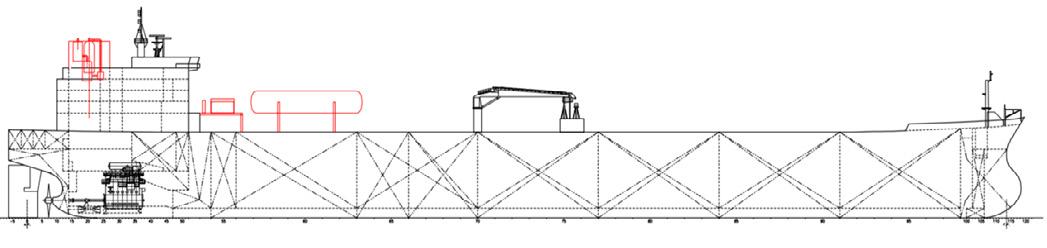
Main Engine 85 Percent MCR 10,115 kW
Assumed Electrical Base Demand 1,785 kW
Voyage Duration 24 Days
Fuel Burned w/o CCS 48.4 Mt/day
Fuel Burned w/ CCS 53.8 Mt/day
Additional Fuel Demand for CCS 5.1 Mt/day
Additional Power Demand for CCS 875 kW
Additional Steam Demand for CCS 26.9 Mt/day
CO2 Captured per Day 159.0 Mt/day
Liquid CO2 Storage Tank Capacity 2,980 m3 (1490 m3 x2 Tanks)
644.7 kW (Ref.)
The Suexmax Tanker with 50 Percent CCS
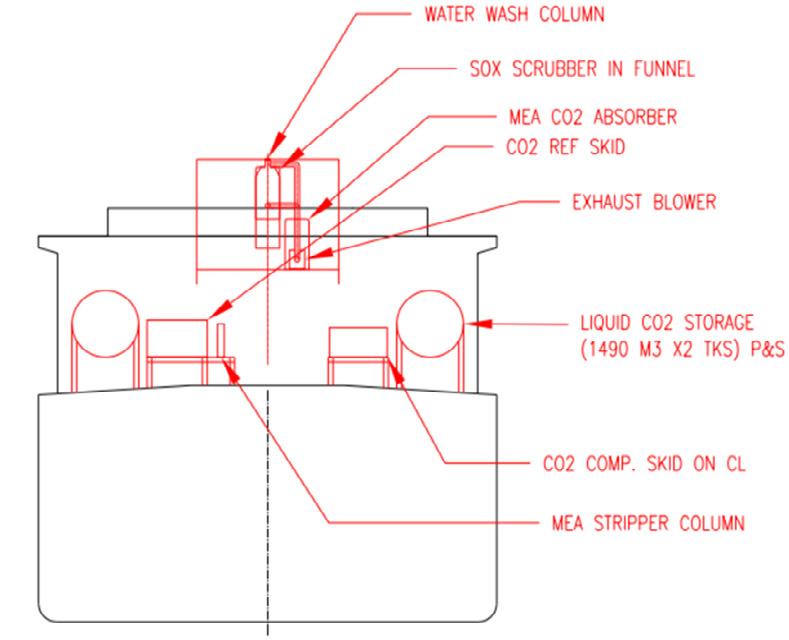
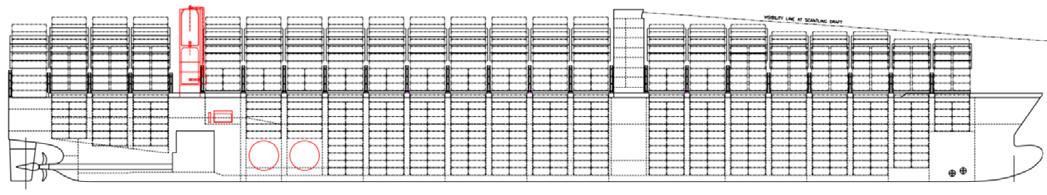
Starting from a new funnel superstructure that will need to be retrofitted to accommodate placement of system components, the SOx scrubber is to be accommodated therein. Both the MEA absorber and water wash scrubbers will be installed on either side of the funnel on the same frame as it is shown in the sketch below. The liquid CO2 storage tanks will need to be installed athwartship at the bottom of the first two container bays forward of the engine room. These tanks do not need to be accessed regularly; thus, container bays can be modified to remove some cargo space. Container stowage can be placed over top of storage space. The remainder of the equipment can be installed at the bottom of the container bay forward of the funnel. Container stowage can also be place over top of this space. The 14,000 TEU containership requires the installation of two CO2 refrigeration skids. These are placed on the P&S sides of the new CO2 CCS machinery space. The CO2 compressor skid also resides in this space on the centerline. The table below the sketch gives estimated system performance metrics and proposed system component sizing parameters.
Main Engine 85 Percent MCR 38,250 kW
Assumed Electrical Base Demand 8,500 kW
Voyage Duration 24 Days
Fuel Burned w/o CCS 200 Mt/day
Fuel Burned w/ CCS 209 Mt/day
Additional Fuel Demand for CCS 9 Mt/day
Additional Power Demand for CCS 1,850 kW
Additional Steam Demand for CCS 40.6 Mt/day
CO2 Captured per Day 285 Mt/day
Liquid CO2 Storage Tank Capacity 7,140 m3 (3,570 m3 x2 Tanks)
975 kW
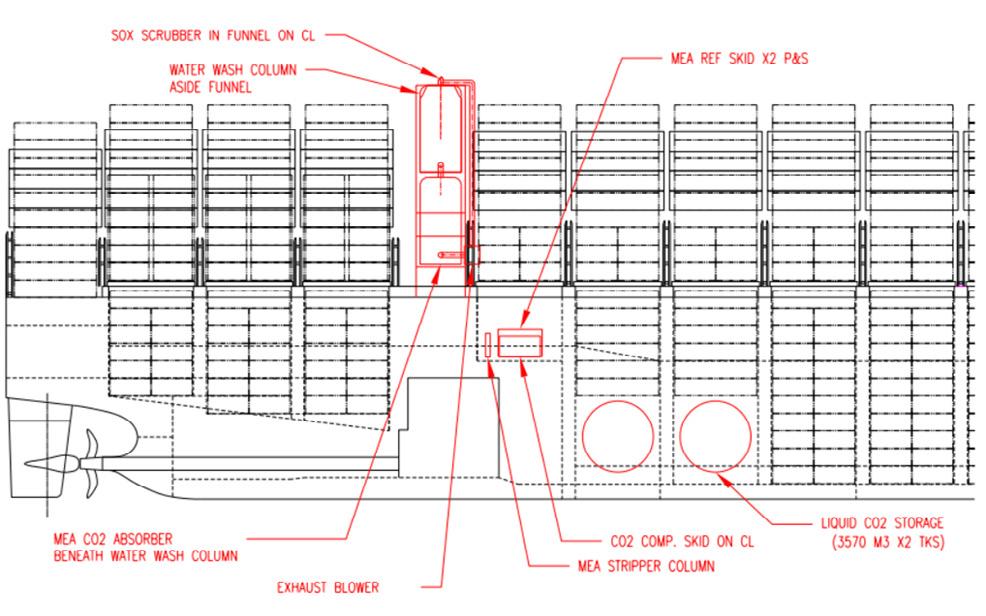
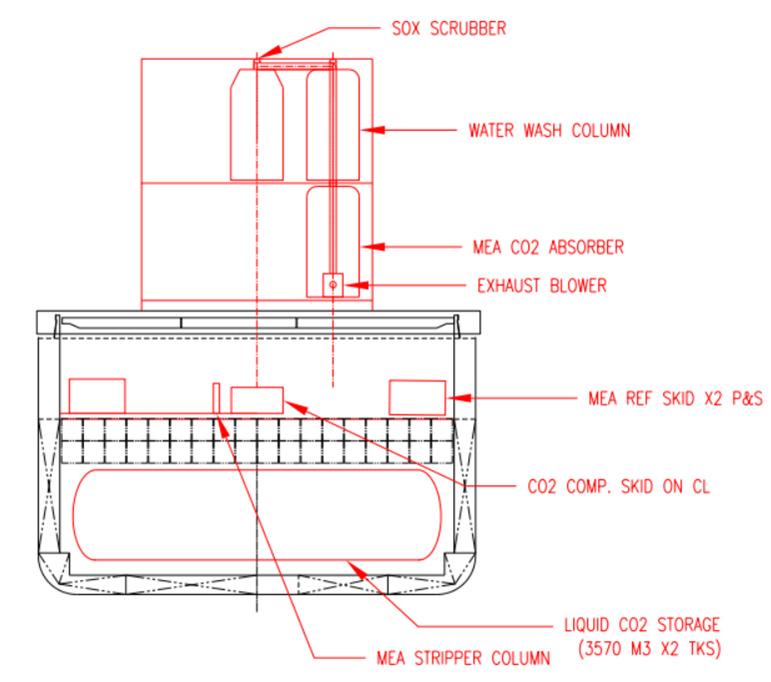
For the 90 percent CCS 14,000 TEU containership, a new funnel housing will need to be erected to accommodate placement of system components in the same configuration as the 50 percent CCS 14,000 TEU containership. The uniqueness of this concept is that four liquid CO2 storage tanks will need to be accommodated athwartship at the bottom of the first four container bays forward of the engine room. These tanks do not need to be accessed regularly; thus, container bays can be modified to remove some cargo space. Container stowage can be placed over top of storage space. The remainder of the equipment can be installed at the bottom of the container bay forward of the funnel in the same configuration as the 50 percent CCS 14,000 TEU containership. Container stowage can also be place over top of this space. The 14,000 TEU containership requires the installation of two CO2 refrigeration skids, and these are placed on the P&S sides of the new CO2 CCS machinery space, together with the CO2 compressor skid.
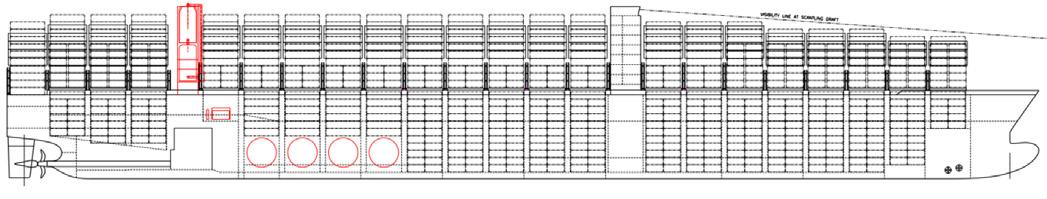
Main Engine 85 Percent MCR 38,250 kW
Assumed Electrical Base Demand 8,500 kW
Voyage Duration 24 Days
Fuel Burned w/o CCS 200 Mt/day
Fuel Burned w/ CCS 214 Mt/day
Additional Fuel Demand for CCS 14 Mt/day
Additional Power Demand for CCS 2,920 kW
Additional Steam Demand for CCS 73.1 Mt/day
CO2 Captured per Day 525 Mt/day
Liquid CO2 Storage Tank Capacity 14,280 m3 (3,570 m3 x4 Tanks)
11,155 m3/hr
1,734 kW (Ref.)
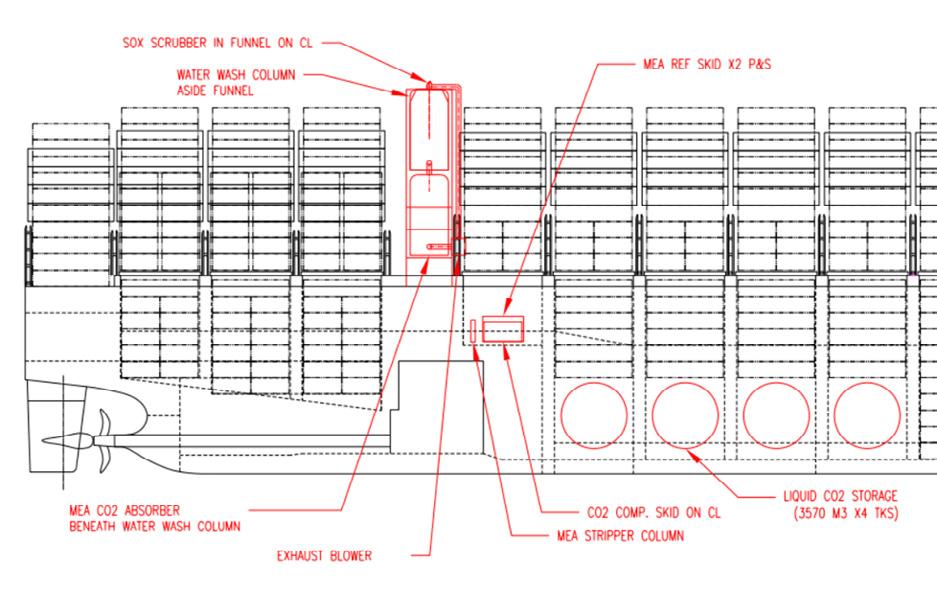
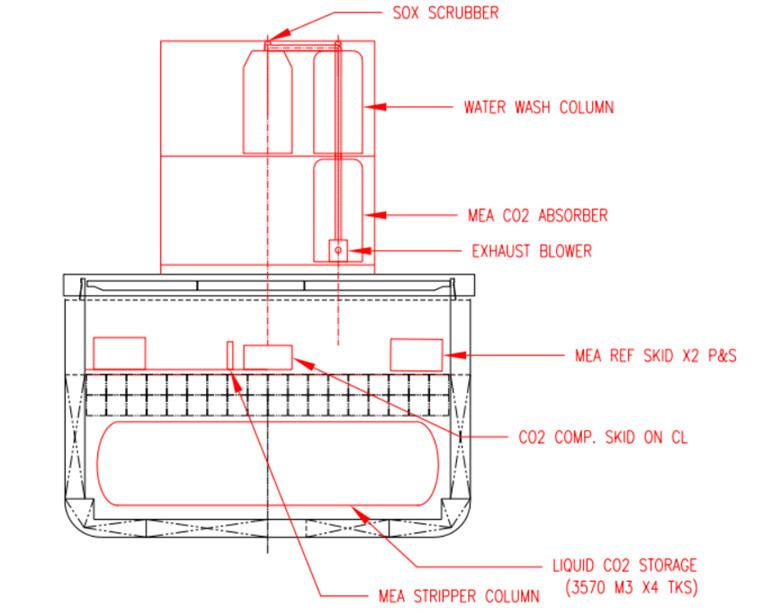
ABS has also worked with Herbert Engineering Corp (HEC) to develop conceptual ship designs related to the transport of CO2
CO2 carrier ships are currently in their early prototype stage with only existing or planned ships being older, such as the 2004 Yara Gerda, 1,800 Mt capacity at 15 bar and -25° C and the currently proposed Mitsubishi 7,500 m3 design for the northern lights carbon sequestration project. The concept design is based on a 10-bar operating pressure, corresponding to an operational temperature range of -45° C to –50° C which is believed to be a good compromise temperature range for control of liquid phase and minimization of overall pressure for cylindrical tanks. The temperature and pressure are kept constant by a refrigeration plant.
CO2 is a gas at ambient temperature and pressure and to carry it in the liquid form, the pressure needs to be greater than its triple point (5.18 bar) and refrigerated to temperature very close to but not below 56.6° C. Most commercially available LCO2 tanks operate at pressures between 12 and 24 bar and at temperature ranges between -15° to -35° C.
Scaling up cylindrical C-tanks is technically problematic, since the outer shell steel thickness depends on the maximum operating pressure values and the tank diameter. To increase capacity, tank length is increased while maintaining a relatively small diameter. The feasibility of a very large CO2 carrier (VLCC, greater than 80,000 m3) depends on the maximum operating pressure which in turn determines temperature ranges the tank insulation and refrigeration system need to maintain to prevent safety valve pressure venting from boil-off.
The proposed conceptual designs are based on a 10-bar operating pressure which corresponds to an operational temperature range of -45° C to -50° C which is a good operating envelope to control the liquid phase and minimize overall pressure for C-type cylindrical tank construction. The temperature and pressure are maintained by a refrigeration plant and venting is allowed during emergencies.
The design philosophy choice made for these LCO2 carriers will be using conventional fossil fuel propulsion and auxiliary plants and will have an appropriately sized CCS system. The high specific gravity cargo (liquid CO2 weighs approximately one Mt/m3) and the weight of the tank imposes large residual buoyancy in addition to net cargo tank volume.
The LCO2 ships have two main cargo tanks occupying the ship’s mid-body and a smaller CCS tank at the bow. The CCS tank is vertical cylinder to accommodate it in the finer bow sections. In addition, the CCS liquefaction plant is separated from the cargo and CCS refrigeration plant to simplify and minimize plant power requirements. Since the market is still nascent, the ships are designed to carry alternative cargo which is easier for refrigerated LPG but very expense for ammonia, since it would require doubling tank thickness and a complex cargo handling and piping system.
The two cargo tanks are 8.25 m in radius and 58.25 m in length and each with a volume of 11,900 m3 and have a 40 mm thick shell if fabricated in stainless steel. If the tank is designed only for CO2 or LPG, the thickness could be reduced to 17 mm. The CCS tank is 6.3 m in radius and 15.95 m in height with a capacity of 1,730 m3. The main engine MCR is 5.85 MW and 4.95 MW for auxiliaries, and the CCS system power requirements take approximately 1.11 MW to feed an amine carbon capture plant in addition to a CO2 liquefaction plant. The remaining auxiliary power is used for cargo refrigeration and shipboard consumption. The engine and fuel tanks are designed to sail at 14.5 knots with a 20 percent sea margin for 17.2 days covering 6,000 nautical miles.
MAIN
Length Overall 250.000 m
Length Between Particulars 239.000 m
Breadth, Molded 44.000 m
Depth, Molded 21.300 m
Cb at Design Draft 0.810 Draft, Design 15.000 m
Lightship 29,124.5 MT
Deadweight at Design Draft 102,075.0 MT
Displacement at Design Draft 131,199.8 MT
Main Engine, Installed 12000 kW
Main Engine, NCR 11000 kW
Auxiliary Engines, Installed 6600 kW
Total Power, Installed 18600 kW Speed 14.5 knots
Fuel Consumption, Propulsion 43.0 MT/day
AUXILIARY LOADS
CCS System 2400 kW
TANK CAPACITIES
Ballast 79200.0 m3 HFO 2600.0 m3 MDO 650.0 m3 L CO2 83200.0 m3
Range at Design Draft & Speed 6000 n. Miles
82K m3 LCO2
82K m3 LCO2 Carrier SHT: 1/1
DATE: April 25, 2022 REV: 0
The design for the 82,000 LCO2 carrier is similar to the 25,000 carrier with two cargo tanks occupying the ship’s midbody and a smaller CCS tank at the bow. The two cargo tanks have a radius of 13.22 m and measure 74.22 m and 78.22 m in length. The tank capacities are 38,300 m3 and 40,600 m3, respectively. If fabricated in stainless steel, the thickness will be 62 mm and if only carrying LPG and CO2, the thickness could be reduced to 26 mm. The CCS tank will be eight m in radius, 24 m in height with a capacity of 4,250 m3 with a 25 mm thick shell.
The main engine MCR is 12 MW plus 6.6 MW for auxiliaries, and the CCS system power takes approximately 2.4 MW of the auxiliary power to feed an amine carbon capture plant in addition to a CO2 liquefaction plant. Propulsion is provided by a single 8.4 m diameter high performance propeller matched to a rudder bulb. The main engine and tank capacity provide the same distance and sea margin as the 25,000 LCO2 carrier.
With the conceptual designs ready for very large CO2 carriers and the market demand expected to increase with growth in offshore CO2 storage projects, it is only a matter of time before these CO2 carriers become operational. Currently, smaller carriers, mostly in the food and beverage industries, are in operation or have been announced, but the very large crude carriers (VLCCs) represent a paradigm shift in design philosophy, and we should expect to see multiple announcements of new builds over the next few years.
In addition, onboard carbon capture is a technically feasible solution with no major barriers except for issues related to energy usage and the space required for additional equipment (storage tanks, processing equipment, etc.), which can be resolved. Heat optimization may help to reduce fuel consumption and operating costs.
The commodity-pricing market for captured CO2 could play a major role in helping onboard carbon-capture technology to develop further.
In short, SBCC seems like an excellent bridging option or even a long-term solution to decarbonize shipping, when compared to the state of alternative fuels and their related infrastructure and investment needs.
The industry recognizes that the current short-term technical and operational measures, such as Energy Efficiency Design Index (EEDI), Energy Efficiency Existing Ship Index (EEXI) and Carbon Intensity Indicator (CII), are not enough on their own to put shipping on the net zero-emission pathway. So medium- and long-term measures must be implemented promptly. The transition to low- and zero-carbon fuels will be the primary pathways to achieve the IMO’s decarbonization goals for 2050.
The current regulatory framework is focused on vessel emissions (tank-to-wake) rather than the overall life-cycle emissions of a specific fuel (well-to-wake). However, it is recognized throughout the industry that the life-cycle carbon footprint of fuels provides the most complete assessment of their environmental impact.
The IMO’s anticipated introduction of the requirement to measure a fuel’s full life-cycle carbon footprint will allow the shipping industry to achieve zero emission targets while still deploying the most widely used internal-combustion engines — the least disruptive technical solution — along with the adoption of new types of fuels.
Identifying the optimum fuel specifications for each vessel and application is a challenging task, since the range of technical solutions is already wide, and getting wider. However, by examining the full range of onboard technologies — engines, as well as fuel-containment, storage and supply systems — common taxonomies will arise to simplify the decision-making process.
In its first Setting the Course to Low Carbon Shipping outlook, ABS categorized the available and emerging fuel options into three pathways that could help the maritime industry meet its decarbonization goals for 2030 and beyond.
This category includes fuels comprised of small molecules with low carbon/hydrogen (C/H) ratios, which can help to reduce carbon emissions, and in the case of methane (CH4), provide comparatively high energy content.
However, these fuels require cryogenic storage and more demanding delivery systems. This pathway includes LNG, bio-LNG, and synthetic natural gas (SNG) or renewable natural gas (RNG), which can be produced from biomass and/ or by using renewable energy.
This category includes fuels — such as LPG, methanol, ethanol and ammonia — that are comprised of larger molecules than those in the light-gas group. As such, they have higher C/H ratios — therefore, lower potential to reduce carbon emissions — and lower energy content. Their fuel storage and supply requirements are less demanding.
This category includes fuels that are produced from biomass, including plants, waste oils and agricultural waste. Catalytic processing and biomass upgrading can produce liquid fuels with physical and chemical properties that are comparable to diesel oil; this is desirable from a design standpoint because they can be used as drop-in biofuels with minimal or no changes to marine engines and their fuel-delivery systems.
Alternative fuels will play a dominant role in the decarbonization of the marine and offshore sectors and are expected to yield the most benefits for reducing GHG emissions. However, since there are many choices for adopting alternative fuels, one of the main challenges for owners is to decide which alternative fuel is best suited to support the transition to 2050.
According to Clarkson’s data, as of February 2022, 1.4 percent of the global fleet is powered by alternative fuels.
LNG Bio-/ElectroMethane HydrogenLPG, MeOH Bio-/ElectroFuels
0 100 LNG LPG
Methanol Ethane Hydrogen Biofuel
200 300 400 500 600 700
Clarksons Research (https://www.clarksons.net)
Figure 66: Existing fleet powered by alternative fuels. In the orderbook, 23 percent of vessels are scheduled to be powered by alternative fuels (see figure below).
2000 400 600 800
LNG LPG
Methanol Ethane Hydrogen Biofuel
Clarksons Research (https://www.clarksons.net)
Figure 67: Fleet powered by alternative fuels on orderbook.
In terms of the fuel mix used in shipping, the use of LNG, methanol and LPG has increased more rapidly in recent years than was anticipated in 2020 (though the latter is, as yet, confined entirely to the LPG carrier sector). There has also been some progress in the provisional development of ammonia as a marine fuel, with engine designs receiving approval and several projects aiming to have vessels on the water by mid-decade. We forecasted alternative fuel adoption for this study based on the assumption that methanol, ammonia and hydrogen will take center stage after 2030.
This is not to say that the fuel used initially is carbon neutral, and the report makes no attempt to address progress in producing enough green ammonia and methanol, particularly in the context of existing mature industries that consume these chemicals attempting to transition to a carbon-free future. We arrive at a much lower level of oil use by 2050 than we did in our 2020 study, assuming that all ships built in the earlier part of the next decade are non-oil fueled and allowing for different rates of update by ship type and segment. The latter was more concerned with figuring out how to get to a 40 percent oil use by the end of the forecast period. The most recent research acknowledges progress made since then and suggests that a faster decarbonization is possible if enough fuel is available.
By combining the derived ship demand with a forecast for a changing fuel mix used in deep sea shipping, the scenarios for global energy consumption are translated into global fuel consumption by ships. Our forecasting models for each sector produce the available fleet, which takes into account our trade forecasts and shifting requirements for various vessel sizes. In the initial analysis, no assumptions were made about changes in engine efficiency, vessel trading speed, port efficiency or fleet fuel mix over the forecast period.
HFO+Scrubber, MGO/MDO, LNG, LPG, methanol, ammonia/hydrogen are among the fuel scenarios examined.
2.5 2.0 1.5 1.0 0.5 0.0
Bn
Coal Natural Gas
Nuclear
2010 2012 2014 2016 2018 2020 2022 2024 2026 2028
2032 2034 2036
Figure 68: Total global consumption by energy carrier.
2042 2044 2046
The assumptions we've built into our energy model reveal the magnitude of the change required to decarbonize. With China, Europe and North America dominating energy demand, we expect a 30 percent increase in global energy consumption from 2020 to 2050. The fastest-growing regions are expected to be South Asia and Africa, where energy consumption could double in the next decade.
Zero-carbon energy production will increase nearly six-fold over the period, with the steepest declines in fossil fuel consumption coming from coal (50 percent) and oil (20 percent).
This update takes into account the recent significant investment in newbuilding tonnage, with a particular focus on containerships and gas carriers. Given the orderbook, this paints a clearer picture of the fleet's expansion to 2025. In 2025, these trends indicate that LNG, methanol and LPG will have a much higher starting point as a maritime fuel. This is almost entirely due to the actions of major shipping lines, which have embarked on a remarkable investment spree with a strong focus on alternative fuels, particularly for larger vessels.
It should be noted that the fuel mix has been forecast by vessel type and size segments for this update due to clear evidence of fuel choice differentials by size. For example, large bulk carriers have shown a strong interest in LNG as a fuel, but smaller vessels have shown no interest. Although there are some exceptions, there has been a clear focus on larger containerships. Because the tanker sector has seen very little investment in recent years, adoption of alternative fuels will lag behind the other sectors. Aframax and VLCCs have received the majority of the investment, while a few smaller tankers have emerged for Europe-focused operators.
Figure
Figure
mix (HFO
The proportion of existing and new fuels used in shipping is shown by recalculating energy consumption in tonnes of HFO equivalent. This is thought to be easier to understand than using Joules to measure energy. Under our base case for the ship types included in this study, total energy consumed by the shipping industry will rise from 185 MnT HFO equivalent in 2020 to 237 MnT HFO equivalent in 2050. This is due to the growing importance of containerships and, to a lesser extent, LNG carriers.
The use of LNG cargo as a fuel on LNG carriers is largely responsible for the high demand for LNG. Other ship types' demand for LNG bunkers will rise from current lows to a peak of 25 MnT. (approximately 10 percent of total demand). The increasing proportion of ammonia/hydrogen is also observed in the fuel mix. Although these fuels are labeled as carbon free, this is based on the assumption that carbon-neutral versions of these fuels can be produced in sufficient quantities. We assume that the shipping industry will transition to these fuels if and when production becomes available.
100%
90%
80%
70%
60%
50%
40%
30%
20%
10%
0%
Figure 71: Fuel mix forecast.
Because of the change in methodology used in this update, the share of oil-based fuels will decline much faster after 2030 than predicted previously. The adoption of alternative fuels is considered in the context of the fleet renewal we expect over the next few years, taking into account our assumptions about newbuilding contracting and ship demolition by size and type. The step change after 2030 is eminently feasible with the normal fleet renewal process on this basis.
Given that many of the disincentives for fitting LNG on smaller vessels will also apply to the new fuels, this could be seen as a downside risk for ammonia and methanol adoption. As a result, it emphasizes that a radical rethinking of ship design and the incorporation of bunker tanks will be required to ensure uptake.
On the methanol side, the industry's growing interest and investment in its green production, makes it now more apparent that carbon-neutral methanol will be available and take a larger share of the market by the middle of the next decade.
There has been a lot of discussion about the economic benefits of continuing to burn traditional marine fuels if carbon capture technology becomes commercially viable for onboard use. Logically, if onboard carbon-capture systems are adopted, these fuels would retain a higher proportion of the fuel mix for a longer period.
From an operational perspective, vessel operators would like to continue to use these traditional fuels and avoid the added cost from the crew training that would be required for new fuels. For shipowners, the traditional fuel options offer a lower level of financial risks.
An increasing number of industry practitioners consider LNG to be an intermediate transition fuel on the decarbonization journey, so its use is expected to increase steadily until 2050. In the future, more “renewable” forms of LNG may create a dedicated LNG pathway.
Electro-fuels have the potential to offer carbon-neutral propulsion and can provide solutions in the medium- to long-term. In addition to fossil and biomass sources, electro-fuels can be produced by a CO2 recovery process that converts CO2 to syngas, which in turn can be used to produce bio-LNG.
Ammonia, which is potentially a zero-carbon fuel, has great potential to lower the carbon footprint of shipping, particularly when measured by tank-to-wake criteria. Its use is expected to grow due to its zero-carbon content, and comparative ease of distribution, storage and bunkering when compared to LNG and hydrogen; it is also compatible with existing and emerging technologies for propulsion and power generation.
Ammonia and methanol currently hold the most promise among the renewable fuels for the international shipping sector as it stays on course to meeting its decarbonization goals for 2050. In the 1.5° C scenario of the Paris Agreement, renewable ammonia is expected to play a role 4.5 times greater than that of renewable methanol.
MnT
Figure
HFO/MGO/MDO
Figure
HFO/MGO/MDO
Figure
LPG
Figure 76: Fuel
Green corridors are a conceptual framework that aim to develop maritime routes that showcase low- and zeroemission life-cycle fuels and technologies with the ambition of helping the shipping industry reach the IMO’s goal of reducing total CO2 emissions by 50 percent by 2050 compared to 2008.
Shipping decarbonization has numerous moving parts and one of the challenges with its decarbonization is deployment of solutions at scale since the industry is diverse, disaggregated and globally regulated. Green corridors help shrink the challenge of coordination between fuel infrastructure and vessels, in the value chain and between countries, down to a more manageable size while retaining scale.
As part of the 2021 U.N. Climate Change Conference of the Parties (COP26), 19 countries including the U.S., U.K., Chile and Australia among other countries signed the Clydebank declaration whose aim is to support the establishment of at least six green corridors by the middle of this decade, with the aim of scaling up over the decade [58].
Figure 77: Fuel mix for PCTC.In April 2022, the U.S. Department of State (DOS) announced its aim to help setup green corridors and provided high-level guidance on what can be expected as the building blocks of the corridor. The building blocks include the following possible steps [59]:
• Define the scope, boundaries, metrics and the framework
• Incorporate life-cycle emissions estimates
• Estimate a baseline emissions inventory for port and/or vessel operations that can be publicly available to agree upon emission reduction targets
• Work with stakeholders and communities to develop an implementation plan
• Some of the implementation steps include but are not limited to:
Alternative refueling or recharging infrastructure to support zero-emissions port and terminal equipment operations
Support vessels and commercial harbor craft using low- or zero-emission fuels and technologies
Ocean-going vessels using low- or zero-emission fuels and technologies
Zero-emission fuels, bunkering and refueling capabilities for vessels including electrification and cold ironing
Energy efficiency and operations optimization activities that lead to reduced overall energy consumption and reduce GHG emissions
In 2019, 65 million tonnes of iron was exported from Australia to Japan, making it the third largest dry bulk trade route in the world. Ships carrying iron ore in this route burned approximately 550,000 tonnes of fuel oil in 2019, leading to 1.7 million tonnes of CO2 emissions.
This route has been identified as one with strong potential for a green corridor with stakeholder momentum, favorable conditions for zero-emission fuel production (green hydrogen in Australia). The route is primed for stakeholder cross collaboration between mining companies, vessel operators, steel mills, fuel producers and government organizations with each of them having set aggressive decarbonization targets [60].
This is the largest of the three major east-west containership routes causing 35 million tonnes of CO2 emissions, which accounts for three percent of global shipping emissions. Shanghai is the largest port on the Asian side and Rotterdam is the largest on the European side with Singapore playing the role of a transshipment port on the route.
This route has all the building blocks of a green corridor with many cargo operators setting scope three reduction targets, a pipeline of announced green-hydrogen projects in Europe, Middle East ,and Australia and policy action such as the EU’s Fit for 55 package for shipping.
In February 2022, these two ports announced a partnership to create a zero-carbon shipping corridor by 2030, and the implementation plan is expected by the end of 2022. The trans-Pacific shipping corridor is one of the busiest trade routes, and the potential for reduction is very high. Cargo Owners for Zero Emission Vessels (CoZEV) is an initiative of private sector actors and global retailer groups that includes Amazon and Ikea who have committed to shipping products solely on zero-emission vehicles by 2040.
This green corridor will create a “market-making” effect for zero-emission vehicles with major retailers investing in it.
The Chilean Ministry of Energy, Transport and Telecommunications has teamed up with the Maersk-McKinney Moller Center for Zero Carbon Shipping to launch a project to establish green shipping corridors in the country. The initial step will involve mapping, assessment and selection of promising green corridors and is expected to be completed by end of 2022. Chile was among the first countries to sign the Clydebank Declaration to support establishment of green shipping corridors.
With 19 countries signing up for the Clydebank Declaration and many of these countries having started taking first steps toward establishing green corridors, the trend is clear that green corridors will be a useful tactical tool to help decarbonize the shipping sector.
Asia-Europe Container Route [60] Chile Green Corridor [62]Green corridors fundamentally help simplify the problem down to a “port-to-port” route, and since these routes are high-traffic ones with far reaching trade implications, this is one additional tool to help meet the IMO’s targets. Green corridors will directly link global trade to decarbonization since these high-volume green routes will help decouple trade growth from carbon emissions over a period of time. One of the biggest challenges of the shipping industry is reducing the carbon footprint and at the same time servicing an ever-growing client demand for shipping services.
Private sector stakeholders are also chipping in with their aggressive net-zero goals and are playing the role of a “market maker” for zero-emission vehicles. Green corridors will create a definitive market for alternative fuel manufacturers and help spur the development of port-side infrastructure, too.
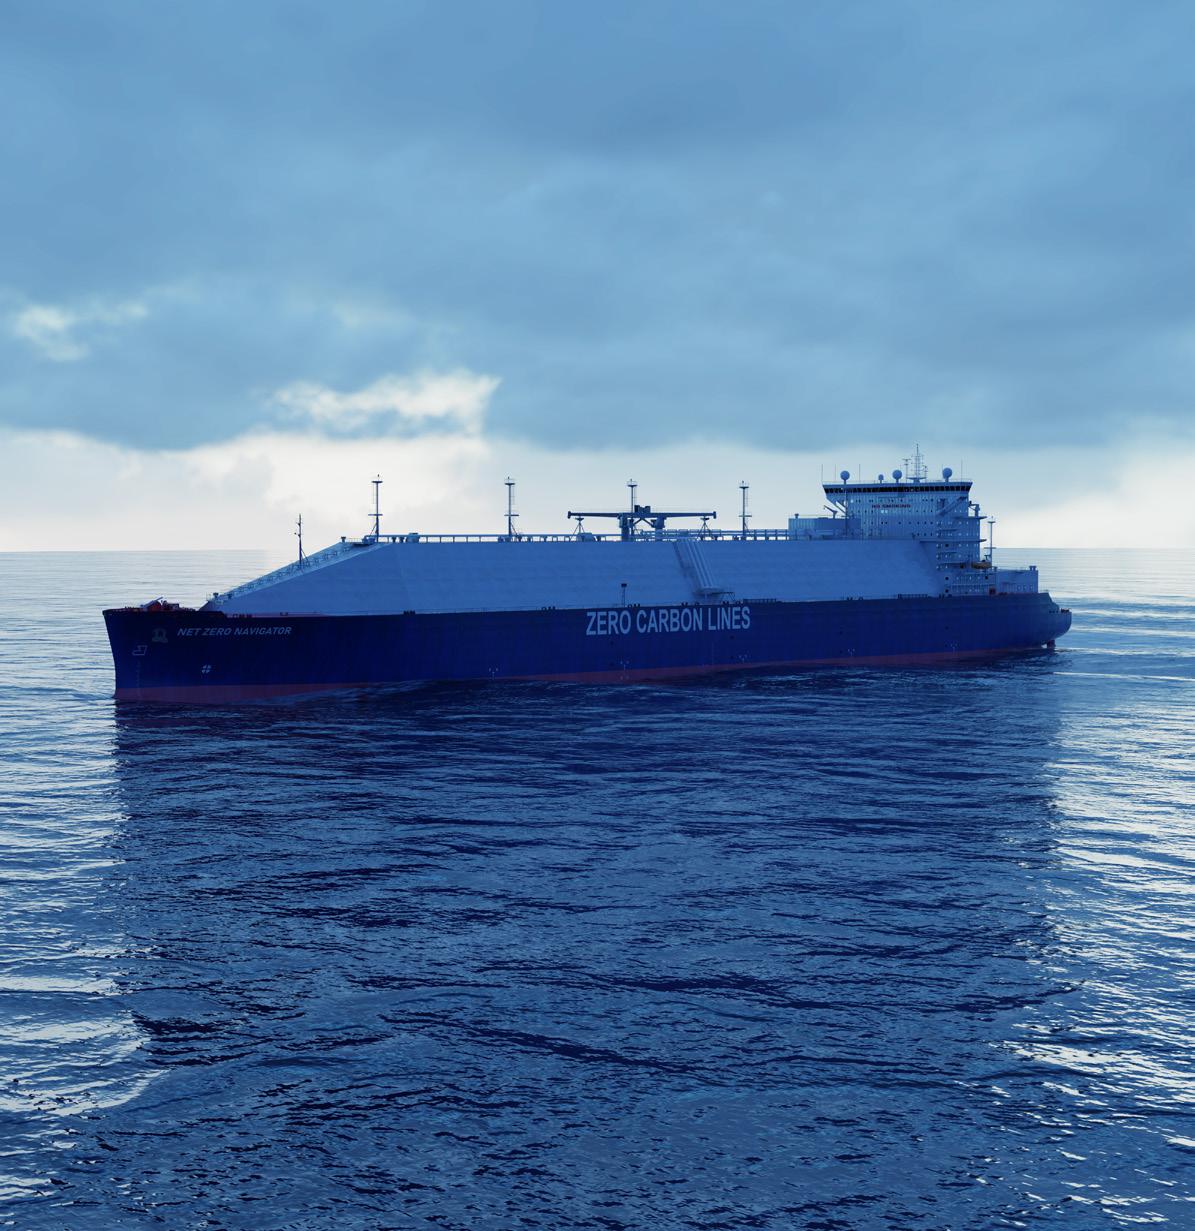
• Methanol presents an immediate and promising solution with practical advantages in storage, handling and carbon intensity reduction potential which is gaining traction in the market. The further development of green methanol (e.g. electrolysis and biogenic carbon) provides a viable option for carbon neutral operations. From a technical perspective, solutions for onboard usage of methanol are mature. Vessel designs have been developed and are being developed for all vessel segments.
• The Paris Agreement and the escalating visibility and severity of climate change's impacts have provided impetus for more effective climate action. Recent advances in climate ambition are encouraging, but maritime stakeholders still need the tools to track, coordinate and realize their stated climate goals. There is a constant increasing pressure for taking measures to address climate change, and greenhouse gas (GHG) emissions reduction goals are becoming more ambitious toward 2050, although they need to remain realistic to what is attainable, given the understandably differing approaches to climate action across different stakeholders.
• Regulation of the maritime or shipping industry emissions into the atmosphere is becoming increasingly stringent, with additional measures expected to be implemented in the next few years. The upcoming marketbased measures (MBMs) and life-cycle assessment approach are expanding the scope of GHG emissions from tank-to-wake to well-to-wake, which will enable a holistic approach toward emissions reduction. This entails an understanding of the emissions and other impacts associated with the production, storage and distribution of fuels, as well as emissions generated by ocean-going vessels.
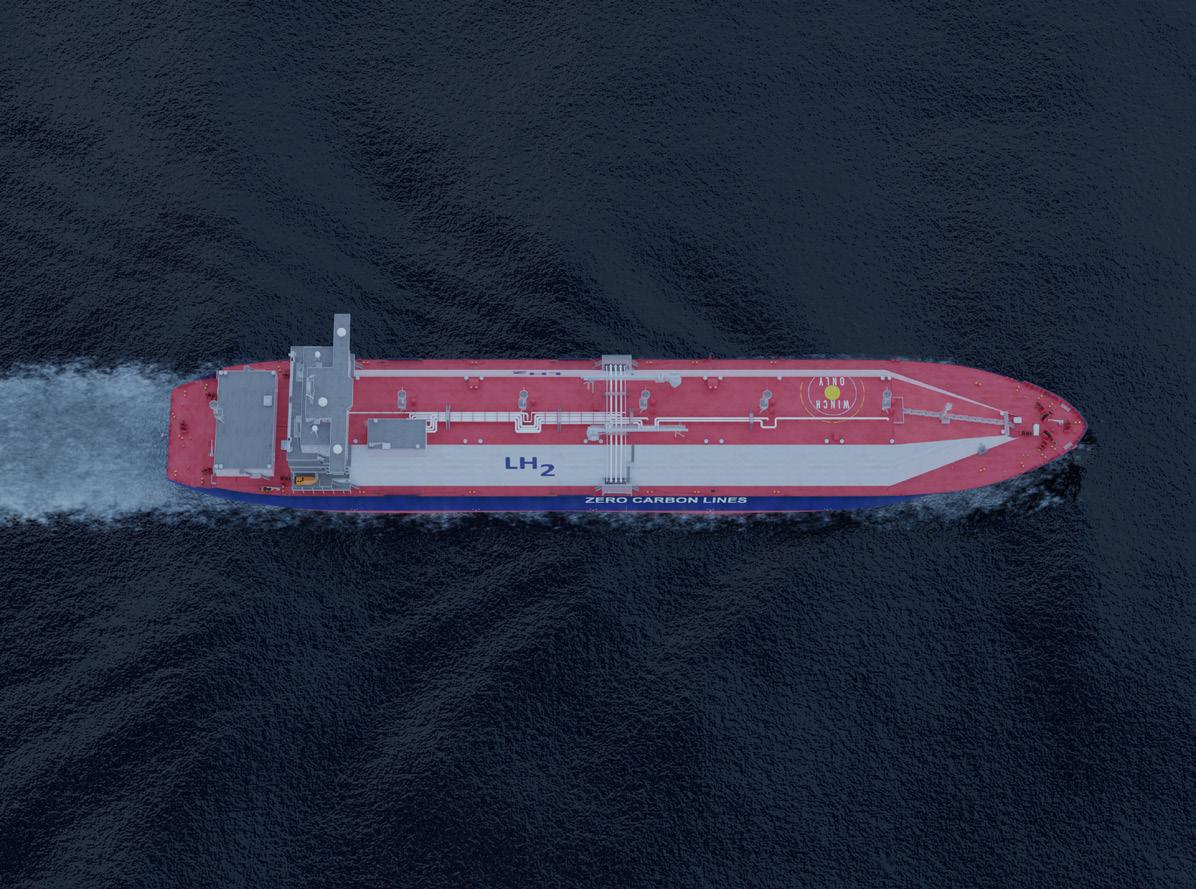
• Using a well-to-wake approach has numerous advantages, the most important of which is that it ensures that the intended GHG reduction benefits from fuels are realized. For the purpose of significantly reducing the sector's carbon footprint, setting a goal of net-zero emissions based on the life-cycle assessment method might be a reasonable and attainable goal, and hence further criteria should be investigated.
• The path towards net zero will start with drop-in transition fuels, progress with the adoption of carbon capture technologies and eventually lead to adoption of low- and zero-carbon fuels produced using renewable energy.
• Our analysis shows that a decisive element in the growth of the value chains is efficiency improvements. For example, in the hydrogen value chain depending on the efficiency of the equipment, there could be 20 percent gains in cost efficiency. Therefore, the efficiency improvement at every step of the production process will support the further scaling up of the chain and the introduction of the produced fuels.
• Following the analysis in section 3, we see that the scaling up of renewables and the related effects of increased production will drive costs of synthetic fuels down. From this perspective green ammonia is expected to be the most cost efficient by 2050.
• In the short-term to mid-term bio-oils and biomethane can provide a cost-efficient carbon-neutral solution. Ammonia could become more cost efficient after 2030 as a blue version of the particular fuel are introduced. Green ammonia could become as mentioned above more cost competitive in the long term at the end of the 2040. In addition, fossil fuels will continue to be more price competitive, and a carbon tax could close the price gap.
• Carbon pricing mechanisms could close the price gap between conventional and alternative fuels. Introducing carbon economics elements will be critical in drafting a robust decarbonization strategy.
• The availability of biomass and the carbon feedstock that is required to produce carbon-neutral fuels might present challenges as fuels that contain carbon atoms are becoming higher in demand.
• Considering the findings from our Setting the Course to Low Carbon Shipping: View of the Value Chain, we believe that a proper assessment of the environmental impact of fuels should be carried out, as we apply wellto-wake estimations. As we have established, the production of fuels is instrumental in understanding the total carbon footprint which is the case for gray fuels, where the estimated emissions might be greater than those of conventional fuels in use today.
• According to the base case scenario, there is still going to be a notable number of vessels using oil-based fuels (28 percent of energy demand). This is why our analysis shows that the introduction of oil-based carbon neutral fuels (drop-in) could provide an important element of support, if shipping will be requested to get to net zero by 2050. This is also a key driver for the exploration of onboard emission abatement technologies such as onboard carbon capture.
• Carbon capture technologies will provide a realistic solution to lower the emissions during the transition phase of fossil fuel use. Onboard carbon capture is currently under development and efficiency improvements have to take place in order for the technology to provide an applicable solution. Direct air capture is still at its very early development stages and there are significant efficiency challenges related to its implementation.
• Significant uptake of CCS technologies will be realized with a set of enablers starting from the CCS technologies, storage and liquid CO2 (LCO2) carriers to facilitate the development of an entire ecosystem.
• Hydrogen is expected to play a key role as an energy carrier for the production of renewable and low-carbon fuels, which will define the hydrogen value chain, starting from production facilities, storage and transportation in liquid hydrogen (LH2) carriers, as well as bunkering infrastructure for hydrogen and other hydrogen-based fuels like ammonia. Hydrogen is central to reaching net-zero emissions.
• We have explored the boundaries of applicability based on current technological updates. What we see is that shipping will be a center piece for the development of both the hydrogen and carbon value chains. A net-zero scenario in 2050, would probably require energy for green hydrogen production which is equal to half of the renewable energy production in 2021.
[1] OECD, "Carbon dioxide emissions embodied in international trade," Organisation for Economic, November 2021. [Online]. Available: https://www.oecd.org/sti/ind/carbondioxideemissionsembodiedininternationaltrade.htm. [Accessed 4 May 2022].
[2] A. Slodkowski, E. Sugiura and H. Dempsey, "Shipping heavyweight Japan tables carbon tax proposal for the industry," Financial Times, 3 May 2022. [Online]. Available: https://www.ft.com/content/ae5893a1-4a7e-4152-8fb265679ebc73c4. [Accessed 4 May 2022].
[3] Cision, "World’s First Ammonia Ready Vessel Delivered to ABS Class," Cision, 4 February 2022. [Online]. Available: https://news.cision.com/american-bureau-of-shipping/r/world-s-first-ammonia-ready-vessel-delivered-to-absclass,c3499402. [Accessed 6 May 2022].
[4] Committee on the Environment, Public Health and Food Safety, "European Parliament," 2022. [Online]. Available: https://www.europarl.europa.eu/doceo/document/ENVI-PR-703068_EN.pdf.
[5] W. F. &. Williams, "The Sustainability Imperative: ESG — Reshaping the Funding & Governance of Shipping," Watson Farley & Williams, 2021.
[6] M. McGrath, "COP26: US and EU announce global pledge to slash methane," BBC, 2 November 2021. [Online]. Available: https://www.bbc.com/news/world-59137828. [Accessed 07 May 2022].
[7] Shanghai Marine Diesel Engine Research Institute, "Solution to methane slip from marine dual-fuel/gas engine," 2021.
[8] MAN Energy Solutions, "The Methanol fueled MAN B&W LGIM Engine," MAN Energy Solutions, 2021.
[9] Methanol Institute, [Online]. Available: https://www.methanol.org/.
[10] Methanol Institute, "Renewable Methanol," Methanol Institute, [Online]. Available: https://www.methanol.org/ renewable/.
[11] Shipping, Mærsk Mc-Kinney Møller Center for Zero Carbon, "We show the world It is possible: Industry Transition Strategy," Mærsk Mc-Kinney Møller Center for Zero Carbon Shipping, Denmark, October 2021.
[12] I. Tiseo, "International shipping CO2 emissions worldwide 1970-2020," Statista, 18 February 2022. [Online]. Available: https://www.statista.com/statistics/1291468/international-shipping-emissions-worldwide/. [Accessed 08 April 2022].
[13] Clarkson Research, [Online]. Available: https://www.clarksons.net/n/#/portal.
[14] World Economic Forum, "The Global Risks Report 2022, 17th Edition," World Economic Forum, Geneva, 2022.
[15] Swiss Re, "World economy set to lose up to 18% GDP from climate change if no action taken, reveals Swiss Re Institute’s stress test analysis”," Swiss Re, 22 April 2021. [Online]. Available: https://www.swissre.com/media/pressrelease/nr-20210422-economics-of-climate-change-risks.html. [Accessed 04 May 2022].
[16] Swiss Re, "The Economics of Climate Change: No Action Not an Option," April 2021. [Online]. Available: https:// www.swissre.com/dam/jcr:5d558fa2-9c15-419d-8dce-73c080fca3ba/SRI_%20Expertise_Publication_EN_LITE_The%20 economics_of_climate_change.pdf. [Accessed 04 May 2022].
[17] EDF, "Shipping Industry and Ports Susceptible to Billions of Dollars in Damage, Disruption from Climate Change," 14 March 2022. [Online]. Available: https://www.edf.org/media/shipping-industry-and-ports-susceptible-billionsdollars-damage-disruption-climate-change. [Accessed 04 May 2022].
[18] F. B. C. D. A. E. J. S. R. L. G. Ueckerdt, "Potential and risks of hydrogen-based e-fuels in climate change mitigation," Nature Climate Change, vol. 11, p. pages 384–393, 2021.
[19] E. Taibi , D. Gielen and R. Miranda, "Hydrogen: A Renewable Energy Perspective," International Renewable Energy Agency (IRENA), Abu Dhabi, 2019.
[20] IEA, " Renewables 2021," International Energy Agency, 2021.
[21] D. Englert, A. Losos, C. Raucci and T. Smith, "The Potential of Zero-Carbon Bunker Fuels in Developing Countries," World Bank, Washington, DC., 2021.
[22] American Bureau of Shipping, "Sustainability Whitepaper: Hydrogen as Marine Fuel," 2021.
[23] American Bureau of Shipping, "Sustainability Whitepaper: Biofuels as Marine Fuel," 2021.
[24] S. Franz, S. Shapito-Bengtsen, N. Campion, M. Backer and M. Münster, "MarE-Fuel: Roadmap for sustainable maritime fuels," Technical University of Denmark, 2021.
[25] IRENA, "A pathway to decarbonise the shipping sector by 2050," 2021.
[26] D. Baresic, I. Rojon, A. Shaw and N. Rehmatulla, "Closing the Gap: An Overview of the Policy Options to Close the Competitiveness Gap and Enable an Equitable Zero-Emission Fuel Transition in Shipping," UMAS, London, 2022.
[27] World Bank, "State and Trends of Carbon Pricing 2021," 2021. [Online]. Available: https://openknowledge.worldbank. org/handle/10986/35620. [Accessed 08 April 2022].
[28] Cision, "ABS Leads EMSA Consortium Studying Alternative Fuels and Technologies," Cision, 2021 July 2021. [Online]. Available: https://news.cision.com/american-bureau-of-shipping/r/abs-leads-emsa-consortium-studying-alternativefuels-and-technologies,c3464625. [Accessed 07 May 2022].
[29] H. Wenzel, Future marine fuels in the holistic picture, Sydansk University, Denmark.
[30] SFC, "Smart Freight Centre: What is the GLEC Framework?" 2022. [Online]. Available: https://www. smartfreightcentre.org/en/how-to-implement-items/what-is-glec-framework/58/. [Accessed 3 April 2022].
[31] BCG & GFMA, "Climate Finance Markets and the Real Economy," Boston Consulting Group and Global Financial Market Association, 2020.
[32] The World Bank, "Carbon Pricing Dashboard: What is Carbon Pricing?" [Online]. Available: https:// carbonpricingdashboard.worldbank.org/what-carbon-pricing.
[33] Worldbank, "Carbon Pricing Dashboard," 2022. [Online]. Available: https://carbonpricingdashboard.worldbank.org/ map_data. [Accessed 29 March 2022].
[34] Columbia | SIPA Center on Global Energy Policy, "What You Need to Know About a Federal Carbon Tax in the United States," Center on Global Energy Policy at Columbia University SIPA, 2022. [Online]. Available: https://www. energypolicy.columbia.edu/what-you-need-know-about-federal-carbon-tax-united-states.
[35] Statista, "Carbon taxes worldwide as of April 2021," Satista, 2021. [Online]. Available: https://www. statista.com/statistics/483590/prices-of-implemented-carbon-pricing-instruments-worldwide-by-selectcountry/#:~:text=Carbon%20tax%20rates%20vary%20greatly,metric%20ton%20of%20CO2%20equivalent.
[36] Clean Prosperity, "Sweden: High Carbon Tax, Strong Economic Growth," Clean Prosperity, 2020.
[37] International Chamber of Shipping (ICS), "International Chamber of Shipping sets out plans for global carbon levy to expedite industry decarbonisation," International Chamber of Shipping (CSI), London, 2021.
[38] MMMCZC, "Options Paper on Market-Based Measures. Copenhagen," Mærsk Mc-Kinney Møller Center for Zero Carbon Shipping, Copenhagen, 2021.
[39] Bloomberg Tax, "Maersk Seeks $150-a-Ton Carbon Tax on Shipping Fuel (2)," Bloomberg Tax, 2021.
[40] International Maritime Organization (IMO), "Cutting GHG emissions from shipping - 10 years of mandatory rules," International Maritime Organization (IMO), 2021.
[41] IEA, "Implementing Effective Emissions Trading Systems," IEA, Paris, 2020.
[42] EU, "EU Emissions Trading System (EU ETS)," [Online]. Available: https://ec.europa.eu/clima/system/files/2017-03/ ets_handbook_en.pdf. [Accessed February 2022].
[43] D. J. M. A. O. Edited by Peter Cramton, Global Carbon Pricing the Path to Climate Cooperation, Cambridge, Massachusetts: Massachusetts Institute of Technology, 2017.
[44] T. I. A. P. o. M. D. (IAP), "Decarbonization Pathways for the Global Maritime Industry - Recommendations for Action and Collaboration," Singapore Maritime Foundation, 2021.
[45] P. Lescure, "Medium," 30 July 2020. [Online]. Available: https://medium.com/daphni-chronicles/into-the-jungle-ofcarbon-offsetting-b3d5c9554722. [Accessed 30 June 2022].
[46] B. L. Valentin Bellassen, "The emergence of voluntary carbon offsetting," HAL, vol. hal, no. 01190163, p. 36, 2007.
[47] ECOSTAR, "ECOSTAR | NATURAL TALENTS," 2017. [Online]. Available: https://www.ecostarhub.com/wp-content/ uploads/2017/06/State-of-European-Markets-2017-Voluntary-Carbon.pdf. [Accessed 17 February 2022].
[48] Science-based Targets initiative, "Foundations for Science-based Net zero Targets Setting in the Corporate Sector," September 2020. [Online]. Available: https://sciencebasedtargets.org/resources/legacy/2020/09/foundations-for-net zero-full-paper.pdf. [Accessed 18 February 2022].
[49] S. Re, "Compensating our CO2 emissions: moving from carbon offsets to carbon removal," Swiss Re, 2020. [Online]. Available: https://reports.swissre.com/sustainability-report/2019/footprint/net zero-commitment-in-our-operationsby-2030/focus-moving-from-carbon-offsets-to-carbon-removal.html. [Accessed 09 April 2022].
[50] IIF, "Calling for a High Ambition Path to Net zero," IIF, 2021. [Online]. Available: https://www.iif.com/Portals/1/Files/ High_Ambition_Path_to_Net_Zero.pdf. [Accessed 09 April 2022].
[51] International Chamber of Shipping, "Shipping and World Trade: World Seaborne Trade," International Chamber of Shipping, 2020. [Online]. Available: https://www.ics-shipping.org/shipping-fact/shipping-and-world-trade-worldseaborne-trade/. [Accessed 18 April 2022].
[52] United Nations Environment Programme Finance Initiative, "Turning the Tide: How to finance a sustainable ocean recovery — A practical guide for financial institutions.," United Nations Environment Programme Finance Initiative, Geneva, 2021.
[53] C. de los Reyes Ullevik, "Are we entering a decade of offshore decommissioning?" IHS Markit, 5 October 2021. [Online]. Available: https://ihsmarkit.com/research-analysis/decade-of-offshore-decommissioning.html. [Accessed 19 April 2022].
[54] Environmental Finance, "Sustainable bonds to exceed the trillion-dollar barrier in 2022 for second consecutive year," Environmental Finance, 16 February 2022. [Online]. Available: https://www.environmental-finance.com/content/ the-green-bond-hub/sustainable-bonds-to-exceed-the-trillion-dollar-barrier-in-2022-for-second-consecutive-year. html. [Accessed 19 April 2022].
[55] BloombergNEF, "Sustainable Debt Issuance Breezed Past $1.6 Trillion in 2021," BloombergNEF, 12 January 2022. [Online]. Available: https://about.bnef.com/blog/sustainable-debt-issuance-breezed-past-1-6-trillion-in-2021/. [Accessed 21 April 2022].
[56] Federal Office for the Environment, "Design of a Sustainable Financial System. Swiss Team Input into the UNEP Inquiry. 20 pp," Federal Office for the Environment (FOEN), Bern, 2015.
[57] S. Klyne, "The rise (and rise) of green loans in Australia," Australia and New Zealand Banking Group Limited (ANZ), February 2019. [Online]. Available: https://institutional.anz.com/insight-and-research/the-rise-and-rise-ofgreen-loans-in-australia. [Accessed 22 April 2022].
[58] UK DfT, "Policy paper — COP 26: Clydebank Declaration for green shipping corridors," UK Department for Transport, 13 April 2022. [Online]. Available: https://www.gov.uk/government/publications/cop-26-clydebankdeclaration-for-green-shipping-corridors/cop-26-clydebank-declaration-for-green-shipping-corridors. [Accessed 7 May 2022].
[59] U.S. Department of State, "Fact Sheet —Green Shipping Corridors," U.S. Department of State, 12 April 2022. [Online]. Available: https://www.state.gov/green-shipping-corridors/. [Accessed 07 May 2022].
[60] M. Parker, R. Chen, J. Christensen, F. Delasalle and M. Stone, "The Next Wave - Green Corridors - A special report for the Getting to Zero Coalition," 2021. [Online]. Available: https://www3.weforum.org/docs/WEF_GtZ_report_The_ Next_Wave_Green_Corridors_2021.pdf. [Accessed 7 May 2022].
[61] coZEV, "Los Angeles - Shanghai Green Shipping Corridor," Cargo Owners for Zero Emission Vessels (coZEV), 28 January 2022. [Online]. Available: https://www.cozev.org/initiatives. [Accessed 7 May 2022].
[62] P. Berrill, "Chile agrees green corridor project with zero carbon centre," TradeWinds, 13 April 2022. [Online]. Available: https://www.tradewindsnews.com/esg/chile-agrees-green-corridor-project-with-zero-carboncentre/2-1-1201890. [Accessed 07 May 2022].
[63] Fahnestock, J. and Smith, T., "This new strategy is paving the way for net zero shipping," World Economic Forum, 2021. [Online]. Available: https://www.weforum.org/agenda/2021/10/net zero-shipping-decarbonisation-new-strategy/.
[64] American Bureau of Shipping, "Setting the Course to Low Carbon Shipping," 2019.
[65] American Bureau of Shipping, "View of the Value Chain," 2021.
[66] American Bureau of Shipping, "Pathways to Sustainable Shipping," 2020.
[67] American Bureau of Shipping, "Sustainability Whitepaper: Ammonia as Marine Fuel," 2020.
[68] American Bureau of Shipping, "Sustainability Whitepaper: Methanol as Marine Fuel," 2021.
[69] American Bureau of Shipping, "Sustainability Whitepaper: LNG as Marine Fuel," 2020.
[70] WWF, 1 October 2019. [Online]. Available: https://c402277.ssl.cf1.rackcdn.com/publications/1310/files/original/WWF_ position_and_guidance_on_corporate_use_of_voluntary_carbon_credits_EXTERNAL_VERSION_11_October_2019_ v1.2.pdf?1591194127. [Accessed 17 February 2022].
[71] T. Smith, "Definition of zero carbon energy sources," GETTING TO ZERO COALITION, 2019.
[72] D. Ellis, "Access to green energy is shipping's greatest challenge," Energy Digital, 2022.
[73] D. Thomas, "Amazon, Ikea and Unilever pledge zero-carbon shipping by 2040," BBC News, 19 October 2021. [Online]. Available: https://www.bbc.com/news/business-58970877.
[74] G. Dominioni and D. Englert, "Carbon Revenues from International Shipping: Enabling an Effective and Equitable Energy Transition - Technical Paper," World Bank, Washington, DC., 2022.
[75] U.S. Department of Energy, "Carbon capture transport, & storage — supply chain deep dive assessment," U.S. Department of Energy, Washington DC, 2022.
[76] M. Pascouali and C. Mesters, "Opinion: We can use carbon to decarbonize — and get hydrogen for free," Proceedings of the National Academy of Sciences (PNAS), vol. 118, 2021.
[77] U.S, Department of State, "Factsheet — Launching the First Movers Coalition at the 2021 UN Climate Change Conference," U.S, Department of State, Office of Spokesperson, 4 November 2021. [Online]. Available: https://www.state. gov/launching-the-first-movers-coalition-at-the-2021-un-climate-change-conference/. [Accessed 4 May 2022].
[78] H. Kilemo, R. Montgomery and A. M. Leitão, "Getting to Zero Coalition - Mapping of Zero Emission Pilots and Demonstration Projects," March 2022. [Online]. Available: https://www.globalmaritimeforum.org/content/2022/03/ Mapping-of-zero-emission-pilots-and-demonstration-projects_third-edition.pdf. [Accessed 4 May 2022].
[79] Simpson Spence Young. "Outlook 2022." January 2022 [Online] https://www.ssyonline.com/media/2016/ssy-2022outlook-final.pdf [Accessed 19 May 2022].
[80] Deepinder Jot Singh Aulakh, Kiari Goni Boulama, Jon G. Pharoah, “On the reduction of electric energy consumption in electrolysis: A thermodynamic study,” International Journal of Hydrogen Energy, 2021.
[81] IEA (2021), Global Energy Review 2021, IEA, Paris https://www.iea.org/reports/global-energy-review-2021 .
[82] IEA (2021), Net Zero by 2050, IEA, Paris https://www.iea.org/reports/net zero-by-2050.
[83] "Why Ships of the Future will Run on Electricity." https://www.infineon.com/cms/en/discoveries/electrified-ships/ [Accessed 19 May 2022].
[84] RE (imo.org)- ANNEX 11 RESOLUTION MEPC.304(72) [Adopted 13 April 2018].
[85] https://www.imo.org/en/MediaCentre/MeetingSummaries/Pages/MEPC77.aspx.
[86] Mid- and Long-Term Measures (imo.org).
[87] CCUS In Clean Energy Transitions Page 152.
[88] https://www.catf.us/work/super-pollutants/about/.
[89] https://www.bcg.com/publications/2021/global-zero-carbon-shipping-transformation-challenge.
[90] Zhou P, Wang H. Carbon capture and storage - Solidification and storage of carbon dioxide captured on ships. Ocean Eng 2014;91:172–80.
[91] Monteiro J. CO2 ASTS – carbon capture, storage and transfer in shipping, a technical and economic feasibility study: public concise report; 2020.
[92] Mitsubishi Heavy Industries, Ltd. Global Website | Mitsubishi Shipbuilding Begins Verification Testing of Marinebased CO2 Capture System — “CC-Ocean” Project in Partnership with “K” Line and ClassNK Part of Japan Government Initiative to Support Development of Marine Resource Technologies — (mhi.com).
[93] Mitsubishi Shipbuilding Successfully Separates and Captures CO2 from Exhaust Gas in World’s First Marine-based CO2 Capture System Project | Hellenic Shipping News Worldwide.
[94] Carbon Capture and Storage onboard ships | Daphne Technology.
[95] IEA, R. (2020). Energy technology perspectives 2020. Special Report on Carbon Capture, Utilisation and Storage.
[96] IEA (2021), Direct Air Capture, IEA, Paris https://www.iea.org/reports/direct-air-capture.
[97] Caminiti, Susan. "Why the next electric battery boom may be in cargo ships (cnbc.com)." https://www.cnbc. com/2021/10/26/why-the-next-electric-battery-boom-may-be-in-cargo-ships.html [Accessed 19 May 2022].
[98] Macola, Ilaria. "Electric ships: the world’s top five projects by battery capacity." https://www.ship-technology.com/ features/electric-ships-the-world-top-five-projects-by-battery-capacity/ [Accessed 19 May 2022].
[99] Doniger, Alicia "Amazon’s new net zero carbon pledge is focused on the oceans, as shipping giants pursue alternative fuels" https://www.cnbc.com/2021/10/19/amazon-backs-zero-carbon-ocean-shipping-by-2040-.html [Accessed 19 May 2022].
[100] www.oeko.de.
[101] Advancements in ship-based carbon capture technology on board of LNG-fueled ships International Journal of Greenhouse Gas Control (IF3.738), Pub Date: 2022-01-08, DOI.
[102] Xiaobo Luo, Meihong Wang, Study of solvent-based carbon capture for cargo ships through process modelling and simulation, Applied Energy, Volume 195, 2017, Pages 402-413, ISSN 0306-2619, https://doi.org/10.1016/j. apenergy.2017.03.027.
[103] Feenstra, Maartje & Monteiro, Juliana & Akker, Joan & Abu Zahra, Mohammad & Gilling, Erwin & Goetheer, Earl. (2019). Ship-based carbon capture onboard of diesel or LNG-fueled ships. International Journal of Greenhouse Gas Control. 85. 1-10. 10.1016/j.ijggc.2019.03.008.
[104] https://www.mariko-leer.de/wp-content/uploads/2020/06/200513-CO2ASTS-Public-Concise-Report.pdf.
[105] Marcin Stec, Adam Tatarczuk10.1016/j.ijggc.2021.103575, Tomasz Iluk, Mateusz Szul, Reducing the energy efficiency design index for ships through a post-combustion carbon capture process, International Journal of Greenhouse Gas Control, Volume 108, 2021, 103333, ISSN 1750-5836, https://doi.org/10.1016/j.ijggc.2021.103333.
[106] Nguyen Van Duc Long, Dong Young Lee, Choongyong Kwang, Young Mok Lee, Sung Won Lee, Volker Hessel, Moonyong Lee, Improvement of marine carbon capture onboard diesel fueled ships, Chemical Engineering and Processing — Process Intensification, Volume 168, 2021, 108535, ISSN 0255-2701, https://doi.org/10.1016/j.cep.2021.108535.
[107] Process and Economic Evaluation of an Onboard Capture System for LNG-Fueled CO2 Carriers A. Awoyomi, K. Patchigolla, and E. J. Anthony Industrial & Engineering Chemistry Research 2020 59 (15), 6951-6960 DOI: 10.1021/acs. iecr.9b04659.
[108] https://www.offshore-energy.biz/scorpio-tankers-carbon-ridge-team-up-to-develop-onboard-carbon-capturefor-ships/.
[109] https://www.offshore-energy.biz/dsme-develops-onboard-ccs-technology/.
[110] https://www.offshore-energy.biz/carbon-collectors-to-assess-value-maritimes-carbon-capture-tech-onboardnew-tugs/.
[111] Pathways to a Low-Carbon Future Phase IV Concept Ship Designs for Hydrogen & Carbon Dioxide Transport Takers and Onboard CCS ABS and HEC.
[112] Dominioni, G. and D. Englert. Carbon Revenues from International Shipping: Enabling an Effective and Equitable Energy Transition — Technical Paper. Washington, DC.: World Bank, 2022.
[113] World Bank. Partnership for Market Readiness; International Carbon Action Partnership. 2021. Emissions Trading in Practice, Second Edition : A Handbook on Design and Implementation. Handbook. Washington, DC.: World Bank, 2021. http://hdl.handle.net/10986/35413.
[114] International Chamber of Shipping (ICS). International Chamber of Shipping sets out plans for global carbon levy to expedite industry decarbonisation. London: International Chamber of Shipping (CSI), 2021.
[115] International Chamber of Shipping. Press Release: Governments decide on International Chamber of Shipping USD 5 billion R&D fund to accelerate zero-carbon shipping in first ‘litmus test’ of COP 26 commitments. 22 November 2021. International Chamber of Shipping. <https://www.ics-shipping.org/press-release/governments-decide-oninternational-chamber-of-shipping-usd5-billion-rd-fund-in-first-litmus-test-of-cop-26-commitments/>.
[116] Directorate-General for Climate Action. "Proposal for a DIRECTIVE OF THE EUROPEAN PARLIAMENT AND OF THE COUNCIL amending Directive 2003/87/EC establishing a system for greenhouse gas emission allowance trading within the Union (Document 52021PC0551)." 14 July 2021. European Union Law. https://eur-lex.europa.eu/legal-content/ EN/ALL/?uri=CELEX:52021PC0551. [Accessed 20 May 2022].
[117] Directorate-General for Mobility and Transport. Proposal for a REGULATION OF THE EUROPEAN PARLIAMENT AND OF THE COUNCIL on the use of renewable and low-carbon fuels in maritime transport and amending Directive 2009/16/EC (Document 52021PC0562). Proposal. Brussels: European Commission, 2021. https://eur-lex.europa.eu/legalcontent/EN/ALL/?uri=CELEX:52021PC0562.
[118] Poseidon Principles. "A global framework for responsible ship finance." June 2021. Poseidon Principles. https:// www.poseidonprinciples.org/finance/wp-content/uploads/2019/07/Poseidon_Principles.pdf. 20 May 2022. —. Poseidon Principles. n.d. <https://www.poseidonprinciples.org/>.
[119] Council of the European Union. "Document 32018L2001 - Directive (EU) 2018/2001 of the European Parliament and of the Council of 11 December 2018 on the promotion of the use of energy from renewable sources (Text with EEA relevance.)." 24 December 2018. European Union Law. Document. [Accessed 20 May 2022].
[120] Krantz, R., K. Søgaard and T. Smith. The scale of investment needed to decarbonize international shipping. 20 January 2020. https://www.globalmaritimeforum.org/news/the-scale-of-investment-needed-to-decarbonizeinternational-shipping. [Accessed 20 May 2022].
[121] European Parliament. "BRIEFING — Review of the EU ETS - 'Fit for 55' package." January 2022. EU Legislation in Progress. [Accessed 20 May 2022].
— "DIRECTIVE (EU) 2018/2001 OF THE EUROPEAN PARLIAMENT AND OF THE COUNCIL of 11 December 2018 on the promotion of the use of energy from renewable sources." Official Journal of the European Union (2018).
— "Review of the EU ETS 'Fit for 55' package." 2020.
— "Sustainable maritime fuels 'Fit for 55' package: The FuelEU Maritime proposal." 2022.
[122] Parker, Sophia, et al. Harnessing the EU ETS to reduce international shipping emissions: assessing the effectiveness of the proposed policy inclusion of shipping in the EU ETS to reduce international shipping emissions. London, United Kingdom: Environmental Defense Fund, 2021. https://www.u-mas.co.uk/wp-content/uploads/2021/11/ UMAS-2021-Harnessing-the-EU-ETS-to-reduce-international-shipping-emissions.pdf.
[123] European Commission. DIRECTIVE OF THE EUROPEAN PARLIAMENT AND OF THE COUNCIL amending Directive 2003/87/EC establishing a system for greenhouse gas emission allowance trading within the Union, Decision (EU) 2015/1814. Brussels, 2021.
— Emissions Trading – Putting a Price on carbon (Questions and Answers). 14 July 2021. https://ec.europa.eu/ commission/presscorner/detail/en/qanda_21_3542. 20 May 2022.
— "EU ETS Handbook." 2015.
— REGULATION OF THE EUROPEAN PARLIAMENT AND OF THE COUNCIL on the use of renewable and low-carbon fuels in maritime transport and amending Directive 2009/16/ECtransport and amending. Brussels, 2021.
[124] Taskforce on Scaling Voluntary Carbon Markets. TSVCM Publishes Initial Recommendations, Calls for Feedback from Stakeholders. 10 November 2020. https://www.iif.com/tsvcm/Main-Page/Publications/ID/4164/Taskforce-onScaling-Voluntary-Carbon-Markets-Publishes-Initial-Recommendations-Calls-for-Feedback-from-Stakeholders. [Accessed 20 May 2022].
[125] Fuelling the Fourth Propulsion Revolution, An Opportunity for All International Chamber of Shipping, 2022.
[126] IEA (2021), Net Zero by 2050, IEA, Paris https://www.iea.org/reports/net zero-by-2050.
[127] IRENA (2021), A pathway to decarbonise the shipping sector by 2050, International Renewable Energy Agency.
[128] IRENA (2020), Green Hydrogen Cost Reduction: Scaling up Electrolysers to Meet the 1.5⁰ C Climate Goal, International Renewable Energy Agency, Abu Dhabi.
[129] 48337_ATK ETI_Electricity_Storage Factbook_section-All Sections_14 Feb 2018 – FINAL (energy-transitioninstitute.com).
[130] Hydrogen Council (2017). https://hydrogencouncil.com/wp-content/uploads/2017/11/Hydrogen-Scaling-up_ Hydrogen-Council_2017.compressed.pdf.