1 minute read
Key Findings


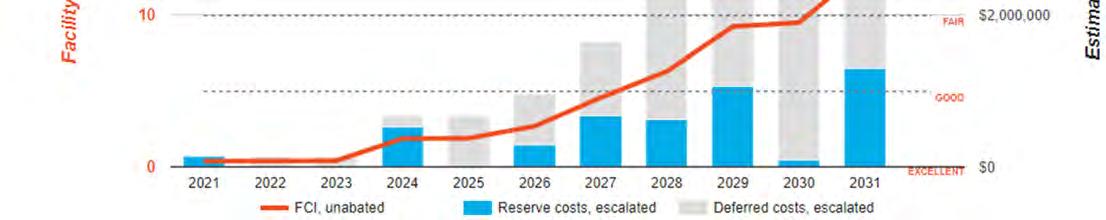
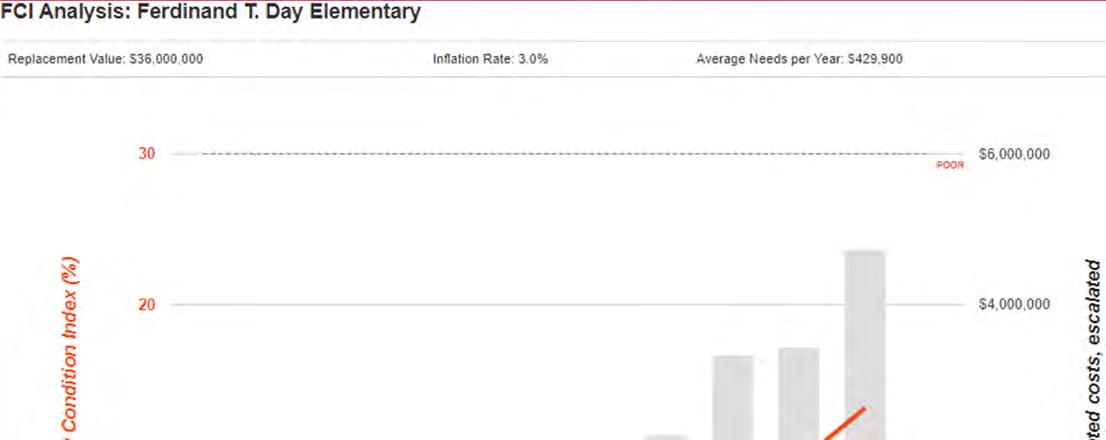
The vertical bars below represent the year-by-year needs identified for the site. The orange line in the graph below forecasts what would happen to the FCI (left Y axis) over time, assuming zero capital expenditures over the next ten years. The dollar amounts allocated for each year (blue bars) are associated with the values along the right Y axis.
Needs by Year with Unaddressed FCI Over Time
Advertisement