Acta Universitatis Sapientiae The scientific journal of Sapientia Hungarian University of Transylvania (Cluj-Napoca, Romania) publishes original papers and surveys in several areas of sciences written in English. Information about each series can be found at http://www.acta.sapientia.ro.
Main Editorial Board MártonDTONK László ÁVID Editor-in-Chief Editor-in-Chief Adalbert BALOG Executive Editor Zoltán KÁSA Member Angella SORBÁN Managing Editor Laura NISTOR Member Csaba FARKAS Member Ágnes PETHŐ Member
Acta Universitatis Sapientiae Agriculture and Environment Executive Editor Adalbert BALOG (Sapientia Hungarian University of Transylvania, Romania) adalbert.balog@gmail.com Subject Editors Agriculture – Horticulture János B ÁLINT (Sapientia Hungarian University of Transylvania, Romania) András BOZSIK (University of Debrecen, Hungary) Emre ILKER (Ege University, Turkey) Viktor MARKÓ (Corvinus University of Budapest, Hungary) Ferenc T ÓTH (Szent István University, Hungary) Ali TOPAL (Selcuk University, Turkey) Ecology and &nvironment Klára BENEDEK (Sapientia Hungarian University of Transylvania, Romania) Erzsébet DOMOKOS (University of Medicine, Pharmacy, Sciences and Technology, Romania) Róbert GALLÉ (University of Szeged, Hungary) Tibor HARTEL (BabeşoBolyai University, Romania) Hossein LOTFALIZADEH (East-Azerbaijan Agr. and Natural Resources Research Center, Iran) István MÁTHÉ (Sapientia Hungarian University of Transylvania, Romania) Mohsen MEHRPARVAR (Graduate University of Advanced Technology, Iran) István URÁK (Sapientia Hungarian University of Transylvania, Romania) Environmental $hemistry Mustafa GAZI (Eastern Mediterranean University, Turkey) Geography and 4oil 4cience Csaba FAZAKAS (Sapientia Hungarian University of Transylvania, Romania) Péter SZILASSI (University of Szeged, Hungary)
Sapientia University
Scientia Publishing House
ISSN 2065-748X http://www.acta.sapientia.ro
Acta Universitatis Sapientiae
Agriculture and Environment Volume 13, 2021
Sapientia Hungarian University of Transylvania Scientia Publishing House
Acta Universitatis Sapientiae, Agriculture and Environment is covered by the following services: AGRICOLA (National Agricultural Library) CABI (over 50 subsections) DOAJ (Directory of Open Access Journals) EBSCO (relevant databases) EBSCO Discovery Service Publons Primo Central (ExLibris) Sherpa/RoMEO Summon (Serials Solutions/ProQuest) TDOne (TDNet) Ulrich’s Periodicals Directory/ulrichsweb WanFang Data WorldCat (OCLC)
Contents A. O. Adeleye, M. B. Yerima, M. E. Nkereuwem, V. O. Onokebhagbe, I. S. Sadiq, F. K. Amoo, M. Raji Effects of two bacterial inoculants and biostimulants on the growth performance of Amaranthus cruentus at different levels of spent-engine-oil-contaminated soil . . . . . . . . . . . . . . . . . . . . . . . . . . . . . . . . . . 1 R. Gopinath, A. V. R. Ram, A. Sengupta Inadvertent implications of climate change for butterflies . . . . . . . . . . . . . . . . 13 A. B. Csorba, B. Putnoky-Csicsó, A. Demeter, I.-I. Nyárádi, J. Bálint Insecticide efficacy on ticks (Dermacentor spp.) – Case study from an infested territory in Transylvania, Romania . . . . . . . . . . . 23 K. Bálint, I. R. Báthoryné Nagy Sustainable and preservative historic garden management . . . . . . . . . . . . . . . 36 O. O. Akingbola, C. O. Akinbile, S. O. Ojeniyi Understanding the influence of maize (Zea mays) and cowpea (Vigna unguiculata L. Walp) growth period on some thermal and hydrological properties of two soils with textural class variation . . . . . . 48 B. Tompa, L. Fodorpataki Influence of triacontanol and salt stress on the growth and metabolism of spinach . . . . . . . . . . . . . . . . . . . . . . . . . . . . . . . . . . . . . . . . . 65 N. C. Onwubiko, Q. I. Emereola, C. P. Anyanwu, G. O. Chimdi Preliminary study on species variability and evolutionary status of African walnut (Plukenetia conophora) . . . . . . . . . . . . . . . . . . . . . . . . . . . . 77 Á. Kovácsné Madar, M. Takácsné Hájos Evolution of quality parameters of different lettuce (Lactuca sativa L.) varieties under unheated plastic tunnel . . . . . . . . . . . . . . . . . . . . . . . . . . . . . . . 88 M. M. Akpalu, G. K. Ofosu-Budu, F. K. Kumaga, K. Ofori, L. Mintah Field performance and survival of cocoa seedlings raised in different growing media. . . . . . . . . . . . . . . . . . . . . . . . . . . . . . . . . . . . . . . . . 100 A. Keresztes-Sipos, A. Reith, A. Fekete, P. I. Balogh The role of municipalities and landscape architects in the public involvement processes related to green infrastructure developments . . . . . . . . . . . . . . . . . . . . . . . . . . . . . . . . 113
B. Biró-Janka, K. Molnár, N. Székely, I.-I. Nyárádi Preliminary results regarding the seed yield of pot marigold (Calendula officinalis L.) plants harvested at different stages of seed maturity . . . . . . . . . . . . . . . . . . . . . . . . . . . . . . . . . . . . . . . . . . . . . . . . . 125 Retraction . . . . . . . . . . . . . . . . . . . . . . . . . . . . . . . . . . . . . . . . . . . . . . . . . . . . . . 138
ACTA UNIVERSITATIS SAPIENTIAE AGRICULTURE AND ENVIRONMENT, 13 (2021) 1–12 DOI: 10.2478/ausae-2021-0001
Effects of two bacterial inoculants and biostimulants on the growth performance of Amaranthus cruentus at different levels of spent-engine-oil-contaminated soil Adeniyi Olarewaju ADELEYE,*1,2 Mohammed Bello YERIMA,2 Michael Edet NKEREUWEM,3 Victor Odiamehi ONOKEBHAGBE,3 Ismaila Shina SADIQ,4 Florence Kemi AMOO,2 Madinat RAJI2 *1 Department of Environmental Sciences, Federal University Dutse, Nigeria e-mail: adeniyi.adeleye@fud.edu.ng; adeniyiadeleye80@gmail.com 2
Department of Microbiology and Biotechnology, Federal University Dutse, Nigeria e-mail: belyerima@gmail.com; amooflorence@gmail.com; madinat_raji@yahoo.com 3
Department of Soil Science, Federal University Dutse, Nigeria e-mail: michael.n@fud.edu.ng; victor.o@fud.edu.ng 4
Department of Chemistry, Federal University Dutse, Nigeria e-mail: shinasharon@yahoo.co.uk Manuscript received 25 December 2020; revised 22 January 2021; accepted 30 March 2021
Abstract. This study was conducted to assess the growth performance of Amaranthus cruentus on spent-engine-oil- (SEO) contaminated soil bioremediated with bacterial inoculants and processed biostimulants: compost, sole cocoa pod husk (CPH), and sole cow dung (CD). SEO with 5%, 10%, and 15% densities was artificially contaminated with sterilized soil. Subsequently, biostimulants and bacterial inoculants, Staphylococcus aureus and Bacillus cereus, were applied. The treatments were replicated three times, adopting a completely randomized design. After the biodegradation assay that lasted for 70 days, Amaranthus cruentus seeds were sown, while its growth parameters, plant height, number of leaves, and stem girth were monitored for 6 weeks after sowing (WAS). The results generated indicate that the applied biostimulants and bacterial inoculants accomplished significant (P < 0.05) reclamation of the SEO-contaminated soil as the test plant recorded substantial growth compared with the controls that recorded no growth. At 2 WAS, compost influenced the highest plant heights (6.5, 7.4, and 7.5 cm) compared with other biostimulants at 5%, 10%, and 15% SEO contamination levels respectively. At 4 WAS, all biostimulants produced the same number of leaves (5.0) at 5% SEO contamination level, the compost recorded the highest
2
Adeleye, Yerima, Nkereuwem, Onokebhagbe, Sadiq, Amoo, Raji number of leaves (6.0) at 10% SEO contamination level, while all biostimulants produced the same number of leaves (4.0) at 15% SEO contamination level. The study showed that the combination of biostimulants and bacterial inoculants significantly reclaimed SEO contaminated soil. Therefore, reclamation of petroleum-impacted environments with the combination of biostimulation and bioaugmentation is recommended. Keywords: Amaranthus cruentus, bacterial inoculants, biostimulants, spent engine oil, contaminated soil
1. Introduction Amaranthus cruentus is a common leafy vegetable cultivated in all regions in Nigeria and in other West African countries [1]. This vegetable has a fast growth rate, and it is planted all year round, with irrigation in areas with minimal rainfall. There is a high demand for this crop, especially in urban areas, where no primary cultivation of the crop takes place [2]. This has led to making this vegetable an important commodity in our market and to generating an important economic activity for rural women [3]. This vegetable is highly nutritional because of its high content of essential micronutrients such as iron, manganese, and zinc [4]. According to [3], the protein found in the young plants of amaranths can be essential for people who have no access to animal sources of protein. In Nigeria, the indiscriminate disposal of spent engine oil (SEO) is a rampant practice which invariably leads to the pollution of agricultural land, thereby rendering such land unsuitable for the cultivation of crops [5]. It has been reported by [6] that considerable quantities of petroleum hydrocarbons have the capability of sterilizing the soil, thereby stopping crop growth and yield for a long period of time. According to [7], antagonistic impacts of SEO ranging from reduced germination of seeds, reduced yield, and increased uptake of toxic components of SEO have been detected on plants grown in SEO-polluted soils. Bioremediation technology is a technique used to restore an environment previously impacted by hydrocarbon contamination. [8] and [9] have reported the cost-effectiveness and eco-friendly nature of bioremediation technology in the treatment of petroleum hydrocarbon and other hydrocarbon-related environmental pollution. [10] reported on the biostimulatory effect of organic fertilizer on hydrocarbon-polluted soil in the lowland forest ecosystem in the Niger Delta region of Nigeria. The authors reported that the enhanced natural attenuation process adopted in their study yielded a significant reduction and an acceptable threshold in the total petroleum hydrocarbon (TPH) values with improved nutrient concentrations and bioavailability recorded at the end of the experiment when compared with the high TPH values measured at the start of the experiment. This study was, however, conducted with a view to assessing the growth performance
Effects of two bacterial inoculants and biostimulants on the growth…
3
of Amaranthus cruentus on SEO-contaminated soil biostimulated with compost made of cocoa pod husk (CPH) and cow dung (CD), sole CPH, sole cow dung (CD), and bioaugmented with Staphylococcus aureus and Bacillus cereus co-culture.
2. Materials and methods Experimental site This research was conducted at the Teaching and Research Farm of the Federal University Dutse, Jigawa State, Nigeria. According to [11], Dutse is located at latitude 110 46’39’’N and longitude 90 20’3’’E. The area is known for its undulating relief, which is principally categorized as Sudanese savannah agro-ecological zone [12].
Collection and processing of biostimulants The three (3) bio-enhancement formulations, compost (generated from the composting of CPH and CD), sole CPH, and sole CD, employed for biostimulation in this study were collected and subsequently processed according to the procedures described by [13] and [14].
Collection and processing of soil As done by [15], 250 kg top soil (0–25 cm depth) that had not had any history of pollution was collected from four different points in the area situated behind the Department of Soil Science, Federal University Dutse main campus. The soil was air-dried and bulked with a view to producing composite sample.
Collection of spent engine oil Twenty (20) litres of SEO was obtained from one of the service pits in Mechanic Village Dutse, Jigawa State.
Isolation and identification of the inoculant bacteria adopted for bioaugmentation Ten (10) g of soil that had been naturally polluted with SEO was collected at a depth of 5 cm from the Dutse mechanic village. The bacterial isolate that was adopted as co-culture inoculant in this study was isolated from a SEO-polluted soil by applying the procedure as described in [16], and it was subsequently identified according to the procedures outlined by [17].
4
Adeleye, Yerima, Nkereuwem, Onokebhagbe, Sadiq, Amoo, Raji
Determination of the physicochemical properties of the samples Soil samples taken from natural soil, SEO-polluted soil, and organic materials employed in this study were subjected to various analyses ranging from pH values to electrical conductivity (EC) in deionized water (1: 2.5 w/v for soil, and 1: 5 w/v for organic materials). Organic carbon was analysed via the modified Walkley– Black procedure [18], while the cation exchange capacity (CEC) was determined through the summation method described by [19]. Total nitrogen and phosphorous contents of all the samples were estimated through the Kjeldhal and Bray-1 method in reference to [20] and [21]. The soil mechanical analysis was similarly determined by the hydrometer method described by [22].
Preparation and contamination of soil As established by [23], the bulked soil was sieved with 2 mm mesh size. The soil was autoclaved at 121 0C for 15 minutes so as to expunge the extraneous effect of undesirable microbial life. Subsequently, the sterile soil that had undergone autoclaving weighing 1.5 kg was put into 108 polyethylene bags and 75 ml, 150 ml, and 225 ml (w/w) SEO levels were added separately, indicating 5%, 10%, and 15% contamination levels respectively. As suggested by [15], the soil and the varying contamination levels with SEO were meticulously mixed together and left undisturbed for 14 days so as to ensure the desirable volatilization of the toxic components of the oil.
Biodegradation experiment The biodegradation assay conducted in this study was done according to the procedures described by [14]. This involved a bacterial co-culture, which was bioaugmented with the SEO-contaminated soil in each experimental bag apart from the controls, which did not receive such bioaugmentation and biostimulation. All the 108 polyethylene experimental bags were subsequently incubated at room temperature for 70 days, as outlined by [24].
Experimental layout The experiment was set up by adopting a completely randomized design, whereby three (3) replicates were employed for each biostimulant and each SEO contamination level.
Effects of two bacterial inoculants and biostimulants on the growth…
5
Screen house experiment After 70 days of bacterial remediation of SEO from the soil, the sowing of Amaranthus cruentus seeds was done as established by [15]. This was done with a view to assessing the growth performance: plant height (measured in centimetres using a metre rule), stem girth (measured in centimetres using a metre rule), and number of leaves (counted visually) of the test crop on bacterial remediated SEOcontaminated soil. As outlined by [25], five seeds of Amaranthus cruentus were sown directly into the experimental bags. Two weeks after sowing, it was thinned down to one plant per experimental bag. The experiment was terminated at the 6th WAS.
Statistical analysis All data collected were subjected to analysis of variance (ANOVA) using GenStat version 17, while Duncan’s multiple range test (DMRT) was employed to separate significant means at 5% level of significance.
3. Results and discussions Physicochemical properties of biostimulants and soils The determined properties of the biostimulants and soils are presented in Table 1. The sum of exchangeable bases (SEB) of the compost, sole CD, and sole CPH used in this study recorded 221.7 cmol kg-1, 82.1 cmol kg-1, and 166.15 cmol kg-1 respectively, while the SEB of the natural soil devoid of pollution and SEOcontaminated soil employed in this study recorded 3.51 cmol kg-1 and 1.05 cmol kg-1 respectively. The compost, sole CD, and sole CPH recorded 213.16 cmol kg-1, 80 cmol kg-1, and 162 cmol kg-1 potassium respectively. pH in water obtained from the soils shows that it was slightly acidic, while pH obtained from the compost, sole CD, and sole CPH was slightly alkaline to alkaline as shown in Table 1. This alkalinity can be linked to the high levels of exchangeable bases, which are characteristic of organic materials as shown in Table 1. Table 1. Physicochemical properties of soils and biostimulants Parameters Moisture content (%) Ash content (%) pH (water)
Natural soil
SEOCS
Compost
Sole CD
Sole CPH
2.04
0.8
2.0
7.3
11.11
-
-
65
68.8
23
6.5
6.8
9.45
8.15
7.6
6
Adeleye, Yerima, Nkereuwem, Onokebhagbe, Sadiq, Amoo, Raji
Parameters
Natural soil
SEOCS
Compost
Sole CD
Sole CPH
Organic carbon (%)
0.49
0.52
48.25
41.55
33.40
Total nitrogen (%)
0.06
0.08
5.85
2.85
2.65
Available phosphorous (mg kg-1)
11.02
9.40
1.48
1.2
0.08
EC (dS cm-1)
0.92
1.20
8.86
8.10
6.42
Potassium
0.19
0.07
213.16
80
162
Calcium
1.82
0.63
4.8
0.2
1.6
Magnesium
0.92
0.18
3.24
1.5
2.45
Sodium
0.58
0.17
0.5
0.4
0.1
SEB
3.51
1.05
221.7
82.1
166.15
Clay + Silt
420
200
-
-
-
Clay
100
120
-
-
-
Silt
320
80
-
-
-
580
800
-
-
-
Sandy Loam
Loamy Sand
-
-
-
Exchangeable bases (cmol kg-1)
Particle size (g kg-1)
Sand Textural class
Note: - = Nil; SEOCS= Spent-engine-oil-contaminated soil; SEB= Sum of exchangeable bases.
Effects of biostimulants on the growth of Amaranthus cruentus on spent-engine-oil-bioremediated soil Results recorded with regard to the effect of the biostimulants on the plant height of Amaranthus cruentus were significant (P < 0.05) at 2 WAS, 4 WAS, and 6 WAS. Compost influenced the highest plant heights (6.5, 7.4, and 7.5 cm) compared with other biostimulants at 5%, 10%, and 15% SEO contamination levels respectively (Table 2). At 4 WAS, the compost further recorded a significant increment in plant heights (10.8 and 11.2 cm) at 5% and 15% SEO contamination levels respectively, while sole CPH produced the highest plant height (18.3 cm) at 10% SEO contamination levels compared with other biostimulants (Table 3). Compared with other biostimulants at 5% and 15% SEO contamination levels, the compost produced the highest plant heights (28.3 and 28.2 cm respectively) at 6 WAS, while sole CPH recorded the highest plant height (30.5 cm) at 10% SEO contamination level compared with other biostimulants (Table 4).
Effects of two bacterial inoculants and biostimulants on the growth…
7
Table 2. Growth of test crop on bioremediated spent-engine-oil-contaminated soil at 2 WAS SEO-contaminated levels 5% Biostimulants
10%
15%
Plant height (cm) c
a
5%
10%
15%
Number of leaves
Stem girth (cm)
3.7
0.6d
0.8c
0.5e
5.9d
4.0a
3.7a
3.7a
0.9b
1.2a
0.5e
6.0d
4.1f
4.0a
4.0a
3.3a
0.8c
0.6d
0.3f
0.0g
0.0g
0.0b
0.0b
0.0b
0.0i
0.0i
0.0i
7.4
CPH only
6.4c
7.2b
CD only
5.4e
Control
0.0g
7.5
a
15%
4.0
6.5
a
10%
3.7
Compost
a
5%
a
Note: Means with the same letters in each column are not significantly different using Duncan’s multiple range test (DMRT); (P > 0.05).
Table 3. Growth of test crop on bioremediated spent-engine-oil-contaminated soil at 4 WAS SEO-contaminated levels 5% Biostimulants
10%
15%
Plant height (cm)
5%
10%
15%
Number of leaves
5%
10%
15%
Stem girth (cm)
Compost
10.8g
17.8b
11.2e
4.7b
5.0ab
4.3b
1.4c
1.5b
1.4c
CPH only
15.4c
18.3a
11.0f
4.3b
5.7a
4.3b
1.2e
2.4a
1.2e
CD only
12.5d
8.3h
6.8i
5.0ab
4.3b
4.3b
1.3d
1.2e
0.8d
Control
0.0j
0.0j
0.0j
0.0c
0.0c
0.0c
0.0f
0.0f
0.0f
Note: Means with the same letters in each column are not significantly different using Duncan’s multiple range test (DMRT); (P > 0.05).
Table 4. Growth of test crop on bioremediated spent-engine-oil-contaminated soil at 6 WAS SEO-contaminated levels 5% Biostimulants
10%
15%
Plant height (cm)
5%
10%
15%
Number of leaves
5%
10%
15%
Stem girth (cm)
Compost
28.3c
28.6b
28.2d
8.0c
9.0b
8.0cd
2.6c
2.7b
2.5d
CPH only
23.0f
30.5a
23.3e
8.0cd
10.0a
7.0e
2.3f
2.8a
2.6c
CD only
21.6g
20.8h
20.3i
8.0cd
7.0e
7.0ce
2.5d
2.4e
2.4e
g
g
0.0g
Control
0.0
j
0.0
j
0.0
j
0.0
f
0.0
f
f
0.0
0.0
0.0
Note: Means with the same letters in each column are not significantly different using Duncan’s multiple range test (DMRT); (P > 0.05).
8
Adeleye, Yerima, Nkereuwem, Onokebhagbe, Sadiq, Amoo, Raji
All the biostimulants significantly enhanced the number of leaves of Amaranthus cruentus on all the SEO contamination levels employed in this study (P < 0.05). At 2 WAS, both sole CPH and sole CD produced the highest number of leaves (4.0), compost and sole CD produced the highest number of leaves (4.0), while compost and sole CPH recorded the highest number of leaves (3.7) at 5%, 10%, and 15% SEO contamination levels respectively (Table 2). At 4 WAS, sole CD produced the highest (5.0) number of leaves, sole CPH produced the highest number of leaves (5.7), while all the biostimulants recorded the same number of leaves (4.3) at 15% SEO contamination level (Table 3). At 6 WAS, all the biostimulants produced the same number of leaves (8.0), sole CPH produced the highest (10.0) number of leaves, and the compost produced the highest (8.0) number of leaves at 5%, 10%, and 15% SEO contamination levels respectively (Table 4). In this study, the number of leaves significantly decreased in the test crop cultivated on SEO soil, and it can be clearly seen that these decreases were followed by successive increases in SEO intensity. This finding is in line with the report of [26], where a decrease in the number of the leaves of amaranth crop grown in SEO-contaminated soil was documented. The stem girths of all Amaranthus cruentus sown and measured in this study were significantly enhanced by all biostimulants employed (P < 0.05). Explicitly, at 2 WAS, compared with other organic amendments employed, sole CPH produced the best stem girths (0.9 and 1.2 cm) at 5% and 10% SEO contamination levels respectively, while both compost and sole CPH produced statistically similar stem girth (0.5 cm) at 15% SEO contamination level (Table 2). Compared with other organic amendments utilized in this study, the compost produced the best stem girth (1.4 cm) on both 5% and 15% SEO contamination levels, while sole CPH produced the best stem girth (2.4 cm) at 10% SEO contamination level at 4 WAS (Table 3). At 6 WAS, compared with other amendments, compost produced the best stem girth (2.6 cm) at 5% SEO contamination level, while sole CPH only produced the better stem girths (2.8 and 2.6 cm) at 10% and 15% SEO contamination levels respectively (Table 4). Generally, the growth performance of Amaranthus cruentus planted on the SEO-bioremediated soil in this study was poor. The results are in agreement with the report of [27] on the poor performance of horticultural crops planted in crude-oil-polluted farms compared to those planted in unpolluted farms. In this study, Amaranthus cruentus seeds sown on all the experimental pots used as control did not germinate at all. The inability of the seeds to germinate can be ascribed to their sensitivity to the residual effect of the SEO content still obtainable in the soil after the termination of the biodegradation experiment. This finding corroborates the report of [6] on the ability of petroleum hydrocarbons to institute soil sterility, thereby preventing seed germination, crop growth, and yield. Similar to the findings in this study, [28] have reported that the presence of petroleum
Effects of two bacterial inoculants and biostimulants on the growth…
9
hydrocarbons adversely affects the germination and growth of plants in soils. It has been reported by [29] that petroleum hydrocarbons affect the growth of plants by creating conditions which enable vital nutrients in the form nitrogen and oxygen required for plant growth unobtainable for utilization. The significant growth of Amaranthus cruentus observed with the bioremediated SEO-contaminated soil in this study is not unconnected with the bioremediating synergy attained by the bioenhancement formulations adopted. The significant results obtained on all measured agronomic parameters are in agreement with [15], who reported the ability of organic amendments in the reduction of adverse effects accruable from the presence of hydrocarbon-related pollution. A similar submission on the ability of organic amendments to enhance the growth parameters of Amaranthus cruentus significantly has been reported by [3]. As shown in this study, a similar observation made by [30] showed that the germination of seeds and the growth parameters of plants can be negatively affected by the deleterious effects of hydrocarbons. The significant growth parameters of Amaranthus cruentus recorded in this study could be credited to the supplementation of the SEO-contaminated soil with organic nutrients that aided significant bacterial reclamation of the contaminated soil. A similar submission was made by [31] on the ability of biostimulation and bioaugmentation to restore hydrocarbon-polluted soil, thereby attaining significant improvement in the growth of the test crops employed in their respective studies.
Conclusions The study revealed that SEO was significantly removed from the SEO-contaminated soil that was subjected to bioremediation technology compared to the control. The results obtained in the screen house experiment performed to evaluate the growth parameters, plant heights, number of leaves, and stem girths of Amaranthus cruentus, with a view to assessing a possible bacterial reclamation of the SEO-contaminated soil that had undergone bioremediation for 70 days, show that a significant performance was recorded compared with the experimental bags adopted as control, which recorded no germination of the sown Amaranthus cruentus seeds.
Recommendation Based on the results obtained in this study, the combination of bioaugmentation and biostimulation methods adopted for the reclamation of SEO-contaminated soil employed is hereby recommended for the clean-up of hydrocarbon-impacted environments.
10
Adeleye, Yerima, Nkereuwem, Onokebhagbe, Sadiq, Amoo, Raji
References [1] Saunder, R. A., Beciker, R. (1984), Amaranthus: A potential food and feed resource. In: Advanced Science Technology. Cereal Chemist. St Paul, MN. [2] Schippers, R. R. (2000), African indigenous vegetables. An overview of the cultivated species. Natural Resources Institute/ACP-EU Technical Centre for Agricultural and Rural Cooperation, Chatham, UK. [3] Law-Ogbomo, K. E., Ajayi, S. O. (2009), Growth and yield performance of Amaranthus cruentus influenced by planting density and poultry manure application. Notulae Botanicae Horti Agrobotanici Cluj-Napoca 37(1), 195– 199. [4] Mnkeni, A. P., Masika, P. Maphaha, M. (2007), Nutritional quality of vegetable and seed from different accessions of Amaranthus in South Africa. Water SA 33(3), 377–380. [5] Anoliefo, G. O., Vwioko, D. E. (2001), Tolerance of Chromolaena odorata (L) K. and R. grown in soil contamination with spent lubrication oil. Journal of Tropical Biosciences 1, 20–24. [6] Onwurah, I. N. E., Ogugua, V. N., Onyike, N. B., Ochonogor, A. E., Otitoju, O. F. (2007), Crude oil spills in the environment, effects and some innovative clean-up biotechnologies. International Journal of Environmental Research 1(4), 307–320. [7] Akinola, O., Udo, A. S., Okwok, N. (2004), Effect of crude oil (Bonny Light) on germination, early seedling growth and pigment content in maize (Zea mays L.). Journal of Science, Technology and Environment 4(1–2), 6–9. [8] Yerima, M. B., Agina, S. E., Zuru, A. A., Venil, K., Farouq, A. A., Maishanu, H. M., Shinkafi, A. L., Kashim, Z. A. (2011), Assessment of biostimulation using some organic wastes in bacterial reclamation of crude oil contaminated agricultural soil. Journal of Sustainable Development and Environmental Protection 1(1), 69–76. [9] Adeleye, A. O., Yerima, M. B., Nkereuwem, M. E., Onokebhagbe, V. O. (2017), Biostimulatory effects of organic nutrients on spent engine oil and hydrocarbon related soil pollution: A review. International Journal of Applied Research and Technology 6(7), 52–60. [10] Akpan, E. E., Ogboi, K. C., Nwadinigwe, C. A. (2013), Bioremediation of hydrocarbon polluted soil in the lowland forest ecosystem in the Niger Delta through enhanced natural attenuation process (ENAP). International Journal of Applied Science and Technology 3(8), 128–137. [11] Raji, M., Amoo, F. K., Adeleye, A. O., Amoo, A. O., Bate, G. B., Farouk, R. U. (2019), Isolation and screening of spent engine oil utilizing bacteria for the production of biosurfactants. FUPRE Journal of Scientific and Industrial Research 3(3), 12–23.
Effects of two bacterial inoculants and biostimulants on the growth…
11
[12] Britannica (2019), Dutse, Nigeria. Retrieved from: https://www.britannica. com/place/Dutse. Accessed on: 19 June 2019. [13] Adeleye, A. O., Onokebhagbe, V. O., Nkereuwem, M. E., Omeke, J. O., Yerima, M. B. (2019a), Isolation and identification of bacteria associated with the compost generated from cocoa pod husk and cow dung. FUPRE Journal of Scientific and Industrial Research 3(3), 1–11. [14] Adeleye, A. O., Yerima, M. B., Nkereuwem, M. E., Onokebhagbe, V. O., Shiaka, P. G., Amoo, F. K., Adam, I. K. (2019b), Effect of organic amendments on the decontamination potential of heavy metals by Staphylococcus aureus and Bacillus cereus in soil contaminated with spent engine oil. Novel Research in Microbiology Journal 3(5), 471–484. [15] Agbor, R. B., Ekpo, I. A., Kalu, S. E., Bassey, I. U., Okoi, E. P., Ude, E. O. (2015), Growth pattern of two crop species on bio-remediated hydrocarbon polluted soils. Academic Journals 10(2), 58–63. [16] Adeleye, A. O., Yerima, M. B. (2019), Isolation and identification of spent engine oil utilizing bacteria from Mechanic Village Dutse, Jigawa State. Paper presented at The 42nd Conference of the Nigerian Society for Microbiology. Crawford University, Igbesa, Ogun State. [17] Barrow, G. I., Feltham, R. K. A. (1993), Cowan and Steel’s manual for the identification of medical bacteria. Cambridge University Press, 3rd edition. 52– 101. Retrieved from: https://www.academia.edu/8106702/Cowan_and_Steels_ manual_for_the_identification_of_medical_bacteria_COWAN_AND_STEELS_ Manual_for_the_identification_of_medical_bacteria_THIRD_EDITION_ EDITED_AND_REVISED_BY. Accessed on: 2 July 2019. [18] Nelson, D. W., Sommers, L. E. (1996), Total carbon, organic carbon and organic matter. In: Sparks, D. L. (ed.), Methods of soil analysis, part 2. Madison: America Society of Agronomy. 961–1010. [19] Chapman, H. D. (1965), Cation exchange capacity. In: Black, C. A., Methods of Soil Analysis. Madison: Agronomy Journal. 891–901. [20] Reeuwijk, V. (1993), Procedures for soil analysis; Technical paper No. 9. Fourth Edition. International Soil Reference and Information Centre (ISRIC). [21] Bremmer, J. M. (1996), Nitrogen-total. In: Miller, A., Keeny, D., Methods of soil analysis. Madison, USA: American Society of Agronomy. 595–624. [22] Bouyoucous, G. (1962), Hydrometer method improved for making particle analyses of soils. Agronomy Journal 53, 464–465. [23] Soretire, A. A., Oshiobugie, A. A., Thanni, B. M., Balogun, S. A., Ewetola, J. M. (2017), Bioremediation of soil contaminated with crude oil using fresh and decomposed animal manure. Nigerian Journal of Biotechnology 34, 12–18. [24] Chorom, M., Sharifi, H. S., Motamedi, H. (2010), Bioremediation of a crude oil polluted soil by application of fertilizers. Iranian Journal of Environmental Health Science and Engineering 7(4), 319–326.
12
Adeleye, Yerima, Nkereuwem, Onokebhagbe, Sadiq, Amoo, Raji
[25] Onokebhagbe, O. V., Abdu, N., Santuraki, H. A. (2018), Residual effects of biochar on dry matter yield of grain amaranths (Amaranthus cruentus) grown on Alfisols of Nigerian Northern Guinea and Sudan Savanna agro-ecologies. Dutse Journal of Agriculture and Food Security (DUJAFS) 5(1), 97–108. [26] Nkereuwem, M. E., Edem, I. D., Fagbola, O. (2010), Bioremediation of oil polluted soils with organo-mineral fertilizer (OMF) and mexican sunflower (Tithonia diversifolia). Nigerian Journal of Agriculture, Food and Environment 6(1–2), 13–30. [27] Ojimba, T. P., Iyagba, A. G. (2012), Effects of crude oil pollution on horticultural crops in Rivers State, Nigeria. Global Journal of Science Frontier Research Agriculture and Biology 12(4), 37–43. [28] Agbogidi, O. M., Eruotor, P. G., Akparobi, S. O. (2007), Effects of time of application of crude oil to soil on the growth of maize (Zea mays L.). Research Journal of Environmental Toxicology 1, 116–123. [29] Adam, G., Duncan, H. J. (2002), Influence of diesel fuel on seed germination. Environmental Pollution 120: 363–370. [30] Inckot, R. C., Santos, G. D. O., de Souza, L. A., Bona, C. (2011), Germination and development of Mimosa pilulifera in petroleum-contaminated soil and bioremediated soil. Flora – Morphology. Distribution, Functional Ecology of Plants 206, 261–266. [31] Nwadinigwe, A. O., Onyeidu, E. G. (2012), Bioremediation of crude oil polluted soil using bacteria and poultry manure monitored through soybean productivity. Polish Journal of Environmental Studies 21(1), 171–176.
ACTA UNIVERSITATIS SAPIENTIAE AGRICULTURE AND ENVIRONMENT, 13 (2021) 13–22 DOI: 10.2478/ausae-2021-0002
Inadvertent implications of climate change for butterflies Rajesh GOPINATH,1* Aadarsa V. R. RAM,2 Ashok SENGUPTA3 1
Department of Civil Engineering & OIKOS (Eco-Club), BMS Institute of Technology and Management, Bengaluru, 560064, Karnataka, India; e-mail: dr.rajeshgopinathnair@gmail.com
2
Department of Computer Science, University of Hertfordshire, AL10 9AB, United Kingdom 3
KV No. 1 Jalahalli West, Bengaluru 560015, Karnataka, India
Manuscript received 20 January 2021; revised 11 March 2021; accepted 30 March 2021 Abstract: Climate change is one of the leading challenges of this century with an impending threat to wipe out more vital butterfly species than ever before. Climate shift has the potential to affect their life cycles, flight times, essential bio-interactions, and ultimately survival. As the first such study in India, this case study highlights the inferential discussion on the importance of butterflies in maintaining the earth’s fragile ecological balance and consequently the impact of climate change upon them with inadvertent implications. Due to the shifting climate, a number of butterfly species are now migrating to newer places in their search for comfortable temperature and availability of food, as the reduction/loss/change of habitat lowers the diversity of microclimates and availability of food plants for larvae and adult butterflies. Consequently, the butterflies become even more vulnerable to natural perturbations and susceptible to predators and local extinctions. Keywords: climate, survival, interactions, species, balance, ecological
1. Introduction Butterflies belong to the kingdom of Animalia, the phylum Anthropods, and the class Insecta. The anatomy of a butterfly consists of antennae, compound eyes, proboscis, six segmented legs, and sense organs [1, 2]. The families are mostly classified into Papilionidae (swallowtails), Nymphalidae (brush-footed), Pieridae (whites and yellows), Lycaenidae (blues), and Hesperiidae (skippers) [3, 4]. A butterfly has mainly 4 stages in its life cycle. The early stage is the egg stage, wherein they are the size of a pinhead and are mostly fixed to the leaf with an adhesive substance which hardens rapidly so that eggs can withstand the roughest winds and rains. This stage lasts for about
14
Gopinath, V. R. Ram, Sengupta
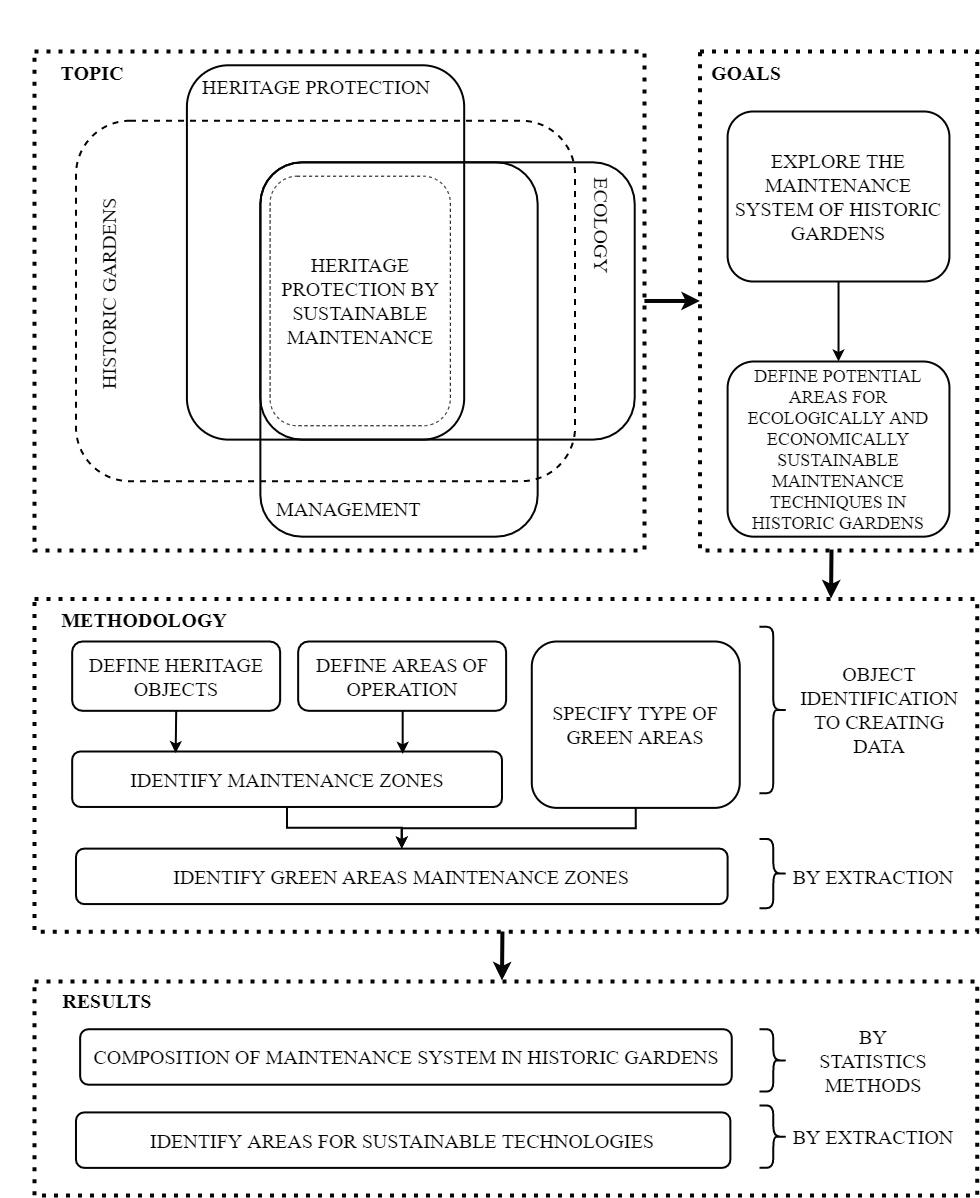
4 days, provided the weather conditions are favourable. The second stage is the caterpillar stage, wherein they first feed on their eggshells and then on the leaves, flower buds, and even fruits of the larval host plant [5]. This stage lasts for one to six weeks. Further, the caterpillar sheds its skin and gets transformed into the pupa, which is soft at first, and it later hardens, which process may last for one to six weeks. Thereafter, the caterpillar gets its wings and body parts and becomes an adult butterfly. In the last stage, the butterfly emerges with its wings which are wet, soft, and crumpled [6]. Compilations under Plate 1 and Plate 2 represent the various life stages for Common Jezebel (Delias eucharis) and Peacock Royal (Tajuria cippus) respectively.
Plate 1. Different life stages of Common Jezebel
Inadvertent implications of climate change for butterflies
15
Plate 2. Different life stages of Peacock Royal Once emerged, the butterflies fly to find nectar, mate, and continue their lifecycle. This is very commonly observed in Indian Peacock Royal (Tajuria cippus – Plate 3) and Gaudy Baron (Euthalia aconthea – Plate 4). While most butterflies, such as Common Jay (Graphium doson – Plate 5), feed on nectars, certain other butterfly species, such as Crimson Rose (Pachliopta hector – Plate 6) or Common Jezebel (Plate 7), also feed on tree sap, dung, pollen, and rotting fruit. Field visits even confirm that the families of Rajahs and Nawabs, including Common Nawab (Polyura athamas – Plate 8) and Black Rajah (Charaxes solon – Plate 9), also feed on dead and decaying prawns and crabs, while certain other species, such as Metallic Cerulean (Jamides alecto – Plate 10), are attracted to bird droppings, sweat, and blood [7]. To satisfy their need for sodium, butterflies, such as Common Lime (Papilio demoleus – Plate 11), are often seen together feeding on small puddles on the ground or wet areas on leaves and plants [7].
16
Gopinath, V. R. Ram, Sengupta
Plate 3. Indian Peacock Royal
Plate 4. Gaudy Baron
Plate 5. Common Jay
Plate 6. Crimson Rose
Plate 7. Common Jezebel
Plate 8. Common Nawab
Plate 9. Black Rajah
Plate 10. Metallic Cerulean
Plate 11. Common Lime
Plate 12. Cruiser
Plate 13. Adonis Blue*
Plate 14. Silver-spotted Skipper*
Inadvertent implications of climate change for butterflies
Plate 15. Brown Argus*
Plate 16. Monarch*
17
Plate 17. Variable Checkerspot*
Butterflies are known to perform various ecological functions, including effective pest control and pollination. For instance, cruisers (Vindula arsinoe – Plate 12) provide assistance for genetic variations in the plant species as they collect nectar from a variety of plant species as they travel over long distances. This helps the plants fight against diseases and gives them a better survival chance. Hence, the depreciation of butterfly biodiversity can subsequently impact the natural environment, wherein their presence suggests a vital and healthy ecosystem, and their absence indicates a serious decline of the ecosystem. For example, their action of shifting bases or their absence can result in an upslope movement of the flora and also in time-lag scenarios, as floral species migrate comparatively slower, consequently resulting in the decline of their population. The limited dispersal ability, larval food plant specialization, and close reliance on weather and climate make many butterfly species sensitive to fine-scale changes [8]. This is a vicious cycle, as the scarcity of plant resources (host and larval plants) can lead to loss of species due to territorial conflicts. Sparsely available literature on research conducted outside India highlighted the impact of climate change on various aspects (feeding habits, distribution, etc.) at large spatial scales with regard to butterflies such as Adonis Blue (Polyommatus bellargus – Plate 13), Silver-Spotted Skipper (Hesperia comma – Plate 14), Brown Argus (Aricia artaxerxes – Plate 15), Monarch (Danaus plexippus – Plate 16), and Variable Checkerspot (Aricia agestis – Plate 17). Temperature as a parameter was found to be an important factor for all these species on account of shifting to higher latitudes and elevations. While Adonis Blue showed variation in its associations with different grassland habitats according to seasonal variations in weather [9], the SilverSpotted Skipper expanded the range of locations where it lays its eggs in response to increased ambient temperatures, and it colonizes in the cooler regions [10]. Brown Argus butterflies, a British butterfly species, have already made climate change history by becoming the first known animal of any kind to lose the ability to eat one of two plants in their diet and lay eggs in a climate-related move, as global warming forced them to move to a new environment and adapt their behaviour [11].
18
Gopinath, V. R. Ram, Sengupta
While climate change is also a potential threat to the annual migration pattern of the Monarch butterfly by affecting weather conditions in both wintering grounds and summer [12], Variable Checkerspot, due to the mismatched timing with their caterpillar host plants, is directly threatened by climate change and thus habitat destruction due to the butterfly’s sensitive reliance on meadows [13]. In contrast with the above cited foreign literature, Indian studies highlighting impact of climate change have focussed less upon distribution patterns and habitat associations of butterflies [14, 15, 16]. The present study attempts to fill this gap in the literature by analysing the basic feeding/migratory/survival behaviour of a few common species of butterflies and the subsequent implications on account of the climate change phenomenon. The research methodology included primary data collection. This was achieved by undertaking monitoring at Butterfly Parks in Kendriya Vidyalaya No. 1, Bannerghatta National Park, and Sammilan Shetty’s Belvai Butterfly Park. The exercise was also extended while carrying out surveys at Arkavathi RF, Shendurney WS, Munnar WS, Namdapha NP, Hessaraghatta Grasslands, Horagina Betta Peak, Jnana Bharathi Campus, and GKVK. Further, credible secondary data was also referred.
2. Observations and inferences Blue Tigers (Tirumala limniace – Plate 18) and Dark Blue Tigers (Tirumala septentrionis – Plate 19), known to roost and migrate extensively during the monsoons in southern India, sometimes travel longer distances to and from areas which are only suitable at certain times of the year. By doing so, they try to avoid unfavourable circumstances, including extreme weather, food shortage, or overpopulation. They breed in the mountains, and the progeny migrate back to the plains following the monsoon season [17]. It is understood that this species is trying to avoid heavy rainfall so as to facilitate breeding. Under these circumstances, it is important to realize that climate change is bringing about unpredictable bursts of intense rainfalls and erratic behaviour, also in terms of approach and delays. This may have a significant impact on butterflies during migration, alter migratory routes, disturb breeding grounds, and wash out or destroy eggs. Common Emigrant (Catopsilia Pomona – Plate 20) and Common Albatross (Appias albina – Plate 21), known to have strong migratory habits, can be seen flying in dozens, mud-puddling, travelling up and down the rivers (migration corridors), linking their high and low elevation breeding sites. During these migrations, both sexes, but especially the male, can be observed puddling in large groups on sunlit river banks and sandbars, where they settle for long periods to imbibe mineralized moisture [18]. In this context, it is important to realize that climate change has a significant impact on the flow patterns of rivers, resulting in both extreme cases, i.e. drying up of river beds and flooding.
Inadvertent implications of climate change for butterflies
19
Plate 18. Blue Tiger roosting
Plate 19. Dark Blue Tiger
Plate 20. Common Emigrant
Plate 21. Common Albatross
Plate 22. Common Crow
Plate 23. Orange-tip
Plate 24. Common Palmfly
Plate 25. Common Rose
Plate 26. Red Admiral
Both of these physical transformations can have disastrous consequences for butterflies. While drying can result in loss of the natural migratory path, greater threat of predators, and natural competition along newer migratory routes, flooding can lead to the destruction of banks that otherwise would have served as puddling grounds rich in minerals. During summer, adult Common Crows (Euploea core – Plate 22) live for about 1-2 months, but a Crow butterfly that has overwintered can live as long as 9 months. While overwintering, these butterflies are in a state of reproductive dormancy, and their life is on hold as they do not eat or drink very much; and the fat content of their bodies declines steadily from around 18-25% for over about a month. Also,
20
Gopinath, V. R. Ram, Sengupta
despite the fact that they are all together in one spot, they do not breed during the aggregation [19]. Even after reaching Sahyadri, they continue to remain in reproductive diapause for the first few weeks before mating [20]. This behaviour of a very commonly found butterfly such as Common Crow proves that, as an indicator of climate change, they themselves are extremely sensitive to even the minute changes in the environment. Under these circumstances, it is important to realize that climate change presents unexpected, untimely, and sometimes prolonged climatic alterations; and these potentially have the power to wipe out rare or endangered species among butterflies which may fail to keep up. Also, prolonged reproductive diapause and timings can become complicated based on climate-dependent aspects such as availability of mates, host and larval plants. Orange-tip Butterflies (Anthocharis cardamines – Plate 23) are high-altitude butterflies, which are known to move to places more suitable to them. This is because climate change holds the potential to introduce the total transformation of any location’s microclimate, which can result not only in the loss of breeding grounds but also in the permanent shifting of base of butterflies. This change of bases can also directly impact the floral population, as butterflies are also pollinators, eventually resulting in the denudation of soil or the loss of a specific plant species, which, in turn, can result in the loss of a potential host plant or larvae plant for this particular as well as some other butterfly species. If Common Palmfly (Elymnias hypermnestra – Plate 24) and Common Rose (Pachliopta aristolochiae – Plate 25), which is a major pollinator of both wild and cultivated plants at higher altitudes, migrate completely or become extinct, then a significant decline in viable seed production may occur. Red Admirals (Vanessa atalanta – Plate 26), which generally prefer warmer climate, now are seen to regularly migrate due to increasingly non-favourable conditions [11]. This is because climate change has apparently altered the seasons in terms of their occurrence, arrival, and ending time. Consequently, most species started to appear progressively earlier in the year; hence, this leads to a chaotic feeding pattern followed by usual and newer predators, which can wipe out entire species on account of prey scarcity. Birds plan their whole breeding season around when caterpillars will be most abundant. If butterfly and caterpillar numbers are depleted, there will be no sufficient food for birds, and plants would be affected because of the reduced numbers of birds to pollinate them. Also, butterflies are essentially prey for several other species in the food chain, such as crab spider (Plate 27) or robber fly (Plate 28), which solely depend on them. In this context, as the populations of butterflies diminish, predator populations decrease as well, alongside the essential ecological functions they perform [21].
Inadvertent implications of climate change for butterflies
Plate 27. Crab spider’s prey
21
Plate 28. Robberfly’s prey
4. Conclusions A prime concern is that different species of butterflies respond to climate change differently, and also within the same species the responses will be manipulated by the characteristics of the location. This will lead to territorial conflicts and inter-/ intraspecific competition behaviours. Several butterfly species have ceased to be spotted in Bangalore proper, and this subsequently has impacted essential ecological functions, thereby impairing ecological balance. The present research urges increased awareness in conservation plans and guidelines for common, rare, and endangered species among butterflies.
Acknowledgement/Disclaimer The photographs (*Plates 13–17) were secured from Google Images, for which the authors wish to extend their humble gratitude for using the non-copyrighted photographs. All the remaining photographs have been snapped by the authors during their course of study on the field.
References [1] Roger, L. H., Dell, Dennis, Sparks, Tim (2005), Climate change and the effect of increasing spring temperatures on emergence dates of the butterfly Apatura iris (Lepidoptera: Nymphalidae). European Journal of Entomology 102(2), 161–167. DOI: 10.14411/eje.2005.026. [2] Rajesh, Gopinath, Aadarsa V. R., Ram et al. (2016), CCCV & counting: Handbook on flora and fauna of Acharya Institutes. [3] Nelson, Rodrigues (2012), Butterflies of Mumbai. MMR Environment Improvement Society. [4] Kehimkar, Isaac (2016), BNHS field guide Butterflies of India. BNHS.
22
Gopinath, V. R. Ram, Sengupta
[5] Gunathilagaraj, K., Perumal, T. N. A., Jayaram, K., Ganesh Kumar, M. (1998), South Indian Butterflies. Nilgiri Wildlife and Environment Association. [6] www.learnaboutbutterflies.com. [7] Kunte, K. (2006), Species composition, sex-ratio and movement patterns in danaine butterfly migrations in southern India. Journal of Bombay Natural History Society 102, 280–286. [8] www.ukbms.org. [9] Parker, Janet (2000), Butterflies take a winter break. ABC Science. Available at: www.abc.net.au/science/articles/2000/07/20/2689015.htm. [10] Oliver, Tom H., Thomas, Chris D., Hill, Jane K., Brereton, Tom, Roy, David B. (2012), Habitat associations of thermophilous butterflies are reduced despite climatic warming. Global Change Biology 18(9), 2720–2729. https://doi.or g/10.1111/j.1365-2486.2012.02737. [11] https://www.independent.co.uk/environment/the-butterfly-effect-climatechange-forced-species-to-adapt-9679477.html. [12] Swarms of butterflies descend on park. The Hindu 25 March 2013. Bengaluru ed. [13] Pateman, Rachel M. et al. (2012), Temperature-dependent alterations in host use drive rapid range expansion in a butterfly. Science AAAS, Science 25, 336(6084), 1028–1030. DOI: 10.1126/science.1216980 [14] Rajesh, Gopinath et al. (2020), Real-time isohume mapping for cool and warm humidity isles of Bengaluru city. Present Environment and Sustainable Development 14(1), 265–275. DOI: https://doi.org/10.15551/pesd2020141021. [15] Vrinda, T., Gopinath, R. (2018), Artificial neural network trained ‘simultaneous extent analysis’ as a logical tool in computation of urban heat island intensity. Science and Technology Asia 23(4), 18–22. DOI: https://doi.org/10.14456/ scitechasia.2018.28. [16] Rajesh, G. et al. (2017), Real-time thermal mapping for heat & cool archipelagos of Bengaluru, India. Civil and Environmental Engineering 13(2), 106–111. DOI: https://doi.org/10.1515/cee-2017-0014. [17] www.innthewild.com/blog/wildlife-blog/the-great-migration-of-the-bluetigers/. [18] Krushnamegh, Kunte (2000), India, a lifescape: Butterflies of Peninsular India. University Press (India) Private Limited, Academy of Sciences. [19] www.biodiversitylab.org/butterfly-migrations. [20] www.fws.gov/southwest/es/newmexico/documents/smcb_final_11_1_05. pdf. [21] Gaurav, J., Karthik, K. A., Aftab, J. B., Gopinath, R. (2021), Impact of chaotic urbanisation on Bengaluru’s (India) urban avian diversity. Transylvanian Review of Systematical and Ecological Research – The Wetlands Diversity 23(1), 81–94. DOI: https://doi.org/10.2478/trser-2021-0007.
ACTA UNIVERSITATIS SAPIENTIAE AGRICULTURE AND ENVIRONMENT, 13 (2021) 23–35 DOI: 10.2478/ausae-2021-0003
Insecticide efficacy on ticks (Dermacentor spp.) – Case study from an infested territory in Transylvania, Romania Artúr Botond CSORBA,1 Barna PUTNOKY-CSICSÓ,2 Antal DEMETER,2 Imre-István NYÁRÁDI,2 János BÁLINT2 1
Doctoral School in Biology and Sport Biology, University of Pécs, Faculty of Sciences Ifjúság útja 6.; e-mail: csorba.artur@ms.sapientia.ro 2
Sapientia Hungarian University of Transylvania (Cluj-Napoca, Romania), Department of Horticulture, Faculty of Technical and Human Sciences, Târgu-Mureş; e-mail: balintjanos@ms.sapientia.ro Manuscript received 12 February 2021; revised 25 March 2021; accepted 15 April 2021 Abstract: Ticks can be a major concern for humans and animals alike through the transmission of various viral and bacterial diseases. Ticks have also developed tolerance to several active compounds due to intensive insecticide treatments. The excess use of insecticides against ticks worldwide is mostly environmental contamination rather than effective control. Thus, information about the useful chemicals is essential. Dermacentor marginatus and Dermacentor reticulatus individuals were tested, being collected in Transylvania, near the city of Târgu-Mureş, Romania. The experiment was performed under laboratory conditions in two replicates, using a total of 420 ticks and 19 insecticides. The best results were achieved with alpha-cypermethrin and pyrethrin. Keywords: infestation, tolerance, pyrethroids, organophosphates, disease
1. Introduction Ticks are highly specialized, obligate, ectoparasitic arthropods [1]. Ticks feed on the blood of terrestrial mammals, birds, and reptiles, and they can introduce pathogens into the host. The adult female begins to lay eggs after several days of feeding (6–12 days). Depending on the species, it lays 1,000–18,000 eggs [2]. They can travel several kilometres on their host and can reach other continents too on migratory bird species [3]. Many new diseases are transmitted by arthropod vectors. Mosquitoes spread malaria, dengue-dengue fever, and yellow fever [4], [5], sand flies transmit
24
Csorba, Putnoky-Csicsó, Demeter, Nyárádi, Bálint
leishmaniasis [6], ticks transmit Lyme disease, ehrlichiosis [7], [8], babesiosis, or anaplasmosis [9]. Tick-borne diseases are an important cause of losses to the livestock industry. Worldwide losses due to ticks and controlling them have been estimated at several billion dollars annually [10]. The main problem is the transmission of a wide spectrum of pathogenic microorganisms [10]. In some regions, Dermacentor spp. are important vectors of bovine anaplasmosis and babesiosis. There are several species that play an important role in human medicine as vectors of rickettsial diseases such as the European canine babesiosis [10]. The first case was reported in Croatia in 1957 [11]. The most common symptoms are high fever, headache, vomiting, and diarrhoea. Older people may also have more severe symptoms such as kidney failure and, ultimately, death [12]. Insecticide tolerance has been detected in many major vector species, and the list is constantly expanding. Resistant or tolerant populations have also been reported in several tick species [13]. Insecticide tolerance has a biochemical basis, and two main forms are known: target-site tolerance, in which case the insecticide is no longer able to bind to the binding spot because it changes, and enzyme-based (metabolic) tolerance, which occurs when oxidases or esterases show increased activity and prevent the activation of the active substances [13]. These esterases contain six families of proteins belonging to the α/β-hydrolase superfamily [14]. The term multiple tolerance is used when pests can tolerate two or more insecticides with significantly different modes of action [15]. Experiments in Mexico have shown that the Rhipicephalus microplus tick has developed multiple tolerance to widely used organophosphates and pyrethroids [15]. A study in Queensland, Australia, showed that 5 treatments per season is already a risk factor for acaricide tolerance [16]. Researchers in Argentina reported similar results. Cattle ticks have developed tolerance to pyrethroids and organophosphates [17]. It is also important to mention the mode of action of insecticides. Organophosphates belonged to the first group of chemical compounds, which were also used against arachnids. They are inhibiting the enzyme acetylcholinesterase [18]. Decreases in sensitivity to the organophosphates used were recorded in the early 1950s, and today ticks have developed tolerance against 30 organophosphates in 40 countries [19]. Pyrethrins are produced from Chrysanthemum cinerariaefolium and C. coccineum, and a limitation in their application was that they decomposed to UV light and oxidation [20]. As a result, synthetic but more stable pyrethroids were produced. Their mode of action is exerted by blocking the permeability of Na+-ion channels, creating a permanent stimulus [20]. In the case of neonicotinoids, the mechanism of action is mediated by the inhibition of acetylcholine binding to the receptor [21]. Excess use of insecticide against ticks is widely practised worldwide and is mostly environmental contamination rather than effective control. Thus, information about the useful chemicals is essential to reduce environmental pollution.
Insecticide efficacy on ticks (Dermacentor spp.)…
25
Model species: The most common species in Romania belong to the Ixodidae and Argasidae families [22]. By integrating the literature data with those derived from personal investigations, the authors present the distribution of the 27 tick species (25 ixodids and 2 argasids). In our experiment, two members of the Ixodidae family, namely Dermacentor marginatus and Dermacentor reticulatus, were used. The Eurasian Dermacentor tick species, Dermacentor marginatus (Sulzer, 1776) and Dermacentor reticulatus (Fabricius, 1794), are extremely common in Europe [23]. Dermacentor reticulatus is the second most common tick in Central Europe after Ixodes [24]. It is more present in the cooler zones. Its geographical location shows almost the same range as Dermacentor marginatus, from northern Portugal through Kazakhstan to western Siberia, but generally further north than Dermacentor marginatus [25]. In Hungary, they occur on xerophilic plants located near oak forests [26]. Dermacentor marginatus lives on steppes, alpine pastures, forest clearings, and semi-desert areas. In Germany, it particularly prefers open meadows, while in Italy it prefers open oak forests and dry meadows. It is found in the south of France from sea level up to 960 meters above sea level [27]. Objectives: Our first aim was to get a more accurate picture of the insecticide tolerance of tick populations (Dermacentor marginatus and Dermacentor reticulatus) collected from one of the most infected regions in Transylvania, near Târgu-Mureş city, Romania. We consider that the tick population from this region can reasonably characterize the potential insecticide tolerance of the entire tick population in the Carpathian Basin. The major objectives were therefore to detect the most efficient chemicals and provide an effective control method to reduce excess chemical use in the environment.
2. Materials and methods 2.1. Study area The sampling procedure took place in an area of more than 10 hectares of agricultural land, orchards, herb, vegetable garden as well as ornamental garden, all belonging to the university campus. The area is bounded on the west by forests and is located near the main international road.
2.2. Field collections of ticks and insecticide tolerance experiment The collected individuals were Dermacentor marginatus and Dermacentor reticulatus adults from different points of the infested territory. During the collection, approximately 420 individuals were collected. The GPS coordinates are 46° 31’ 19.4988’’ N 24° 36’ 0.4428’’ E. The sample collection point is marked with a red arrow.
26
Csorba, Putnoky-Csicsó, Demeter, Nyárádi, Bálint
The planned concentration for each insecticide was measured, as shown in Table 1. Two replicates were followed for each treatment. We used a total of 42 Petri dishes, two of which were used as control, where the treatment was pure water. We put randomly 10 individuals in each Petri dish and sprayed them with insecticides from the same distance. As no significant differences in mortality rate between the two species were detected, we presented the results together. Treatments were added until the substance formed a film surface on the tick bodies. This is a similar effect as when a normal in-field treatment is planned. Table 1. Insecticides and concentration levels used in treatments Mode of action Acetylcholinesterase (AChE) inhibitors
Sodium channel modulators
Nicotinic acetylcholine receptor (nAChR) competitive modulators Glutamate-gated chloride channel (GluCl) allosteric modulators
Active substance
Used conc. mg/l (act. subs.)
dimethoate pirimiphos-methyl
Commercial name Danadim Progress
1,000
Actellic 50 EC
alpha-cypermethrin
50
Fastac 10 EC
delthametrin
25
Decis Mega 50 EW
lambda-cyhalothrin
50
Karate Zeon 50 CS
pyrethrin
20
Pestanal
acetamiprid
100
Mospilan 20 SG
clotiniadin
250
Dantop 50 WG
imidacloprid
200
Nuprid 200 SC
thiacloprid
240
Calypso 480 SC
thiamethoxam
125
Actara 25 WG
9
Vertimec 1.8 EC
milbemectin
10
Milbeknock EC
Voltage-dependent sodium channel blockers
indoxacarb
150
Steward 30 DF
Mite growth inhibitors affecting CHS1
hexythiazox
50
Nissorun 10 WP
Mitochondrial complex III electron transport inhibitors
bifenazate
120
Floramite 240 SC
fenazaquin
200
Magus 200 SC
fenpyroximate
100
Ortus 5 SC
pyridaben
300
Sanmite 20 WP
Mitochondrial complex I electron transport inhibitors
abamectin
Insecticide efficacy on ticks (Dermacentor spp.)…
27
One minute after the treatment, the individuals were examined separately, and this was repeated in every 15 minutes for one hour, and after that in every hour. Observations were made once after 24 hours and again after 1 week. It was previously detected concerning this mechanism that the gnathostome remained open in a V-shaped form for all dead individuals in all cases. We believe that this can be a method to detect mortality; however, no parallel action was detected for these individuals either – they all were considered dead.
2.3. Data analysis Data were analysed with PASW Statistics 18, release version 18.0.0 (29 June 2012). The original data normality was not met; therefore, the non-parametric Mann–Whitney U tests was used to compare the treatments. Means with different letters in diagrams represent statistically significant differences. Values were considered to be significantly different at p < 0.05.
3. Results and discussions 3.1. Efficacy of pyrethroids The treatment with the natural pyrethrin had an effective knock-down effect against ticks (Figure 1). After one minute, 30% of the individuals were dead, and after 15 minutes the mortality rate reached over 80%.
a
Survival rate (%)
100% 80%
a
Alive (treated)
a
a
a
a
a
Alive (control)
a
a
a
a
b
60% 40%
b
20% 0% 1'
15'
b
b
b
b
b
30'
45' 1 h 2 h 3 h Time after treatment
b
b
b
b
4h
5h
24 h
1 week
Note: the different letters mean statistically significant differences.
Figure 1. Efficacy of pyrethrin on tick adults (Mann–Whitney test: p < 0.05) The best effect was obtained with alpha-cypermethrin (Figure 2), which killed all individuals after 30 minutes. Deltamethrin and lambda-cyhalothrin treatment produced similarly good results; after 1 hour, the mortality rate was 100%.
28
Csorba, Putnoky-Csicsó, Demeter, Nyárádi, Bálint
Survival rate (%)
100%
aa
Alive (treated)
a
a
a
a
a
a
Alive (control)
a
a
a
a
80% 60% 40% 20% 0% 1'
b
b
b
b
b
b
b
15'
30'
45' 1 h 2 h 3 h 4 h Time after treatment
b
b
b
5h
24 h
1 week
Note: the different letters mean statistically significant differences. Figure 2. Efficacy of alpha-cypermethrin on tick adults (Mann–Whitney test: p < 0.05)
3.2. Efficacy of organophosphates Significant difference was found between pirimiphos-methyl treatment and the control (Figure 3). After 3 hours, 10% of the individuals were dead, in 4 hours the mortality rate reached 20%, and after 5 hours half of the adults were dead. 24 hours after the application of insecticides, the mortality rate was 80% and 20% of the individuals showed weak signs of life. After 1 week, the mortality rate reached 100%. The treatment with dimethoate yielded similar results, with the difference that the first individuals died just after 24 hrs, and no live individuals were found after 1 week. Alive (treated)
Survival rate (%)
100%
aa aa aa aa aa aa
a a
80%
Alive (control)
a
a
a
a
b b
60% 40% 20% 0% 1'
15'
30'
45' 1 h 2 h 3 h Time after treatment
4h
5h
b
b
24 h
1 week
Note: the different letters mean statistically significant differences.
Figure 3. Efficacy of pirimiphos-methyl on tick adults (Mann–Whitney test: p < 0.05)
Insecticide efficacy on ticks (Dermacentor spp.)…
29
3.3. Efficacy of neonicotinoids Imidacloprid and acetamiprid had no effect on ticks, all individuals were alive after one week. The active substance clothianidin was also ineffective against ticks – after 1 week, a single death was observed. The third member in this chemical group was thiamethoxam, which proved to be completely ineffective, and no dead individuals were found after 1 week, and the last member of the group was thiacloprid. In this one case, the treatment was effective against ticks (Figure 4). After 1 hour of treatment, 100% of the individuals showed weak signs of life, and after 1 week the mortality rate reached 20%. Alive (treated)
Mortality rate (%)
100%
aa aa aa aa aa
a
a
Alive (control)
a
a
a
a
80% 60% 40% 20%
b
0% 1'
15'
30'
b
45' 1 h 2 h 3 h Time after treatment
b
b
b
b
4h
5h
24 h
1 week
Note: the different letters mean statistically significant differences.
Figure 4. Efficacy of thiacloprid on tick adults (Mann–Whitney test: p < 0.05)
3.4. The efficacy of avermectins Both abamectin and milbemectin treatments have been shown to be ineffective against ticks. In the case of abamectin treatment, all individuals were alive after 1 week, and in the case of milbemectin treatment, the mortality rate was around 10% after 1 week.
3.5. The efficacy of acaricides The acaricides used in the experiment were not effective enough either. The active substances fenazaquin and hexithiazox were ineffective on ticks, and we did not find any dead individual after 1 week. The treatment with piridaben was not effective, as the individuals were alive after a week. In the case of bifenazate and fenpyroximate (Figure 5) treatments, dead individuals were found after 24 hours, but the mortality rate was around 60%, and all of the individuals died just after a week.
30
Csorba, Putnoky-Csicsó, Demeter, Nyárádi, Bálint Alive (treated)
Survival rate (%)
100%
Alive (control)
aa ba ba ba ba ba ba aa aa
a
a
80% 60%
b
40% 20%
b
0% 1'
15'
30'
45' 1 h 2 h 3 h 4 h Time after treatment
5h
24 h
1 week
Note: the different letters mean statistically significant differences.
Figure 5. Efficacy of fenpyroximate on tick adults (Mann–Whitney test: p < 0.05)
3.6. The efficacy of oxadiazine The treatment with indoxacarb had no effect against ticks: the mortality rate remained 0% after a week. Tick control in the infected area has been performed with pirimiphos-methyl for the last 3 years. In the first two years, population control was relatively successful, but in the third year the treatment proved unsuccessful, so we decided to collect individuals and investigate the effects of marketed insecticides on the collected individuals. According to these, a specific substance commercialized against ticks (pirimiphos-methyl) was less effective with time, generating a low mortality rate of ticks. As several other insecticides are commercialized as having acaricide effects too, and other acaricides might also have weaker effect, testing these substances to give a clear picture about their effects is extremely important. Previous similar studies from Mexico and Argentina indicated that natural populations of Rhipicephalus microplus (Canestrini, 1888) were found to be tolerant to a number of pyrethroids [15], [17]. Another study from Brazil showed that 578 tick larvae were tested for pyrethroids, and 97.44% of them were tolerant to the treatment [18]. However, in our region, we got the best results with pyrethroids. Alpha-cypermethrin and pyrethrin (after 1 h: 100% death or weak signs of life) yielded the best results. 80% of the individuals died after the pyrethrin treatment within 15 minutes. We found significant differences between the treatments and the control. The mortality rate reached 100% after 15 minutes with the alphacypermethrin treatment. Deltamethrin also had a good effect because all the ticks were dead after 1 hour of the application. In the case of organophosphates, there are several studies where the tolerance has been well described. Two different strains of Bophilus were used in the U.S.A. [28]. In the first case, a large number of female adults survived the dip treatment and produced viable offspring. In the second case, similar results were obtained,
Insecticide efficacy on ticks (Dermacentor spp.)…
31
but the tolerance ratio was higher, and the female adults were able to produce viable offspring [28]. The treatments with dimethoate were not effective because the individuals were dead just after 1 day of treatment. In the case of pirimiphosmethyl, 10% of the individuals were dead after 3 hours, the mortality rate reached 20% in 4 hours, and half of the adults were dead after 5 hours. After 24 hours, the mortality rate was 80%, and 20% of the individuals showed weak signs of life. After nearly two decades of use, several target pests of neonicotinoids have begun to develop tolerance [29]. In our experiment, the treatments with neonicotinoids, with the exception of clothianidin, were totally ineffective against the ticks. The mortality rate was near 60% upon the clothianidin treatment, but only after 1 week of the treatment. Because of the intensive use of the macrocyclic lactones, partial tolerance has been reported in R. microplus in different regions [30]. The exact mechanism is still unknown, but some studies [31] concluded that tolerance in ticks might be due to target-site insensitivity. We obtained almost the same results in our experiment. The avermectins (abamectin, milbemectin) were ineffective because 100% of the individuals were alive after one day of the application. In the European Union, indoxacarb is approved as a topical spot-on flea control product for dogs and cats, and, in combination with permethrin, as a topical spot-on flea and tick control for dogs [32]. In our experiment, we used Steward 30 DF with indoxacarb as active compound, but it had no effect against ticks – the mortality rate remained 0% after a week. As ticks age, they become increasingly susceptible to acaricides [33]. But populations of several tick species in tropical and subtropical countries have developed high tolerance to compounds due to the high intensity of their use in tick management [34], [35]. The treatments with acaricides contradicted our expectations. Among these, fenpyroximate killed 50% of the individuals, but only 1 day after the treatment; the other compounds were ineffective, and the ticks were highly tolerant to treatments. Altogether, the tolerance mechanisms seem to have both a genetic and a behavioural background. From a genetic point of view, ticks can develop a tolerance if a compound is widely used, and these mechanisms can be passed on to the next generations too. From a behavioural point of view (which can be in fact combined with genetic tolerance as well), ticks can move or can be moved artificially and/or accidentally between regions. Several populations with different genetic backgrounds can be mixed in this way, increasing tolerance mechanisms and their spread in the population. Considering these effects, a continuous test of commercialized insecticides and acaricides needs to be made periodically. Insecticides that showed an effect only after 24 hours or a few days did not prove to be effective because we cannot produce this maximum contact effect
32
Csorba, Putnoky-Csicsó, Demeter, Nyárádi, Bálint
under natural conditions but only under laboratory conditions. These wisely used chemicals are not recommended against ticks, as it will only result in high levels of environmental contamination. Based on our results, the treatments with alpha-cypermethrin, pyrethrin, and other pyrethroids could have a good effect against Dermacentor species. We do not recommend other chemicals for tick control.
4. Conclusions In conclusion, Dermancentor marginatus and Dermancentor reticulatus species collected from the campus of Sapientia Hungarian University of Transylvania showed a high degree of tolerance to the majority of the 19 insecticides we tested. Considering the treatments, we can conclude that pyrethroid treatments (alphacypermethrin, deltamethrin, lambda-cyhalothrin, pyrethrin) were effective against ticks, whereas neonicotinoids, avermectins, and even acaricide treatments were almost completely ineffective. The desired effect was not achieved with the organophosphates either, so it can be concluded that the two Dermacentor species involved in the treatments have developed a high degree of tolerance in recent years. We should mention the importance of insecticide rotation, more likely the usage of insecticides with different modes of action to reduce and slow down tolerance development and reduce excessive chemical use.
Acknowledgments This work was supported by Sapientia Hungarian University of Transylvania, Faculty of Technical and Human Sciences. The authors would like to express their special thanks to Csaba Miklós and Róbert Koncz for their assistance provided in the collection of the individuals and for their help in the experiment.
References [1] Anderson, J. F., Magnarelli, L. A. (2008), Biology of ticks. Infectious Disease Clinics of North America 22(2), 195–215. DOI: 10.1016/j.idc.2007.12.006. [2] Ginsberg, H. S., Stafford, K. C. (2014), Management of ticks and tick-borne diseases. In: Goodman, J. L., Dennis, D. T., Sonenshine, D. E. (eds.), Tickborne diseases of humans. Washington, DC, USA: ASM Press. 65–86. DOI: 10.1128/9781555816490.ch4. [3] Service, M. W. (2012), Medical entomology for students, 5th ed. Cambridge: Cambridge University Press.
Insecticide efficacy on ticks (Dermacentor spp.)…
33
[4] Krostad, D. J. (1996), Malaria as a reemerging disease. Epidemiologic Reviews 18(1), 77–89. DOI: 10.1093/oxfordjournals.epirev.a017918. [5] Gubler, D. J., Clark, G. G. (1995), Dengue/dengue hemorrhagic fever: The emergence of a global health problem. Emerging Infectious Diseases 1(2), 55–57. DOI: 10.3201/eid0102.952004. [6] Meslin, F.-X. (1997), Global aspects of emerging and potential zoonoses: A WHO perspective. Emerging Infectious Diseases 3(2), 223–228. DOI: 10.3201/eid0302.970220. [7] Daniels, T. (1997), Deer ticks (Ixodes scapularis) and the agents of lyme disease and human granulocytic ehrlichiosis in a New York city park. Emerging Infectious Diseases 3(3), 353–355. DOI: 10.3201/eid0303.970312. [8] Walker, D. H., Dumler, J. S. (1996), Emergence of the ehrlichioses as human health problems. Emerging Infectious Diseases 2(1), 18–29. DOI: 10.3201/ eid0201.960102. [9] Alim, A., Das, S., Roy, K., Sikder, M. S., Hassan, M. M., Siddiki, A. Z., Hossain, M. A. et al. (2012), Prevalence of hemoprotozoan diseases in cattle population of Chittagong division, Bangladesh. Pakistan Veterinary Journal 32(2): 221–224. [10] Jongejan, F., Uilenberg, G. (1994), Ticks and control methods: -EN- -FR- -ES-. Rev. Sci. Tech. OIE 13(4), 1201–1226. DOI: 10.20506/rst.13.4.818. [11] Skrabalo, Z., Deanovic, Z. (1957), Piroplasmosis in man; report of a case. Doc. Med. Geogr. Trop. 9(1), 11–16. [12] Kjemtrup, A. M., Conrad, P. A. (2000), Human babesiosis: Sn emerging tickborne disease. International Journal for Parasitology 30(12–13), 1323–1337. DOI: 10.1016/S0020-7519(00)00137-5. [13] Brogdon, W. G., McAllister, J. C. (1999), Insecticide resistance and vector control. Journal of Agromedicine 6(2), 41–58. DOI: 10.1300/J096v06n02_04. [14] Cygler, M. et al. (1993), Relationship between sequence conservation and three-dimensional structure in a large family of esterases, lipases, and related proteins. Protein Science 2(3), 366–382. DOI: 10.1002/pro.5560020309. [15] Foil, L. D. et al. (2004), Factors that influence the prevalence of acaricide resistance and tick-borne diseases. Veterinary Parasitology 125(1–2), 163–181. DOI: 10.1016/j.vetpar.2004.05.012. [16] Jonsson, N. N., Mayer, D. G., Green, P. E. (2000), Possible risk factors on Queensland dairy farms for acaricide resistance in cattle tick (Boophilus microplus). Veterinary Parasitology 88(1–2), 79–92. DOI: 10.1016/S03044017(99)00189-2. [17] Mangold, A. J., Castelli, M. E., Nava, S., Aguirre, D. H., Guglielmonechi, A. A. (2005), Poblaciones de la Garrapata Rhipicephalus (Boophilus) Microplus Resistentes a los Piretroides en Córdoba y Salta, Argentina. FAVE Cs Vet 3(1–2), 55–59. DOI: 10.14409/favecv.v3i1/2.1405.
34
Csorba, Putnoky-Csicsó, Demeter, Nyárádi, Bálint
[18] Faza, A. P. et al. (2013), A new approach to characterization of the resistance of populations of Rhipicephalus microplus (Acari: Ixodidae) to organophosphate and pyrethroid in the state of Minas Gerais, Brazil. Experimental Parasitology 134(4), 519–523. DOI: 10.1016/j.exppara.2013.04.006. [19] Van Leeuwen, T. Vontas, J., Tsagkarakou, A., Dermauw, W., Tirry, L. (2010), Acaricide resistance mechanisms in the two-spotted spider mite Tetranychus urticae and other important Acari: A review. Insect Biochemistry and Molecular Biology 40(8), 563–572. DOI: 10.1016/j.ibmb.2010.05.008. [20] Weston, D. P. et al. (2013), Multiple origins of pyrethroid insecticide resistance across the species complex of a nontarget aquatic crustacean, Hyalella azteca. Proceedings of the National Academy of Sciences 110(41), 16532–16537. DOI: 10.1073/pnas.1302023110. [21] Ábrahám, R., Érsek, T., Kuroli, G., Németh, L., Reisinger, P. (2011), Növényvédelem. Debreceni Egyetem, Nyugat Magyarországi Egyetem, Pannon Egyetem. [22] Coipan, E., Vladimirescu, A., Ciolpan, O., Teodorescu, I. (2011), Tick species (Acari: Ixodoidea) distribution, seasonality and host associations in Romania. Travaux du Muséum National d’Histoire Naturelle “Grigore Antipa” 54(2), 301–317. DOI: 10.2478/v10191-011-0018-y. [23] Rubel, F. et al. (2016), Geographical distribution of Dermacentor marginatus and Dermacentor reticulatus in Europe. Ticks and Tick-borne Diseases 7(1), 224–233. DOI: 10.1016/j.ttbdis.2015.10.015. [24] Rubel, F. et al. (2014), The first German map of georeferenced ixodid tick locations. Parasites Vectors 7(1), 477. DOI: 10.1186/s13071-014-0477-7. [25] Rar, V. A. et al. (2005), Tickborne pathogen detection, Western Siberia, Russia. Emerging Infectious Diseases 11(11), 1708–1715. DOI: 10.3201/ eid1111.041195. [26] Hornok, S., Farkas, R. (2009), Influence of biotope on the distribution and peak activity of questing ixodid ticks in Hungary. Medical and Veterinary Entomology 23(1), 41–46. DOI: 10.1111/j.1365-2915.2008.00768.x. [27] Bonnet, S. et al. (2013), Prevalence of tick-borne pathogens in adult Dermacentor spp. ticks from nine collection sites in France. Vector-Borne and Zoonotic Diseases 13(4), 226–236. DOI: 10.1089/vbz.2011.0933. [28] Temeyer, K. B. et al. (2004), Organophosphate resistance in Mexican strains of Boophilus microplus: A major threat to the U.S. cattle industry. SAAS Bulletin: Biochemistry and Biotechnology. Accessed on: 15 October 2020. [Online]. Available at: https://agris.fao.org/agris-search/search. do?recordID=US201301003885. [29] Jeschke, P., Nauen, R., Schindler, M., Elbert, A. (2011), Overview of the status and global strategy for neonicotinoids. Journal of Agricultural and Food Chemistry 59(7), 2897–2908. DOI: 10.1021/jf101303g.
Insecticide efficacy on ticks (Dermacentor spp.)…
35
[30] Martins, J. R., Furlong, J. (2001), Avermectin resistance of the cattle tick Boophilus microplus in Brazil. Veterinary Record 149(2), 64. [31] Lovis, L., Reggi, J., Berggoetz, M., Betschart, B., Sager, H. (2013), Determination of Acaricide resistance in Rhipicephalus (Boophilus) microplus (Acari: Ixodidae) field populations of Argentina, South Africa, and Australia with the larval tarsal test. Jnl. Med. Entom. 50(2), 326–335. DOI: 10.1603/ME12127. [32] Gwaltney-Brant, S. M. (2013), Atypical topical spot-on products. Small Animal Toxicology. Elsevier. 741–754. DOI: 10.1016/B978-1-4557-07171.00070-3. [33] Mount, G. A., Lofgren, C. S., Pierce, N. W. (1970), Effect of age on the susceptibility of nymphs of the lone star tick to insecticides. Journal of Economic Entomology 63(5), 1681–1682. DOI: 10.1093/jee/63.5.1681. [34] Rodríguez-Vivas, R. I., Rodríguez-Arevalo, F., Alonso-Díaz, M. A., FragosoSanchez, H., Santamaria, V. M., Rosario-Cruz, R. (2006), Prevalence and potential risk factors for amitraz resistance in Boophilus microplus ticks in cattle farms in the State of Yucatan, Mexico. Preventive Veterinary Medicine 75(3–4), 280–286. DOI: 10.1016/j.prevetmed.2006.04.001. [35] Perez-Cogollo, L. C., Rodriguez-Vivas, R. I., Ramirez-Cruz, G. T., Miller, R. J. (2010), First report of the cattle tick Rhipicephalus microplus resistant to ivermectin in Mexico. Veterinary Parasitology 168(1–2), 165–169. DOI: 10.1016/j.vetpar.2009.10.021.
ACTA UNIVERSITATIS SAPIENTIAE AGRICULTURE AND ENVIRONMENT, 13 (2021) 36–47 DOI: 10.2478/ausae-2021-0004
Sustainable and preservative historic garden management Krisztina BÁLINT,1 Ildikó Réka BÁTHORYNÉ NAGY2 1
Department of Urban Planning and Urban Green Infrastructure, Hungarian University of Agriculture and Life Sciences, Budapest, e-mail: b.krisztina1900@gmail.com 2
Department of Urban Planning and Urban Green Infrastructure, Hungarian University of Agriculture and Life Sciences, Budapest, e-mail: Bathoryne.Nagy.Ildiko.Reka@uni-mate.hu Manuscript received 15 June 2021; revised 30 June 2021; accepted 12 July 2021 Abstract: The restoration of historic gardens in Hungary puts an increasing responsibility on the shoulders of management. The use of what might be termed as “traditional horticultural approach” significantly increases the needs and costs of garden maintenance. But if we do not fulfil this task, heritage value can be lost and the former restoration efforts can become futile. Today’s challenge is to find a balance between these two issues. This study aims to develop the scientific foundations for practical solutions. Keywords: heritage protection, maintenance, green space management, research methodology
1. Introduction The status of historic gardens in Hungary has changed significantly over the last two decades. The possibilities for the research and restoration of these often damaged and fragmented gardens were relatively limited in the past, but thanks to the funding by the European Union, more than 20 gardens were restored between 2007 and 2013 [1]. Now 18 further sites have the chance for restoration (at least the surroundings of mansions) by the National Mansion and Castle Programme [2]. From the perspective of designed landscapes, the main preservation task is clearly the restoration of the spatial structure. It means that the garden areas that were neglected and afforested over the last century have to be cleaned of the overgrowth in order to reveal the visual structure of the gardens thereby [3]. From this practical fact and the fundamental idea that specifies gardens as living, plantbased creations follows that constant management and maintenance is essential in the conservation of the garden heritage [4].
Sustainable and preservative historic garden management
37
Reviewing the daily practice and the Hungarian literature on green space management and maintenance [5], it becomes clear that currently the horticultural approach and technologies are the methods used for the conservation of the garden heritage. These works, regardless of their intensity, usually appear in the management as an expense. The increased areas, following the restoration works, also have to be maintained, so the resources of maintenance tasks have to be increased as well. This phenomenon sets up a difficult situation for the management because maintenance work cannot be done with tight financial background, and it can lead to loss of heritage value and waste of restoration work. Solving this problem is a huge practical challenge. For the development of a widely applicable solution, a proper scientific foundation can serve as a great aid. Therefore, the authors’ collaborative research is aimed to find landscape architectural tools for heritage protection by sustainable maintenance. This article introduces the basic methodology of the topic.
2. Materials and methods In order to examine the methods of the so-called conservative and sustainable management of historic gardens, which is the aim of the research, it is necessary to analyse the basic materials of the study. Thanks to the variety of historic garden styles and their different management needs, the research is limited to designed landscapes, also called English gardens, which are located on the historical territory of Hungary. One of the reasons of the narrowed focus of the study is the composition of the Hungarian historic gardens. The majority of historic gardens are English style in our country, so the results will be widely applicable to develop practical solutions. Another important reason is the idea of designed landscapes: these aim at creating idealized landscapes, where humanity and nature can cooperate in harmony [6]. English landscape gardens seem to be optimal models for investigating the issue of sustainable management since the idealized landscape is characterized by closeness to nature, based on ecological principles, to which the human use is added. Human use appears in the form of the agriculture of the 19th century, whereby the management solutions of today are expected to correspond to this. Besides the economic and ecological aspects, the artistic factor is a further main element as a social need. These components of sustainability clearly appear in the ideology of designed landscapes. After defining the material of the research, we had to study the restoration processes. The conclusion that can be drawn from experiences of restoration practices is that one of the most significant tasks is the restoration of spatial structure: to define and recreate the ratio of historical grasslands and woodlands and the composition from the neglected structure [7]. The maintenance of the restored structure is one of the most crucial components of the preservation. That is why the research narrows further the focus to gardens with restored spatial structure or where the spatial structure is well preserved.
38
Krisztina Bálint, Ildikó Réka Báthoryné Nagy
After the recognition of adequate research materials, in order to define the garden’s management structure, firstly we had to develop a methodology. What can be considered as heritage value in a garden? How can we differentiate the maintenance intensity needs of different parts of a garden? Which are the parts of a garden where near sustainable technologies can be applied? This paper describes the development of methodology, with one sample site analysis, and the evaluation of the research approach. The site that has been chosen for this study is the park of the Andrássy Mansion in Betliar, Slovakia.
3. Results and discussions In order to develop the methodology, first of all it is necessary to define the elements and definitions of the topic, i.e.: What we mean by sustainable management in heritage conservation? What methods can be used to explore it? In the research, by the term “management”, we mean a general, connected system that operates the whole site, which the garden is part of, and by the term “maintenance” we mean the professional tasks, the utilized technologies, and the adopted processes to take care of the garden. Whether talking about classical, horticultural or comprehensive, sustainable management (which became more significant in the days of urbanization and climate change) [8], the need for the management of gardens is essential because of their duality: on the one hand, it is a man-made object and on the other it is a natural and living creation [9]. Historic garden management adds a new layer to this principle, whereby garden management is not only important because of its function, recreation, or representation but also essential in the conservation of historic values; ergo conservational management is in fact the basic form of management with regard to historic gardens. As explained earlier in the introduction, there is a need for increased management due to restoration, which requires more resources in practice than what are realistically available. If we think about the gardens’ former role, we can easily formulate the answer to why it is so challenging to get enough resources for maintenance today. The gardens were once the ornamental gardens of a family with a prosperous manorial background. As an ornamental garden, its maintenance was a general expense that could be financed by the economic prosperity of the same manor or the financial background of the family. It is also important that the technology and manpower of its maintenance was also partially available by the agricultural staff of the manor [10]. Nowadays, this economic integrity of the manors and such financial background is lost. Thereby, the maintenance of the gardens is a societal responsibility given by their historic significance. The proper financing of their management without adequate resources requires us to find sustainable solutions. Therefore, we need to explore how we can understand sustainability
Sustainable and preservative historic garden management
39
in the context of garden management and maintenance. For this part of the study, the identification and representation of the three pillars of sustainability proved to be the right choice.
STATISTICAL
Figure 1. Methodology The societal pillar of sustainability is clearly justified by the historical value of the gardens, based on the Florence Charter: “A historic garden is an architectural and horticultural composition of interest to the public from the historical or artistic point of view” [4]. Accordingly, maintenance is essential from a societal point of view, so the preservative management and maintenance of these values, in an authentic way, has become one of the priorities of the research. The economic aspect of sustainability means maintenance technologies, which demand fewer
40
Krisztina Bálint, Ildikó Réka Báthoryné Nagy
resources and can be profitable by sustainable agricultural practices or forestry [11] and also can have a beneficial effect on the management background from the aspects of finance or tourism. It is important to note that the parks were never, not even in their brightest times, self-sustaining; ergo this cannot be expected nowadays [12]. Finally, there is the aspect of ecological sustainability. This can be measured mainly by the effects of maintenance technologies applied on the semi-natural habitats. The above detailed, basic context will define the primary research questions for the sample site analysis, which tries to specify and identify the current maintenance structure of the parks in order to detect the potential areas where alternative solutions, which are both economically and ecologically sustainable, can be applied while preserving heritage value. To formulate answers to these questions, we have collected data via field surveys and through analysing maps. The base map on which the quantitative elements can be identified was created by measurable orthophotos [13], which include the canopy level, and by an official land registry map, which determines the boundary of the sample site. In order to describe the site’s maintenance system, as a first step it is necessary to identify the objects with historical, functional, or operational interest and their environment. These surfaces are identified as shown in Table 1, whether talking about buildings and their surrounding areas, pleasure grounds, walkways, garden structures, other structures, sports grounds, offices, or accommodations. Subsequently, also according to Table 1, the surfaces are classified into three categories according to the maintenance needs of historic gardens: Intensive Maintenance Category 1 was given to the representational surfaces with high priority, which included the surroundings of the mansion, the pleasure ground and its flowerbeds, and other bedding areas in its vicinity. Additional historic objects, operational objects, walkways (irrespective of their paving) and their surroundings are classified as Intensive Maintenance Category 2. Finally, the remaining green areas are classified as Extensive Maintenance Category. The definition of the surrounding areas of each object was based on two criteria: firstly, by adaptation to the historical structure of the garden, which depends on the situation on the site, and, secondly, by a practical maintenance need of the green surfaces, which is simplicity and does not require any unique preparation before the actual work. In the study, if there are not any other features, the surrounding area means 1 mower track width (1.25 m) along walkways, garden structures and 2 mower track width (2.5 m) next to buildings. Some elements were not examined in this study due to their specific maintenance needs, namely buildings, and the water system.
Sustainable and preservative historic garden management
41
Table 1. Classification of park elements Component
I. Int.
II. Int.
Ext.
mansion
X
mansion environment (paved surface defined by historical structure)
X
pleasure ground (perennials, annuals, hedges, lawn, and shrubs)
X
other flowerbed (perennials, annuals, hedges, lawn, and shrubs)
X
walkways (solid pavement, gravel, or without pavement)
X
lanes along walkways (1 riding mower track width)
X
garden structures with historical value (e.g.: ornamental pool, well, etc.)
X
environment of garden structures with historical value (according to the historical structure, and 2 riding mower track width)
X
other garden structures (storage, operational buildings, etc.)
X
environment of other garden structures (according to the use, and 2 riding mower track width)
X
buildings with historical value (pavilion, staffage buildings, waterfalls, etc.) environment of buildings with historical value (according to the historical structure, and 2 riding mower track width)
X X
operational buildings (office building, accommodation, etc.) environment of operational buildings (according to the use, and 2 riding mower track width) grasslands
Unm.
X
X X
tree-shaded grasslands woodlands with three levels of vegetation water system and its equipment
X X
42
Krisztina Bálint, Ildikó Réka Báthoryné Nagy
By mapping and classifying the objects and their surrounding areas into management classes, the created surfaces can highlight the management composition of the garden. This way, these components became measurable. In the following paragraphs, the study focuses on the green areas of the garden. Because of the principles described earlier, the research is mainly concerned with the spatial structure of the garden, which is defined by the woodlands and grasslands. Thus, once the management composition of the gardens has been defined, it will become possible to find further answers to our research questions. The next step is the classification of green surfaces.
Figure 2. Differentiating and mapping the green surfaces and maintenance zones
Sustainable and preservative historic garden management
43
The green surfaces are divided into three categories: ornamental planting, grasslands, and woodlands with three levels of vegetation. This categorization mirrors the ground-level surfaces, but the addition of a layer for trees will be later necessary to complete the methodology. For example, some historical tree specimens can be located on extensive surfaces and still require intensive care. Table 2. Specifications of green areas ORNAMENTAL PLANTING
AREA Green areas of the garden according to the cadastral map and current usage
499,091 m²
Annuals, perennials, lawn, hedges, floral shrubs, etc.
1,922 m²
0.4%
GRASSLANDS
WOODLANDS WITH THREE LEVELS OF VEGETATION
Surfaces where grass maintenance technologies are currently applied
Surfaces with woodland character, where trees, shrubberies, and ground vegetation live together and where grass maintenance technologies cannot be applied
179,300 m²
318,059 m²
35.9%
63.7%
Conclusions can be drawn from the study by dividing the maintenance zones, examining the composition of the vegetation, and, finally, overlapping the vegetation and management zone surfaces. We can easily understand the maintenance structure and the green surfaces of the whole site on the map and draw the conclusion: a significant part of the garden can be managed extensively while preserving the historical values. Table 3. Maintenance zones of the park AREA
INT. MAN. CAT. 1.
INT. MAN. CAT. 2.
Garden area according to the cadastral map and current usage
Areas with significant historical value: mansion environment, pleasure grounds, and related elements
Areas of historical elements around the park and every other surface with regular usage: walkways and their environments, operational areas, etc.
566,411 m²
5,663 m²
1.0%
58,072 m²
10.3%
EXT. MAN. CAT. Other green surfaces where sustainable approaches can be examined
472,040 m²
83.3%
44
Krisztina Bálint, Ildikó Réka Báthoryné Nagy
As Table 2 shows, only 1% of the management zone distribution requires Intensive Maintenance Category 1. Functional areas, environments with secondary importance, historical and operational areas represent only 10.3%. In contrast, extensive management zones constitute 83.3% of the garden area. Looking at the zonal distribution of green areas, as shown in Table 3, we can see the dominance of built elements on both intensively managed surfaces. Only 0.4% of the total greenery of the managed areas belong to Intensive Maintenance Category 1 and only 5.1% belong to Intensive Maintenance Category 2, while 94.6% of green spaces require extensive management. Table 4. Maintenance zones of green surfaces AREA
INT. MAN. CAT. 1.
INT. MAN. CAT. 2.
Green areas of the garden according to the cadastral map and current usage
Green areas with significant historical value: surfaces with annual, perennial, lawn, hedges, floral shrubs, etc.
Green surfaces near historical elements around the park and every other surface with regular usage: lane along walkways, environments of historical and operational buildings, etc.
499,091 m²
1,923 m²
0.4%
25,627 m²
5.1 %
EXT. MAN. CAT. Other green surfaces where sustainable approaches can be examined
472,040 m²
94.6%
Whether we look at the total park area or the green areas, both intensively managed areas have halved in terms of green surfaces. The extensive area is stagnating or increasing in proportion, which is not surprising since the intensive areas are designated along built structures because of heritage preservation. Overall, the intensive green management is only needed on 5.5% of the whole site. From these results, we can formulate an answer for one of the research questions (which is also the base of the doctoral research), and we can describe the maintenance structure of the garden. Before we present the next analysis, we emphasize the principles that intensively managed areas require traditional management to preserve their value, while extensively managed areas may be suitable for the alternative types of technologies that promote economic and ecological sustainability. Regarding the classification (Table 2) of green areas, in the park of Betliar, only 0.4% are ornamental plantings, and 35.9% are open grasslands and grasslands with solitaire trees or clumps. The bulk of the garden is woodland with three levels of vegetation, which makes up 63.7%. Looking at the classifications and analyses, it is not surprising that whether we talk about grasslands or woodlands, the extensive form of management appears on the most extensive areas.
Sustainable and preservative historic garden management
45
Table 5. Ornamental plantings (with lawn) and grasslands by management zones INT. MAN. CAT. 1.
AREA
181,223 m²
INT. MAN. CAT. 2.
Lawns in ornamental planting compositions
Grass surfaces where the usage or historical value demands continuous maintenance
1,922 m²
14,060 m²
1.1%
7.8%
EXT. MAN. CAT. Actual grasslands where alternative technologies and ecological approaches can be applied without changing the historical structure
165,444 m²
91.3%
In the case of grasslands, ornamental plantings are included in the Intensive Grass Maintenance Category 1 since intensively maintained lawns play a significant role in their composition and are present on only 1.1% of the grasslands. From the perspective of the study, the proportion of perennial and annual surfaces can be neglected. Intensive Grass Maintenance Category 2 is applied on 7.8% of grasslands. These two surfaces will require a horticultural approach in the further studies on applicable technologies. On extensive surfaces, alternative methods can be examined that, according to other international and national experiences, are ecologically and economically sustainable, e.g. correctly timed mowing or traditional grazing. Intensive Woodland Maintenance Category 1 cannot be found at all due to the nonrepresentative attributes of woodlands. Only a relatively low proportion, 3.6%, requires intensive approach according to the study methodology. This means that on 96.4% of the woodland areas, extensive, sustainable management can be applied. In order to provide economic sustainability and increase management resources, the applicability of sustainable forestry is also worth examining. Table 6. Woodlands with three levels of vegetation by management zones AREA
318,059 m²
INT. MAN. CAT. 2.
EXT. MAN. CAT.
Woodland edges where the usage or historical value demands maintenance
Actual woodlands where alternative technologies, forestry, and ecological approaches can be applied
11,445 m²
3.6%
306,661 m²
96.4%
4. Conclusions The presented methodology proved to be suitable to identify the management composition of a historic garden, which is fundamental to create a scientific approach for management issues. The methodology can serve as a basis for future scientific research. By the evaluation of the work, we can declare that a further
46
Krisztina Bálint, Ildikó Réka Báthoryné Nagy
development of the methodology is needed. The integration of the historic trees will form an additional layer. After this addition, the next phase of the research will be the application of the research methodology on several other sample sites. (Currently, three other locations are planned.) The results are expected to vary to a certain extent – such is the case of the proportion of grasslands and threelayered vegetation, depending on the restoration level of the spatial structure. Some deviations can be expected in the percentages of management zones, depending on the size of the parks. Predictably, the summary of all the future analysis results of the sites will show an average, approximate area where alternative, sustainable maintenance technologies can be applied. Once the surfaces and their characteristics have been determined, a comparison of different technologies is the next planned phase of the research. By these technologies, we mean the earlier mentioned sustainable, correctly timed mowing, sustainable, traditional grazing, and sustainable forestry based on international experiences [14]. This part of the research will be based primarily on literature on grassland management and forestry, supplemented by interviews with farmers, foresters, and green space managers who use similar technologies. Finally, these methods will be compared according to their estimated work hour requirements and to the expected semi-natural habitat values as a result of maintenance technologies.
Acknowledgements The research was supported by the Hungarian University of Agriculture and Life Sciences, Institute of Landscape Architecture, Urban Planning and Garden Art, Department of Urban Planning and Urban Green Infrastructure. We are grateful to Gábor Alföldy for providing the land registry map and to Miklós László Pap for the help in the English translation.
References [1] https://www.palyazat.gov.hu/tamogatott_projektkereso (2021.01.20). EU2007-2013, KEOP-3.1.3/2F/09 and KEOP-3.1.3./2F/09-11. [2] http://nkvp.hu/ (2021.01.20). [3] Szikra, É. (2000), A tájképi kertek rekonstrukciós, helyreállítási lehetőségei és módszerei. In: Galavics, G. (ed.), Historic gardens in and around Hungary. Studies on research and restorations. Budapest: MTA Művészettörténeti Kutatóintézete – MÁGUS Kiadó. 116–126. [4] ICOMOS, Florence Charter 1. §. In: Fejérdy, T. (ed.), Karták könyve. Budapest: Építésügyi Tájékoztatási Központ Kft.
Sustainable and preservative historic garden management
47
[5] Kiácz, Gy., Szendrői, J. (1980), A zöldfelületek fenntartása. Budapest: Mezőgazdasági Kiadó. [6] Buttlar, A. (1989), Der Landschaftsgarten Gartenkunst des Klassizismus un der Romantik. Köln: DuMont. [7] Alföldy, G. (2013), Történeti kertek a változás küszöbén. Műemlékvédelem LVII(6). Budapest: Forster Gyaula Nemzeti Örökséggazdálkodási és Szolgáltatási Központ. 385–399. [8] Báthoryné Nagy, I., Gergely., A., Bálint., K. (2019), Fenntartható és klímaadaptív városi gyepfenntartás Veszprém közterületein (2016–18) és annak hatása a gyepek diverzitására. In: Fazekas, I., Lázár. I. (eds.), Tájak működése és arculata. Debrecen: MTA DTB Földtudományi Szakbizottság. 337–342. [9] Ormos, I. (1955), A kerttervezés története és gyakorlata. Budapest: Kiadó. [10] Bálint, K. (2020), A gyömrői Teleki-kastély parkjának története a kezelés tükrében. In: Fodor, M., Bodor, P. (eds.), SZIEntific meeting for young researchers Budapest: Szent István University. 81–92. [11] Viszló, L. (ed.) (2012), A természetkímélő gyepgazdálkodás: hagyományőrző szemlélet, modern eszközök. Csákvár: Pro Vértes Természetvédelmi Közalapítvány. [12] Takács, K. (2017), Uradalmi kertészetek a 19. századi Magyarországon. Doctoral dissertation. Budapest. [13] https://www.geoportal.sk/ (2020), Orthophoto. [14] Watkins, J., Wright, T. (eds.) (2007), The management & maintenance of historic parks, gardens & landscapes – The English heritage handbook. London: Frances Lincoln.
ACTA UNIVERSITATIS SAPIENTIAE AGRICULTURE AND ENVIRONMENT, 13 (2021) 48–64 DOI: 10.2478/ausae-2021-0005
Understanding the influence of maize (Zea mays) and cowpea (Vigna unguiculata L. Walp) growth period on some thermal and hydrological properties of two soils with textural class variation O. O. AKINGBOLA,1* C. O. AKINBILE,2 S. O. OJENIYI1 1
Department of Crop, Soil and Pest Management, Federal University of Technology, Akure, Nigeria
2
Department of Agricultural and Environmental Engineering, Federal University of Technology, Akure, Nigeria *Corresponding author: ooakingbola@futa.edu.ng
Manuscript received 25 June 2021; revised 30 July 2021; accepted 10 August 2021 Abstract: Adequate knowledge of soil processes is key to ensuring sustainability. Towards a better understanding of some thermal and hydrological processes that take place in the soil as a result of the growth period of maize and cowpea, a concurrent research was carried out in two different locations with soil textural variation (sandy clay loam and clay loam) at the Federal University of Technology, Akure. The treatment consisted of bare soil plot, cowpea plot, and maize plot arranged in a randomized complete block design in three replicates. The same weed management practice was carried out on all treatment plots throughout the duration of the study. Data were collected at 4 weeks after planting (WAP), 8 WAP, and 12 WAP, during which the dry bulk density, mass wetness, volumetric infiltration rate, saturated hydraulic conductivity, sorptivity, soil temperature, total energy emitted, wavelength of maximal radiation intensity, and energy flux were determined. The results showed that growing maize and cowpea had no significant influence (P > 0.05) on the soil properties measured in the SCL soil. However, significant difference was noticed in the CL soil at 8 WAP; the crops grown prevented the formation of excess soil seal and crust when compared to the bare soil plot. This study shows that soil textural property greatly influences hydrological and thermal processes in the soil during the maize and cowpea growth period. Keywords: soil processes, maize growth, cowpea growth, soil texture
Understanding the influence of maize (Zea mays) and cowpea…
49
Introduction Soil sustainability can be said to be achieved if the production and nutritional quality of crops can be maintained over time without endangering the ecosystem and biodiversity [1]. The conservation of soil quality is fundamental to this sustainability. Healthy and productive soils are major to accomplishing about six of the sustainable development goals (SDG) adopted by the United Nations General Assembly [2, 3]. Our food systems are sustained by the soil while it filters water, sequestrates carbon, and supports numerous organisms. However, these soils are progressively under a lot of pressure from climate change, poor land management, and population growth [4]. In 2015, the 68th United Nations General Assembly began an evolution to raise awareness about the life-supporting functions of the soil [5]. This evolution triggered the need for improved understanding and sustainable management of this overlooked and abused natural resource called soil. Land clearing of forested areas for crop production has been said to initiate processes that cause a rapid loss of carbon [6] and nitrogen from the soil; among others, this results in decline in soil quality termed as soil degradation [7, 8]. Total degradation of soil condition is critical because it is not easily naturally reversible [9]. This is because soil formation and regeneration processes are predominantly slow [10]. However, soil degradation is a gradual multifaceted process in which several features of soil deterioration can be recognized. Most of these degradative processes and their negative consequences can be controlled, prevented, abolished, or at least moderated if these processes are well understood. This prompted the need for this research to understand if maize and cowpea, which are commonly grown in the study area, have direct additional influence on some soil processes such as soil hydrological and thermal processes, which are majorly influenced by climate change while being crucial to soil sustainability. These soil processes are essential dynamic characteristics for assessing the influence of climate and agronomic management practices on the behaviour of soil. Soil temperature is an important attribute that influences soil biological, chemical, and physical quality [11]. It greatly influences the mineralization of various organic substances [12] and soil water availability [13]. Soil water, in turn, influences the interaction of the hydrological processes in the earth system [14]. One study claimed that agriculture threatens more plant and animal species worldwide than urban development and climate change combined [15]. This threat to biodiversity is a reminder of the urgency to understand the impacts of food production on the environment.
50
Akingbola, Akinbile, Ojeniyi
Materials and methods Description of the study area The study, sited at two locations at the Federal University of Technology, Akure, Ondo State, Nigeria, was conducted from 21 April to 14 July in the year 2018. Location 1 was at the Teaching and Research Farm (Longitude: 5.145833; Latitude: 7.298889), while location 2 was at the Obakekere Junior Staff Quarters’ Farm (Longitude: 5.123889; Latitude: 7.308889). Prior to the study, Location 1 had been left fallow for a period of 3 years after having been used for various research studies involving the addition of chemical and/or organic fertilizers, while Location 2 was used for cassava multiplication project but left fallow for about four years before the experiment. The major weeds identified on the plots were Tithonia diversifolia, Sida acuta, Imperata cylindrica, and Euphorbia heterophylla. Akure is in the humid rainforest zone of south-western Nigeria [16]. The study area experiences distinct dry and wet seasons. The mean annual rainfall ranges from 1,405 mm to 2,400 mm [17]. The total monthly sunshine time is about 190 hours, while annual relative humidity is 80% [18]. The mean monthly rainfall, air temperature, and relative humidity data during the experiment are stated in tables 1 and 2. Rainfall data was sourced from the ERA5 of the Copernicus Climate Change Services, as described by [19], while air temperature and relative humidity data were sourced from the Modern-Era Retrospective Analysis for Research and Applications, version 2 (MERRA-2), using the Goddard Earth Observing System Model, Version 5 (GEOS-5) with its Atmospheric Data Assimilation System (ADAS), version 5.12.4. Table 1. Mean monthly air temperature, rainfall, and humidity data during the experiment at the Teaching and Research Farm (Longitude: 5.145833; Latitude: 7.298889) Months
Air temperature (0C)
Rainfall (mm)
Relative humidity at 2 metres (%)
April
24.90
111.6
86.76
May
25.29
144.8
89.10
June
24.40
208.7
90.95
July
24.09
208.0
90.52
Note: Elevation from MERRA-2 was at 292.62 m for air temperature and relative humidity.
Understanding the influence of maize (Zea mays) and cowpea…
51
Table 2. Mean monthly air temperature, rainfall, and humidity data during the experiment at the Obakekere Junior Staff Quarters’ Farm (Longitude: 5.123889; Latitude: 7.308889) Months
Air temperature (0C)
Rainfall (mm)
Relative humidity at 2 metres (%)
April
25.77
106.5
86.76
May
25.29
147.6
89.10
June
24.37
200.0
90.95
July
24.09
206.4
90.52
Note: Elevation from MERRA-2 was at 292.62 m for air temperature and relative humidity.
Experimental design and land preparation A land area measuring 60 m x 60 m was ploughed and harrowed. A portion of the land was then divided into nine (9) experimental units of a total area of 225 m2 (15 m x 15 m). Each unit had a dimension of 4 m x 4 m and 1 m buffer zone between plots and also between blocks. The maize plot resulted in 36 plant stands per treatment plot at 75 cm x 25 cm standard spacing, while the cowpea plot had 49 plants per treatment plot at 45 cm x 45 cm standard spacing. The control plot was left bare.
Planting material Late maturing cultivar Maize (TZB-SR) obtained from the International Institute of Tropical Agriculture (IITA) Ibadan, Oyo State, and Cowpea variety 07K-1311 obtained from the Seed Bank of the Plant Breeding Unit, Crop Soil and Pest Management Department, Federal University of Technology Akure, were used for the experiment.
Experimental procedure The experiment consisted of three treatments, as indicated in Table 3. The soil was analysed for its inherent thermal, hydrological, and other essential physical properties prior to the experiment (before and after ploughing and harrowing), as stated in Table 4. All plots were put through the same agronomic management procedure. All weeds were uprooted manually and shaken to remove soil particles attached to the roots, after which the weeds were placed back on each plot as a means to recycle nutrients taken up by the weeds. This was done at 2 WAP, 4 WAP (after data collection), 6 WAP, 8 WAP (after data collection), and 10 WAP.
52
Akingbola, Akinbile, Ojeniyi Table 3. Treatment number, notation, and meaning Treatment number
Treatment notation
Meaning
Treatment 1
BSP
Bare Soil Plot (Control)
Treatment 2
CPP
Cowpea Plot
Treatment 3
MZP
Maize Plot
Determination of soil hydrological properties Mass wetness Mass wetness was determined at 4, 8, and 12 WAP in the laboratory using the soil samples collected by applying the core method. The soil sample’s weight before and after drying was measured. The water weight is the difference between the weights of the wet and oven-dry samples. ݓܯൌ ݐܯെ ݏܯ ݏݏ݁݊ݐܹ݁ ݏݏܽܯሺܹ݉ሻ ൌ ቀ
ெ௪ ெ௦
ቁ כ100,
where Mw is the mass of water in the soil sample expressed in grams, Mt is the mass of soil sample before drying, in grams, and Ms is the mass of soil sample after drying, in grams.
Infiltration Infiltration is the entry of water into the soil through the soil–atmosphere interface. It was determined using a 10 cm diameter single-ring infiltrometer, as described by [20]. Cumulative infiltration rate is the total distance moved by water that entered into the soil in a specific period of time [20]. This was derived in cm/h basis. Volumetric infiltration rate is the total volume of water that entered into the soil per time unit. This was derived as described by [21] in cm3/h basis using the formula below: Volumetric infiltration rate ൌ ߨ ݎଶ כCummulative Infiltration Rate
Sorptivity Sorptivity, being the measure of the ability of the soil to absorb water, was derived at 4, 8, and 12 WAP for all plots, from cumulative infiltration as a function of the square root of time for a specific period of time, as described by [21, 20]: ܵሺcm/ି ݏ.ହ ሻ ൌ
ூ మ
ξ௧
,
Understanding the influence of maize (Zea mays) and cowpea…
53
where S is sorptivity, I is the cumulative infiltration, and t is the time in seconds.
Saturated hydraulic conductivity Saturated hydraulic conductivity (Ksat) describes water movement through saturated media. Hydraulic conductivity depends on the intrinsic permeability of the material, the degree of saturation, and the density and viscosity of the fluid. It was estimated using the function presented by [22], which is: ݐܽݏܭൌ 1.15741 כ10ି expሺxሻ ݔൌ 7.755 0.0352ሺ%ܵሻ ሺ0.93ሻ െ ሺ0.967 ܦܤ כଶ ሻ െ ሺ0.000484 כ% ܥଶ ሻ െ ሺ0.000322 כ%ܵ ଶ ሻ ൬
0.0748 0.001 ൰െ൬ ൰ െ ሺ0.643 ln %ܵሻ െ ሺ0.01398 כ ܦܤ כ%ܥሻ %ܱܯ %ܵ
െ ሺ0.1673 כ ܦܤ כ%ܱܯሻ ሺ0.02986 כ%ܥሻ െ ሺ0.03305 כ%ܵሻ,
where %C is the percentage clay content of the soil, %S is the percentage silt content of the soil, and %OM is the percentage organic matter content of the soil.
Determination of soil thermal properties Soil temperature Soil temperature was measured using soil thermometer placed 0–10 cm into the soil at about 15:00 hrs. The reading was reported in degree Celsius °C.
Total energy emitted The total energy emitted (Jt) was determined as described by [23] according to the Stephan–Boltzmann law. The law is represented by the formula below: ܬ௧ ൌ ߝߪܶ ସ ,
where σ is a constant which equals 5.670374419e−8 watt/m2/K4, ε is the emissivity coefficient – 0.93 (the emissivity value of quartz) was used because quartz is usually the dominant mineral in soils –, and T is the soil temperature in Kelvin.
Energy flux The energy flux (Eλ) emitted in a particular wavelength range (maximal wavelength) as determined using the Planck’s law, which is represented by the equation below, was determined at 4, 8, and 12 WAP:
54
Akingbola, Akinbile, Ojeniyi
ܧఒ ൌ ܥଵ /ሾߣହ ሺexp ሺܥଶ Τߣܶሻ െ 1ሻሿ,
where T is the absolute temperature of the soil in Kelvin, λ is the wavelength at temperature T, C1 is a constant which equals 3.74177153e−16 W.m2, and C2 is a constant which equals 1.4387770e−2 m.K.
Determination of other physical properties The particle size analysis of the soil was done using the standard hydrometer method described by [24], while the particle fraction was calculated using the formulae and the textural class triangle described by [25]. This resulted in the determination of the textural class of the soil. The bulk density was determined by core method [26].
Data analysis The data were compiled into a Microsoft Excel (2016) spreadsheet and then subjected to analysis of variance (ANOVA) using statistical package for social sciences (SPSS v. 26), while the means were compared using Tukey’s (HSD) test at 5% level of probability. The standard deviation values used for the error bars and all graphical representations were computed using Microsoft Excel (2016).
Results Table 4. Status of the soils with textural class variation before the experiment Before ploughing and harrowing
Soil properties
After ploughing and harrowing
Sandy clay loam
Clay loam
Sandy clay loam
Clay loam
Clay (%)
20.7
37.9
22.9
38.2
Sand (%)
66.1
26.9
63.5
26.4
Silt (%)
13.2
35.2
13.6
35.4
Bulk density (g/cm3)
1.48
1.59
1.29
1.38
Mass wetness (%)
5.52
7.56
6.34
8.21
Volumetric infiltration rate (cm3/h)
1,398
782
1,496
956
Sorptivity (cm/s−0.5 E-01)
2.89
1.96
3.01
2.02
Soil temperature ( C)
33.24
32.25
35.54
33.46
Total energy emitted
463.81
457.84
477.90
465.15
Energy flux (E-17)
99.04
97.45
102.81
99.39
0
Note: Mean values are presented in this table.
Understanding the influence of maize (Zea mays) and cowpea…
55
Table 5. Soil hydrological properties in sandy clay loam and clay loam soils as affected by the treatments at 4, 8, and 12 WAP Clay loam
Sandy clay loam soil Mass wetness (%)
Sorptivity (cm/s−0.5 E-01)
Volumetric infiltration rate (cm3 /h)
BSP
6.77a
3.20a
MZP
7.26a
CPP
7.75a
Treatment
Mass wetness (%)
Sorptivity (cm/s−0.5 E-01)
Volumetric infiltration rate (cm3 /h)
1,507.07a
11.14a
2.01a
946.93a
3.18a
1,497.19a
11.26a
1.87a
879.64a
3.32a
1,566.36a
11.44a
1.88a
886.68a
4 WAP
8 WAP BSP
6.79a
3.16a
1,491.36a
10.94b
2.07a
978.13a
MZP
7.27a
3.14a
1,481.48a
11.58ab
2.00ab
944.24ab
CPP
7.75a
3.29a
1,550.65a
11.93a
1.97b
927.22b
12 WAP BSP
6.93a
3.13a
1,475.65a
12.27a
2.03a
956.26a
MZP
7.38a
3.09a
1,457.92a
12.43a
2.05a
964.85a
CPP
7.88a
3.24a
1,527.08a
12.59a
2.01a
947.92a
Note: Means followed by the same letters in a column are not significantly (P > 0.05) different according to Tukey’s Honestly Significant Difference (HSD) test. WAP – Weeks after planting.
Table 6. Soil thermal properties in sandy clay loam and clay loam soils as affected by the treatments at 4, 8, and 12 WAP Clay loam
Sandy clay loam soil Treatment
Soil temperature (0C)
Total energy emitted (watt/m2)
Energy flux (E-17)
BSP
35.28a
476.30a
MZP
35.20a
CPP
34.71a
Soil temperature (0C)
Total energy emitted (watt/m2)
Energy flux (E-17)
102.38a
32.57a
459.70a
97.97a
475.79a
102.25a
32.83a
461.47a
98.40a
472.78a
101.44a
32.27a
458.00a
97.50a
4 WAP
8 WAP BSP
35.04a
474.82a
101.99a
33.47a
465.11a
99.37a
MZP
34.96a
474.32a
101.85a
32.30ab
458.11ab
97.53ab
CPP
34.48a
471.38a
101.06a
31.70b
454.63b
96.60b
56
Akingbola, Akinbile, Ojeniyi Clay loam
Sandy clay loam soil Treatment
Soil temperature (0C)
Total energy emitted (watt/m2)
Energy flux (E-17)
Soil temperature (0C)
Total energy emitted (watt/m2)
Energy flux (E-17)
12 WAP BSP
34.99a
474.49a
101.90a
35.40a
477.17a
102.67a
MZP
34.91a
473.99a
101.76a
33.17a
463.41a
99.00a
CPP
34.43a
471.07a
100.98a
32.90a
461.77a
98.53a
Note: Means followed by the same letters in a column are not significantly (P < 0.05) different according to Tukey’s Honestly Significant Difference (HSD) test. WAP – Weeks after planting.
Figure 1. Saturated Hydraulic Conductivity (Ks E-05) in a sandy clay loam soil as affected by the treatments at 4, 8, and 12 WAP
Figure 2. Saturated Hydraulic Conductivity (Ks E-05) in a clay loam soil as affected by the treatments at 4, 8, and 12 WAP
Understanding the influence of maize (Zea mays) and cowpea…
57
Sandy Clay Loam Soil 1.52
Dry Bulk Density (g/cm3)
1.50 1.48 1.46
1.42
a
a
a
a
1.44
a a
a
4WAP 8WAP
a
12WAP a
1.40 1.38 1.36 Maize Plot
Cowpea Plot
Bare Soil Plot
Note: Error bars correspond to the standard deviation and compared to the control (0B) (P > 0.05).
Figure 3. Dry Bulk Density (g/cm3) in a sandy clay loam soil as affected by the treatments at 4, 8, and 12 WAP Clay Loam Soil 1.62
Dry Bulk Density (g/cm3)
1.60 1.58 a
a
a
1.54 1.52
a
a 1.56 a a
4WAP 8WAP 12WAP
a a
1.50 1.48 1.46 Maize Plot
Cowpea Plot
Bare Soil Plot
Note: Error bars correspond to the standard deviation and compared to the control (0B) (P > 0.05). Figure 4. Dry Bulk Density (g/cm3) in a clay loam soil as affected by the treatments at 4, 8, and 12 WAP
Discussion Status of the soils with textural class variation before the experiment The status of the study prior to the experiment is shown in Table 4. The textures of the soils were sandy clay loam (SCL) and clay loam (CL), although a variation in individual values of the sand, clay, and silt content were noticed before and after ploughing and harrowing. The bulk density of the SCL and CL were 1.48g/ cm3 and 1.59 g/cm3, resp., before ploughing and harrowing and 1.38 g/cm3 and
58
Akingbola, Akinbile, Ojeniyi
1.29g/cm3, resp., afterwards. The values recorded for the volumetric infiltration rate, soil temperature, and sorptivity were lower in CL compared with the SCL.
Soil hydrological properties in sandy clay loam and clay loam soils as affected by the treatments Maize and cowpea growth influence on soil hydrological properties of the SCL and CL are presented in Table 5. At 4, 8, and 12 WAP, there was no significant difference (P > 0.05) among the treatment mean values for mass wetness in SCL. This means that the presence of cowpea or maize on the plot did not significantly influence the amount of water stored in the SCL soil throughout the experiment. However, there was a trend revealing that the cowpea plot stored more water in the soil (7.75% at 4 WAP and 8 WAP, 7.88% at 12 WAP), while the bare soil plot had the least amount (6.77% at 4 WAP, 6.79% at 8 WAP, 6.93% at 12 WAP) despite not being significantly different (P > 0.05). This trend was probably due to the shading effect of the broad leaves of the cowpea, thereby reducing water loss. [27] concluded that a decrease in vegetative cover would cause an increase in soil temperature, which will accelerate moisture loss. In the CL soil, the only significant difference (P < 0.05) recorded was at 8 WAP. This was when the highest difference was observed between the control (BSP), which had the lowest mean value (10.94%), and CPP, which had the highest (11.93%). This was probably due to an on-site observation, which was noted while conducting the study. Soil seal and crust formation were noticeable on the BSP compared to MZP and CPP, thereby probably reducing the amount of water infiltrated and retained. This phenomenon is in line with the finding of [28] although the sealing and crusting were kept in check due to leaving uprooted weeds (organic matter) on the soil surface after the agronomic maintenance of all plots, as recommended by [29]. Comparing the mass wetness values of the soils of the experimental location, it was expected that the CL soil would have a higher water content than the SCL soil. It has been concluded that soils with higher sand percentage would allow easier drainage of water than storage, while soils with a higher clay content have a greater ability to adsorb water than soils with higher percentage of sand [30]. The volumetric infiltration rate (VIR) and sorptivity were the inverses of the mass wetness trend. High mean values for mass wetness resulted in a low volume of water infiltrated into the soil per hour. This is probably due to the inherent moisture content of soil being a highly crucial factor when considering its infiltration capacity [31, 32]. There was no significant difference (P > 0.05) among the mean values recorded for the VIR and sorptivity as a result of the treatments on the SCL soil.
Understanding the influence of maize (Zea mays) and cowpea…
59
With reference to Figure 1 and Figure 2, MZP and CPP had no significant impact on the saturated hydraulic conductivity (Ks) mean values recorded in both SCL and CL soils compared to the BSP. However, there is a difference in trend with regard to SCL and CL. There was a downward trend in Figure 2, which shows that Ks was higher at 4 WAP and reduced subsequently at 8 WAP and 12 WAP in CL soils. The initial increase was probably due to the agitated state of the soil after ploughing and harrowing, and as the soil settled with time, there was probably a reduction in the ease with which water moved in the CL soil. Also, comparing the Ks mean values for the SCL and CL, it was observed the SCL had higher values compared to CL. This observation could have been accounted for by many factors such as the level of macroporosity and compaction. Several researchers have concluded that the hydraulic conductivity of clay–sand mixtures decreases with the increase in clay percentage [33, 34, 35]. Also, the SCL had a lower compaction level compared to CL. This was reflected through the mean values of dry bulk density.
Soil thermal properties in sandy clay loam and clay loam soils as affected by the treatments Table 6 shows the mean values describing the thermal properties of the soil as a result of the treatment. There was no significant difference (P > 0.05) among the soil temperature (ST) mean values in the SCL soil. However, the trend shows that CPP had the least mean value for the soil temperature at 4 (34.71 0C), 8 (34.48 0C), and 12 WAP (34.43 0C) followed by MZP (35.20 0C at 4 WAP, 34.96 0C at 8 WAP, 34.91 0C at 12 WAP), while the highest mean values recorded were for the BSP (35.28 0C at 4 WAP, 35.04 0C at 8 WAP, 34.99 0C at 12 WAP). This result is in line with the findings of [36], who concluded that soil temperature was higher for the plot with sole maize than for the plot with sole cowpea. The trend recorded in the SCL was replicated in the CL. However, there was a significant difference (P < 0.05) among treatments in the CL at 8 WAP only. This significant difference at 8 WAP under thermal properties was the same as with the hydrological properties. It has been concluded in a previous study that soil hydrological properties and thermal properties are closely linked [27]. Water has also been found to have a cooling effect in soils. The values recorded for total energy emitted (TEE) during the study were directly proportional to the soil temperature mean values. It is assumed that the same amount of solar energy was directed at all experimental plots since there was no form of shading on any section of the total plot area. It can be concluded that energy not emitted by the soil was absorbed by the plants through a process called photosynthesis, thereby causing the BSP to have a higher TEE compared to MZP and CPP. This means that energy received per unit area by the MZP and CPP was put to good use towards ensuring food security.
60
Akingbola, Akinbile, Ojeniyi
Energy flux (EF) is the rate of transfer of energy in the soil. EF is also presented in Table 6. There was no significant difference (P > 0.05) among treatments in the SCL; however, at 8 WAP, there was significant difference (P < 0.05) among treatments in the CL. According to the mean values recorded, it was noted that the rate of energy transfer in SCL was higher than the values recorded for CL. This was probably because moisture stored in the CL was higher than in the SCL, thereby causing a cooling effect, which reduced the soil temperature.
Other soil physical properties in sandy clay loam and clay loam soils as affected by the treatments According to figures 3 and 4, the mean values of the bulk density (BD) for the SCL and CL soils increased across the weeks for all treatments despite not being significantly different (P > 0.05). The CPP had the lowest mean value for BD (1.42g/cm3 at 4 WAP, 1.44g/cm3 at 8 WAP, and 1.45g/cm3 at 12 WAP), while MZP and BSP had the same mean values in the SCL soil (1.44g/cm3 at 4 WAP, 1.46g/cm3 at 8 WAP, and 1.47g/cm3 at 12 WAP); however, there was no similarity in the standard deviation (SD) values of MZP and BSP as depicted by the error bars. The values recorded for BSP deviated more from the mean value compared to MZP. The same trend as above was noticed for the treatments in the CL soil, where CPP had the least mean values for BD (1.52g/cm3 at 4 WAP, 1.55g/cm3 at 8 WAP, and 1.56g/cm3 at 12 WAP) followed by the MZP (1.53g/cm3 at 4 WAP, 1.56g/cm3 at 8 WAP, and 1.58g/cm3 at 12 WAP), while the BSP had the highest recorded mean value for all weeks (1.54g/cm3 at 4 WAP, 1.57g/cm3 at 8 WAP, and 1.59g/cm3 at 12 WAP). However, the same mean values were not calculated for MZP and BSP in CL soil compared to SCL soil. The increased bulk density of the soil throughout the week must have been due to the resettling of the soil to a resting state after the initial ploughing and harrowing that was done to prepare the land for cultivation. This must have also been aided by the wetting and drying cycle that the soil went through; this process has been concluded to stimulate aggregation in a laboratory experiment conducted by [37]. The BD mean values of the SCL were generally lower than the mean values of the CL soil; this is probably due to the textural component of the soils. In line with this, [38] discovered that sandy soil was less compacted by harvesting machines compared to clayey soils.
Conclusions This study has shown that despite the physiological differences in maize and cowpea, there is no significant influence on the hydrological and thermal properties
Understanding the influence of maize (Zea mays) and cowpea…
61
of the SCL soil measured in this research. However, the crops grown influenced soil seal and crust formation in the CL soil positively. More soil seal and crust were noticeable on the bare soil, thereby increasing run-off and reducing infiltration. Therefore, the soil textural property greatly influences hydrological and thermal processes in the soil during the maize and cowpea growth period. It can also be concluded that the soil thermal properties have direct effect on the hydrological properties of the soil.
References [1] White, P. J., Crawford, J. W., Álvarez, M. D., Moreno, R. G. (2014), Soil management for sustainable agriculture 2013. Applied and Environmental Science 2014, art. nr. 536825. https://doi.org/10.1155/2014/536825. [2] Keesstra, S. D., Bouma, J., Wallinga, J., Tittonell, P., Smith, P., Cerdà, A., Montanarella, L., Quinton, J. N., Pachepsky, Y., Van der Putten, W. H., Bardgett, R. D., Moolenaar, S., Mol, G., Jansen, B., Fresco, L. O. (2016), The significance of soils and soil science towards realization of the United Nations Sustainable Development Goals. SOIL 2, 111–128. https://doi.org/10.5194/ soil-2-111-2016. [3] Nhemachena, C., Matchaya, G., Nhemachena, C. R., Karuaihe, S., Muchara, B., Nhlengethwa, S. (2018), Measuring baseline agriculture-related sustainable development goals index for Southern Africa. Sustainability 10(3), art. nr. 849. https://doi.org/10.3390/su10030849. [4] Ajayi, A. S. (2015), Land degradation and the sustainability of agricultural production in Nigeria: A review. Journal of Soil Science and Environmental Management 6(9), 234–240. https://doi.org/10.5897/JSSEM15.0507. [5] Rojas, R. V., Caon, L. (2016), The international year of soils revisited: Promoting sustainable soil management beyond 2015. Environmental Earth Sciences 75, art. nr. 1184. https://doi.org/10.1007/s12665-016-5891-z. [6] Olorunfemi, I. E., Fasinmirin, J. T., Olufayo, A. A., Komolafe, A. A. (2020), Total carbon and nitrogen stocks under different land use/land cover types in the Southwestern region of Nigeria. Geoderma Regional 22, art. nr. e00320. Elsevier BV. https://doi.org/10.1016/j.geodrs.2020.e00320. [7] Saha, R., Chaudhary, R. S., Somasundaram, J. (2012), Soil health management under hill agroecosystem of North East India. Applied and Environmental Soil Science 2012, art. nr. 696174. https://doi.org/10.1155/2012/696174. [8] Ayoubi, S., Moazzeni Dehaghani, S. (2020), Identifying impacts of land use change on soil redistribution at different slope positions using magnetic susceptibility. Arabian Journal of Geoscience 13, art. nr. 426. https://doi. org/10.1007/s12517-020-05383-x.
62
Akingbola, Akinbile, Ojeniyi
[9] Eswaran, H., Lal, R., Reich. P. F. (2001), Land degradation: An overview. In: Bridges, E. M., Hannam, I. D., Oldeman, L. R., Pening de Vries, F. W. T., Scherr, S. J., Sompatpanit, S. (eds.), Responses to land degradation. Proc. of the 2nd International Conference on Land Degradation and Desertification, Khon Kaen, Thailand. Oxford Press, New Delhi, India. [10] Hurni, H. (1988), Degradation and conservation of the resources in the Ethiopian highlands. African Mountains and Highlands May–Aug., 123–130. https://doi.org/10.2307 / 3673438. [11] Buchan, G. D. (2001), Soil temperature regime. In: Smith, K. A., Mullins, E. D. (eds.), Soil and environmental analysis: Physical methods. Marcel Dekker, New York. 539–594. [12] Davidson, E. A., Janssens, I. A. (2006), Temperature sensitivity of soil carbon decomposition and feedbacks to climate change. Nature. 440(7081), 165– 173. https://doi.org/10.1038/nature04514. [13] Onwuka, B. M. (2016), Effects of soil temperature on some soil properties and plant growth. Scholarly Journal of Agricultural Science 6(3), 89–93. [14] Pan, Y. X., Wang, X. P. (2009), Factors controlling the spatial variability of surface soil moisture within revegetated-stabilized desert ecosystems of the Tengger Desert, Northern China. Hydrological Processes 23(11), 1591–1601. https://doi.org/10.1002/hyp.7287. [15] Kanianska, R. (2016), Agriculture and its impact on land-use, environment, and ecosystem services. landscape ecology – The influences of land use and anthropogenic impacts of landscape creation. IntechOpen. https://doi. org/10.5772/63719. [16] Akinbile C. O., Erazua A. E., Babalola T. E., Ajibade F. O. (2016), Environmental implications of animal wastes pollution on agricultural soil and water quality. Soil and Water Research 11, 172−180. [17] Akinbile, C. O., Eze, R. C., Yusuf, H., Ewulo, B. S., Olayanju, A. (2019), Effect of some selected soil properties, moisture content, yield and consumptive water use on two cassava (TMS 0581 and TME 419) varieties. Journal of Agricultural Engineering L, 919. https://doi.org/10.4081/jae.2019.919. [18] Ajibefun, I. A. (2008), An evaluation of parametric and non-parametric methods of technical efficiency measurement: Application to small scale food crop production in Nigeria. Journal of Agriculture and Social Sciences 4(3), 95–100. [19] Bidlot, J-R., Abdalla, S., Hersbach, H. (2017), ERA5 wave data. Proceedings from the 19th EGU General Assembly. 23–28 April 2017, Vienna, Austria, pp. 8707. [20] Adeyemo, A. J., Akingbola, O. O., Ojeniyi, S. O. (2019), Effects of poultry manure on soil infiltration, organic matter contents and maize performance on two contrasting degraded alfisols in southwestern Nigeria. International
Understanding the influence of maize (Zea mays) and cowpea…
[21]
[22]
[23] [24]
[25] [26]
[27]
[28]
[29]
[30]
[31]
[32]
63
Journal of Recycling of Organic Waste in Agriculture 8, 73–80. https://doi. org/10.1007/s40093-019-0273-7. Akingbola, O. O., Adeyemo, A. J., Oladele, S. O., Ojeniyi, S. O. (2016), Physical status and infiltration dynamics of tropical Alfisol of South-Western Nigeria as affected by poultry manure. Applied Tropical Agriculture 21(3), 102– 111. https://www.futa.edu.ng/journal/home/paperd/90/5/11 (accessed on: 12 December 2019). Wösten, J. H. M., Lilly, A., Nemes, A., Le Bas, C. (1999), Development and use of a database of hydraulic properties of European soils. Geoderma 90, 169–185. Hillel, D. (1980), Fundamentals of soil physics. New York: Academic Press. Gee, G. W., Bauder J. W. (1986), Particle-size analysis. In: Klute, A. (ed.), Methods of soil analysis. Part 1. Physical and mineralogical methods. 2nd ed. SSSA Book Series 5. ASA and SSSA, Madison. 383–411. http://dx.doi. org/10.1108/09593840110411167. Okalebo, R. J., Gathua, K. W., Woomer, P. L. (2002), Laboratory methods of soil and plant analysis: A working manual. Nairobi, Kenya: Sacred Africa. Blake, G. R., Hartge, K. H. (1986), Bulk density. In: Klute, A. (ed.), Methods of soil analysis: Part I. Physical and mineralogical methods. ASA, Madison, WI. 363– 375. Yhang, W., Wang, Y., He, C., Tan, X., Han, Z. (2019), Soil water content and temperature dynamics under grass land degradation: A multi-depth continuous measurement from the agricultural pastoral ecotone in Northwest China. Sustainability 11, art. nr. 4188. https://doi.org/10.3390/su11154188. Nciizah, A. D., Wakindiki, I. I. C. (2015), Physical indicators of soil erosion, aggregate stability and erodibility. Archives of Agronomy and Soil Science 61(6), 827–842. https://doi.org/10.1080/03650340.2014.956660. Lv, C., Bi, R., Guo, X., Chen, D., Guo, Y., Xu, Z. (2020), Erosion characteristics of different reclaimed substrates on iron tailings slopes under simulated rainfall. Scientific Reports 10, art. nr. 4275. https://doi.org/10.1038/s41598020-61121-z. Howe, J. A., Barrientos-Velazquez, A. (2020), Teaching water movement in soil through experiential activities. Natural Sciences Education 49(1), e20012. https://doi.org/10.1002/nse2.20012. Merz, B., Plate, E. J. (1997), An analysis of the effect of spatial variability of soil and soil moisture on runoff. Water Resources Research 33, 2909–2922. https://doi.org/10.1029/97WR02204. Western, A. W., Zhou, S. L., Grayson, R. B., McMahon, T. A., Bloschl, G., Wilson, D. J. (2004), Spatial correlation of soil moisture in small catchments and its relationship to dominant spatial hydrological processes. Journal of Hydrology 286, 113–134. https://doi.org/10.1016/j.jhydrol.2003.09.014.
64
Akingbola, Akinbile, Ojeniyi
[33] Chapuis, R. P. (1990), Sand-bentonite liners: Predicting permeability from laboratory tests. Canadian Geotechnical Journal 27, 47–57. [34] Sivapullaiah, P., Sridharan, A., Stalin, V. (2000), Hydraulic conductivity of bentonite-sand mixtures. Canadian Geotechnical Journal 37, 406–413. [35] Komine, H. (2008), Theoretical equations on hydraulic conductivities of bentonite-based buffer and backfill for underground disposal of radioactive wastes. Journal of Geotechnical and Geoenvironmental Engineering 134, 497–508. [36] Ghanbari, A., Dahmardeh, M., Siahsar, B. A., Ramroudi, M. (2010), Effect of maize (Zea mays L.) – cowpea (Vigna unguiculata L.) intercropping on light distribution, soil temperature and soil moisture in arid environment. Journal of Food, Agriculture and Environment 1, 102–108. https://doi. org/10.1234/4.2010.1458. [37] Akingbola, O. O., Dayo-Olagbende, G. O., Ojeniyi, S. O. (2020), Differentiated short-term influence of plant and animal based biochar on the microaggregation of two texturally soils. Sustainability in Food and Agriculture 1(2), 48–52. https://sfna.org.my/sfna-02-2020-48-52/ (accessed on: 24 July 2020). [38] Ampoorter, E., De Schrijver, A., Van Nevel, L., Hermy, M., Verheyen, K. (2012), Impact of mechanized harvesting on compaction of sandy and clayey forest soils: Results of a meta-analysis. Annals of Forest Science 69, 533–542. https://doi.org/10.1007/s13595-012-0199-y.
ACTA UNIVERSITATIS SAPIENTIAE AGRICULTURE AND ENVIRONMENT, 13 (2021) 65–76 DOI: 10.2478/ausae-2021-0006
Influence of triacontanol and salt stress on the growth and metabolism of spinach Bernát TOMPA,1 László FODORPATAKI1,2* 1
Hungarian Department of Biology and Ecology, Faculty of Biology and Geology, Babeş– Bolyai University, Cluj-Napoca, e-mails: 1 tompa_bernat@yahoo.com, 2 lfodorp@gmail.com Manuscript received 30 June 2021; revised 12 August 2021; accepted 15 August 2021 Abstract: A cost-effective enhancement of leafy vegetable yield and healthpromoting quality may be achieved by combining moderate stress conditions with the application of bioactive compounds. The aim of this work is to study how salt stress and triacontanol interact with each other in modulating vegetative growth, photosynthetic light use efficiency, carbon dioxide uptake, and chlorophyll and carotenoid pigment content of spinach plants grown under controlled conditions. Besides stimulating metabolic processes related to growth and photosynthetic production, treatments with 1 μM triacontanol once in three days significantly compensate for the deleterious effects of salt stress induced with 250 mM NaCl. Keywords: biostimulant, carbon assimilation, carotenoids, quantum yield, salinity
1. Introduction Environmental stress factors represent major limiting agents for crop plant growth and production, and they induce a network of several interrelated physiological changes which lead to improved tolerance through processes of metabolic acclimation leading to hardening. The metabolic plasticity of plants makes possible the biosynthesis of a wide range of bioactive compounds which confer protection against adverse environmental conditions, and at the same time they have beneficial effects on human health upon consumption, being considered health-promoting nutraceuticals [18, 21]. Many of these bioactive compounds accumulate in plants upon a moderate abiotic stress imposed during the preharvest period, being natural constituents of the defence system. This is why controlled abiotic stresses can be used as tools for improving the health-promoting quality of fruits and vegetables. Most of these nutraceuticals are non-nutrient
66
Bernát Tompa, László Fodorpataki
plant metabolites with a specific antioxidative capacity, thus conferring protection against the oxidative damages caused the by overaccumulation of harmful reactive oxygen species in living organisms, induced by the action of several abiotic stress factors. These health-promoting antioxidants include several carotenoid pigments, vitamins C and E, flavonoids, polyphenols, etc. [8, 18, 19]. One of the most frequent environmental stress factors that impairs crop production is high salinity of the soil water. It is estimated that about 33% of irrigated agricultural land are salinized, and it is expected that by 2050 around half of the croplands worldwide will become affected by increased salinity [10, 19]. In plants, salt stress has a short-term and a long-term component. Short-term effects are related to an osmotic imbalance due to impaired water uptake by the root system, and because of turgor loss they result in an inhibited growth of young organs. These effects may be counteracted by osmoregulation, while the synthesis of high amounts of compatible solutes consumes a large amount of metabolic energy, and this also contributes to growth reduction under high salinity. After a longer period of exposure to salt stress, accumulation of excessive amounts of sodium ions exerts an ionic toxicity because sodium inhibits several enzymes which function with potassium and because due to uptake competition sodium impairs mineral ion homeostasis, e.g. through potassium and calcium deficiency. These effects may be reduced by sequestration of sodium ions in the vacuoles or by their exclusion from the cytosol and cell organelles. Due to the accumulation of toxic amounts of different reactive oxygen species which overcharge the antioxidative defence system, an associated consequence of high salinity is oxidative stress [3, 5, 19]. Natural biostimulants as modulators of life processes in plants are promising alternatives to cope with yield losses caused by environmental stress. They promote plant growth and improve crop productivity without negative impacts on the environment. Their application allows the reduction of use of chemical fertilizers and pesticides, and crop production may be enhanced without genetic manipulations. Because they act as triggers for the plant’s natural defences, only small amounts are needed to increase stress tolerance [1, 4]. From among the various biostimulants, natural pure active compounds present advantages over extracts or other mixtures because their action mechanisms can be determined easier [7]. Triacontanol, a wax constituent of the plant cuticle, is such a natural biostimulant with still unelucidated action mechanism. It has a well-demonstrated role in overcoming environmental stresses such as drought, extreme temperatures, salinity, heavy metal toxicity, or acid mist [12, 20, 22]. Even under normal developmental conditions, in several crop plants and medicinal plant species, triacontanol stimulates growth, the activity of certain enzymes (e.g. nitrate reductase, carbonic anhydrase), mineral nutrient acquisition, fruit yield, and essential oil production. Some evidence suggest that it is able to specifically upregulate certain genes in the plant cell genome, genes which
Influence of triacontanol and salt stress on the growth and metabolism…
67
encode for important enzymes and for metabolic products involved in protection against abiotic stress factors [11, 16]. The aim of this study is to reveal interactions between salt stress and triacontanol in the physiological processes of spinach plantlets in order to improve growth, metabolic parameters, and content of health-promoting substances when high salinity impairs developmental conditions. The main question to be asked is whether the application of micromolar amounts of triacontanol results in stimulation of growth and photosynthesis and whether it is capable to counteract or to reduce deleterious effects of salt stress. The presumption is that triacontanol acts as a chemical signal that triggers specific reactions in plants [11], resulting in the stimulation of physiological processes and the enhancement of defence mechanisms under environmental stress conditions. A better knowledge of these effects may be applied in the optimization of crop production and quality for leafy vegetables. There is no available information in the literature about how spinach plants will react metabolically to triacontanol treatment and to the interaction of triacontanol with high salinity stress, which is the main reason why spinach was chosen as the biological material for the experiments besides its growing importance as a freshly consumed leafy vegetable.
2. Materials and methods The experiments were performed with a spinach cultivar (Spinacia oleracea ‘Viking’) frequently grown in the temperate regions of Europe. As a leafy vegetable, spinach is an important source of vitamins A, B9, C, E, and K1 and of magnesium, iron, and calcium in the human diet. It is less salt-sensitive than lettuce, which is another widely cultivated leafy vegetable, its stress tolerance being much better studied than in the case of spinach [5, 9, 18]. Seeds sterilized with 3% (w/v) sodium hypochlorite were pre-hydrated for 12 hrs with distilled water and germinated in Linhard vessels. After one week, plantlets with similar size – five for every experimental variant – were planted one by one in pots with perlite, watered regularly with Hoagland’s mineral nutrient solution (to avoid any nutrient deficiency) and kept for two weeks in a growth chamber (Sanyo MLR-351H) under a photosynthetically active photon flux density of 330 μmol m-2 s-1 for a daily photoperiod of 12 hrs, at 20 °C in the light period and 17 °C during the dark period, the relative air humidity being maintained constantly at 65% [3, 6]. The different treatments were applied on three-week-old plantlets and lasted for 15 days, being repeated once in three days. Each set consisted of five independent repetitions. Control plants were watered with Hoagland’s nutrient solution; some plants were exposed to 250 mM NaCl (p.a.) dissolved in the nutrient solution (the concentration was established in previous experiments as one that in young spinach plants induces a moderate salt stress upon long-term exposure), some other plants were treated with 1 μM triacontanol pulverized on leaves, while a fourth experimental group received simultaneously 250 mM NaCl
68
Bernát Tompa, László Fodorpataki
(in the nutrient solution) and 1 μM triacontanol (pulverized on leaves), once every three days. Growth conditions during the treatments were similar with those applied for seedling development after germination. Because spinach is a leafy vegetable, the fresh biomass of the vegetative shoot of five-week-old plants was chosen from among the various growth parameters to evaluate the influence of salt stress and triacontanol, separately and in combination. Conventional and pulse amplification modulated parameters of induced chlorophyll fluorescence were determined in vivo and in situ on the fourth fully developed leaf from the base of the stem, using an FMS-2-type chlorophyll fluorometer (Hansatech). On leaves which were dark-adapted for 10 min before measurements, the ground fluorescence (F0) was recorded upon application of a dim red light flash (0.1 μmol m-2 s-1), while maximum fluorescence was measured during a subsequent saturating light pulse (10,000 μmol m-2 s-1 for 0.5 s). Afterwards, the leaves were continuously exposed to actinic light of 800 μmol m-2 s-1, and the steady state fluorescence (Fs) was measured. A second saturating white light flash was used to determine the modulated maximum fluorescence (Fm’) in the light-adapted state [14, 17]. From among the several registered and calculated parameters of the induced chlorophyll fluorescence, the effective quantum efficiency of photosystem II, i.e. ΦPSII = (Fm’ – Fs) / Fm’ was used to evaluate the impact of treatment on the energetic performance of the light reaction of photosynthesis in the thylakoid membrane system of chloroplasts. This parameter reflects the proportion of the light energy absorbed by chlorophylls associated with photosystem II (PSII), which is used under the given growth conditions in photochemical reactions, which will conserve energy for being used in the carbon dioxide assimilation. Because it can give a measure of the rate of linear electron transport in the light reactions, it is considered an efficiency marker of the overall photosynthesis [17]. Leaf gas exchange parameters related to stomatal function and to carbon dioxide assimilation were also measured in vivo and in situ, on the abaxial surface of the same leaves on which chlorophyll fluorescence characteristics were determined, using a Ciras-2 type leaf gas exchange meter (PP Systems). In the measurement chamber, leaf temperature was maintained at 20 °C, relative air humidity was set to 65%, the carbon dioxide concentration was 400 μmol mol-1, and light intensity was 330 μmol m-2 s-1. Net photosynthetic carbon dioxide assimilation rate (Pn) was determined as an indicator of the plants’ capacity for primary biomass production [9, 23]. Photosynthetic pigments: chlorophyll a, chlorophyll b, and total carotenoids (carotenes and xanthophylls) were extracted with 80% (v/v) acetone from the same leaf blades that were used for chlorophyll fluorescence and gas exchange measurements. 0.25 g of leaves were finely homogenized in 5 mL 80% acetone, the mixture was centrifuged for 10 min at 4,000 g and 4 °C, and then the supernatant was used for absorbance measurements at 480 nm, 646 nm, and 663 nm with a UV-Vis spectrophotometer (Jasco), according to [15].
Influence of triacontanol and salt stress on the growth and metabolism…
69
The experiments and measurements were performed with five independently grown plants for every treatment type, and determinations of physiological and biochemical parameters were repeated three times. Statistical data analysis was done with the R statistical package (R Core Team 2019). The Shapiro–Wilk test was used for evaluating the normality of data distribution and Bartlett’s test for the homogeneity of variances. Data were represented as mean ± standard error (SE). The significant differences were determined with one-way ANOVA and Tukey’s HSD test. Values of P < 0.05 were considered statistically significant.
3. Results and discussions A. Shoot growth modulation Salt stress induced with 250 mM NaCl in the rhizosphere significantly inhibited the growth of the above-ground vegetative organs of young spinach plants (Figure 1). On the other hand, treatment with 1 μM triacontanol of non-stressed plantlets resulted in a highly increased shoot fresh biomass, which was more than twice higher as in control plants. When high salinity was combined with triacontanol addition, the bioactive compound completely annihilated the inhibitory effect of salt stress on vegetative growth and led to a moderate but statistically significant increment of the shoot fresh weight in comparison with the control group. Triacontanol not only compensated for growth reduction under salt stress but induced shoot growth stimulation in plants exposed to high salinity. Because spinach is a leafy vegetable, a better growth of the above-ground shoot fresh weight ensures an increased production even in the presence of high soil salinity, and application of micromolar concentrations of triacontanol makes this treatment cost-effective. Severe growth inhibition by salt stress was reported for several other crop plants in different developmental stages from germination to seed and fruit settlement [10, 19]. In wheat, salt-induced impairment of shoot fresh weight growth could be reduced with exogenously applied ascorbic acid [2], while in maize cultivars salt tolerance could be improved with thiamine, which was found to reduce the metabolic burden and to modulate antioxidant potential in salt-stressed plants [13]. As triacontanol is also a bioactive natural compound, such as ascorbic acid and thiamine, it may act similarly in modulating gene and enzyme activities during the acclimation of plants to adverse growth conditions. Both triacontanol (25 μM) and ascorbic acid were demonstrated to be effective seed priming agents, which induced salt tolerance in wheat seedlings [16]. An advantage of triacontanol as compared to ascorbate and thiamine is that it is effective even in micromolar concentration; so, much less bioactive compound is needed for treatments.
70
Bernát Tompa, László Fodorpataki
Notes: Vertical bars represent ± SE from the means (n = 5); different letters indicate statistically significant differences at P < 0.05.
Figure 1. Influence of high salinity (250 mM NaCl), of triacontanol treatment (1 μM TRIA), and of their combination on fresh shoot biomass of young spinach plants (Ø stands for the control group)
B. Effective light energy use efficiency of photosystem II In the healthy leaves of control spinach plants, the effective quantum efficiency of photosystem II (ΦPSII) exhibited values around 0.75, which represent a good use of incident light energy in the photochemical reactions of photosynthesis, occurring in photosystem II (which is the source of induced chlorophyll fluorescence and is the most sensitive type of photosystem to abiotic stress factors as compared to PSI). Treatment with 1 μM triacontanol did not cause any significant change in the value of this photosynthetic parameter, while exposure of plants to high salinity for 15 days induced a moderate but statistically significant decrease in the actual photochemical yield of photosystem II. When salt stress was combined with triacontanol treatment, this bioactive agent counteracted the negative influence of high salinity, leading to values of effective quantum efficiency similar to the control plants (Figure 2). These results suggest that triacontanol does not directly interfere with the light phase of photosynthesis, but it prevents the deleterious consequences of long-term salt stress for the use of light energy in the primary production of new organic metabolites. In some experiments conducted with other plants, salt stress did not cause any significant modification in the quantum efficiency of PSII [3, 16], while in others it reduced the actual energetic efficiency of PSII – e.g. in cucumber seedlings, by more than 20% after five days of salinity stress induced with only 65 mM NaCl [23]. In this case, application of 10 mM putrescine (a bioregulator from the group of polyamines) significantly alleviated this undesirable effect of salt stress. Similar results were reported when S-methylmethionine (vitamin U) was used as a priming agent to enhance the salinity tolerance of canola [6].
Influence of triacontanol and salt stress on the growth and metabolism…
71
0.85 1.8 0.75 0.7 0.65 0.6 0.55 0.5
Notes: Vertical bars represent ± SE from the means (n = 5); different letters indicate statistically significant differences at P < 0.05.
Figure 2. The effective quantum efficiency of photosystem II (ΦPSII) determined through induced chlorophyll fluorescence in leaves of spinach plants exposed to high salinity (250 mM NaCl), to triacontanol treatment (1 μM TRIA), and to their combination (Ø stands for the control group)
C. Net carbon dioxide assimilation of leaves Photosynthetic gas exchange of spinach leaves, determined through the net carbon dioxide assimilation rate (Pn), was drastically decreased by salt stress, while in non-stressed plants triacontanol caused a significant enhancement of net photosynthetic carbon assimilation rate related to stomatal gas exchange. When triacontanol was applied in salt-stressed plants, it somewhat alleviated the reduction of carbon dioxide uptake in leaves but could not re-establish the photosynthetic gas exchange values measured in control plants (Figure 3). The results reflect that high salinity and triacontanol affect in different directions the photosynthetic gas exchange and net carbon dioxide assimilation of spinach leaves: salt stress results in stomatal closure, which makes difficult the acquisition of sufficient carbon dioxide as the inorganic carbon source for the biosynthesis of organic compounds (but at the same time reduces water vapour loss through transpiration), while triacontanol enhances stomatal opening and thus facilitates the carbon dioxide supply for photosynthetic biomass production. When both chemical agents (sodium chloride and triacontanol) act together, the overall result is an intermediate stomatal opening, enabling the use of more carbon dioxide than under salt stress alone but less than under the influence of triacontanol in nonstressed plants. Similar results were reported for wheat, in which case the saline medium caused a significant reduction in several attributes of leaf gas exchange, while the application of ascorbic acid as a bioactive compound increased the carbon assimilation rate in both stressed and non-stressed plants [2]. Vitamin U was also found to alleviate the negative effects of short-term salt stress on the net
72
Bernát Tompa, László Fodorpataki
carbon dioxide assimilation of canola leaves [6]. Also, in young leaves of cucumber seedlings, the net photosynthetic carbon dioxide assimilation rate was reduced by high salt concentration, but this reduction was alleviated by putrescine used as a hardening agent [23].
Notes: Vertical bars represent ± SE from the means (n = 5); different letters indicate statistically significant differences at P < 0.05.
Figure 3. Influence of high salinity (250 mM NaCl), of triacontanol treatment (1 μM TRIA), and of their combination on the rate of net photosynthetic carbon dioxide assimilation (Pn) in spinach leaves (Ø stands for the control group)
D. Chlorophyll content Chlorophylls are connected with photosynthetic light use and with carbon dioxide assimilation because they are the main plant pigments which selectively absorb, transmit, and convert light energy that subsequently will be partly used for primary biomass production. In fully developed leaves of young spinach plants grown under constant photon flux density of photosynthetically active radiation, the total chlorophyll content (a + b) was significantly reduced by long-term exposure to high salinity. It was not modified by the application of triacontanol on leaves, but when salt stress was combined with triacontanol treatment, the bioactive compound partly compensated for the reducing influence exerted by the presence of 250 mM NaCl in the rhizosphere (Figure 4). Reduction of the chlorophyll content caused by salt stress may affect the acclimation of the photosynthetic apparatus to low light conditions because the number of lightharvesting pigment molecules in the antenna complexes of photosystems will be insufficient. Disturbances in biosynthesis and breakdown of chlorophylls caused by salt stress may have different results in different plant species and under different growth conditions. In some cases, e.g. in maize cultivars exposed for 35 days to 100 mM NaCl, an enhancement of chlorophyll content was reported in salt-stressed
Influence of triacontanol and salt stress on the growth and metabolism…
73
plants [13], while in lettuce, canola, and wheat leaves a pronounced salt stress resulted in a significant reduction of the chlorophyll content [5, 6, 16]. 4 3.5 3 2.5 2 1.5 1 0.5 0
Notes: Vertical bars represent ± SE from the means (n = 5); different letters indicate statistically significant differences at P < 0.05.
Figure 4. Chlorophyll content of fully developed spinach leaves grown under constant illumination and exposed to high salinity (250 mM NaCl), to triacontanol treatment (1 μM TRIA), and to their combination (Ø stands for the control group) Carotenoids, as the other type of photosynthetic pigments associated to chlorophylls, not only have a complementary role in the absorption of photosynthetically active blue light, but they also act as efficient protective agents against oxidative stress conditions related to the excessive formation of singlet oxygen and of alkylhydroxyl radicals [8]. Similarly to chlorophylls (even though they are synthesised through a different metabolic pathway), the total carotenoid content of spinach leaves was significantly diminished by salt stress, was not modified by triacontanol in non-stressed plants, and when high salinity was combined with triacontanol, the amount of carotenoids was higher than in salt-stressed plants but lower than in the control group (Figure 5). Because they are valuable health-promoting substances in the human diet (they are potent universal antioxidants, and some of them are essential organic micronutrients for the synthesis of vitamin A), the fact that triacontanol treatment ensures a less reduced carotenoid content of spinach leaves exposed to high salinity confers a higher quality (a higher nutraceutical content) of these leaves upon consumption. Similar results were obtained when green algal cells were exposed to water pollution with cadmium, and the reduction of carotenoid content caused by the accumulation of cadmium ions in the chloroplasts could be partly compensated with 5 μM triacontanol [20]. Some other bioactive compounds (e.g. vitamin B1, vitamin C, vitamin U) could also alleviate the adverse influence of salt stress on the carotenoid pigment content of leaves [2, 5, 8].
74
Bernát Tompa, László Fodorpataki
Notes: Vertical bars represent ± SE from the means (n = 5); different letters indicate statistically significant differences at P < 0.05.
Figure 5. Influence of high salinity (250 mM NaCl), of triacontanol treatment (1 μM TRIA), and of their combination on the carotenoid pigment content of spinach leaves (Ø stands for the control group)
4. Conclusions Triacontanol as a natural bioactive compound stimulates the growth of spinach and alleviates several negative metabolic effects of high salinity, enhancing physiological processes that result in better stress tolerance. Adverse effects of salt stress on shoot fresh biomass, on net carbon assimilation rate, on the effective quantum yield of photosystem II, and on the photosynthetic pigment content of leaves may be alleviated by 1 μM of triacontanol pulverized on leaves. These results may positively influence further research for revealing the action mechanism of triacontanol in plants, and a better understanding of its role in the enhancement of stress tolerance will enable farmers to improve spinach production in an environment-friendly manner and without any genetic manipulation, even under adverse growth conditions. The present results may also represent a starting-point to improve the content of health-promoting nutraceuticals in spinach leaves, which increases their value as leafy vegetables.
Influence of triacontanol and salt stress on the growth and metabolism…
75
References [1] Aranega-Bou, P., Leyva, M., Finiti, I., Garcia-Agustin, P., Gonzalez-Bosch, C. (2014), Priming of plant resistance by natural compounds. Hexanoic acid as a model. Front. Plant Sci. 5, 1–12. [2] Athar, H.-R., Khan, A., Ashraf, M. (2008), Exogenously applied ascorbic acid alleviates salt-induced oxidative stress in wheat. Environ. Exp. Bot. 63, 224–231. [3] Bartha, C., Fodorpataki, L., Martinez-Ballesta, M. C., Popescu, O., Carvajal, M. (2015), Sodium accumulation contributes to salt stress tolerance in lettuce cultivars, J. Appl. Bot. Food Qual. 88, 42–48. [4] Filippou, P., Tanou, G., Molassiotis, A., Fotopoulos, V. (2013), Plant acclimation to environmental stress using priming agents. In: Tuteja, N, Gill, S. S. (eds.), Plant Acclimation to Environmental Stress. New York: Springer. 1–27. [5] Fodorpataki, L., Holinka, B., Gyorgy, E. (2016), Priming with S-methylmethionine increases non-enzymatic antioxidant content of lettuce leaves exposed to salt stress. In: Asaduzzaman, M. (ed.), Controlled environment agriculture: Production of specialty crops providing human health benefits through hydroponics. New York: Nova Science Publ. 133–164. [6] Fodorpataki, L., Molnar, K., Tompa, B., Bartha, C. (2021), Exogenous S-methylmethionine alleviates salinity stress by modulation of physiological processes in canola (Brassica napus). Intl. J. Agric. Biol. 25, 11–19. [7] Garcia-Garcia, A. L., Garcia-Machado, F. J., Borges, A. A., Morales-Sierra, S., Boto, A., Jimenez-Arias, D. (2020), Pure organic active compounds against abiotic stress: A biostimulant overview. Front. Plant Sci. 11, 1–17. [8] Gill, S. S., Tuteja, N. (2010), Reactive oxygen species and antioxidant machinery in abiotic stress tolerance in crop plants. Plant Physiol. Biochem. 48, 909–930. [9] Han, S. J., Choi, I.-L., Kim, J. Y., Wang, L., Lee, J. H., Choi, K.-Y., Koo, Y. W., Kim, Y., Islam, M. Z., Lee, Y.-T., Kang, H.-M. (2019), Various light quality including QD-LED affect growth and leaf color of red romaine baby leaf lettuce. Not. Bot. Horti Agrobot. 47, 757–762. [10] Hasanuzzaman, M., Nahar, K., Fujita, M. (2013), Plant response to salt stress and role of exogenous protectants to mitigate salt-induced damages. In: Ahmad, P., Azooz, M. M., Prasad, M. N. V. (eds.), Ecophysiology and responses of plants under salt stress. New York: Springer. 25–88. [11] Islam, S., Mohammad, F. (2020), Triacontanol as a dynamic growth regulator for plants under diverse environmental conditions. Physiol. Mol. Biol. Plants 26, 871–883.
76
Bernát Tompa, László Fodorpataki
[12] Islam, S., Zaid, A., Mohammad, F. (2021), Role of triacontanol in counteracting the ill effects of salinity in plants: A review, J. Plant Growth Regul. 40, 1–10. [13] Kaya, C., Ashraf, M., Sonmez, O., Tuna, A. L., Polat, T., Aydemir, S. (2015), Exogenous application of thiamin promotes growth and antioxidative defense system at initial phases of development in salt-stressed plants of two maize cultivars differing in salinity tolerance. Acta Physiol. Plant. 37, 1729–1741. [14] Lichtenthaler, H. K., Buschmann, C., Knapp, M. (2005), How to correctly determine the different chlorophyll fluorescence parameters and the chlorophyll fluorescence decrease ratio Rfd of leaves with the PAM fluorometer. Photosynthetica 43, 379–393. [15] Lichtenthaler, H. K., Welburn, A. R. (1983), Determination of total carotenoids and chlorophylls a and b of leaf extracts in different solvents. Biochem. Soc. Trans. 11, 591–592. [16] Mahboob, W., Khan, M. A., Shirazi, M. U., Asma, S. F. (2019), Seed priming modulates germination potential, osmoprotectants accumulation and ionic uptake in wheat seedlings under salt stress. Intl. J. Agric. Biol. 22, 594–600. [17] Maxwell, K., Johnson, G. N. (2000), Chlorophyll fluorescence – A practical guide. J. Exp. Bot. 51, 659–668. [18] Oh, M.-M., Carey, E. E., Rajashekar, C. B. (2009), Environmental stresses induce health-promoting phytochemicals in lettuce. Plant Physiol. Biochem. 47, 578–583. [19] Singh, A., Rajput, V., Rawat, S., Singh, A. K., Bind, A., Singh, A., Chernikova, N., Voloshina, M., Lobzenko, I. (2020), Monitoring soil salinity and recent advances in mechanism of salinity tolerance in plants. Biogeosyst. Techn. 7, 66–86. [20] Tompa, B., Jakab, K., Fodorpataki, L. (2020), Triacontanol compensates for cadmium toxicity effects on growth and photosynthesis. Anal. Univ. Or., Fasc. Biol. 27, 123–128. [21] Toscano, S., Trivellini, A., Cocetta, G., Bulgari, R., Francini, A., Romano, D., Ferrante, A. (2019), Effects of preharvest abiotic stresses on the accumulation of bioactive compounds in horticultural produce. Front. Plant Sci. 10, 1–17. [22] Zaid, A., Asgher, M., Wani, I. A., Wani, S. H. (2020), Role of triacontanol in overcoming environmental stresses. In: Roychoudhury, A., Tripathi, D. K. (eds.), Protective chemical agents in the amelioration of plant abiotic stress: Biochemical and molecular perspectives. New Delhi: John Wiley & Sons. 491–509. [23] Zhang, R. H., Li, J., Guo, S. R., Tezuka, T. (2009), Effects of exogenous putrescine on gas-exchange characteristics and chlorophyll fluorescence of NaCl-stressed cucumber seedlings. Photosynth. Res. 100, 155–162.
ACTA UNIVERSITATIS SAPIENTIAE AGRICULTURE AND ENVIRONMENT, 13 (2021) 77–87 DOI: 10.2478/ausae-2021-0007
Preliminary study on species variability and evolutionary status of African walnut (Plukenetia conophora) Nwakuche Chinenye ONWUBIKO,1* Queen Ifeoma EMEREOLA,1 Chinyere Prisca ANYANWU,1 Grace Ovute CHIMDI2 1
Department of Crop Science and Technology, Federal University of Technology, Owerri 1526, Nigeria. 2
Department of Agricultural Technology, Federal Polytechnic Bauchi, Bauchi 0231, Nigeria *E-mail: nwakuche.onwubiko@futo.edu.ng
Manuscript received 13 July 2021; revised 22 August 2021; accepted 30 August 2021 Abstract: An analysis of the biochemical composition of African walnut seeds collected from two different geographical areas, Nigeria and Cameroon, was used to conduct the primary assessment of varietal differences and evolutionary status of Plukenetia conophora. The experiment was conducted at the Laboratory of Department of Biochemistry and Technology, Federal University of Technology, Owerri, Nigeria. The experimental design was completely randomized design with five replications. Significant difference (P > 0.05) was not observed with the proximate properties of the seeds of the two lines except for carbohydrate. However, higher values in protein (28.32%), crude fat (5.67%), ash (4.33%), and moisture (38.44%) content were obtained for the line from Nigeria, while the line from Cameroon had higher values for carbohydrate (20.87%) and crude fibre (9.32%). With regard to mineral composition, significant difference (P < 0.05) was observed in some mineral elements such as manganese, sodium, and chromium. Anti-nutritional composition such as proximate properties did not show any significant difference between the two lines. However, the line from Nigeria had higher values of phytate (6.27%) and oxalate (0.11%), while a higher content of tannin (0.36%) and saponin (0.27%) was obtained for the line from Cameroon. Evidently, the result obtained was not substantial to establish varietal differences between the two lines; nevertheless, it showed some level of evolutionary changes in the crop over the years. Keywords: African walnut, biochemical properties, variability, evolution
78
Onwubiko, Emereola, Anyanwu, Chimdi
Introduction Modern cultivated crops were developed from wild species. Over the years, certain changes occurred in wild species to convert them into modern cultivated crops. The development of both heritable and non-heritable features enabled the modernization of wild species. These features helped plants to adapt to and survive changes in different environments. Invariably, adaptable features of plants change periodically to reflect the current conditions of the environment they exist in. The development of adaptable features for different environments is one of the major factors that create differences in plants. This has led to species diversity and the evolution of plant varieties. Among other factors, mutation, hybridization, polyploidy, and selection are processes that can create differences in plants, and they can occur both naturally and artificially. The impact of these processes on the development of plant varieties has been reported [1, 2, 3], necessitating the periodical assessment of crops (especially semi-wild and wild economic plants) to determine the possible differences that may have occurred between and within species over the years. The establishment of varietal differences in crop species is very important in crop improvement programmes. This is very useful in germplasm management: in determining the best conservation and utilization methods of germplasm. Further, the assessment of varietal differences within species can be useful in determining the evolutionary status of crop species, especially among relatives of closely related species. In recent times, the assessment of intra- and interspecific variations between and within species have been successfully carried out through studies on nutritional composition of crops [4, 5]. The similarities and differences established in studies can be utilized in the botanical classification of crops. This can also help in determining the relatives of crop species, thereby facilitating simple classification. African walnut (Plukenetia conophora) is a shrub crop that is commonly found growing in semi-wild areas in the forest zones of Africa and India. This climbing shrub that grows between 10 and 20 ft long is popular and cherished for its nutritious edible nuts that are cooked and consumed as snacks [6, 7, 8]. African walnut has outstanding medicinal, nutritive, traditional, economic, and industrial qualities. Several studies have been carried out on the assessment of proximate, mineral, and phytochemical composition of African walnut [9, 10, 11, 12, 13], but none so far have reported the comparative evaluation of biochemical constituents of seeds of this crop collected from different agro-geographical areas. Hence, in this study, biochemical markers were used to assess the varietal differences in African walnut from two different locations. The established variation between the lines was used to investigate the evolutionary status of this crop, based on the report that mutation can alter the chemical content of plants [1].
Preliminary study on species variability and evolutionary status…
79
Materials and methods The materials comprised seeds of African walnut obtained from two different geographical areas, Nigeria and Cameroon.
Methods Sample collection Seeds of the Plukenetia conophora crop grown in Nigeria and Cameroon were used for the study. The source of the seeds was the germplasm collection of the Department of Crop Science and Technology, Federal University of Technology Owerri. Sample preparation These seeds of African walnut were first sorted and cleaned before being soaked in water for 20 hours, after which they were dehulled and dried. The testa was subjected to grinding in a mortar. The dehulled seeds were also subjected to grinding in a mortar. Both the ground testa and the ground cotyledons were used for analysis.
Proximate analysis This was carried out to determine the macronutrient in seed samples. The purpose was to evaluate the crude protein, moisture content, fat content, crude fibre, ash, and carbohydrate content in the seeds. Crude protein To determine the crude protein content of the Walnut seeds, the micro-Kjeldahl method, as stated in standard procedure (A.O.A.C. 2000), was used. This analysis was carried out in duplicate. Crude fibre The standard procedure (A.O.A.C. 2000) was used to establish the crude fibre content of the samples. It was carried out in duplicate and calculated as follows: Crude fibre (%) =
ிଵ ି ிଶ ௐ
x 100,
where F1 = weight before ignition, F2 = weight after ignition, w = weight of the sample before the analysis.
80
Onwubiko, Emereola, Anyanwu, Chimdi
Crude fat Crude fat was determined by soxhlet extraction according to the standard procedure (A.O.A.C. 2000). It was also carried out in duplicate and calculated as follows: Fat (%) =
ௌ ି ௌ ௐ
x 100,
where Sa = weight of flask before extraction, Sb = weight of the flask + oil after extraction, W = weight of the sample, Moisture content The moisture content of the walnut seeds was determined following the standard procedure (A.O.A.C. 2000). It was carried out in duplicate and calculated as follows: Moisture content (%) =
ெ௦ ିெ௧ ௐ
x 100,
where Ms = weight of the moisture can + sample before drying, Mt = weight of the moisture can + sample after drying, W = weight of the sample used. Carbohydrate The method used to determine the carbohydrate content was the nitrogen-free method by A.O.A.C. (2000). It was obtained by the calculation of weight difference between 100% and the summation of other proximate parameters such as extracts free of nitrogen or nitrogen-free extract (NFE). % Carbohydrate (NFE) = 100 % - (Mo + Pr + F1 + As + F2) Mo = moisture, Pr = protein, F1 = fat, As = Ash, and F2 = crude fibre. Ash The ash content of African walnut seed was obtained following the standard procedure (A.O.A.C. 2000). It was carried out in duplicate and calculated as follows: Ash contents (%) =
ଶ –ଵ ௐ
x 100,
where A2 = weight of crucible + sample before the addition of ash, A1 = weight of crucible + sample after the addition of ash, W = weight of the sample used.
Preliminary study on species variability and evolutionary status…
81
Anti-nutritional (phytochemical) analysis This was carried out to extract, screen, and identify the medicinally active substances found in seeds of African walnut. Oxalate To determine the oxalate content, two grams (2 g) of each of the walnut samples were placed in a 250 ml volumetric flask that was suspended in 190 ml of distilled water. To each sample, 10 ml of 6N HCL solution was added, then cooled, and it was filled with distilled water up to the 250 ml mark of the flask. The samples were filtered, and the duplicate portion of 125 ml of the filtrate was measured into the beaker. This was followed by the addition of four drops of methyl red indicator, after which cone ammonia solution drop-wise were added until the solution changed from pink to yellow. The solution was then heated to 90 0C, cooled and filtered to the precipitate containing ferrous ion. Again, the filtrate was heated to 90 0C, and 10 ml of CaCl2 solution was added while the sample was consistently being stirred. Then, the filtrate was dissolved in 10 ml of 20% H2SO4, which was diluted to 200 ml with distilled water. Aliquots of 125 ml of the filtrate were heated to near boiling and filtrated against 0.05 M KMnO4 solution to obtain a pink colour, which persisted for 30 sec. Determination of the oxalate contents of each sample was achieved by calculation. Phytate Two grams of each sample were weighed into a conical flask of 250 ml. The samples were soaked for 3 hrs in a conical flask with 100 ml of 2% Hcl, after which they were filtered with white man filter paper (No. 1). Fifty ml of each filtered sample was placed in a 250 ml beaker. Then, 10 ml of 0.3% ammonium thiocyanate solution was added to each sample’s solution as colour that persisted for 5 min. The phytate was calculated from the titre value. Saponin In a water bath, the suspension was heated for about 4 hours at about 55 oC while being stirred continuously. With 200 ml of 20% ethanol, the residue was reextracted after filtering the mixture. At about 90 oC in a water bath, the extracts that were combined were reduced to 40 ml. Twenty ml of diethyl ether was added to the concentrate and shaken vigorously after transferring it into a 250 ml separating funnel. The purification process was carried out twice by discarding the ethanol layer while the aqueous layer was being recovered. This was followed by the addition of 60 ml of n-butanol. With 10 ml of 5% aqueous sodium chloride, the combined n-butanol extracts were washed twice. The resultant solution was heated
82
Onwubiko, Emereola, Anyanwu, Chimdi
in a water bath for evaporation, and the sample was dried in an oven to get a constant weight. Using difference in weight, the saponin content was calculated. Tannin This was carried out by weighing out 500 milligrams of each sample into a 100 ml plastic bottle. To each sample, 50 ml of distilled water was added, and it was shaken for 1 hour with the help of a mechanical shaker. The resultant solution was filtered into a 50 ml volumetric flask and filled up to mark. This was followed by pipetting out 5 ml of the filtrate into a tube, then mixed with 3 ml of 0.1 M FeCl3 in 0.1N HCl, whereafter 0.008 M potassium ferricyanide was added. With a spectrophotometer at 120 nm wavelength, the absorbance rate was measured within 10 minutes. A blank sample was prepared, the colour also developed and was read at the same wavelength. A standard was prepared using tannin acid to get 100 ppm and measured.
Mineral composition analysis The amount of K, Na, and Ca in African walnut seeds were determined by flame photometry according to the standard procedure. Iron content was determined by DREL/5 spectrophotometer in line with the standard procedure; likewise, magnesium content was determined by the EDTA method in accordance with the standard procedure. The colorimetric method was used to determine the Manganese, while Zinc was determined by the Zincon method – by the adoption of the standard methods for the examination of water and wastewater at a wavelength of 575 nm. To obtain the copper content, the standard procedure was applied (A.O.A.C. 2000).
Results The results of the proximate composition of the two lines of African walnut are presented in Table 2. It showed no significant difference (P > 0.01) for any of the two lines except for carbohydrate. However, the moisture content of the line sourced from Nigeria (38.44%) was higher than that from Cameroon (36.21%); equally, the crude protein (28.32%) and ash (4.33%) content of the line from Nigeria was higher than that of the line from Cameroon (crude protein: 0.11%, ash: 3.63%). Contrarily, the crude fibre (9.32%) and crude fat (4.73%) content of the line from Cameroon was higher than that from Nigeria (crude fibre: 8.78%, crude fat: 4.73%). The mineral composition results of the lines (Table 3) showed that some mineral elements, such as magnesium, sodium, and chromium, had significant differences (P < 0.01) between the two lines. Contrarily, other mineral elements, such as calcium, iron, potassium, manganese, and copper, did not show any significant
Preliminary study on species variability and evolutionary status…
83
difference. This result further showed that the line from Nigeria had higher content of calcium (26.07mg/l), potassium (120.00mg/l), zinc (0.83mg/l), and copper (1.01mg/l) than the line from Cameroon (calcium: 8.87mg/l, potassium: 100.00, zinc: 0.558mg/l, copper: 1.013mg/l). On the other hand, the iron (0.0140mg/l) and copper (1.76) content of the line from Cameroon was higher than that from Nigeria (iron: 0.120mg/l, copper: 1.01). The ANOVA results of the anti-nutritive (phytochemical) composition of the seeds of two lines (from Nigeria and Cameroon) of African walnut did not show any significant difference (P > 0.01) (Table 1). However, the phytate (0.27%) and oxalate (0.11%) content of the line from Cameroon was higher than that from Nigeria (phytate: 0.06%, oxalate: 0.03%). On the other hand, the tannin content of the line from Nigeria (0.36%) was higher than that from Cameroon (0.31%); likewise, the saponin content of the line from Nigeria (0.27%) was also higher than that from Cameroon (0.235%). Table 1. Results of the anti-nutritional composition of the two African walnut lines Treatments
Phytate %
Oxalate %
Tannin %
Saponin %
Nigeria
0.066
0.034
0.361
0.275
Cameroon
0.270
0.113
0.314
0.235
LSD (0.05)
ns
ns
ns
ns
Table 2. Results of the proximate analysis of the two African walnut lines Treatments
Protein % Crude fibre %
Fat %
Ash %
Moisture %
Carbohydrate %
Nigeria
28.38
8.78
5.67
4.33
38.44
14.46
Cameroon
25.33
9.32
4.73
3.63
36.24
20.87
LSD (0.05)
ns
ns
ns
ns
ns
ns
Cameroon
8.87%
25.23
0.14
100.00
LSD (0.05)
2.44
ns
ns
ns
Note: ns = not significant.
3.70
2.43
1.30
0.40
ns
2.007
Silicon %
120.00
Zinc %
Potassium %
0.12
Chromium %
Iron %
26.07
Copper %
Calcium %
2.27%
Sodium %
Magnesium %
Nigeria
Manganese %
Treatments
Table 3. Results of the mineral composition of the two African walnut lines
1.013
0.71
0.83
0.01
1.765
1.76
0.55
0.15
ns
0.43
84
Onwubiko, Emereola, Anyanwu, Chimdi
Discussion Fruits and nuts play a very important role in the nutrition and diet of rural dwellers. They are the major source of vitamins and minerals for most people living in rural areas. These fruits and nuts are usually obtained from wild and semi-wild plants because some people believe that they are better sources of vitamins and minerals than the genetically improved crop species. The nutritional value placed in food from these natural sources often attract people living in cities to rural areas. In this study, seeds of African walnut found in semi-wild areas of Nigeria and Cameroon were used to investigate varietal differences based on proximate, mineral, and anti-nutritional composition. Proximate analysis results of the two lines of African walnut did not show any significant difference except for carbohydrate. This implies that the nutrient content of the line from Nigeria was the same as that from Cameroon except for their carbohydrate content. This result indicates that there is little or no difference between the two lines. The significant difference observed in carbohydrate content is not adequate for establishing varietal difference between the two lines. However, the results of this study showed that the protein, crude fibre, ash, and moisture content of the two lines varied. In addition, no single line had a higher content of these elements than the other one. This result may have some implications for the evolutionary status of this crop. Generally, it was observed in this study that the seed of African walnut is a rich source of protein, carbohydrate, and fat. Several workers reported that any food plant that can provide 12% or more of its energy from protein is considered a valuable protein source [8, 14]. Invariably, this study has shown that African walnut is an energy-rich food substance. This is in agreement with the report of other workers that this crop is an excellent source of polysaturated fatty acids, such as alpha linoleic acid, it contains Omega-3 essential fatty acids, and it also provides more Omega-3 per pound than any other food [14, 15, 16]. African walnut therefore can play a vital role in providing food security to people living in rural areas. Previous studies on the proximate analysis of African walnut seed have reported a similar result [12, 15, 16, 17, 18, 19, 20, 21]. The results of mineral composition showed significant differences (P > 0.01) in few elements, such as magnesium, sodium, and chromium, between the two lines. The composition of other mineral elements (calcium, iron, potassium, manganese, and copper) was statistically the same for the two lines. Seemingly, it can be deduced that some level of variation exists between the two lines of African walnut based on the result of the mineral elements that showed significant differences between the two lines. However, this result is not conclusive enough to clearly establish varietal differences between the lines, but it may suggest that the evolutionary status of this crop is not static. Again, the fact that the content of the other mineral elements that did not show significant difference between
Preliminary study on species variability and evolutionary status…
85
the two lines were not the same also showed that evolutionary changes are in progress in the crop. The details of this result showed that African walnut contains essential vitamins and minerals such as magnesium, iron, calcium, copper, zinc, and manganese. Some researchers have reported a similar result on the mineral composition of African walnut [8, 14], and these mineral elements play a very important role in boosting the immune system of the body as well as in preventing anaemia [22]. Analysing the composition of the anti-nutritive content of the two African walnut lines did not show any significant difference contrarily to the results of the proximate and mineral composition, which showed varying levels of significant differences in their content. This implies that there was no variability between the lines based on their anti-nutritive composition. However, the details of this result showed that the anti-nutritive constituents of the two lines were again not the same. The line from Nigeria had a lower content of phytate and oxalate, while the tannin and saponin content of the line from Cameroon was higher. Generally, the low content of tannin (0.31%), phytate (0.06%), oxalate (0.03%), and saponin (0.27%) was observed in the two lines. A previous study examining the phytochemical composition of boiled nuts of this crop reported a similar result [21]. The low content of anti-nutrients in African walnut implies that it is good for human consumption. Udedi et al. (2014) [16] suggested serving the nut of this crop as a food supplement in school children feeding programmes. In summary, results of this investigation have shown that neither the line from Nigeria nor the one from Cameroon had consistently higher values in proximate, mineral, and anti-nutrient composition. Therefore, the result of biochemical constituents of the investigated two lines of African walnut was not adequate for establishing varietal differences. However, the observed few significant differences in the biochemical composition (proximate and mineral elements) of the two lines suggest that the development of African walnut into diverse ecotypes is under way, although at a very slow pace. These two lines of African walnut have been in existence in these areas for many years [9, 23], and the expectation was that over the years the two lines should have significantly developed into different forms that can be established through assessing the biochemical content of their seeds. According to Singh et al. (1996) [24], the production of certain biochemical components is a reflection of genetic variation, which may account for variations observed in some morphological attributes such as leaflet size and colour.
86
Onwubiko, Emereola, Anyanwu, Chimdi
References [1] Allard, R. W. (1999), Principles of plant breeding (2nd edition). John Wiley and Sons, Inc. [2] Uguru, M. I. (2005), Crop genetics and breeding (revised ed.), Nsukka: Epharate Press. [3] Alix, K., Gerard, P. R., Schwarzacher, T., Heslop-Harrison, J. S. (2017), Polyploidy and interspecific hybridization: Partners for adaptation, speciation and evolution in plants. Annals of Botany 120, 183–194. [4] Varga, F., Carović-Stankoab, K., Ristić, M., Grdiša, M., Liber, Z., Šatovićab, Z. (2017), Morphological and biochemical intraspecific characterization of Ocimum basilicum L. Industrial Crops and Products 109(15), 611–618. [5] Alghamdi, S. S., Khan, M. A., Migdadi, M. H., EL-Harty, E .H., Afzal, M., Farooq, M. (2019), Biochemical and molecular characterization of cowpea using seed storage proteins and SRAP marker patterns. Saudi Journal of Biological Science 26, 74–82. [6] Enujiugha, V. N. (2003), Chemical and functional characteristics of conophor nut. Pakistan Journal of Nutrition 2(6), 335–338. [7] Srinivasan, A., Viraraghavan, T. (2008), Removal of oil by walnut shell media. Journal of Bioresource Technology 99, 8217–8220. [8] Edem, C. A., Dosunmu, M. I, Bassey, F. I. (2009), Determination of proximate composition, ascorbic acid and heavy metal content of African walnut (Tetracarpidium conophorum). Pakistan Journal of Nutrition 8(3), 225–226. [9] Ajaiyeoba, E. O., Fadare, D. A. (2006), Antimicrobial potential of extracts and fractions of the African walnut (Tetracarpidium conophorum). African Journal of Biotechnology 5(22). [10] Isong, N., Alozie, Y. E., Ekwere, Y. (2013), Physicochemical properties of African walnut (Tetracarpidium conophorum) oil and its suitability for domestic and industrial uses Nigerian. Journal of Agriculture, Food and Environment 9(3), 12–15. [11] Apeh, V. O., Agu, C. V., Ogugua, V. N., Uzoegwu, P. N., Anaduaka, E. G., Rex, T. E. (2014), Effect of cooking on proximate, phytochemical constituents and hematological parameters of Plukenetia conophorain male albino rats. European Journal of Medicinal Plants 4(12), 1388–1399. [12] Akpoghelie, J. O., Esemedafe, J. U., Okoh, R., Ugochukwu, G. C. (2016), The nutritional assessment of the walnut (Plukenetia conophora) seed purchased in an open market in Warri, Delta State. Nigeria. Journal of Chemical Society of Nigeria 41(1). [13] Igara, C. E., Omoboyowa, D. A., Uchegbu, R. I., Ahuchaogu, A. A. (2017), Phytochemical composition, proximate analysis and vitamin content of
Preliminary study on species variability and evolutionary status…
[14]
[15]
[16]
[17] [18]
[19]
[20]
[21]
[22]
[23] [24]
87
(Tetracarpidium conophorum) walnut [sic] seed. Chemistry Research Journal 2(5), 1–8. Kanu, A. M., Kalu, J. E., Okorie, A. C. (2015), Nutritional and health values of African walnut (Tetracarpidium conophorum). International Journal of Scientific & Technology Research 4(9). Udedi, S. C., Ani, O. N., Anajekwu, B. N., Igwilo, I. O., Ononamadu, C. J., Adindu, C. S., Okafor, U. M. (2013), Comparative proximate analyses of raw and cooked Plukenetia conophora (African walnut) found in Akwa, Anambra State, Nigeria. The Bioscientist 1(2), 114–118. Udedi, S. C., Ani, O. N., Anajekwu, B. N., Ononamadu, C. J., Igwilo, I. O., Ibeabuchi, C. G., Ifemeje, J. C., Lukong, C. B., Ogbuozobe, G. O. (2014), Nutritional composition and antioxidant activity of African walnut, Tetracarpidium conophorum. The Journal of Applied Biochemistry. Photon 107, 170–180. Bowsher, C., Steer, A. D., Tobin, A. (2008), Plant biochemistry. New York, NY: Garland Science. Ekwe, C. C., Ihemeje, A. (2013), Evaluation of physiochemical properties and preservation of African walnut (Tetracarpidium conophorum). Academic Research International 4(6), 501–512. Arinola, S. O., Adesina, K. (2014), Effect of thermal processing on the nutritional, anti-nutritional and antioxidant properties of T. conophrum. Journal of Food Processing 1–4. Oyekale, K. O., Odutayo, O. I., Esan, E. B., Ogunwemimo, K. O., Denton, O. A., Bolaji, D. T. (2015), Comparative studies on phytochemical and proximate composition of four morphological distinct segment of the conophor seedlings (Plukenetia conophora). Brazilian Journal of Biological Sciences 3, 91–100. Chickezie, U. N. (2017), Phytochemical and proximate compositions of Plukenetia conophora (African walnut) seeds. International Journal of Research Studies in Bioscience 5(10), 25–31. Ojobor, C. C., Anosike, C. A., Ani, C. C. (2015), Studies on phytochemical and nutritional properties of Plukenetia conophora (Black walnut) seeds. Journal of Global Biosciences 4(12), 1366–1372. Dalziel, J. M. (1937), The useful plants of West Tropical Africa. London: Whitefriars Press. Singh, A. K., Subrahmanyam, P., Santosh, G. (1996), Variation in a wild groundnut species, Arachis duranensis Krapov and W. C. Gregory. Genetic Resources and Crop Evolution 43, 135–142.
ACTA UNIVERSITATIS SAPIENTIAE AGRICULTURE AND ENVIRONMENT, 13 (2021) 88–99 DOI: 10.2478/ausae-2021-0008
Evolution of quality parameters of different lettuce (Lactuca sativa L.) varieties under unheated plastic tunnel Ágota KOVÁCSNÉ MADAR,1 Mária TAKÁCSNÉ HÁJOS2 1,2 University of Debrecen, Faculty of Agricultural and Food Sciences and Enviromental Management, Institute of Horticultural Science, 138 Böszörményi St., H-4032 Debrecen, Hungary; e-mail: 1 madar.agota@agr.unideb.hu; 2 hajos@agr.unideb.hu
Manuscript received 22 July 2021; revised 30 August 2021; accepted 12 September 2021 Abstract: The plastic tunnel can ensure a positive effect on the yield and quality of vegetables. In our experiment, we evaluated the following types and varieties of lettuce – heading type (‘Great Lakes 659’, ‘King of May’), non-heading type (‘Lollo Rossa’, ‘Lollo Bionda’), and cos type (‘Romaine lettuce’). The highest head weight was detected in ‘Great Lakes 659’ (373.97 g plant-1) and ‘Romaine lettuce’ (266.79 g plant-1) under an unheated plastic tunnel in springtime. Higher nitrate content (565.0 mg kg-1) was measured for ‘cos lettuce’, while lower values (425.50 mg kg-1) were measured for ‘Lollo Bionda’. Among the varieties, one of the highest dry matter content was also measured for ‘Great Lakes 659’ (8.52%). According to our results for lettuce production, ‘Great Lakes 659’ was detected as having a higher yield and dry matter content and a lower nitrate accumulation. Keywords: spring, yield, nitrate, SPAD, NDVI
1. Introduction Among the leafy vegetables, lettuce (Lactuca sativa L.) is the most important commercial vegetable and has the highest consumption in the world. Due to its high use in fast food, it is important for the grower to be able to produce lettuce of good quality with high yields [1]. The worldwide processing of lettuce and chicory is around 27 million tons, 73.7% of which being produced in Asia and 9.7% in Europe. In addition, lettuce has been recognized as a major food for its vitamin, mineral, and bioactive compounds such as phytochemicals (phenols, flavonoids, and carotenoids) [2]. Therefore, it can be an important component of a balanced diet. However, lettuce can accumulate a rather high amount of nitrate. This process
Evolution of quality parameters of different lettuce (Lactuca sativa L.)…
89
depends on the nitrate content of the soil, light intensity during the growing period, and genetic factors [3]. European countries have set acceptable levels for nitrate accumulation in some vegetables (EU Limits for Nitrate, from Commission Regulation (EU) No 1258/2011). The maximum nitrate accumulation limits in fresh lettuce (Lactuca sativa L.) grown under cover and in open field, except for iceberg lettuce, are the following: in the autumn (harvested from 1 October to 31 March) – for lettuce grown under cover 5,000 mg NO3 kg-1 and in the open air 4,000 mg NO3 kg-1; in the summer (harvested from 1 April to 30 September) – for lettuce grown under cover 4,000 mg NO3 kg-1 and in the open air 3,000 mg NO3 kg-1; for the iceberg lettuce type grown under cover 2,500 mg NO3 kg-1 while in the open air 2,000 mg NO3 kg-1 [4]. In addition, a positive correlation between chlorophyll and nitrate content in vegetables has been reported in some studies. Based on this relationship, it is possible to determine the nitrogen status of plants using nondestructive chlorophyll measuring instruments [5]. Some devices are suitable for measuring the relative chlorophyll content such as the Minolta SPAD-502 device, with which we can determine this parameter quickly and without destruction [6]. Determining the time of harvest is an important factor because early harvest reduces yield and quality [7]. A wide range of physical parameters of the plants is used to estimate the degree of ripeness: head length, head width, diameter, and compactness. These parameters are used as a general maturation index [8]. In some studies, the measurement of NDVI has been used to estimate plant biomass [9]. The leafy head is a major feature of leafy vegetables and consists of curved leaves and these shapes’ ratio of diameter and height of the head (shape index) [10]. Our aim was to evaluate different lettuce species in spring cultivation and to recommend the appropriate species based on their quality properties such as head weight, shape index, nitrate accumulation, or dry matter content.
2. Materials and methods The experiment was conducted in the Botanical and Exhibition Garden of the Farm and Regional Research Institute at the University of Debrecen, under an unheated plastic tunnel (in the springs of 2019 and 2020), on limestone chernozem soil. For the evaluation, we examined two heading lettuces, i.e. crisphead (‘Great Lakes 659’) and butterhead (‘King of May’). We also evaluated non-heading lettuces (‘Lollo Bionda’, ‘Lollo Rossa’) and cos lettuce (‘Romaine lettuce’) in two growing seasons. The sowing was performed in 84-cell trays on 9 March 2019 and 12 March 2020. During these periods, Previcur® Energy was applied at a dose of 3 ml m-2 against damping off. In addition, it should be noted that conventional (non-coated) seed was used in the first year and pelleted (coated) seed in the second year.
90
Ágota Kovácsné Madar, Mária Takácsné Hájos
The experiment design was a randomized block design with four replications. The 5-6-leaf seedlings were planted out in a 25 x 25 cm space on 9 April 2019 and 10 April 2020 under the unheated plastic tunnel. Three times during the vegetation period, Ferticare (24:8:16 + 3.8 MgO + microelement) was used in 0.75% concentration. In both years, the harvest was carried out two months after the planting date (23 May 2019; 21 May 2020). The measurement was realized for the following parameters: leaf shape index (length/width), head shape index (height/diameter), and closing of the base on the scale 1–5 (1 – open … 5 – completely closed). Furthermore, we measured the head weight (g per plant) and stem length (cm). Measurement of photosynthesis activity: – SPAD value (Minolta SPAD-502) – easy non-destructive measurement of the chlorophyll content of plant leaves without damaging the leaves; – NDVI value (Green Seeker Model 505) – can be used to monitor crop growth and development. Laboratory measurements: – Total dry matter content (%) – it was determined after drying at 105 °C until constant weight. – Nitrate content (mg kg-1) – MSZ EN 12014-7:1999. Determination of nitrate and/ or nitrite content – Part 7: continuous flow method for the determination of nitrate content of vegetables and vegetable products after Cadmium reduction.
Statistical analysis Statistical analyses were performed using SPSS software (version 25). The data were submitted for analysis of variance (ANOVA). The differences between the data at a significance level of 5% (0.05) were determined by post-hoc Tukey’s test (n = 20). Pearson’s correlation coefficient between some pairs of data was also calculated. The correlation was significant at p ≤ 0.05 and p ≤ 0.01 levels (2-tailed). Temperature and humidity data were measured at two characteristic times of the growing period, in the morning (between 8 and 9 a.m.) and in the afternoon (between 1 and 2 p.m.) in order to check the lower and higher temperature intervals of the active photoperiodic phase. Nearly the same temperature values were measured at the two-assimilation period in 2019 and 2020, as shown in Figure 1. In the first year, the temperature was 16.53 ± 5.88 °C in the morning and 27.48 ± 4.23 °C in the afternoon. In the second year, a slightly higher value was measured in the morning (16.99 ± 5.85 °C) and in the afternoon (28.82 ± 4.42 °C). Furthermore, in the first season, we measured a little higher humidity (a.m.: 64.67 ± 9.27%; p.m.: 41.56 ± 7.99%) than in the second year (a.m.: 56.76 ± 12.75%; p.m.: 34.29 ± 9.42%). The optimum relative humidity is 70–75% for lettuce – at these values, the
Influence of triacontanol and salt stress on the growth and metabolism…
91
fastest growth rate is achieved. In our experiment, the lower humidity influenced the lettuce development, by slowing it. Comparing the two growing seasons: in 2019, there was less radiation (139.74 ± 58.86 W m-²) than in 2020 (176.97 ± 49.96 W m-²), as shown in Figure 2. In the second year, higher light radiation may have had a positive effect on lettuce development. In general, under better light conditions, lettuce improvement was faster.
Figure 1. Temperature (°C) and humidity (%) data during the growing season in 2019 and 2020
Figure 2. Solar radiation (W m-2) during the growing seasons
92
Ágota Kovácsné Madar, Mária Takácsné Hájos
3. Results and discussions One of the most important quality parameters of the fresh market is the head weight of the lettuce. The length of the inner stem can determine the number of leaves, which also affects the head weight. Based on the data of the two years, we measured much higher head weight and stem length values in the second growing season (Figure 3) due to the pelleted seeds, which resulted improved transplants. In addition, during this period, the light conditions were more favourable, which promoted better yield and head weight value of the lettuce. Basically, in 2019, a smaller stem length led to a smaller head weight, while in 2020 a larger stem length led to a higher head weight. Furthermore, concerning the average of the two years, we found a strong correlation (r = 0.719) relationship between head weight and stem length. One study reported that butterhead lettuce harvested at the optimal maturity stage had a fresh weight of 200–300 g head-1 [8]. In our experiment, this head weight was realized in both years. The highest head weight was measured among the heading form varieties of ‘Great Lakes 659’, which was statistically proved. Among the loose leaf varieties, we found higher head weight (178.56 ± 12.71 g plant-1; 276.12 ± 23.04 g plant-1) in ‘Lollo Bionda’. Researchers measured the highest leaf weight (12.98 and 15.91 g) on days 107 and 114 after transplanting also for iceberg lettuce when compared to butterhead (6.1 and 15.33 g) and romaine lettuce (5.34 and 5.25 g) in autumn greenhouse cultivation [7].
Note: There is no significant difference between the lettuce varieties/types marked with the same letter according to Tukey’s test (P ≤ 0.05).
Figure 3. Relationship between lettuce head weight (g/plant) and stem length (cm) in 2019 and 2020
Influence of triacontanol and salt stress on the growth and metabolism…
93
The lettuce with a closed base is mainly resistant to Botrytis sp. and sclerotic infection. These pathogenic fungi infect hundreds of plant species around the world. Sclerotia penetrate the plant and infect mostly through the lower senescent leaves in contact with the soil. These fungi attack the lettuce at any stage of development and in all parts of the plant. These pathogens cause great problems in the world year after year, depending on the weather conditions and host plant. Thus, growers often use large amounts of fungicide treatment against diseases [11]. The closing of the base of the lettuce was evaluated on a scale of 1 to 5. One (1) indicates the open and five (5) the fully closed base. Basically, in the second year, we found a well-closed base part for each lettuce, as shown in Fig 4. During the experiment, it was established that the loose leaf type of lettuce (‘Lollo Bionda, ‘Lollo Rossa’) had a lower value for the closing of base than the heading type varieties (‘Great Lakes 659’, ‘Romaine lettuce’, ‘King of May’). This result was statistically proved in the two experimental years. The higher value of this morphological parameter (closing of base) is favourable because these varieties are less sensitive to soil-borne diseases.
Note: There is no significant difference between the lettuce varieties/types marked with the same letter according to Tukey’s test (P ≤ 0.05).
Figure 4. The closing of the base part of the lettuce (1–5 scale) in 2019 and 2020 In general, lettuce should be harvested when the heads are well-formed and firm. The lettuce is graded by size and firmness, while non-heading lettuce is classified only by size [12]. The shape index (height/diameter) can determine the possible contact of the lower leaves with the soil. Varieties with upright leaves are more suitable for growing because they can be less infected by fungal diseases. In cos lettuce (‘Romaine lettuce’), a longer head and leaf shape index was detected in both growing seasons (Figure 5). The ‘Lollo Bionda’ formed the typical flat-round head (0.61 ± 0.01).
94
Ágota Kovácsné Madar, Mária Takácsné Hájos
Researchers had detected that temperature and light intensity can determine the shape index. The experiment with the iceberg lettuce cv. ‘Adam’ proved that lower temperature and light intensity reduced the leaf shape index [13]. In our experiment, we measured a smaller leaf shape index (0.70 ± 0.03) under higher irradiation, while a larger leaf shape index (1.07 ± 0.05) was detected under lower irradiation for the iceberg lettuce cv ‘Great Lakes 659’. A strong correlation relationship (r = 0.862) was observed between the measured parameters concerning the average of the two years. Overall, a more compact head was found in the second year.
Note: There is no significant difference between the lettuce varieties/types marked with the same letter according to Tukey’s test (P ≤ 0.05).
Figure 5. The relationship between lettuce head shape and leaf shape index in 2019 and 2020 Based on the NDVI value, we are able to provide information for the vegetation cover of the growing area, which is possibly connected to yield. The relationship between the NDVI value and the head shape index was evaluated for 5 varieties (Figure 6). In the first year, a significant (r = 0.750) and in the second year a strong (r = 0.950) correlation was detected between these parameters. In both periods, a higher NDVI and head shape index was detected in cos lettuce (‘Romaine lettuce’). For iceberg and butterhead lettuce, smaller head shapes were measured in the second year; however, their head weight values were higher, as the head structure became more compact in the second growing season. Considering other environmental parameters to change the NDVI value: In a lettuce test plant experiment, different irrigation levels were set, and the treatments were determined based on the water holding capacity of the pots. During the development of lettuces, higher NDVI values were measured with higher irrigation level [14].
Influence of triacontanol and salt stress on the growth and metabolism…
95
Note: There is no significant difference between the lettuce varieties/types marked with the same letter according to Tukey’s test (P ≤ 0.05).
Figure 6. The relationship between lettuce head shape index and NDVI value in 2019 and 2020 Based on the SPAD value, we can also conclude the relative chlorophyll content and the condition of the plants. Statistically, the highest SPAD value was detected for ‘Romaine lettuce’ (42.87 ± 1.61 SPAD) and iceberg lettuce (41.77 ± 1.34 SPAD) in both years (Figure 7). These genotypes also had more intense green leaves, which are referred to as having higher chlorophyll content. While the lowest value (23.66 ± 0.71 SPAD) of the non-head-forming ones was measured in ‘Lollo Bionda’, the leaf of this variety also had a reduced green colour intensity. In one study, the SPAD value of lettuces was evaluated at different nitrogen levels at an average temperature of 26 °C. A higher SPAD value (approx. 40-50) was observed at higher nitrogen values (approx. 3.4-3.8%) [15]. In the case of lettuce, the increased (above-the-limit) nitrate content is one of the quality-reducing parameters, which can be influenced by the variety, the growing season, and the cultivation method. We also measured higher nitrate content for the more intense green leaves than for the light green leaf varieties. However, these values remained below the limit. In both years, the highest nitrate values were measured in ‘Romaine lettuce’ (565.00 ± 49.50 mg kg-1) and ‘King of May’ (542.00 ± 31.11 mg kg-1), as shown in Figure 8. Probably, these varieties are more sensitive to nitrate accumulation. In the case of the other types, their average nitrate content was 446.33 ± 24.96 mg kg-1. Concerning the average of the two years, we found a medium correlation (r = 0.540) between SPAD and nitrate content. In one study, the nitrate content of lettuce (for fresh matter basis) was measured in greenhouse spring cultivation (from 8 March to 6 April) on different days after transplanting. The highest value was measured by the continuous supply of nutrients while the lowest when it stopped 10 days before harvest [2].
96
Ágota Kovácsné Madar, Mária Takácsné Hájos
Note: There is no significant difference between the lettuce varieties/types marked with the same letter according to Tukey’s test (P ≤ 0.05).
Figure 7. Development of SPAD value for different types of lettuce in 2019 and 2020
Note: There is no significant difference between the lettuce varieties/types marked with the same letter according to Tukey’s test (P ≤ 0.05).
Figure 8. Nitrate content of different types of lettuce in 2019 and 2020 Dry matter content is an important aspect of the shelf life of vegetables. The higher value can ensure the proper quality of vegetables without loss of quality. In the two growing seasons, the highest dry matter content (9.52%) of the varieties was measured in ‘Romaine lettuce’, as shown in Figure 9. In the second year, better light conditions had a positive effect on the dry matter content of Lollo types. This period resulted in a much higher increase in dry matter content for these varieties compared to the other lettuce types.
Influence of triacontanol and salt stress on the growth and metabolism…
97
Note: There is no significant difference between the lettuce varieties/types marked with the same letter according to Tukey’s test (P ≤ 0.05).
Figure 9. Dry matter content of different types of lettuce in 2019 and 2020 Considering other cultivation technology factors such as fertilization for the development of dry matter content: It was found that the dry matter content of the plants was lower (4.5%) where the nutrient level had never been reduced. However, when the nutrient replenishments were stopped 10 days before the harvesting, the lettuces had the highest (5.9%) dry matter content [2]. In our experiment, the dry matter content was higher than those values.
4. Conclusions During the growing season, light conditions can greatly influence the development of the different lettuce types. Our two-year experiment has proved that different morphological parameters can influence the quality of lettuce. The spherical or oval shape of the head (height/diameter) is preferable for growing because they are less sensitive to soilborne diseases. In our experiment, the iceberg lettuce ‘Great Lakes 659’ (among the heading types) yielded better quality – higher head weight, dry matter, and lower nitrate content. Among the non-heading types, ‘Lollo Bionda’ yielded better quality: higher head weight, closed base, and a lower amount of nitrate.
Acknowledgements Publishing of this journal is supported by the Institute for Research Programmes of Sapientia Hungarian University of Transylvania.
98
Ágota Kovácsné Madar, Mária Takácsné Hájos
References [1] Moreira, M. A., Santos, C. A. P. D., Lucas, A. A. T., Bianchini, F. G., Souza, I. M. D., Viégas, P. R. A. (2014), Lettuce production according to different sources of organic matter and soil cover. Agricultural Sciences 5(2), 99–105. http://dx.doi.org/10.4236/as.2014.52013. [2] Tabaglio, V., Boselli, R., Fiorini, A., Ganimede, C., Beccari, P., Santelli, S., Nervo, G. (2020), Reducing nitrate accumulation and fertilizer use in lettuce with modified intermittent nutrient film technique (NFT) system. Agronomy 10(8), 1208. https://doi.org/10.3390/agronomy10081208. [3] Zandvakili, O. R., Barker, A. V., Hashemi, M., Etemadi, F., Autio, W. R., Weis, S. (2019), Growth and nutrient and nitrate accumulation of lettuce under different regimes of nitrogen fertilization. Journal of Plant Nutrition 42(14), 1575–1593. https://doi.org/10.1080/01904167.2019.1617313. [4] Commission Regulation (EU) No 1258/2011 amending Regulation (EC) No 1881/2006 as regards maximum levels for nitrates in foodstuffs. Barross, M. J. (2011), Official Journal of the European Union L 320/17 (last accessed: 06/10/2021). https://eur-lex.europa.eu/LexUriServ/LexUriServ.do?uri=OJ :L:2011:320:0015:0017:EN:PDF. [5] Tuncay, O. (2011), Relationships between nitrate, chlorophyll and chromaticity values in rocket salad and parsley. African Journal of Biotechnology 10(75), 17152–17159. https://doi.org/10.5897/AJB11.2646. [6] Zebarth, B. J., Younie, M., Paul, J. W., Bittman, S. (2002), Evaluation of leaf chlorophyll index for making fertilizer nitrogen recommendations for silage corn in a high fertility environment. Communications in Soil Science and Plant Analysis 33(5–6), 665–684. https://doi.org/10.1081/CSS-120003058. [7] Olfati, J. A., Saadatian, M., Peyvast, G., Malakouti, S. H., Kiani, A., PoorAbdollah, M. (2011), Effect of harvesting date on yield and quality of lettuce. Advances in Environmental Biology 5(7), 1647–1650. [8] Barg, M., Agüero, M. V., Yommi, A., Roura, S. I. (2009), Evolution of plant water status indices during butterhead lettuce growth and its impact on post-storage quality. Journal of the Science of Food and Agriculture 89(3), 422–429. https://doi.org/10.1002/jsfa.3462. [9] Pettorelli, N., Ryan, S., Mueller, T., Bunnefeld, N., Jędrzejewska, B., Lima, M., Kausrud, K. (2011), The normalized difference vegetation index (NDVI): Unforeseen successes in animal ecology. Climate Research 46(1), 15–27. https://doi.org/10.3354/cr00936.
Influence of triacontanol and salt stress on the growth and metabolism…
99
[10] Sun, X., Gao, Y., Lu, Y., Zhang, X., Luo, S., Li, X., Zhao, J. (2021), Genetic analysis of the “head top shape” quality trait of Chinese cabbage and its association with rosette leaf variation. Horticulture Research 8(1), 1–12. https://doi.org/10.1038/s41438-021-00541-y. [11] Wahab, H. A., Malek, A., Ghobara, M. (2020), Effects of some plant extracts, bioagents, and organic compounds on botrytis and sclerotinia molds. Acta Agrobotanica 73(2). https://doi.org/10.5586/aa.7321. [12] Gil, M. I., Tudela, J. A., Martínez-Sánchez, A., Luna, M. C. (2012), Harvest maturity indicators of leafy vegetables. Stewart Postharvest Rev. 8(1), 1–9. [13] Lee, R. J., Bhandari, S. R., Lee, G., Lee, J. G. (2019), Optimization of temperature and light, and cultivar selection for the production of high-quality head lettuce in a closed-type plant factory. Horticulture, Environment, and Biotechnology 60(2), 207–216. https://doi.org/10.1007/s13580-018-0118-8. [14] Kizil, Ü., Genc, L., Inalpulat, M., Şapolyo, D., Mirik, M. (2012), Lettuce (Lactuca sativa L.) yield prediction under water stress using artificial neural network (ANN) model and vegetation indices. Žemdirbystė = Agriculture 99(4), 409–418. [15] Mendoza-Tafolla, R. O., Juarez-Lopez, P., Ontiveros-Capurata, R. E., Sandoval-Villa, M., Iran, A. T., Alejo-Santiago, G. (2019), Estimating nitrogen and chlorophyll status of Romaine lettuce using SPAD and at LEAF readings. Notulae Botanicae Horti Agrobotanici Cluj-Napoca 47(3), 751–756. https://doi.org/10.15835/nbha47311589.
ACTA UNIVERSITATIS SAPIENTIAE AGRICULTURE AND ENVIRONMENT, 13 (2021) 100–112 DOI: 10.2478/ausae-2021-0009
Field performance and survival of cocoa seedlings raised in different growing media M. M. AKPALU,1* G. K. OFOSU-BUDU,2 F. K. KUMAGA,2 K. OFORI,2 L. MINTAH3 1
Department of Ecological Agriculture, Bolgatanga Technical University, Bolgatanga – UE Region, Ghana 2
Department of Crop Science University of Ghana, Legon – Accra 3
Forest and Horticultural Research Centre – Okumaning, Kade
e-mail: aa.marilyn@yahoo.com, obuduster@gmail.com, fkumaga@ug.edu.gh, kofori@wacci.ug.edu.ug, lomintah@ug.edu.gh Manuscript received 30 July 2021; revised 10 September 2021; accepted 22 September 2021
Abstract: The medium from which seedlings are transplanted influences seedling growth and survival on the field. The objective of the experiment was to compare how growing media affect the growth and survival of cocoa seedlings under field conditions. The seedlings were raised in both soil and soilless media and were transplanted on the field in June, when they were six months old. The experimental design was a randomized complete block design with three different growing media: 1. top soil, 2. sawdust + poultry manure + rice husk biochar (70%:25%:5%), and 3. sawdust + poultry manure + municipal solid waste compost (50%:35%:15%). The cocoa seedlings were transplanted at a spacing of 3 m x 3 m at 12 plants per plot and each plot size measured 45 m x 45 m. Data were collected on plant height, leaf number, stem girth, leaf chlorophyll content, percentage of plants that shed their leaves, and percentage of survival. Results indicated that seedling survival at the onset and end of the dry season was significantly (P < 0.05) higher for seedlings transplanted from soilless media compared to those from the top soil treatment. Irrigation will be necessary to maintain high seedling survival when seedlings are transplanted from the top soil for a well-established plantation. Keywords: cocoa, growing media, transplanting, survival
Field performance and survival of cocoa seedlings raised…
101
Introduction The survival of seedlings at transplanting is partly dependent on the medium from which seedlings are transplanted. Poor-quality seedlings at the juvenile stage may result in the poor establishment of seedlings on the field, slow growth, and reduced survival percentage [1]. Soon after transplanting, seedlings essentially depend on active root water uptake, and when the leaf area increases, water demand also increases due to evapotranspiration. At this point, transplanted seedlings tend to rely heavily on root growth [2]. In Ghana, and in Africa in general, cocoa seedlings are mainly transplanted in June, when the rainfall is frequent and peaks in October [3]. In October, leaf development may be intense due to high rainfall. However, shortly after the dry season sets in in November, decrease in soil moisture at this period of growth results in high seedling mortality since plants are very sensitive to moisture stress at this stage [4]. Rapid root growth and ability to tap water during this phase of growth is vital to seedling survival and early establishment. The nursery growth medium that enhances root development would subsequently support agile root development after transplanting, thus the ability of the seedling to acclimatize in the new environment. Seedlings experience more drought when grown on organic soils as compared to soilless substrates [5], as the later enhances good root development. We, therefore, hypothesise that seedlings transplanted from soilless media will perform better on the field than those from the soil. The aim of this study was to compare the growth performance and survival of seedlings transplanted from soil and soilless growing media.
Methodology Experimental site: The experiment was carried out at the University of Ghana’s Forest and Horticultural Research Centre – Okumaning (60 05’ N; 00 05’ W), near Kade, in the Eastern Region. The centre is located about 175 km from Accra and about 150 m above sea level. It is located in the moist semi-deciduous vegetation zone of Ghana. Experimental design and treatments: The experimental design was a randomized complete block design (RCBD) with five replications. Seedlings used for the study were raised in different growing media for five months. These were: 1. top soil (control), 2. sawdust + poultry manure + rice husk biochar (70%:25%:5), and 3. sawdust + poultry manure + municipal solid waste compost (50%:35%:15%). Land preparation: The site has been previously cropped with plantain. Slashing was done after the few cocoa and rubber plants were felled and cleared. Stumps were removed using a pickaxe and packed at the edge of the field, and leaves were allowed to rot. The land was left for three weeks, during which the appearing weeds were sprayed with glyphosate. After the weeds died off, the site was divided into three blocks with three replications, which were lined and pegged.
102
Akpalu, Ofosu-Budu, Kumaga, Ofori, Mintah
Soil sampling: Soil samples were collected randomly at six different points in the field, using an auger, at the depths of 0–20 cm and 20–40 cm. The samples were taken to the laboratory to analyse their chemical and physical properties. Plantain as shade tree: Plantain suckers obtained from the FOHCREC nursery by way of plantain sucker multiplication in polybags had been planted one-two months before the cocoa seedlings were transplanted, so as to serve as shade trees for the young cocoa seedlings. Transplanting: Six-month-old cocoa seedlings were transplanted at a spacing of 3 m x 3 m into holes that were dug 25 cm deep. Polybags were removed carefully in order not to lose the medium around the root. The seedlings, together with the ball of growing media, were placed in the holes and covered firmly. A plot consisted of fifteen plants (5 x 3 planted in a rectangular pattern), and data were taken on the seedlings in the middle, bordered by 12 plants. Each plot measured 45 m x 45 m, was contiguous to other treatment plots, and the distance between plots was 3 m. The experiment was replicated three times with 180 plants per replicate, making a total of 540 plants occupying an area of 72 m x 72 m. Parameters measured: Plant height: This was measured using a metre rule; measurement was taken from the base of the plant to the apex. Leaf number: This was recorded by counting the total number of leaves per plant. Stem girth: This was measured 15 cm above the ground using electronic calliper. Chlorophyll content: This was measured using SPAD chlorophyll metre, and the leaf chlorophyll content was measured on the forth leaf from the apex at each side of the midrib. Plants that had fully shed their leaves were counted and divided by the total number of plants per plot. Percentage of survival: This was recorded by counting the number of plants alive divided by the total number of seedlings transplanted per plot multiplied by 100.
Results Table 1. Climatic data between June and December 2018 Months
June July August September October November December
Mean rainfall (mm)
257.8 110.8 86.6 213.4 245.5 92.2 21.8
Mean temperature (0C) Max.
Min.
31.7 30.6 30.5 31.3 33.1 33.4 33.6
22.0 22.6 21.7 22.2 22.2 22.0 21.8
Mean RH (%)
Max. (Night) 100.0 100.0 99.7 100.0 100.0 100.0 99.8
Min. (Day) 62.2 66.2 63.1 63.6 58.8 59.1 48.5
Solar Mean wind radiation speed (m/s) (MJ m-2)
13.8 10.4 10.4 10.7 13.8 14.0 13.0
0.30 0.27 0.29 0.30 0.29 0.27 0.25
Influence of triacontanol and salt stress on the growth and metabolism…
103
Table 2a. Soil physicochemical properties Soil depth
0–20 cm
20–40 cm
t-statistic
Porosity (%)
60.50
57.33
0.003
Bulk density (g/cm3)
1.15
1.16
0.721
pH
6.1
5.9
0.312
Ec (dS/m)
0.072
0.040
0.221
OC (%)
2.99
1.798
0.042
OM (%)
5.99
3.08
0.003
TN (%)
0.0083
0.0061
0.004
AP (mg/kg)
21.53
17.27
0.047
K
0.515
0.145
< 0.001
NH4-N (mg/kg)
2.480
1.558
0.011
NO3-N (mg/kg)
1.082
0.920
0.072
Table 2b. Exchangeable bases Soil depth
Ca (cmol(+)/kg)
Mg (cmol(+)/ kg)
K (cmol(+)/kg)
Na (cmol(+)/ kg)
CEC (cmol(+)/ kg)
0–20
4.47 (± 1.01)
3.18 (± 1.27)
0.49 (± 0.09)
0.01(± 0.00)
12.53 (± 2.57)
20–40
1.01 (± 0.35)
1.43 (± 0.53)
0.10 (0.00)
0.01 (± 0.00)
6.58 (± 2.22)
Influence of growing media on cocoa seedling stem girth and field establishment At transplanting, the stem girth was significantly (p = 0.007) bigger for SD + PM + RHB (9.24 mm), followed by top soil (7.65 mm) and SD + MSWC + RHB (7.44 mm), but there was no significant difference between the top soil treatment and that of SD + MSWC + RHB. One month after transplanting (MAT), no significant (p = 0.052) treatment effect was observed on the stem diameter, the top soil and SD + MSWC + RHB were on a par with the SD + PM + RHB-treated plants, and it was similar with 2 MAT. However, at 3 MAT, significant (p = 0.007) differences were recorded: SD + PM + RHB-treated seedlings recorded bigger stem girth (12.70 mm) than both top soil and SD + MSWC + RHB (1.20 and 1.20 mm). From 4 MAT to 6 MAT, no significant treatment effect was recorded (Figure 1).
104
Akpalu, Ofosu-Budu, Kumaga, Ofori, Mintah
Top soil
SD + PM + RHB (70:25:5)
SD + MSWC + RHB (50:35:15)
25
Stem girth (cm)
20 15 10 5 0 0
1
2
3
4
5
6
Months after transplanting
Figure 1. Influence of growing media on cocoa seedling stem girth and field establishment
Influence of growing media on the leaf number and field establishment of cocoa Leaf number at transplanting (0 MAT) was significantly (p = 0.002) high for SD + PM + RHB (24.8) treated seedlings, followed by the top soil (18.2) and SD + MSWC + RHB (16.6). There were no significant treatment differences between the top soil and SD + MSWC + RHB. The same trend was observed at 1 MAT, with SD + PM + RHB recording the highest leaf number (p = 0.007). From 2, 3, 4, 5, and 6 MAT, there were no significant treatment differences recorded in the leaf number produced (Figure 2). Top soil
SD + PM + RHB (70:25:5)
SD + MSWC + RHB (50:35:15)
35
Leaf number/plant
30 25 20 15 10 5 0 0
1
2
3
4
5
6
Months after transplanting
Figure 2. Influence of growing media on the leaf number and field establishment of cocoa
Influence of triacontanol and salt stress on the growth and metabolism…
105
Influence of growing media on plant height under field conditions Significant (p < 0.001) differences existed among growing media treatments in terms of plant height at transplanting, with SD + PM + RHB being the tallest (54.2 cm) followed by top soil (38.2 cm) and SD + MSWC + RHB (34.7 cm). However, no significant difference was recorded at top soil and on SD + MSWC + RHB. The same trend was followed at 2 and 3 MAT. At 4 MAT, plant height for top soil and SD + MSWC + RHB increased almost on a par with SD + MSWC + RHB; hence, no significant (p = 0.302) difference was recorded among the growing media treatments. At 5 MAT and 6 MAT, plant height for the three treatments was almost the same: top soil (74.7 cm), M2 (75.5 cm), and SD + MSWC + RHB (71.8 cm) (Figure 3). Top soil
SD + PM + RHB (70:25:5)
SD + MSWC + RHB (50:35:15)
100 90
Plant height (cm)
80 70 60 50 40 30 20 10 0 0
1
2
3
4
5
6
Months after transplanting
Figure 3. Influence of growing media on cocoa seedling height under field conditions
Influence of growing media on the leaf chlorophyll content of cocoa under field conditions Throughout the six sampling periods, no significant (P > 0.05) treatment effect was recorded. However, leaf chlorophyll content increased progressively from one month after transplanting, for all treatments, with SD + PM + RHB (38.2 cm) being slightly higher at 4 MAT, followed by top soil (35.7 cm) and SD + MSWC + RHB (33.2). At 5 MAT, the chlorophyll content of the top soil and of the SD + MSWC + RHB became slightly higher than that of the SD + PM + RHB. Then, at 6 MAT, the SD + PM + RHB (45.6 cm) became higher again, followed by the top soil (39.9 cm) and SD + MSWC + RHB (33.6 cm) treatments (Figure 4).
106
Akpalu, Ofosu-Budu, Kumaga, Ofori, Mintah
Top Soil
SD+MP+RHB (70:25:5)
SD+MP+RHB (50:35:15)
65
Chloropyll (SPAD)
55 45 35 25 15 5 1
2
3
4
5
6
Months after transplanting
Figure 4. Influence of growing media on the leaf chlorophyll content of cocoa under field survival
Influence of growing media on field survival and the establishment of cocoa at the onset of the dry season Some plants shed their leaves completely when the dry season started, and these were recorded as percentage per plot. Contrast showed significantly (p = 0.009) more seedlings transplanted from top soil medium (26.7%) shedding their leaves completely than those from SD + MSWC + RHB (6.7%) and SD + PM + RHB (4.0%) media treatments. The soilless media differed significantly (p = 0.006) from the soil: more plants shed their leaves upon soil medium treatment than in soilless media. The percentage of survival at the onset of the dry season was significantly (p = 0.013) higher for SD + PM + RHB (91.3%). Contrast established a significant (p = 0.007) difference between the survival rate for seedlings transplanted from soilless media and those from the soil at the onset of the dry season. The soil moisture measurements within 20 cm soil depth differed significantly (p = 0.007), showing higher values at the root zone of soilless-media-treated plants compared to those of the top soil treatment. Similarly, at 40 cm depth, soil moisture was significantly (p = 0.028) higher at the root zone of seedlings transplanted from the soilless media compared to those from the top soil (Table 3). The mean moisture content was significantly (p < 0.01) higher at the 40 cm depth (69.5 ± 5.2) cm) than at the 20 cm depth (29.9 ± 2.5 cm) (Table 4).
Influence of triacontanol and salt stress on the growth and metabolism…
107
Table 3. Influence of growing media on field survival and the establishment of cocoa at the onset of the dry season Treatment
Plants that shed their leaves (%)
Percentage of survival at the onset of DS
Percentage of survival after DS
Soil moisture (mm) (depth)
20 cm
40 cm
Top soil
26.7 ± 7.6
74.1 ± 2.7
56.4 ± 7.7
19.0 ±1.2
40.5 ± 4.0
SD + PM + RHB (70:25:5)
4.0 ± 2.7
91.3 ± 3.7
78.3 ± 4.7
19.1 ± 3.1
48.0 ± 6.7
SD + MSWC+ RHB (50:35:15)
6.7 ± 3.0
90.7 ± 3.9
89. 3 ± 3.0
17.8 ± 4.7
33.8 ± 7.9
0.006
0.007
0.020
NS
NS
NS
NS
NS
NS
NS
Contrast (P values) Soil vrs soilless M2 vrs M7
Table 4. Statistics for soil moisture content at 20 cm and 40 cm at the onset of the dry season Depth (cm)
Means (mm)
SE
20
18.6
± 1.7
40
40.8
± 3.8
t-statistic
P-value
-5.34
< 0.001
Discussion The soil analysis for the experimental site showed that the pH for the soil was slightly acidic, ranging from 5.9 to 6.1, which was favourable for the growth of cocoa [6]. The ECs were very low, which was excellent for the growth of cocoa according to Bauder et al. (2010). High EC affects water availability to plants notwithstanding the wetness of the soil. Organic carbon and organic matter were moderate according to [7]. At the time of transplanting, the SD + PM + RHB (70:25:5) treatment was superior in terms of height, stem girth, and leaf number; this growth media also produced seedlings with a long taproot and larger root volume. This agrees with [2], who stated that the type of substrate in which seedlings are grown greatly affects seedling morphology and physiology and subsequently influences field establishment. One month after transplanting, no significant differences were observed among the seedlings transplanted from the three different growing media, except for the
108
Akpalu, Ofosu-Budu, Kumaga, Ofori, Mintah
leaf number, which was significant for SD + PM + RHB. This could be attributed to the fact that root development in top soil and SD + MSWC + RHB may have been restricted in the container in which they were grown. Nevertheless, when they were transplanted to the field, they had the chance to develop their root to exploit further resources to their growth advantage. The physiological condition of a seedling before transplanting is a reflection of its root growth potential under certain conditions and time (Mattsson, 1986). The significant leaf number observed for SD + PM + RHB may be due to the nutritional status of the seedling before transplanting. [8] studied nursery nitrogen loading on the field performance of oak seedlings and argued that a greater reserve of N and K in nursery plants may be capitalized on in the field to accommodate subsequent sink demand with the ability to improve seedling field performance and establishment. This served as evidence in the nutrient uptake of this medium, as leaf N, P, and K concentration was higher in soilless-media-treated plants compared to soil-medium-treated plants. Two and three months after transplanting, however, no significant differences were observed for stem girth and the produced leaf number among seedlings transplanted from the three growing media, except for seedling height, which was significant for SD + PM + RHB. According to [9], high-quality seedlings signify their genetic potential and display significant height growth in the first year of transplanting, as they are able to gain control of the site faster. From four to six months after transplanting, no significant growth trait differences were observed in the plants among the three growing media treatments. This might be due to root development out of the supporting medium from which they were transplanted and that they were now capable of exploiting the soil volume for water and nutrients. Once this advantage has been achieved, the plant is able to develop to its full potential. Therefore, the effect of the type of substrate used in the field performance of seedlings might be notable only at the early stages of the growth of transplanted seedlings, rather than at later stages. Environmental conditions, such as high temperature and low humidity, may cause excessive transpiration from leaf surfaces; the growing medium that attracts much moisture into the root zone of plants might be advantageous to withstanding transplanting shock. This might be the case for SD + PM + RHB in the earlier stages of transplanting. The insignificant variations in leaf chlorophyll content among the growingmedia-treated plants after transplanting suggest that higher chlorophyll content was not necessarily a determinant of the growth of cocoa seedlings under field conditions. This is in line with [10], who pointed out that the chlorophyll fluorescence traits of cocoa leaf are indicators of extreme adaptation to shade conditions. Nevertheless, the leaf chlorophyll content of the treatments increased over time, indicating the growth of the photosynthetic apparatus towards high demand for assimilates. In their experiment on the effects of temperature and light integral on early vegetative growth and the chlorophyll fluorescence of four contrasting
Influence of triacontanol and salt stress on the growth and metabolism…
109
genotypes of cocoa, [11] argued that the measurement of leaf chlorophyll content is a valuable approach to evaluating plant responses to their environment during early vegetative growth. Some of the transplanted seedlings shed their leaves at the onset of the dry season, when they were exposed to moisture stress. This agrees with [12], who concluded that deciduous tree species alleviate the negative effects of water stress by shedding their leaves directly at the onset of the dry season. There was a decrease in the amount of rainfall, which marks the beginning of the dry season in December. The total amount of rainfall recorded in the month of December was relatively very low (6.9 mm) as compared to October (245.5 mm), the second peak period, and November (92.2 mm). Although soil moisture measured at the end of December at the root zone of the plants from different growing media did not differ significantly, there was significant variation in their leaf retention. More plants from the soil medium shed their leaves than from the soilless media treatment. Chidumayo (2001) [13] observed that dry-season leaf flourishing is the ability of plants’ roots to access deeper soil water reserves and stem water storage capacity [14]. This might be the case for the soilless media treatments, as they developed bigger root volume during the nursery stage than the soil treatments. Therefore, continued root development after transplanting may have given the plants from the soilless growth media advantage over the topsoil-treated plants in accessing soil moisture under limited soil water conditions. The higher leaf shedding by plants under the soil medium treatment at the onset of the dry season is a typical survival mechanism of deciduous plant species. Karban (2017) [15] observed that shoots that hold their leaves throughout unfavourable conditions were more advantageous compared to those with their leaves removed since the latter were more likely to die. This is in line with Carr and Lockwood (2011), [16] performing irrigation and water requirement studies of cocoa and pointed out that cocoa seedlings under drought conditions showed symptoms of premature leaf drop progressively, from older leaves to the younger ones, including yellowing of primary leaves, reduced stem growth, decreased leaf formation, and wilting.
Field survival at the onset of the dry season The relatively high percentage survival of seedlings of the soilless media treatment might be attributed to the development of larger root volume and longer taproot system. Moreover, this form of root development in the soilless medium may be supported by the inclusion of biochar in the medium. Mulcahy et al. (2013) [17] demonstrated that in sandy substrates 30% (v/v) biochar – concentrated in the root zone of tomato seedlings – significantly increased seedling resistance to wilting for over 4,000 tomato seedlings each year. Similarly, Lu et al. (2014) [18] observed that addition of rice husk biochar (RHB) to expansive clayey soil (Vertisol)
110
Akpalu, Ofosu-Budu, Kumaga, Ofori, Mintah
improved WHC and root penetration. High seedling survival for soilless media may also be due to the addition of poultry manure and MSWC. This finding is in line with other similar research [19], in which the effect of growing media on the seedling establishment of Terminalia bellirica was studied and which reported maximum survival rate of the seedlings transplanted from medium containing goat manure one year after establishment. The authors attributed it to the differences in the organic component of the growing medium. This may be the case in this study; the differences in the organic composition of the soilless substrate may have resulted in the high seedling survival. After the prolonged dry season, when rainfall became more frequent in June, the survival rate of soil-treated plants was found to be still low (56.4 ± 7.7%). At the onset of the dry season, while seedling survival was higher compared to the end of the dry season, farmers could intervene and irrigate their farms rather than wait for the following season’s rainfall.
Conclusions and recommendation Cocoa seedling growth and survival rate were enhanced under soilless media treatment as compared to those transplanted from the top soil. The cocoa seedling survival rate at the beginning and the end of the dry season points to the need to irrigate when the dry season starts, while soil moisture becomes depleted to maintain high seedling survival rate and improve establishment. Further research into soilless media effects on seedling survival and the establishment of cocoa would be required considering the mechanism of root development, stem water storage potential, and the hormonal differences in leaf retention under drought conditions.
Acknowledgment The authors are grateful to Mr. Nana Oduro, Mr. John Danso, Mr. Addo Tettey, Mr. Mensah, and the staff of FOHCREC for their assistance in the research work and data collection. Our special appreciation goes to A. G. Leventis CBAS for funding the research.
References [1] Nduka, B. A., Adewale, D. B., Akanbi, O. S. O., Adejobi, K. B. (2015), Nursery soil amendments for cashew seedling production: A comparative analysis of coffee husk and NPK. Journal of Agricultural Science 7(3), 111–122. https:// doi.org/10.5539/jas.v7n3p111. [2] Kostopoulou, P., Dini-Papanastasi, O., Radoglou, K. (2010), Density and substrate effects on morphological and physiological parameters of plant stock
Influence of triacontanol and salt stress on the growth and metabolism…
[3]
[4]
[5]
[6] [7]
[8]
[9]
[10]
[11]
[12]
[13]
[14]
111
material of four forest species grown in mini-plugs. Scandinavian Journal of Forest Research 25(supl. 8), 10–17. https://doi.org/10.1080/02827581.2 010.485826. Ofori, A., Konlan, S., Dadzie, M. A., Amoah, F. M. (2014), Genotypic performance of cocoa (Theobroma cacao L.) during establishment under natural drought stress. Journal of Crop Improvement 28(6), 804–824. https://doi.org/10.1080/1 5427528.2014.947529. Engelbrecht, B. M. J., Kursar, T. A. (2003), Comparative drought-resistance of seedlings of 28 species of co-occurring tropical woody plants. Oecologia 136(3), 383–393. https://doi.org/10.1007/s00442-003-1290-8. Pröll, G., Hietz, P., Delaney, C. M., Katzensteiner, K. (2016), Substrate influences ecophysiological performance of tree seedlings. Tree Physiology 36(1), 39–53. https://doi.org/10.1093/treephys/tpv104. Ogunride, I. S. (2006), Permanent Crop Production (ed. by Adebanjo, L.). National Open University of Nigeria, Lagos. Paramananthan, S. (1987), Soil suitability and management implications of soil taxonomy with special reference to tree crop cultivation. Pertanika Journal of Tropical Agricultural Science 10(2), 125–134. Salifu, K. F., Jacobs, D. F., Birge, Z. K. D. (2009), Nursery nitrogen loading improves field performance of bareroot oak seedlings planted on abandoned mine lands. Restoration Ecology 17(3), 339–349. https://doi.org/10.1111/ j.1526-100X.2008.00373.x. Davis, A. S., Jacobs, D. F. (2005), Quantifying root system quality of nursery seedlings and relationship to outplanting performance. New Forests 30(2–3), 295–311. https://doi.org/10.1007/s11056-005-7480-y. Apshara, E., Jose, C. T. (2013), Genotypic variations in chlorophyll fluorescence and stomatal conductance of cocoa in relation to drought tolerance. Journal of Plantation Crops 41(1). Daymond, A., J., Hadley, P. (2004), The effects of temperature and light integral on early vegetative growth and chlorophyll fluorescence of four contrasting genotypes of cacao (Theobroma cacao). Ann. Appl. Bio. 145, 257–262. Vinya, R., Malhi, Y., Brown, N. D., Fisher, J. B., Brodribb, T., Aragão, L. E. O. C. (2018), Seasonal changes in plant–water relations influence patterns of leaf display in Miombo woodlands: Evidence of water conservative strategies. Tree Physiology 39(1), 104–112. https://doi.org/10.1093/treephys/tpy062. Chidumayo, E. N. (2001), Climate and phenology of savanna vegetation in Southern Africa. Journal of Vegetation Science 12(3), 347–354. https://doi. org/10.2307/3236848. Borchert, R. (1994), Soil and stem water storage determine phenology and distribution of tropical dry forest trees. Ecology 75(5), 1437–1449. https:// doi.org/10.2307/1937467.
112
Akpalu, Ofosu-Budu, Kumaga, Ofori, Mintah
[15] Karban, R. (2017), Leaf drop in evergreen Ceanothus velutinus as a means of reducing herbivory. Ecology 89(9), 2446–2452. Wiley (on behalf of the Ecological Society of America Stable). Available at: http://www.jstor.org/ stable/27650783. [16] Carr, M. K. V., Lockwood, G. (2011), The water relations and irrigation requirements of cocoa (Theobroma cacao l.): A review. Experimental Agriculture 47(2011), 653–676. https://doi.org/10.1017/S0014479711000421. [17] Mulcahy, D. N., Mulcahy, D. L., Dietz, D. (2013), Biochar soil amendment increases tomato seedling resistance to drought in sandy soils. Journal of Arid Environments 88, 222–225. https://doi.org/10.1016/j.jaridenv.2012.07.012. [18] Lu, S., Sun, F., Zong, Y. (2014), Effect of rice husk biochar and coal fly ash on some physical properties of expansive clayey soil (Vertisol). Catena 114, 37–44. https://doi.org/10.1016/j.catena.2013.10.014. [19] Bali, R. S., Chauhan, D. S., Todaria, N. P. (2013), Effect of growing media, nursery beds and containers on seed germination and seedling establishment of Terminalia bellirica (Gaertn.) Roxb., a multipurpose tree. Tropical Ecology 54(1), 59–66.
ACTA UNIVERSITATIS SAPIENTIAE AGRICULTURE AND ENVIRONMENT, 13 (2021) 113–124 DOI: 10.2478/ausae-2021-0010
The role of municipalities and landscape architects in the public involvement processes related to green infrastructure developments Andrea KERESZTES-SIPOS,1 Anita REITH,2 Albert FEKETE,3 Péter I. BALOGH4 Institute of Landscape Architecture, Urban Planning and Garden Art, Hungarian University of Agriculture and Life Sciences (MATE), Budapest, Hungary 1
Department of Garden Art and Garden Design; e-mail: keresztessiposandrea@gmail.com 2 3
4
Department of Garden and Open Space Design; e-mail: reithanita88@gmail.com
Department of Garden Art and Garden Design; e-mail: Fekete.Albert@uni-mate.hu
Department of Garden and Open Space Design; e-mail: Balogh.Peter.Istvan@uni-mate.hu Manuscript received 10 August 2021; revised 25 September 2021; accepted 09 October 2021 Abstract: While urban green infrastructure has a great importance with regard to the urban climate, human welfare and well-being due to the positive impact of ecosystem services, it also offers opportunities to practice democracy. The quality of a green infrastructure development process depends on the quality of the partnership between the many stakeholders. Municipalities have a permanent task and a role to play in building partnerships. Landscape architects often go beyond their engineering tasks to give priority to their professional vocations in public involvement processes. In our research, we examine the roles and responsibilities of these main stakeholder groups. Keywords: inclusive municipality, community planning tool, democracy, engagement experts, participation
1. Introduction The ecosystem services of the urban green infrastructure (UGI) not only have an outstanding role in reducing the unpleasant effects of the urban climate [1] but also can significantly increase the quality of human welfare and well-being, which makes the UGI a highly important element of the urban fabric and city life [2, 3]. “The landscape belongs to everyone. We should all have equal access to it and a voice in how it is used, valued and maintained.” – this is the mission statement of the European collaboration between landscape architecture faculties called
114
Keresztes-Sipos, Reith, Fekete, Balogh
Landscape Education for Democracy (LED) [4] that aims to highlight the importance to use democratic processes for UGI developments. The right to landscape and to UGI is part of the basic human rights that support existence and dignity [5]. The public landscape is not only a set of physical elements and resources but is also an imprint of the social, economic, and cultural values of the local community, and therefore it is the spatial materialization of democracy [6]. Due to the fact that many stakeholders – such as local authorities, landscape architects, and other engineers, investors, social workers, contractors, users, etc. – can be identified who in some way play a role in developing or maintaining the UGI, the latter has a combination of ecological, social, and also economic importance. The collaboration of the many stakeholder groups is essential to any UGI development process, and a strong partnership in place is a key factor of the overall success of the development process. That is why UGI developments are great opportunities to practise democracy [6]. By nature, municipalities have a significant role in building and maintaining partnerships and public involvement1 [7], wherefore their deep engagement in UGI developments is essential. There are many examples of strong partnerships within the local community that increase the chances of successful investments and make maintenance more efficient [8].
Figure 1. Roles in the public involvement process
1
In our research, we use the term “public involvement” to refer to any means that gives members of the local community the opportunity to have a say and participate in shaping the development of the city (e.g. posters, forums). Involvement is a more specific form of participatory planning, of which community planning is a concrete instrument [21].
The role of municipalities and landscape architects…
115
In Hungary, it is very common that the municipality is the actor who initiates participation processes for UGI developments because of their existing relationships and partnerships with the local stakeholders. In practice, there are three different routes that we can observe [9]: – municipality takes the leading role and implements public involvement with its own employees, – makes a contract with a company to lead the public involvement process, and – the (landscape) designer undertakes this extra task besides their general role. In this research, we examine the first and second option to discover their advantages and disadvantages (Figure 1, where the darker box shows the leader of the involvement process). Our research looks into the roles and responsibilities of the landscape architect and the municipality and also outlines the main characteristics of their relationship.
2. Materials and methods The research is divided into two units: in the first part, we examine the actors of the public involvement, and in the second part we present the theories through two case studies. The study is based on a review of the related literature, and the results are presented in tables. The case study projects and an interview with a specialist in community planning and local government processes helped to bring the topic down to a practical level. In selecting the projects for the case study, it was important that they be part of the TÉR_KÖZ programme we were looking at, the main aim of which was to ensure that projects were initiated by local communities, or at least involve local residents, in order to enable more sustainable use and greater acceptance of community spaces and to contribute to the reinforcement of local communities. The TÉR_KÖZ programme was announced by the Municipality of Budapest, and district municipalities could apply with project plans. Between 2013 and 2018, a total of 90 projects worth HUF 90 billion were implemented [10].
3. Results and discussions The KÖFOP-2.3.4-VEKOP-15-2016-00002 – Monitoring Local Government Development II, a comprehensive study of municipalities in Hungary, was completed in 2018, which confirmed the hypothesis that there was a correlation between greater public involvement and the success of municipalities [11]. One of the most important characteristics of inclusive municipalities2 – which is a key 2
“An inclusive municipality is a municipality that implements a mechanism for dialogue between local authorities, local organizations, businesses, and the public in order to achieve innovative
116
Keresztes-Sipos, Reith, Fekete, Balogh
objective – is how often they involve the population in the preparation of certain decisions. The results suggest that municipalities with larger populations rely more intensively on public opinion than those with smaller ones [13]. It was also found that both informal and formal methods play an important role in terms of involvement, but this is also determined by the size of the settlements. In smaller communities, face-to-face, day-to-day contact in the absence of formal mechanisms can lead to a high level of inclusiveness, while in larger settlements the role of formal processes is much more important. However, informal channels can also operate either between different groups of residents and stakeholders or between opinion leaders and local communities – neighbourhoods [14]. This means that it is in the interest of local authorities to adopt the practice of public involvement, and in the case of larger cities such as Budapest, it is definitely worth relying on formal procedures, which are multi-actor processes.
A. Actors The key players in the public involvement process can be identified as the relevant municipal leaders, the professionally involved municipal experts, the planners who are awarded the planning task, and the facilitator who leads the involvement. The key actors will carry out the stakeholder analysis in the first phase of the involvement process in order to identify the large number of stakeholders who will be concerned and who should be included in the project [15, 16]. As stated in an earlier paper of ours, there is a wide range of actors who, based on their profession, play an important role in the public involvement process [17] (Table 1). In practice, however, it can be observed that this wide range of experts is not involved, and the whole project is carried out by a smaller group of experts in three different formations (Figure 1). In our analysis, we will examine the role of landscape architects in public involvement, covering also the possibilities for local municipalities. Landscape architects play an important role in public involvement related to UGI development, as they are the designers and often the facilitators as well. In his doctoral thesis, Tamás Dömötör distinguishes eight types of landscape architect design roles for social engagement, which imply different competences in each design phase (Table 1). Dömötör concludes that the design roles are required in addition to the basic design competences in the facilitator role, and their and sustainable operation and development, based on democratic principles, involving in the process the widest possible range of stakeholders, taking into account their expectations and the empowerment of marginalized groups. It manages community resources competently and develops and implements local strategies and services in partnership, while promoting inclusive development and poverty reduction. It supports the development and involvement of communities to mobilize social capital, thus contributing to improving local governance and territorial cohesion” ([12] – translated by the authors).
The role of municipalities and landscape architects…
117
existence is not self-evident as they also depend on certain personal aptitudes and qualifications. Table 1: Characteristics of design roles (own ed.) [17, 18] Expert1
Connection2
c., d., f., g., l.
Mediator – empathy, conflict management skills, good communication skills
B14
B25
ID
X
X
a., c., k.
ID
(X)
X
Spokesperson, or advocate – good communication and reasoning skills
a., c., h.
(LD), GD
(X)
X
X
Assessor – knowledge of presentation techniques, good presentation skills, persuasiveness, decisiveness
a., c.
ID
X
X
X
a., b., c., k.
ID, (LD), (GD)
X
X
(X)
Community organizer – good communication skills, organizational skills
b., c., (h.), k.
LD, GD
X
X
(X)
X
Administrator – systematic thinking, computer skills, organizational skills
(a.), (b.), c., d., e., j.
(ID), LD
X
X
(X)
(X)
(X)
c., h.
LD, GD, L
X
X
X
X
X
Design roles/ Areas of competence Advisor – objectivity, professional authority
Facilitator – knowledge of social psychology (e.g. group dynamics), good communication skills
Landscape steward – perseverance, leadership skills
A3
C6
D7
Notes: 1 Engagement experts: a. Communication expert; b. Community developer; c. Landscape architect; d. Project manager; e. Graphic designer; f. Contractor; g. Lawyer; h. Politician; i. Artist; j. Filmmaker; k. Social worker; l. Expert on the special subjects. 2 Relationship of the landscape architect: ID – independent, LD – location-related, GD – group-related, L – local. 3 The birth of the project. 4 Planning. 5 Planning – Plan consultation. 6 Implementation. 7 Afterlife.
Since Dömötör’s dissertation in 2008, public involvement has become a more widely known method in Hungary, and a great deal of practical experience has been accumulated. It was then that the process of landscape architects taking on the tasks of many other professions began, and they had to continue their education to meet the challenges. However, this extra work cannot be undertaken by any designer because public involvement is not for everyone, as it requires a well-communicating, empathetic, calm character and attitude, which is not
118
Keresztes-Sipos, Reith, Fekete, Balogh
an essential prerequisite for a good designer’s personality [9]; not to mention the fact that one cannot fulfil all the planning roles at the same time because an independent consultant cannot be a member of the local community or a facilitator of the process (Table 1). The idea seems to emerge that landscape architect designers are not required to take on the roles presented in Table 1 but that all designers need a general knowledge of involvement (e.g. knowledge of the community design processes, presentation skills, etc.) and that, in addition, specialization is possible as required. Some designers may have the basic skills and goals to lead the public involvement process, but others may not, or may be more interested in spending more time on landscape architecture design. In this case, since most of the facilitator landscape architect design roles can be decomposed into other disciplines, the tasks not strictly related to the profession can be delegated in whole or in part to other professionals, as shown in Table 1, where the engaged experts and design roles are mapped. Újirány Landscape Architects Ltd has also organized several community design projects for municipalities, including one of our research case studies, the community design of Holdudvar Park. It was formulated that the public involvement tasks involved in public outreach required so much effort that there was little time for planning, so they were happy to work with a team of community developers and communication specialists from District III of Budapest [9]. Municipalities can play a major role in taking on these tasks because they can bring together all the players and coordinate the work either on their own or with the help of engagement experts. Another argument in favour of municipalities and local experts is that a comprehensive study of municipalities in Hungary, KÖFOP-2.3.4-VEKOP-15-2016-00002 – Monitoring Municipal Developments II, found that the strength of local identity and the involvement of local expertise in decision making is positively correlated with the success of a municipality [14].
B. Case studies – Two projects of the TÉR_KÖZ programme We would like to use the case studies to demonstrate the operation of the first and second options in Figure 1, and thus two different landscape architectural and self-government roles can be seen. Both projects were funded by the Municipality of Budapest in the TÉR_KÖZ programme in 2016, both are located in the District III of Budapest, and both were coordinated by the same team, Óbuda-Békásmegyer Urban Development Ltd (ÓBUD Ltd), owned by the municipality – so, the difference in landscape architecture is easier to understand. The staff of ÓBUD Ltd, which was in charge of the development tasks, includes several experts necessary for the involvement: community developer,
The role of municipalities and landscape architects…
119
communication specialist, graphic designer, project manager, landscape architect, and jurist. Blessed Sándor István Park has an area of 8,350 m2, of which 4,700 m2 are green spaces. Despite its small size, it has several functions: play and sports areas, a dog run, and a recreation area [19]. Public involvement was carried out through a variety of tools and in all phases of the project, one of the most important elements being the on-site community planning, which took place in three sessions in the autumn of 2015. The deteriorated park was initially intended by the municipality to be a sports park, but feedback from residents led to its transformation into a multifunctional recreational space [9]. The whole process was managed by ÓBUD Ltd, where the designer had no participatory role but had to attend the meetings and shape the design according to what had been discussed. Holdudvar Park covers an area of 23,000 m2, of which 12,000 m2 are green spaces. It is a huge and multifunctional green space located between the high-rises of the Bécsi and Vörösvári streets in Óbuda residential area. The project took a year to complete and ultimately enriched the area with a slide park, a teenager’s leisure area, sports areas, playgrounds, community space, and a stage. Public involvement was done through a very wide and varied range of tools, covering all project phases, except the birth of the project phase. The planning phase was fully carried out by a contracted landscape architectural firm, the Újirány Landscape Architects Ltd, the key element of which was a nine-part community planning activity [20]. Subsequently, in the implementation and afterlife phases, the involvement tasks were taken over by the municipality’s ÓBUD Ltd [9]. Table 2. Public involvement tools and tasks of the landscape architect and the municipality in the two case studies (own ed.) [9, 17] Success factors for public involvement
Establishment of Blessed Sándor István Park
Expert: LA1 A2
B3
C4
D5
M/LA6
X
X
X
Revitalization of Holdudvar Park A2
B3
C4
D5
M/LA6
M
X
X
X
M
X
X
X
M, LA
Public Flyer, newsletter
X
Posters, billboards
M, LA
Publication
X
X
X
X
M
X
X
X
M
Website, Application
X
X
X
X
M
X
X
X
M
Social media
X
X
M
X
X
X
LA, M
Film
X
M
X
X
M, LA
X
X
M, LA
X
X
Image building
X
X
Forum, workshop
X
X
X X
M, LA X
M, LA LA, M
120 Success factors for public involvement
Keresztes-Sipos, Reith, Fekete, Balogh Establishment of Blessed Sándor István Park
Expert: LA1 A2
B3
C4
D5
M/LA6
Revitalization of Holdudvar Park A2
B3
C4
D5
M/LA6
M, LA
X
X
M, LA
M
X
X
LA, M
LA, M
X
M, LA
X
M, LA
X
Organization Bringing local forces together Local project office Local cooperation Setting up an association Community rules
X
X
Involvement of external experts
X
Making plan Use of existing knowledge
X
Needs assessment
X
Residents’ ideas competition
X
Design competition
X
On-site planning opportunity
X
Poll
X
Community involvement
X
X X
X
X
X
X
X
M, LA
X
M
X
M
LA, M X
X
LA, M
LA, M
X
X
X
X
LA, M X
LA, M
Action Testing, modelling
X
Community implementation
X
X
Sports events Art events Community events
X
Mobile equipment
X
Message boards
X
X
M
X
M
X
X
M
X
M
X
X
M, LA
Programme Urban education Community/social programmes
X X
M
The role of municipalities and landscape architects… Success factors for public involvement
Establishment of Blessed Sándor István Park
Expert: LA1 A2
Cultural programmes
B3
C4
D5
M/LA6
X
M
121
Revitalization of Holdudvar Park A2
B3
C4
D5
M/LA6
X
X
M
Environmental programmes
X
M
Local history programmes
X
M
Urban regeneration programmes
X
Notes: 1 The birth of the project. 2 Planning. 3 Implementation. 4 Afterlife. 5 Tasks (factors) in which the landscape architect should be involved as an expert. 6 Tasks which the landscape architect and/or the municipality actually handled.
The synthesis of the case studies is presented in Table 2, which includes the tools3 used in the public involvement process for both projects and the landscape architectural tasks that can be compared with the actual tasks performed by the landscape architect and the municipality (where the list of actors also indicates a kind of hierarchy of the extent of the involvement). In the case of Blessed Sándor István Park, option 1 was applied, while in the case of Holdudvar Park option 3 was implemented, except for certain project phases that were now in the hands of the municipality. It is clear from the case studies that the municipality has a crucial role to play in an involvement process, as it represents stability compared to a designer and has an overview of the process, which also provides security for the residents. The whole life cycle of a project can span a long period of time, as it can take years from planning to obtaining the necessary funding for development, and the afterlife is not a phase that can be closed. As a consequence, information about the project may be lost in the case of multiple actors (where there is no secure backing from the municipality), and the time and energy invested in public involvement in the project is wasted as residents will again (or still) be sceptical if they do not receive adequate answers. A good example of this is that in the case of Holdudvar Park the social media site was set up by Újirány Landscape Architects Ltd, but after the community planning was completed, it was no longer updated, and so ÓBUD Ltd had to take over its operation because the residents involved in the planning kept track of it and communicated through it. There was also a setback when, following 3
The tools of public involvement are limitless, but they can be grouped by their nature. In a previous study, when we were trying to make the processes and opportunities for public involvement more tangible for city leaders, we grouped the tools into five categories and called them success factors, suggesting that the success of a project often depends on participation [21].
122
Keresztes-Sipos, Reith, Fekete, Balogh
the completion of Holdudvar Park, a set of house rules – very important for the use of the park – was drawn up in a community planning session with the residents, but it was the designers who were aware of the background of these rules, who were otherwise not involved in the event, as they had not been given a mandate. In the case of Blessed Sándor István Park, the experience was that having a team of different experts coordinating the process throughout had several advantages: fewer communication problems (e.g. something was said at the community planning session but nobody kept track of it); the involvement tools could be used as needed in all planning phases of the project, without having to re-engage the designer each time; the communication experts used everyday language rather than technical jargon, making the designs more understandable to the layman. It was a particular advantage for this project that a local representative was involved in the process and, knowing the community, was able to represent their interests and guide the designer’s ideas in the right direction.
4. Conclusions The concept of inclusion represents a shift in approach to the concept of inclusive local government. It conveys the view that there is a need for a continuous and consciously operated municipal-social framework that encourages action, cooperation, and joint thinking in the community, with the community, and for the community [22]. This call for municipalities is in line with the lessons learned from our case study that municipalities need to take on a greater role in public involvement and be good stewards of green spaces by engaging more experts. Experience shows that a project and the associated involvement processes take so long that if no one in the municipality understands and manages the project, information is lost, residents can develop mistrust, and the process can fail [9]. And trust is essential because if you have it and it increases, then public involvement tools will reach more people and be more effective, which will also have an impact on the quality and sustainability of UGI developments [1, 23].
Acknowledgements We would like to thank our families, who supported us with free time, the team of the TÉR_KÖZ programme of the City of Budapest, the staff of the ÓbudaBékásmegyer Urban Development Ltd, and our spontaneously formed research group Next at the university, who helped us with information and encouragement.
The role of municipalities and landscape architects…
123
References [1] Directorate-General for Research and Innovation (European Commission) – Dumitru, A., Wendling, L. (2021), Evaluating the impact of nature-based solutions: Appendix of methods. DOI: 10.2777/11361. [2] Millennium Ecosystem Assessment (2007), Linkages between ecosystem services and human well-being. GRID-Arendal. [3] Kovács, E., Pataki, Gy., Kelemen E., Kalóczkai, Á. (2011), Az ökoszisztéma szolgáltatások fogalma a társadalomkutató szemszögéből. Magyar Tudomány 2011/7. [4] LED (2021), Strategic partnership landscape education for democracy. Ledwiki. Available at: https://ledwiki.hfwu.de/index.php?title=Strategic_Partnership_ Landscape_Education_for_Democracy. [5] Makhzoumi, J., Egoz, S., Pungetti, G. (2011), The right to Landscape: Contesting landscape and human rights. Ashgate Publishing Ltd. [6] Ruggeri, D. (2019), The what, why and how of landscape education for democracy. IN_BO 2019/4. University of Bologna, Landscape Education for Democracy. [7] European Comission (2001), Public participation – Aarhus – Environment – European Commission. [8] Benedict, M., McMahon, E., Fund, T., Bergen, L. (2006), Green infrastructure: Linking landscapes and communities. Bibliovault OAI Repository, the University of Chicago Press. [9] Lukácsházi, G. (2021), Önkormányzatok társadalmi bevonási lehetőségeinek és konkrét esettanulmányoknak a bemutatása – interjú. [10] TÉR_KÖZ web (2021), TÉR_KÖZ – Térköz pályázat. [11] Kocsis, J., Csanádi, G. (2018), Kutatási jelentés – Helyi településfejlesztési fókuszú közszolgáltatások inkluzív faktorainak azonosítását célzó kutatás. [12] Számadó, R. (2014), Inkluzív önkormányzat. Budapest. [13] Miklós, I., Judit, T. N., Róza, S. (2019), 21. századi önkormányzati sikertényezők vizsgálata az ÖFFK II. projekt kutatásainak tükrében 141. [14] Kocsis, J., Csanádi, G., Polyák, T., Mező, J., Nothart, P., Simon, M., Szapu, J. S. (2018), Ajánlások – Az inkluzív településmenedzsment megvalósításához. Budapest: KÖFOP-2.3.4-VEKOP-15-2016-00002 „Önkormányzati Fejlesztések Figyelemmel Kísérése II.”. [15] Sain, M. (2010), Területfejlesztési füzetek 1. – Segédlet a közösségi tervezéshez. [16] Juhász, G. A. (2018), A közösségi tervezés szerepe a városfejlesztésben a fővárosi TÉR-KÖZ pályázat példáján. Thesis (Corvinus University of Budapest – Department of Social Sciences and International Relations). [17] Keresztes-Sipos, A., Fekete, A., Balogh, P. I. (2021), A case study on the potential of public involvement in green space development reflecting to
124
[18] [19]
[20] [21]
[22] [23]
Keresztes-Sipos, Reith, Fekete, Balogh Arnstein’s ladder of citizen participation. 6th Conference on Horticulture and Landscape Architecture in Transylvania. Dömötör, T. (2009), Közösségi részvétel a területi tervezésben. PhD thesis (Corvinus University of Budapest). Budapest Főváros Főpolgármesteri Hivatal (2019), A fővárosi TÉR_KÖZ városrehabilitációs pályázat 2013 és 2019 közötti eredményei. Budapest Főváros Önkormányzata. Tervezői szerződés (2015), Tervezői szerződés a Holdudvar park revitalizációjának tájépítészeti tervezéséhez. Horváth, D., Keresztes-Sipos, A., Lukácsházi, G., Avar, Z., Virág, D. B., Hámori, P. (2018), TÉR_KÖZ Budapest Navigátor: Kézikönyv a társadalmi bevonáshoz. Budapest: Budapest Főváros Főpolgármesteri Hivatal. Számadó, R. (2018), Inkluzív önkormányzat-építés. Budapest. Pleasant, M. M., Gray, S. A., Lepczyk, C., Fernandes, A., Hunter, N., Ford, D. (2014), Managing cultural ecosystem services. Ecosystem Services 8, 141–147.
ACTA UNIVERSITATIS SAPIENTIAE AGRICULTURE AND ENVIRONMENT, 13 (2021) 125–137 DOI: 10.2478/ausae-2021-0011
Preliminary results regarding the seed yield of pot marigold (Calendula officinalis L.) plants harvested at different stages of seed maturity Béla BIRÓ-JANKA,* Katalin MOLNÁR, Norbert SZÉKELY, Imre-István NYÁRÁDI Sapientia Hungarian University of Transylvania (Cluj-Napoca, Romania), Department of Horticulture, Faculty of Technical and Human Sciences, Târgu-Mureş *e-mail: bela.biro@ms.sapientia.ro Manuscript received 31 October 2021; revised 4 November 2021; accepted 6 November 2021 Abstract: During the study, the characteristics of flower heads and seed yield of marigold (Calendula officinalis L.) plants harvested at different stages of seed maturity (achenes from different types of heads – primary, secondary, and tertiary ramifications) were measured. The number of total flower heads (inflorescences), heads with mature seeds, and the diameter of heads with mature seeds and weight of seeds of the above mentioned fractions per plant were calculated. The results show that there are significant differences among treatments regarding several parameters. The plants were harvested when 90% of the heads formed on the primary ramifications and 75% of the heads formed on the secondary ramifications, having mature seeds superior to plants with 50% of the secondary heads with mature seeds. Keywords: growth period, number and diameter of heads, ramifications
1. Introduction Pot marigold, or calendula (Calendula officinalis), from the Asteraceae family is an annual plant originating from the Mediterranean area [1]. It is cultivated around the globe, predominantly for ornamental purposes [2]. Its medicinal properties are also known, the inflorescences being used for the treatment of several diseases [3]. There is a vast literature on the composition of the flowers and their pharmaceutical properties [4, 5, 6, 7]. In recent years, calendula has been rediscovered as an industrial oil-bearing crop [8]. Its seeds (achenes) contain around 20% of fatty acid, of which calendulic acid constitutes approximately 60% [9]. This component has a special chemical
126
Béla Biró-Janka,* Katalin Molnár, Norbert Székely, Imre-István Nyárádi
structure [10], which provides such properties that make it suitable for utilizations such as coatings, paints, cosmetics [1], adhesives, and replacement for volatile organic compounds (VOCs) [9]. There are studies analysing the effects of plant density, applied herbicides [1], genotype [8], sowing date [9], mineral fertilizers [11], or harvest date [12] on seed yield. As the plant develops an indeterminate number of flower heads [12], defining the proper harvest time could be difficult since the maturing of seeds is continuous on the one hand, but previously ripened seeds tend to fall off the plant on the other hand. Another problem originates from the fact that flower heads developed on different ramifications of the plant reach maturity at various rates, this also contributing to the uncertainty of optimal harvest time. The purpose of this pilot experiment was data acquisition for the determination of the best phenological phase of the plant for achieving the highest seed yield under the climatic conditions of the area.
2. Materials and methods Experimental site and experimental design The field study took place in 2020, in the Medicinal and Aromatic Plants Garden belonging to the Didactical and Research Field of the Faculty of Technical and Human Sciences, Târgu-Mureş, of Sapientia Hungarian University of Transylvania, situated in Târgu-Mureş, Mureş County, Romania. The monthly average temperature values and the sums of precipitation of 2020 compared to the multiannual values (period of 1971–2000) are presented in Table 1. Table 1. Air temperature and precipitation values during the vegetation period of the experimental year and the multiannual mean values representative of the area Month
Year May
June
July
August
2020
13.0
18.6
19.8
20.7
1971–2000
15.7
18.5
20.2
19.6
71
124
74.2
N/D
65.1
84.8
76.6
66
Average air temperature (°C)
Precipitation (mm) 2020 1971–2000
Preliminary results regarding the seed yield of pot marigold…
127
The three treatments (seeds’ maturity duration at the time of harvesting) and four replications were scheduled in a randomized complete block design (RCBD), with each plot having a 10 m2 (2 x 5 m) area and consisting of five rows. Data collection was carried out in the three central rows from a number of 12 randomly selected plants in the case of each replication.
Preparation of the experimental field In the autumn of 2019, a 25 cm deep ploughing was performed, followed by a rototilling after the pass of the cold season. Prior to sowing, the seedbeds were made manually. A total of 150 kg/ha complex mineral fertilizer with 16:16:16 NPK content and 200 kg/ha ammonium nitrate mineral fertilizer with 33.5% N content were applied to the field. Sowing was performed on 10 May 2020 with a 40 cm distance between the rows and a depth of 4 cm. The 10 cm final inrow distance between plants was achieved manually after the emergence of plantlings, resulting in a plant density of 25 plants/m2. A single dose of irrigation was applied to the field for a better and more uniform emergence of plants. The harvest was effectuated at the stages of 90% mature seeds on the primary heads and 50% and 75% mature seeds in the secondary heads of the plants (13 and 24 August and 2 September 2020). The durations of the growth periods were 96, 107, and 116 days.
Data collection The following measurements were effectuated on the different types of heads (developed on the primary, secondary, or tertiary ramifications of the plant): number of heads and number of heads that reached seed maturity, diameter (in mm) and seed yield (in g) of heads with mature seeds.
Data analysis The data obtained were subjected to data analyses using the PAST program. In the case of data with normal distribution, ANOVA and Tukey’s test were performed, while for data with non-normal distribution or represented by nominal variables, the Kruskal–Wallis and Mann–Whitney tests were used.
3. Results and discussion Number of flower heads per plant By comparing the data of total inflorescence formation on the primary ramifications among the three seed maturity groups, it can be said that there are no
128
Béla Biró-Janka,* Katalin Molnár, Norbert Székely, Imre-István Nyárádi
significant differences. This statement is also valid for the data of head number on secondary and tertiary ramifications and also for the total number of heads per plant regardless of the harvesting group (p > 0.05). In contrary, the distribution of inflorescences formed on different ramifications shows statistically significant differences in the case of plants harvested at 90% and 50% maturated seed groups, the number of heads formed on the tertiary ramifications being significantly lower than the other two head types (p < 0.001) (Figure 1A–B). The total inflorescence number in the case of the 75% group shows no differences (Figure 1C). Similarly to the above mentioned results, the data regarding the number of inflorescences with maturated seeds formed on primary, secondary, and tertiary ramifications and also the total number of matured inflorescences per plant presents no statistically significant differences.
Notes: Lower case letters denote significant differences; /, //, and /// denote p values smaller than 0.5, 0.01, and 0.001.
Figure 1. Number of total flower heads (A – 90%, B – 50% and C – 75% maturity), and matured flower heads (D – 90%, E – 50%, and F – 75% maturity) on different ramifications However, analysing the data obtained from plants harvested at 90% seed maturity, we can observe a decrease in the number of heads formed on the different ramification types, the highest number of heads being formed on the primary ramifications, while
Preliminary results regarding the seed yield of pot marigold…
129
the lowest number of heads can be observed in the case of tertiary ramifications. The same pattern is present also in the results originating from plants harvested at 50% matured seeds on secondary ramifications. The differences are statistically significant in both cases (p < 0.001 and p < 0.01). A similar tendency is visible at the data from plants harvested at 75% maturated seeds on the secondary ramifications, but in this case only the number of heads formed on the tertiary ramifications is significantly lower than the other two types (p < 0.01) (Figure 1D–F).
Diameter of flower heads The diameter of flower heads formed on primary ramifications is greater than those from secondary and tertiary ramifications. Comparing the head diameters of different ramifications of plants from the three separate harvest times, it can be stated that the differences are statistically significant in the case of primary flower heads, the plants with 90% and 50% matured seeds having significantly higher head diameters compared to plants of 75% matured seeds (Figure 2a.A). Contrary to this, in the case of tertiary flower head diameter, the highest values come from plants of the third harvest date, followed by plants of the second and finally by the first harvest date, the differences between the first and latter two groups being significant (Figure 2a.B). This could be partially explained by the fact that the flower heads developed earlier on the primary ramifications have shrunken after ripening. There are no significant differences among the secondary flower head diameters of the plants of different harvest times. The average flower head diameter is significantly higher in the case of plants harvested at 90% and 50% seed maturity as compared to plants of 75% seed maturity (Figure 2a.C).
Figure 2a. Diameter of matured flower heads (A – primary, B – tertiary, and C – plant average) and their distribution among different ramifications in the case of the three harvest times (D – 90%, E – 50%, and F – 75%)
130
Béla Biró-Janka,* Katalin Molnár, Norbert Székely, Imre-István Nyárádi
Notes: Lower case letters denote significant differences; /, //, and /// denote p values smaller than 0.5, 0.01, and 0.001.
Figure 2b. Matured flower heads distribution among different ramifications in the case of the three harvest times (D – 90%, E – 50%, and F – 75%) The dispersion of flower heads formed on primary, secondary, or tertiary ramifications is similar for plants of all harvest dates in such a manner that the diameters’ value decreases from primary to tertiary ramifications, the differences being statistically significant in all cases, with p < 0.01 or even 0.001 (Figure 2b.D–F).
Weight of flower heads The average weight of a flower head ranges from 0.38 g to 2.66 g. After analysing the data of the dispersion of flower head weights of different ramifications, we can conclude that plants harvested at 90% seed maturity have developed the flower heads with the greatest weight, followed by plants harvested at 75% and lastly plants harvested at 50% seed maturity; the differences between the first group and the latter two are statistically significant (p < 0.05) (Figure 3A). Comparing the weights of flower heads formed on the secondary ramifications of plants harvested at different seed maturity stages, we can conclude that the lowest values come from the 90% seed maturity harvest time, followed by the 50% and 75% seed maturity groups, but without significant differences among the groups. The weight of flower heads formed on tertiary ramifications of the first two harvest times are the same, and the values of the third harvest date are significantly higher (p < 0.01) (Figure 3B). An explanation to this phenomenon could be that plants of the third harvest date had a longer period to develop their flower heads on the tertiary ramifications. Average per plant flower head weight was the highest in the case of plants harvested at 90% seed maturity, followed by the group of plants harvested at 75% and finally at 50% seed maturity, the differences being significant among the two extreme cases (p < 0.001) (Figure 3C). This tendency is probably due to the fact that in later harvest times part of the seeds from the primary heads have already fallen to the ground on the one hand and that flower heads of secondary and tertiary
Preliminary results regarding the seed yield of pot marigold…
131
ramifications had a longer period to develop in the case of the third harvest date on the other hand; thus, an intermediate harvest time seems less appropriate. Independently of the harvest date, all plants had heavier flower heads developed on the primary ramifications, followed by secondary and, finally, tertiary ramifications; however, differences are greater in the first harvest group and gradually decrease in the second and third harvest groups. It is probable that with longer growth periods, plants had the chance to develop bigger and heavier flower heads also on the secondary and tertiary ramifications. In the first and second harvest dates, there are significant differences among the values of all types of flower heads (p < 0.001 and p < 0.01) (Figure 3D–E), but in the case of the third harvest date, the weights of primary and secondary ramification flower heads do not differ significantly from each other, only from the flower heads formed on the tertiary ramifications (p < 0.01) (Figure 3F).
Notes: Lower case letters denote significant differences; /, //, and /// denote p values smaller than 0.5, 0.01, and 0.001.
Figure 3. Average weight of matured flower head (A – primary, B – tertiary, and C – plant average) and their distribution among different ramifications in the case of the three harvest times (D – 90%, E – 50%, and F – 75%) Seed yield per hectare was calculated from the average seed yield of one plant and the plant density applied in the experiment. The results show that the highest yields were achieved when plants were harvested at 90% seed maturity on the primary ramification (1,004.9 kg/ha), followed by plants harvested at the stage
132
Béla Biró-Janka,* Katalin Molnár, Norbert Székely, Imre-István Nyárádi
when 75% of heads of secondary ramifications had maturated seeds (875.7 kg/ ha) and, finally, by plants at a 50% seed maturity of secondary ramification flower heads (752.8 kg/ha). These results are lower than those of [1] and [13] but are comparable to those achieved by [12]. The values of Spearman’s rank correlation coefficient rho indicate that there are differences between the three harvest times regarding the positive correlation among total flower head number and the flower head count of primary, secondary, and tertiary ramifications. In the case of plants harvested at the latest date, the flower heads of tertiary ramifications contributed to a greater extent to total flower number (Table 4), while contrary, in the case of plants harvested in the first date, their contribution was of a lesser significance (Table 2). This tendency is also visible when analysing the magnitude of correlation in the case of matured head numbers. Although there were no statistically significant differences detected between either the total or the maturated flower head numbers, there is a tendency of negative correlation (with rho values exceeding -0.5 only in one case) among flower head numbers and their diameter. In the case of plants from the first harvest group (with the shortest growth period), this effect is mostly notable at the diameter of flower heads developed on tertiary ramifications (Table 2). This trend is repeated also in the case of plants from the third harvest group (with the longest growth period), but to a lesser extent (Table 4). For the second harvest group, the negative correlations are visible almost entirely in the cases of primary and total flower head diameters (Table 3). A trend of positive correlation is also present between the total flower head weight of plants and the flower head weight of different ramifications. For plants harvested at 90% seed maturity, the highest contribution to the total seed yield of plants can be attributed to flower heads developed at primary ramifications (rho = 0.932) followed by secondary ramification heads (rho = 0.701). In this case, tertiary flower head weight has a low positive correlation (rho = 0.349) with total seed yield (Table 2). The data coming from the second harvest group indicates a lower correlation ratio between the mentioned parameters, with only the weight of primary ramification flower heads having a relatively high rho value of 0.722 (Table 3). Finally, concerning the plants of the third harvest group, it can be said that all types of flower heads contributed in a somewhat similar extent to the total seed yield of plants, the Spearman’s rank correlations having rho values of 0.881, 0.838, and 0.752 (Table 4).
Notes: Values above the diagonal represent the two-tailed probabilities of the lack of correlation, while those below are Spearman’s rho values.
Matured head diameter
Table 2. Results of Spearman’s rank correlation test effectuated among the measured parameters of plants harvested at 90% seed maturity Preliminary results regarding the seed yield of pot marigold… 133
Table 3. Results of Spearman’s rank correlation test effectuated among the measured parameters of plants harvested at 50% seed maturity
Notes: Values above the diagonal represent the two-tailed probabilities of the lack of correlation, while those below are Spearman’s rho values.
Matured head diameter
134 Béla Biró-Janka,* Katalin Molnár, Norbert Székely, Imre-István Nyárádi
Notes: Values above the diagonal represent the two-tailed probabilities of the lack of correlation, while those below are Spearman’s rho values.
Matured head diameter
Table 4. Results of Spearman’s rank correlation test effectuated among the measured parameters of plants harvested at 75% seed maturity Preliminary results regarding the seed yield of pot marigold… 135
136
Béla Biró-Janka,* Katalin Molnár, Norbert Székely, Imre-István Nyárádi
4. Conclusions On the basis of the data obtained from the experiment, it can be concluded that harvest time, which determines the length of the growth period, has great influence on the flower head parameters and seed yield of Calendula officinalis plants. Results show that effectuating the harvest when the majority of primary flower heads have ripened seeds produced the highest yields, while in the intermediate harvest time plants obtained the lowest yields. An even longer growth period permits the plants to develop enough seeds on secondary and tertiary flower heads for a greater yield. A possible explanation to this phenomenon could be that after having reached full maturity, seeds on primary flower heads tend to fall off, and so they will not be present in the harvested seeds, reducing the seed yield. At the same time, a number of seeds developed on secondary and tertiary ramifications can reach maturity, thus contributing to the total seed yield. The authors’ opinion is that further investigation is needed for the elucidation of further factors influencing seed yield and for determining even more accurately the proper harvest date for calendula plants.
Acknowledgements Publishing of this journal is supported by the Institute for Research Programmes of Sapientia Hungarian University of Transylvania.
References [1] Cromack, H. T., Smith, J. (1998), Calendula officinalis—production potential and crop agronomy in southern England. Industrial Crops and Products 7(2–3), 223–229. DOI: 10.1016/s0926-6690(97)00052-6. [2] Eberle, C. A., Forcella, F., Gesch, R., Peterson, D., Eklund, J. (2014), Seed germination of calendula in response to temperature. Industrial Crops and Products 52, 199–204. DOI: 10.1016/j.indcrop.2013.10.031. [3] Zaki, A. A., Qiu, L. (2019), Machaerinic acid 3-O-β-D-glucuronopyranoside from Calendula officinalis. Natural Product Research 34(20), 2938–2944. DOI: 10.1080/ 14786419.2019.1599888. [4] Arora, D., Rani, A., Sharma, A. (2013), A review on phytochemistry and ethnopharmacological aspects of genus Calendula. Pharmacogn. Rev. 7(14), 179–187. DOI: 10.4103/0973-7847.120520. [5] Muley, B. P., Khadabadi, S. S., Banarase, N. B. (2009), Phytochemical constituents and pharmacological activities of Calendula officinalis Linn (Asteraceae), Trop. J. Pharm. Res. 8(5), 455–465.
Preliminary results regarding the seed yield of pot marigold…
137
[6] Kodiyan, J., Amber, K. T. (2015), A review of the use of topical Calendula in the prevention and treatment of radiotherapy-induced skin reactions. Antioxidants 4(2), 293–303. https://doi.org/10.3390/antiox4020293. [7] Lim, T. K. (2013), Calendula officinalis. Edible medicinal and non-medicinal plants. Dordrecht: Springer. 213–244. DOI: 10.1007/978-94-007-7395-0_15. [8] Angelini, L. G., Moscheni, E., Colonna, G., Belloni, P., Bonari, E. (1997), Variation in agronomic characteristics and seed oil composition of new oilseed crops in central Italy. Industrial Crops and Products 6(3–4): 313–323. DOI: 10.1016/s0926-6690(97)00022-8. [9] Gesch, R. W. (2013), Growth and yield response of calendula (Calendula officinalis) to sowing date in the northern U.S. Industrial Crops and Products 45, 248–252. DOI: 10.1016/j.indcrop.2012.11.04. [10] Dulf, V. F., Pamfil, D., Baciu, A. D., Pintea, A. (2013), Fatty acid composition of lipids in pot marigold (Calendula officinalis L.) seed genotypes. Chemistry Central Journal 7(1), 8. [11] Jevdovic, R., Todorovic, G., Kostic, M., Protic, R., Lekic, S., Zivanovc, T., Secanski, M. (2013), The effects of location and the application of different mineral fertilizers on seed yield and quality of pot marigold (Calendula officinalis L.). Turk. J. F. Crop. 18, 1–7. [12] Król, B., Paszko, T. (2017), Harvest date as a factor affecting crop yield, oil content and fatty acid composition of the seeds of calendula (Calendula officinalis L.) cultivars. Industrial crops and products 97, 242–251. DOI: 10.1016/j.indcrop.2016.12.029. [13] Martin, R. J., Deo, B. (2000), Effect of plant population on calendula (Calendula officinalis L.) flower production. New Zealand Journal of Crop and Horticultural Science 28(1), 37–44. DOI: 10.1080/01140671.2000.9514120.
ACTA UNIVERSITATIS SAPIENTIAE AGRICULTURE AND ENVIRONMENT, 13 (2021) 138 DOI: 10.2478/ausae-2021-0012
Retraction Retraction of: László FERENCZ, Daniela Lucia MUNTEAN: Identification of new superwarfarin-type rodenticides by structural similarity. The docking of ligands on the vitamin K epoxide reductase enzyme’s active site. Acta Universitatis Sapientiae Agriculture, Vol. 7, 2015, pages 108–122 (DOI: 10.1515/ausae-2015-0010). Retracted because of self-plagiarism. This paper was published also in Revue Roumaine de Chimie (http://web.icf.ro/rrch/) 59(9), 733–738, with essentially identical content. Title: Potential inhibitors for bacterial dihydropteroate synthase. The results of a comprehensive screening based on structural similarity with p-amino-benzoic acid and docking simulation on the surface of enzyme. DOI: 10.2478/ausae-2021-00012
Information for Authors Acta Universitatis Sapientiae, Agriculture and Environment publishes only original papers and surveys in various fields of agriculture, especially plant breed-ing and protection, and e nvironment, including management, protection, and evaluation. All papers are peer-reviewed. Papers published in current and previous volumes can be found in Portable Document Format (PDF) format the address: http://www.acta.sapientia.ro. The submitted papers must not be considered for publication by other journals. The corresponding author is responsible to obtain the permission for publication of co-authors and of the authorities of institutes, if needed. The Editorial Board is dis-claiming any responsibility. The paper should be submitted both in word.doc and .pdf format. The submitted PDF document will be used as a reference. The camera-ready journal will be pre-pared in .pdf format by the editors. An accurate formatting is required in order to reduce subsequent changes of aspect to a minimum. The paper should be prepared on A4 paper (210 × 297 mm), and it must contain an abstract not exceeding 100 words. Only papers written in English will be published in the journal (please use English spell check). The paper should be prepared in single-column format not exceeding 12 pages in overall length, including figures, tables, and references. The manuscript must have the following subheadings: Abstract, Keywords, Introduction, Material and methods, Results and discussions, Conclusions, Acknowledgements, References. The template file from http://www.acta.sapientia.ro/acta-agrenv/agrenv-main.htm may be used for details. Submission must be made only by e-mail (acta-agrenv@acta.sapientia.ro). One issue is offered to each author free of charge. No reprints are available. Contact address and subscription: Acta Universitatis Sapientiae, Agriculture and Environment Sapientia Hungarian University of Transylvania RO 400112 Cluj-Napoca, Romania Str. Matei Corvin nr. 4. E-mail: acta-agrenv@acta.sapientia.ro Printed by F&F INTERNATIONAL Director: Enikő Ambrus Supported by: