6 minute read
SOUND PRESSURE LEVELS ESTIMATION
Following from last edition’s item on the somewhat contentious topic of Speech Intelligibility, this article continues our discussion of Emergency Warning Systems. Sound Pressure Level, while a much older and more mature concept, still occasionally causes unnecessary grief to both the experienced and the uninitiated, especially when it comes to Class 2, 3, and 4 residential buildings.
VYACHESLAV (SLAVA) SHARGORODSKY
Newsound Fire Services
On 15 June 2019, ABC News published an article with the concerning headline ‘Canberra apartment residents unable to hear fire alarms through soundproofed front doors’. According to the article, residents of a brand-new apartment complex were unable to hear emergency tones from inside their units apparently because of ‘too good’ soundproofing. It concluded that:
“ACT Fire and Rescue … found no breaches of the Building Code of Australia. The code does not require that sound levels be tested within units, as long as an alarm of no less than 85 dB is provided at the front door. …. Local authorities told the ABC they were ‘strident for change’, and that measuring 75 dB at the bedhead in apartments was a preferred procedure.”
To measure or not to measure?
The article highlighted only some of the well-known problems with controversial Building Code of Australia (BCA) concessions for Sound Pressure Level (SPL) measurements in residential building single occupancy units (SOUs) under clause 7 of Specification E2.2a. These have been the subject of numerous heated debates among professionals, both publicly and privately, leading to the following questions:
1. Is it really an acceptable risk to construct a Building Occupant Warning System (BOWS) based on a chain of interconnected simple domestic smoke alarms within a multi-apartment Class 2 building that is not monitored for interconnection faults?
2. Is it reasonable to expect 75 dB SPL at the bedhead, if 85 dB is provided at the SOU front door by a BOWS based on interconnected smoke alarms?
3. Why is 85 dB provided at the SOU front door considered acceptable for BOWS based on smoke alarms, but for BOWS based on loudspeakers, 100 dB at the SOU front door is required?
4. On which side of the SOU front door is the SPL expected to be measured? (Despite the common assumption that the measurement has to be taken outside the SOU, the BCA is actually silent on the matter.) Unfortunately, this article is too short to provide all technical and historical answers for these issues.
To get around these concerns, some practitioners have adopted a common sense, pragmatic approach, taking additional SPL measurements within one or two SOUs of each typical internal layout at the anticipated position of a bedhead with all doors closed, even if 85 dB or 100 dB SPL is achieved at the door providing access to the SOU. This allows them to check whether a minimum SPL of 75 dB is likely to be achieved at the bedhead.
If a minimum SPL of 75 dB is not achieved inside the SOU (despite an SPL of 85 dB or 100 dB being measured at the SOU entry door), the follow-up decisions and potential solutions should be discussed with the building certifier, building surveyor, private certifier, and so on appointed for the project.
Typical Ceiling Mount Speaker
Polar Plot – 2kHz 0o
Ten basic tips for estimating SPL
The following acoustic tips and considerations may be useful when estimating SPL. Please note: produces a just noticeable increase of loudness, while changing power taps from 0.33 W to 2.5 W (approximately eight times) increases the apparent loudness by slightly less than double.
they represent very basic acoustic relations and involve some idealisations and simplifications they have been written in relation to loudspeakers, but most of them apply equally to smoke alarms and stand-alone sounders.
1. Every time the distance from a loudspeaker is doubled, SPL is reduced by 6 dB.
For example, if SPL is measured as 90 dB at 1 m from the loudspeaker, it will be measured as 84 dB at 2 m from the same loudspeaker under the same conditions. If the distance from a loudspeaker is doubled again (from 2 m to 4 m), the SPL will be measured as 78 dB at a distance of 4 m.
2. Where several loudspeakers are laid out in a line or grid within the same open-space compartment, the co-contribution of adjacent loudspeakers may increase the SPL.
For example, if two identical loudspeakers (producing the same SPL at the same distance) are mounted on a ceiling at some distance from each other, then the SPL mid-way between the two loudspeakers would increase by 3 dB (when compared to the SPL measurement at the same point with only one loudspeaker operating).
3. Loudspeaker SPL increases by 3 dB every time the applied electric power is doubled.
For example, if SPL is measured as 90 dB at 1 m from the loudspeaker with 1 W of electrical power applied, then it will be measured as 93 dB at the same 1 m distance from the same loudspeaker with 2 W of electrical power applied.
Coverage area is determined by a combination of speaker polar loss and the inverse square loss off -axis. To illustrate, consider a speaker with no polar loss, i.e. the speaker’s SPL is the same over all angles. As the listener moves away from the center of the speaker, the distance to the speaker increases resulting in a lower SPL. From the Inverse Square Law, the off-axis SPL is 6 dB lower than the on-axis SPL when the distance from the speaker to the listener has doubled. From simple geometry, it can be determined that the maximum useable coverage angle is 120 degrees:
5. The SPL is reduced by both distance from a loudspeaker and the angle at which a listener is positioned in relation to the loudspeaker. The maximum SPL is usually produced at the line perpendicular to the centre of the ceiling-mounted loudspeaker (on-axis); and it drops gradually when SPL is measured at the same distance from the loudspeaker, but at different angles (off-axis).
-6dB edge of coverage area
4. A typical 100 mm (4”) loudspeaker has electrical power taps in 3 dB increments: 0.33 W, 0.66 W, 1.25 W, 2.5 W, and 5 W. Each power tap doubles the power reproduced by the loudspeaker, therefore increasing the SPL output by 3 dB for each increasing tap.
Figure 2-6
Maximum Theoretical Coverage Angle
Subjectively, an increase of 3 dB
2014 National Electrical Manufacturers Association
Both the distance from the loudspeaker and the angle at which a listener is positioned in relation to the loudspeaker define so-called ‘coverage area’ of the loudspeaker. This is usually defined as a circle within the horizontal plane (at listening height of 1.5 m above the floor) around the loudspeaker on-axis, where the SPL at the edge of the circle drops 6 dB below the on-axis SPL (measured at the same listening height of 1.5 m above the floor). See Figure 1.
6. Barriers such as doors and walls could reduce the sound level by 10 dB to 60 dB or more depending on their construction. For example, a hollow core door will typically attenuate sound levels by 20–25 dB, while a fire-rated door may attenuate sound by 35–45 dB, and so on.
7. Increasing the applied electric power to a loudspeaker may increase sound distortion and decrease intelligibility.
8. A larger number of loudspeakers set at lower tap settings provides better intelligibility and more uniform sound levels than fewer loudspeakers set at high power tap settings.
9. Higher ceilings require much more power to achieve the desired sound level at listening height but require fewer speakers to achieve uniform sound distribution.
10. The listening height is normally taken during SPL measurements at 1.5 m above a floor level.
Estimating SPL for a single loudspeaker

So, how does this all get put into practice?
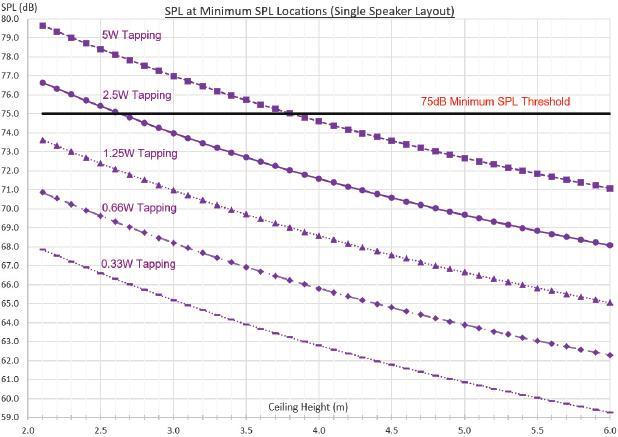
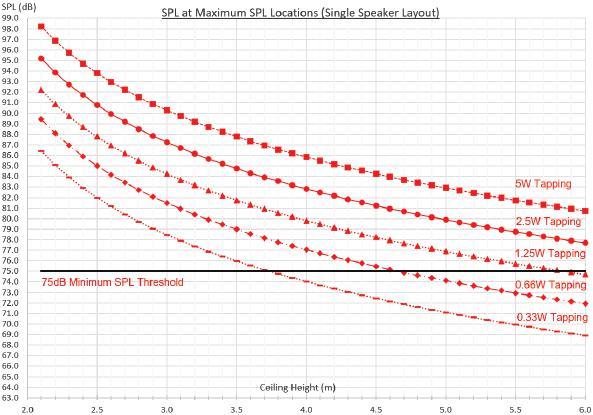
Imagine a single loudspeaker has been installed in the middle of a square room, where the length of each wall is twice the ceiling height of the room.
Figures 2 and 3 right represent calculated SPL values for such a configuration with varying ceiling heights and varying loudspeaker power tapping at maximum and minimum SPL locations—straight under the loudspeaker and in the corners of the room, respectively.
The figures also indicate the 75 dB minimum SPL level allowed for emergency tones in the current editions of AS 1670.1 and AS 1670.4, dated 2018.
One of the popular models currently on the Australian market—100 mm 5 W loudspeakers compliant with AS ISO 7240.24—was used as an example for the estimations above.
The FPA Australia Technical Advisory Committee TAC/2 is currently developing a Good Practice Guide on the design and installation of Emergency Warning System loudspeaker networks, which will cover other loudspeaker layout configurations and provide some useful estimation graphs.
There are many other aspects of the SPL estimation that could not be covered in this short article, such as cable size and length, live speech SPL measurements, and so on. But these will keep for another day and another article.
Correction: Last edition’s article on Speech Intelligibility should have read “If ambient (noise) SPL < 85dB(A) AND Live Speech Signal to Noise ratio is 10 dB or more”, instead of less.


