6 minute read
ANNEXUER 1-6
ANNEXURE 1: LIST OF AFI MEMBERS INTERVIEWED
Country
Advertisement
ESWATINI
ESWATINI
FIJI
Institution
Central Bank of Eswatini
Centre for Financial Inclusion (CFI)
Reserve Bank of Fiji (RBF)
Official interviewed
Gcina Patrick Nxumalo Vuyiswa Vilakati Hlengiwe Gumedze
Phumzile Nhleko-Mtetwa Susan Nonhlanh
Swastika Singh Sakiusa Nabou
GHANA Bank of Ghana (BoG) Elsie Addo Awadzi Clarissa Kudowor Dr. Naa Akofio-Sowah
MEXICO
MOROCCO Comisión Nacional Bancaria y de Valores (CNBV) Marco Antonio Del Río Chivardi Christopher Edmundo Castro Solares
Bank Al-Maghrib/SME Observatory Dr. Amal Idrissi
THE PHILIPPINES Bangko Sentral ng Pilipinas (BSP) Mynard Bryan Mojica Golda P. Cainglet May Valdez Amelia Bernardo-Damian Maria Cynthia M. Sison
Dimension Category # Note Indicator
Digital financial access
4 Percentage of enterprises with access to digital financial services
ACCESS
4.1x Percentage of population with access to digital financial services
Credit access 5 Percentage of SMEs required to provide collateral on any existing loan Tightness of credit conditions This indicator is based on an OECD indicator
Measurement
Extent of access to digital financial services
USAGE
QUALITY
Formally banked enterprises
Enterprises with outstanding loan or line of credit facilities
SME loan guarantees
1 Percentage of SMEs with a deposit account at a regulated financial institution
1.1x Number of SMEs with deposit accounts Number of deposits accounts
1.2x Number of SMEs depositors Number of depositors
2 Percentage of SMEs with an out-standing loan or line of credit at a regulated financial institution Usage of deposit accounts GPFI indicator
2.1x Number of SMEs with outstanding loans Number of outstanding loans
2.2x Number of SMEs with outstanding loans Number of outstanding loans
1 SME loan guarantees as a percentage of SME loan (in terms of value)
1.1x
finance Number of SME loans with guarantees Number SME loans Usage of loan facilities GPFI indicator
Extend of public support for SME OECD indicator
Source: AFI. September 2015. SME financial inclusion indicators base set (SME finance base set), Guideline Note No. 16.
ANNEXURE 2: continued
AFI SME FINANCIAL INCLUSION INDICATORS BASE SET
Category # Indicator
Relative cost of credit
2 Difference between the average SME loan rate and average corporate loan rate Risk premium charged on SMEs loans Based on OECD indicator
Measurement Note
Womenowned SME accounts
Womenowned SME loans
3 Percentage of women-owned SMEs with a deposit account at a regulated institution
3.1x Number of women-owned SMEs with deposit accounts Number of deposit accounts
4 Percentage of women-owned SMEs with an outstanding loan or line of credit at a regulated institution
4.1x Number of women - owned SMEs with outstanding loans Number of outstanding loans Gender equality in SME access to financial services
Gender equality in SME access to financial services
Nonperforming loans
5 Percentage of non-performing loans: to total loans to SME loans Based on OECD indicator
Source: AFI. September 2015. SME financial inclusion indicators base set (SME finance base set), Guideline Note No. 16.
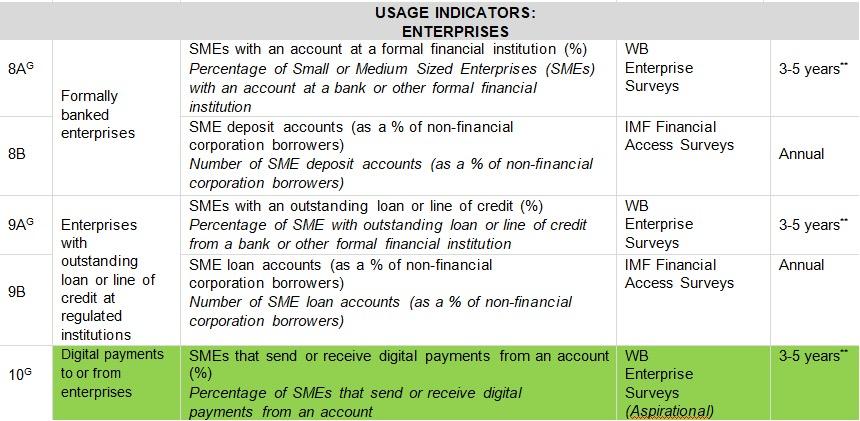
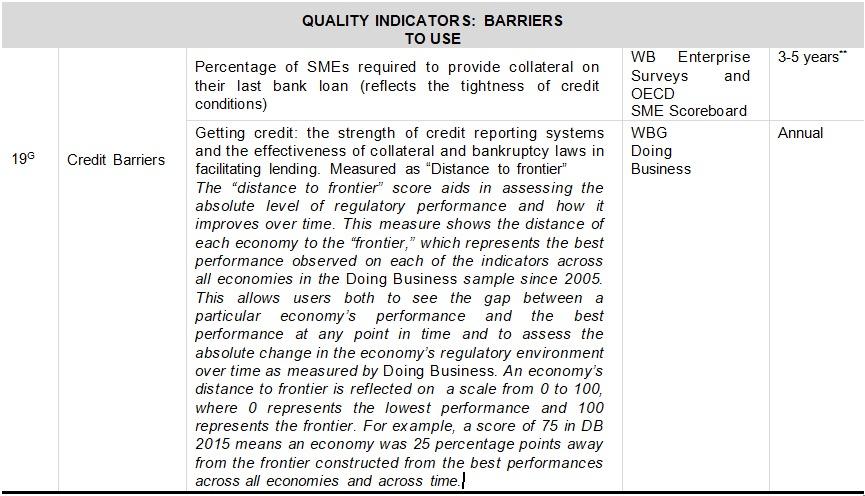
ANNEXURE 3: THE GPFI SET32
G20 FINANCIAL INCLUSION INDICATORS

ANNEXURE 4: THE WORLD BANK ENTERPRISE SURVEY33
1 Percent of firms with a checking or savings account 2 Percent of firms with a bank loan/line of credit 3 Proportion of loans requiring collateral (%) 4 Value of collateral needed for a loan (% of the loan amount) 5 Percent of firms not needing a loan 6 Percent of firms whose recent loan application was rejected 7 Percent of firms using banks to finance investments 8 Proportion of investments financed by internal funds (%) 9 Proportion of investments financed by banks (%) 10 Percent of firms using banks to finance working capital 11 Percent of firms using supplier/customer credit to finance working capital 12 Proportion of working capital financed by banks (%) 13 Percent of firms identifying access to finance as a major constraint
ANNEXURE 5: THE EUROPEAN INVESTMENT FUND (EIF) INDICATOR SET34
BOX 1: THE FOUR ESAF SUBINDICES AND THEIR RESPECTIVE SME ACCESS TO FINANCE INDICATORS
LOANS:
> Percentage of SMEs using bank loans in the last 6 months > Percentage of SMEs using grants or subsidised bank loans in the last 6 months > Percentage of SMEs not applying for a bank loan because of possible rejection in the last 6 months > Interest rate for loans under EUR 250k (floating rate with IRF up to 1 year) > Interest rate spread (under EUR 250k vs over EUR 1m for floating rate with IRF up to 1 year)
EQUITY:
> Venture Capital Investments / GDP > Value of IPO market / GDP > Percentage of SMEs using equity capital in last 6 months
CREDIT AND LEASING:
> Percentage of SMEs using bank overdraft, credit line, or credit card overdraft in last the 6 months > Percentage of SMEs not applying for the above because of possible rejection in last the 6 months > Percentage of SMEs using leasing or hire-purchase in the last 6 months > Median interest rate charged to SMEs for credit line or bank overdraft application in the last 6 months
MACRO FACTORS:
> Gap between actual and potential GDP > Bank non-performing loans to total gross loans 3 > Percentage of SMEs "feeling that there are no financing obstacles"
ANNEXURE 6: THE WOMEN’S WORLD BANKING SET35
Advancing women Staff promotion rate, by gender Staff retention rate, by gender
Client satisfaction
Depth of outreach to women
Client satisfaction score, by gender Percent of women clients below a defined poverty threshold Average initial loan balance as a percent of per capita Gross National Income (GNI), by gender
Economic improvement
Educating women
Family well-being
Gender diversity
Product diversity
Average percent change in net business income or assets, by gender Average percent change in household income or assets, by gender Percent of women clients who attend financial education programs Percent women board members, staff, senior management, middle management, and front-line staff Percent of women clients with school-aged children in school Percent women clients that show improvement in housing conditions Percent women board members, staff, senior management, middle management, and front-line staff Percent of women clients accessing two or more distinct types of voluntary financial products Retaining women borrowers Borrower retention rate, by gender Percent of women borrowers, by loan cycle or by join year Self-determination Percent of women who use their loan for their own economic activity Understanding women’s needs Percent of clients analyzed through market research, by gender Women as an asset base Percent of loan portfolio and average loan balance, by gender Women borrowers Women borrowers as a percent of total borrowers New women borrowers as a percent of total new borrowers
Women savers
Women’s savings accounts as a percent of total savings accounts Women savers as a percent of total savers New women savers as a percent of total new savers
Women’s assets
Percent of savings portfolio, by gender Average savings account balance, by gender Women’s feedback Percent of clients with inquiries or complaints, by gender Women’s market penetration Women clients as a percent of addressable market
Women’s market share Women clients as a percent of total women served by comparable providers in the market Women’s repayment capacity Portfolio at risk > 30 days, by gender Women’s saving activity Percent of active and dormant savings accounts, by gender Average number of transactions (deposits/withdrawals) per month, by gender Average transaction amount (deposits/withdrawals), by gender
Alliance for Financial Inclusion
AFI, Sasana Kijang, 2, Jalan Dato’ Onn, 50480 Kuala Lumpur, Malaysia t +60 3 2776 9000 e info@afi-global.org www.afi-global.org


