3 minute read
Drink Your Milk!
“Drink your milk.” That was probably a phrase that you heard as a child and/or something you told your children. Milk has been called “nature’s most perfect food” for providing essential vitamins and minerals. In fact, the 2015-2020 Dietary Guidelines for Americans recommend three servings of dairy products a day for ages 9 and up. Milk has probably been a part of your diet for many years, but the market for dairy products is changing.
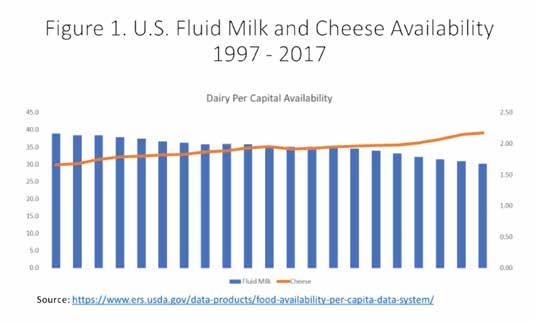
Figure 1 shows what happened to the dairy product availability/consumption in the U.S. from 1997 to 2017. It needs to be noted that there are two different scales. The left scale is in pounds and represents cheese. The blue bars represent fluid milk and cream with a scale of 100 pounds. This is per capita availability which is considered a proxy for consumption. The fluid milk and cream segment, combined with the cheese segment of dairy products, accounts for approximately 85% of the dairy product availability.
Advertisement
First the good news: The cheese availability has increased over 30% from 29.9 pounds in 1997 up to 39.1 pounds in 2017. Cheese noted here includes whole and part-skim milk cheeses and cottage cheeses.

The bad news is that fluid milk and cream availability (consumption) has decreased over 22% from 1997 through 2017. Competition from alternative beverages and changes in lifestyles has decreased the demand for fluid milk.
Although not reflected in Figure 1, availability of other dairy segments is mixed over the 1997 to 2017 time period. Butter consumption has increased slightly from 4.2 pounds to 5.7 pounds. The frozen dairy segment that includes ice creams, sherbet, frozen yogurt and other frozen products saw consumption decrease from 27.8 pounds down to 23 pounds.
As we look at milk production in the U.S. as compared to the number of cows that we have in the domestic dairy herd over the last 50 years, we can see we are becoming more efficient. Figure 2 shows the number of milk cows (thousands) on the left side and milk volume (million) pounds. In 1970, the U.S. had just over 12 million milk cows that produced 117 million pounds of milk or 9,751 pounds of milk per head. In 2019, the number of milk cows had dropped to 9.3 million head, but produced a total of 218.4 million pounds of milk. On a per head basis, that is 23,391 pounds of milk. In this 50-year period, U.S. milk cows are producing 2.33 times as much milk per cow today as they were in 1970.
The improved efficiency in the dairy industry is one part of the improved productivity of all U.S. ag riculture. American farmers produce the cheapest, safest and most abundant food supply in the world. This increased efficiency has changed the structure of agriculture, especially in the dairy industry. The 1969 census shows that 98% of U.S. dairies had less than 100 head of milk cows and less than 2% of dair ies had more than 100 head. That is in stark contrast with numbers from the 2017 census of agriculture showing that 13% of U.S. dairies will have less than 100 head of milk cows and over 55% of U.S. dairies will have over 1,000 head. Dairies with less than 100 cows account for about 11% of the milk sales and the dairies with over 1,000 account for over 56% of milk sales.
We have seen the American dairy industry change in numerous ways over the last 50 years. We have fewer cows producing more milk, but the demand for milk and milk products in the U.S. has decreased. The difference is offset by exports. Exports of U.S. dairy products since 1996 has gone from 3.6% of total production to 14.4% in 2019. The largest customers of U.S. dairy products are Mexico, Southeast Asia, Canada, China and South America.
Alabama currently has 45 commercial dairies in operation. Some of these produce specialty products such as cheese, organic milk and organic cheese. To help these Alabama dairies and the U.S. dairy industry, drink your milk!


