6 minute read
News special
Moving back to normal
Clubland is on the move as we see them filled with members and guests – maybe watching a big sporting event or enjoying a barbecue. But how far down the ‘back to normal’ road are we really? Ashely Cairns reports.
Clubland always presents an extensive programme of social events and entertainments. Now, as members enjoy getting back into their local club, most activities are fully booked, which is great news for clubs (and do spare a thought for the artists who may not have performed for 18-months!).
The UK holiday scene is also booming and parts of the UK are virtually full to bursting. The opportunities are coming back. But are we seeing this in the data? I’ m asking the following three questions and will share the findings and observations in this article:
• Are we back to normal? • How much are we selling? • What products are members and guests going for?
Are we back to normal?
Well, on the first question it is far too premature to talk of being back to normal. Where we are right now is opening tentatively. The tentative description applies to licensees/stewards, committees and members/customers.
Now, a closer scrutiny of the trade and how it is different to where we were.
The wearing of masks is still highly prevalent amongst staff. Sanitisation regimes are significantly more prominent than existed pre-COVID-19. On-line booking is almost mandatory and lastly, among my four bigger observations, is that table service has moved forward in execution and frequently being retained.
What this of course means, is that our members have some newer expectations for ‘ normal’ . It appears this relates to a large proportion of consumers. This may help the trade with its approach to general hygiene. Time will tell, but I certainly see that premises are airier and tidier. That can only help raise hygiene in the customer hierarchy of needs to a ‘ must do well’ in licensed premises to attain their approval.
Fromgeneralresearchofconsumers,thelatestestimates from a CGA Strategy Pulse Survey show that, for example, 69% of ‘ nightclub-goers ’ are re-engaging by hitting the dance floor. Across the whole of the market,thatweekcommonlycalled‘FreedomDay ’in England, data was showing that 73% of out of home customers have been back to the on trade.
Behind this, the frequency of going-out is also down as a proportion of customers having reduced their visits. The research continues to indicate that younger persons are more comfortable going out compared to the older age group where there is a higher level of caution. The one positive is that consumers have an increased tendency to stay closer to home.
Briefly, it looks like there are actually less customers at present and they are visiting less but staying local.
There is, in the last element, that opportunity for some in Clubland to perhaps increase either their customer base or existing customers visit frequency. That is perhaps a challenge but in the long-run new customers are a must so go for it! >
How much are we selling?
The trade has opened up progressively since midMay, but still was constrained during that period with COVID-19 advice and regulations. Into lateJuly early-August we reached what resembled preCOVID-19 normal trading. Compare what members and staff had to do in, say, May 2021 to current and there are several important differences from the earlier time. These included elements such as: trading times being tighter; requirements in place to register a customer; asking them to wait to be seated and, lastly, only able to serve them at a table. All of those impositions made the on trade more stilted and slowed it down. If this was a plan, it seemed to work as has been seen in visit data (numbers of premises trading and volume of drink sold).
To measure sales performance, total volumes have been converted to an all drinks count. This is a
‘ standard drink serve ’ and converts volume into standard drinks (i.e. a spirit is converted into a 25ml serve; a glass of wine to a 175ml glass and draught beer into a pint).
Earliest signs from July ’ s data showed that trade is coming back, but there is still a way to go. Across the quarter, sales were down in all categories by -44% compared to same quarter in 2019, slightly worse when compared to 2018 at -46%.
Over a 4-week period (19 June – 17 July) comparisons improved markedly as can be seen here, but there is a way to go until we may see parity.
All drinks volumes Pd7 2021 Pd6 2021 Pd5 2021 17/7/21 19/6/21 22/5/21 -26.0% -35.9% -71.1%
That is a stark message. However, at this point there were still have restrictions in Wales and Scotland as well as other premises choosing not to open at that point.
What products are customers going for?
The earliest sales data is difficult to read (as outlined above) but the products side is perhaps a little easier to see in so far as it is the ‘Share of Drinks ’ looked at by mix.
The drinks range covered is Beer, Cider, Spirits, Wines and Soft Drinks. The analysis covered the 12 weeks up to mid-July 2021 and the relative measure used value sales across the Sports & Social Club channel.
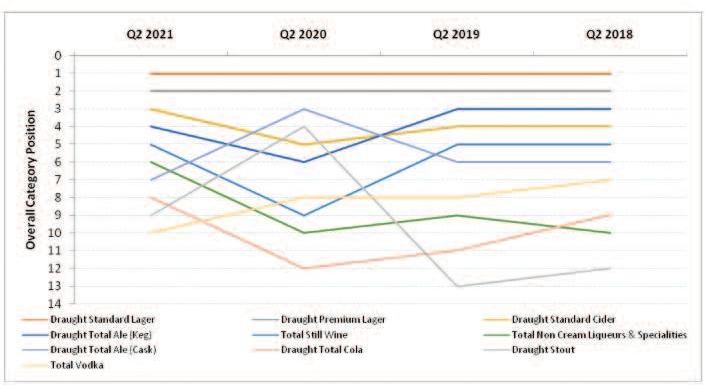
The biggest products categories still retain their dominance and so it can be seen that Draught Standard and Premium Lager are the two most important product categories, accounting for 35% of sales. This is in line with 2019 and 2018 levels.
The next two are the same, although have swapped the historic positions as Draught Standard Ciders moved up to third spot over Keg Ales. I should point out that the latest data includes the late-Spring heat wave that certainly benefits the Cider category. It is quite possible that in the midst of the pandemic there was much more volatility and lower level of sales that these suffered as shown in the chart below. Notably in this period we see that Cask rose to the 3rd largest product category. It is most likely that Cask, by virtue of its uniqueness, was a favourite drink especially in the takeaway format. Cask has dropped down to the seventh spot in 2021.
Wine was 5th before and is 4th now. In the pandemic it dropped to 9th, but of course it was readily available via off sale, so less likely to have benefited during that most restrictive period.
The rise up the sales value table of what are collectively called Non Cream Liqueurs, then add to this observation similar rises in draught Cola, plus rises for Mixers, Juices, Sparkling Wine (not shown in chart) of the elements that form the cocktail. It is widely documented that cocktails are a growing serve type and that is an opportunity for Clubland.
Collectively the ten product categories that are shown accounted for 70% of total sales value. This is a very similar level to the previous years of 2019 and 2018.
As one can see there is a shift though in the categories at present. The hard to gauge element is as suggested above that the demand for cocktails or perhaps simpler established mixed spirits drinks is the upward trend in Clubland as it appears to be in other channels.


