27 minute read
Annual Enhancements to TransTasman Angus Cattle Evaluation December 2022


A number of significant enhancements were recently made to the calculation of Estimated Breeding Values (EBVs) for Angus cattle in Australia and New Zealand.
The enhancements were part of the annual updates that Angus Australia makes to the TransTasman Angus Cattle Evaluation, with the enhancements implemented in the December 2022 analysis. Angus Australia’s General Manager Genetic Improvement, Mr Christian Duff explained that Angus Australia is focussed on providing a world leading genetic evaluation service to Angus breeders. “The annual updates that are made to the TransTasman Angus Cattle Evaluation ensure that the EBVs published for Angus animals continue to be the best possible estimate of an animal’s breeding value, maximising the genetic improvement that is being achieved in Angus breeding programs”, said Mr Duff. “The enhancements are made possible through strong collaboration with R&D and service delivery partners, particularly the Animal Genetics & Breeding Unit (AGBU), the Agricultural Business Research Institute (ABRI) and CSIRO - Australia’s national science agency.”, Mr. Duff added. The enhancements implemented in 2022 focussed on providing Angus breeders with the tools to make more accurate selection decisions from the availability of next generation breeding values, particularly for the EBVs related to carcase weight, quality and yield, while also introducing evaluation efficiencies that will ensure the long term viability of the genetic evaluation. The enhancements implemented in 2022 broadly fell into five main categories: · New variance components (adjustment factors, heritabilities, genetic correlations) · New algorithm for calculating EBV Accuracies (TBLUP) · New software for Docility EBVs · Publication of Leg Angle EBVs · Publication of ImmuneDEX RBVs for genotyped animals Angus Australia’s Genetic Evaluation Manager, Mr Andrew Byrne, highlighted that the introduction of new variance components represented one of the most significant updates to the TransTasman Angus Cattle Evaluation in recent times. “The availability of comprehensive phenotypic measurements on modern Angus animals in the Angus Sire Benchmarking Program, particularly abattoir carcase measurements, has provided geneticists at AGBU in Armidale with an invaluable resource for the estimation of variance components, such as the heritability of each trait and the genetic relationship between different traits”. “The availability of the new variance component estimates will result in the calculation of EBVs that better predict the breeding values of contemporary Angus animals”, said Mr Byrne. Detailed information about the enhancements that were implemented into the TransTasman Angus Cattle Evaluation are provided on the following pages.
Acknowledgements
The enhancements to the TransTasman Angus Cattle Evaluation in December 2022 were the result of considerable collaboration between Angus Australia and a number of livestock genetics research and service delivery organisations.
Angus Australia would like to extend our thanks and gratitude to:
· staff at the Animal Genetics & Breeding Unit (AGBU), in particular Dr Steve Miller, Dr Andrew Swan, Dr Gilbert Jeyaruban, Dr David Johnston, Dr Brad Walmsley and Dr Natalie Connors · staff at the Agricultural Business Research Institute (ABRI), in particular Dr Brad Crook · staff at Angus Genetics Inc, in particular Ms Kelli Rettalick, Dr Andre Garcia and Dr Duc Lu · staff at the Commonwealth Scientific and Industrial Research Organisation (CSIRO), in particular Dr Toni Reverter, Dr Brad Hine, Dr Laercio Portoneto, Dr Pamela Alexandre and Dr Aaron Ingham
Enhancement 1 – New Variance Components
Foreword – Dr Steve Miller, AGBU
The new variance components that were implemented into the TransTasman Angus Cattle Evaluation have been the result of a very significant piece of work by AGBU geneticists, primarily Dr. Gilbert Jeyaruban. I recently described these updates to Angus Australia’s Genetic Evaluation Consultative Committee using a car analogy. Internally when the ‘technicians and engineers’ discuss how a genetic evaluation runs, such as the fortnightly TACE evaluation, it is similar to how a mechanic might describe an engine running. Nowadays with onboard computers, electronic ignitions and fuel injection, the idea of a regular ‘tune up’ does not mean the same thing as it did to cars from the mid 1970’s and earlier. In that era, a mechanic would put his hand on top of the air breather housing, which was typically fastened with a wing nut to the carburettor, which would sit atop your V8. Any vibrations would be related to a mis-fire and a well-tuned engine would balance a dime on its edge atop the engine, although I have never seen this accomplished. A well-tuned engine includes many inter-related systems including ignition, fuel and timing. The ignition system would include point and spark plug gaps, as well as timing of the spark related to the piston’s position and RPM. The valve timing relative to the pistons would be factory set, but the high and low speed mixtures on the carburettor would be adjusted to suit the engine. The genetic evaluation, like an engine relies on a number of interrelated systems that all come together to make an evaluation ‘hum’. Like an out of tune engine, when these systems are not optimized, the engine will still run and go down the road, but it won’t ‘hum’ and perform as it could. Performance of the genetic evaluation is not related to horse power or balancing a dime atop an air breather, but is related to the accuracy and predictability of the breeding values produced. The genetic evaluation includes inter-related systems that come together to form an accurate prediction of EBVs. Elements of the system include data edits, adjustment factors for known effects such as age, parameters including measures of variation in traits, heritabilities and correlations between traits, alignment of genomic information and finally post-processing of results to present the EBV on a usable and consistent scale. This system is like an engine and to run properly, each of these factors needs to be adjusted to the breed and these require updating periodically, just like an engine requires periodic ‘tuning’. This ‘tuning’ of evaluations is just one such activity that AGBU undertakes to keep the genetic evaluation system accurate. Unlike a tune up on your car that might take a couple hours of shop time, this tuning of the TransTasman Angus Cattle Evaluation is much more significant, and in this case, has taken months of work from experienced scientists running large analyses on large computers. This development work at AGBU is made possible predominantly from research revenue from Meat and Livestock Australia (MLA) that supports beef genetic evaluations in Australia such as TACE.
feature of all is the routine updating and implementation of variance components that best describe the current recorded population. In the case of the TransTasman Angus Cattle Evaluation, there has been considerable increase in the number of records available since the last set of variance components were implemented in 2014, especially for traits related to the carcase endpoint and for net feed intake. With the implementation of updated variance components in December 2022, the TransTasman Angus Cattle Evaluation will utilise the latest developments in Australian Angus genetics research as well as responding to the request of Angus Australia to ensure the parameters used in the evaluation reflect the on-going investment in data collection by its members.
Foreword – Dr Brad Crook, ABRI
Incorporating the latest developments in Australian beef genetics research is one of ABRI’s highest priorities when it comes to providing commercial genetic evaluation services. Of equal importance is giving consideration to client requests for the research and development they see as needed to ensure the genetic evaluation services reflect the data their members are recording. Balancing these priorities and undertaking the test evaluations needed to progress R&D towards commercial implementation is a core task of the genetic evaluation service provided by ABRI. As populations change over time and as additional performance records are accumulated – especially for traits that are either less common in their levels of recording (e.g., because of cost) or for newly-introduced traits which are still gaining uptake among seedstock breeders – it is necessary to regularly update the variance components used in the evaluation. Whether we a talking about beef evaluations (such as the TransTasman Angus Cattle Evaluation) or evaluations provided for other livestock species, both within and outside of Australia, a consistent
Enhancement 1 – New Variance Components
The most significant enhancement implemented in December 2022, and one of the most important developments within the TransTasman Angus Cattle Evaluation in recent times, is the updating of the variance components that are modelled within the genetic evaluation.
What Are Variance Components?
Variance components are an integral component of the ‘EBV calculation formula’ and can broadly be grouped into three different categories: Adjustment factors: Within the TransTasman Angus Cattle Evaluation, performance measurements are pre-adjusted to account for non-genetic differences in the age of animals, the age of their dam (e.g. animals reared by maiden heifers versus mature females), and in the case of measurements collected in abattoir, differences in the carcase weight of animals. Different adjustments are utilised for the performance measurements of heifers and bulls, and for animals born in different calving seasons, with different methodology used to make the adjustments depending on the trait being analysed. For example, performance measurements may be pre-adjusted using either a linear, multiplicative or quadratic adjustment methodology, subject to what is most appropriate for that trait. Heritability: Heritability refers to the proportion of the variation observed in the performance of animals within a contemporary group that is due to differences in the animal’s genetics. Different heritabilities are modelled for each trait within the TransTasman Angus Cattle Evaluation, with the heritability playing an important role in determining how much influence an animal’s performance measurement will have on its EBV. For traits with a higher heritability: · the animal’s own performance measurement will have a higher influence on its EBV, by comparison to the performance measurements of the animal’s relatives


Figure 1 – Example of the pre-adjustment of a weight trait to remove any differences in performance that are due to differences in the age of animals on the day of measurement
· direct performance measurements for the trait will have a higher influence on the EBVs that are calculated, relative to the performance measurements for indirect ‘correlated’ traits · the EBVs that are calculated will have higher EBV accuracy values · there will be more spread in the EBV values that are published for animals
Genetic Correlation Between Traits: The genetic correlation refers to the genetic relationship that exists between traits. In other words, the genetic correlation refers to the change


that will result in the genetics for other traits, if the genetics of animals are changed for a specific trait. For example, if the genetics of animals are changed for 400 day weight through selection, how much resultant change will occur in ‘correlated’ traits like 600 day weight or carcase weight, due to the genetic relationship that exists between the traits. Within the TransTasman Angus Cattle Evaluation, the genetic correlation between a trait and all other traits is modelled, and determines how much influence the performance measurements for the trait will have on the EBVs that are calculated for the other traits. The genetic correlation that is modelled between traits is of particular importance when performance measurements are not routinely collected for the EBV being published (e.g. retail beef yield).
How Are the Variance Components in the TransTasman Angus Cattle Evaluation Determined?
The variance components that are modelled in the TransTasman Angus Cattle Evaluation are derived from analysis of the performance data that has been submitted to Angus Australia and Angus New Zealand. In this manner, the variance components are specific to the TransTasman Angus Cattle Evaluation, and are appropriate for the performance data that is being analysed in the genetic evaluation. The variance components are not updated at each analysis, but rather are periodically reviewed and updated from time to time. The periodic updating of the variance components is important in ensuring that the genetic evaluation can make the most appropriate use of the performance information that is available when predicting the breeding value for an animal.
What Variance Components Will be Updated?
Deriving the variance components is a considerable task and scientists at the Animal Genetics & Breeding Unit (AGBU) in Armidale have recently completed the reestimation of the variance components for all traits that are analysed in the main multi-trait component of the TransTasman Angus Cattle Evaluation. This comprises the variance components for all traits within the genetic evaluation, with the exception of calving ease, docility, claw set and foot angle. The variance components that are modelled in the main multi-trait component of the TransTasman Angus Cattle Evaluation were last updated in April 2014, and so the update to the variance components in December 2022 is one of the most important updates in recent times. In association with the updating of the variance components, a number of associated changes were also be made to the manner in which performance data is analysed within the genetic evaluation, including: · removal of the pre-adjustment of retail beef yield measurements for differences in carcase weight. · analysis of MSA marbling score data as a genetically correlated trait to IMF. Previously MSA marbling score data was converted into an IMF measurement, and analysed alongside IMF measurements that had been collected on carcases in the abattoir.

The updating of the variance components in December 2022 is of particular importance as there has been a large increase in the amount of performance information that is available for the re-estimation of the variance components, particularly for the carcase and feed efficiency traits. As illustrated in table 1, there was a comparatively small amount of data available for the abattoir carcase and feed efficiency traits in April 2014, however the comprehensive collection of these hard-to-measure traits in the Angus Sire Benchmarking Program (ASBP), and from some member herds, has collectively compiled a considerably larger dataset from which variance components can be estimated for these traits. Furthermore, the performance measurements in the ASBP have been collected on modern, contemporary Angus animals, enabling variance components to be calculated that are relevant to the current population. Of most note is retail beef yield, where the majority of the performance measurements used to estimate variance components for this trait in April 2014 had been collected on animals born in the mid-1990s (see figure 2).
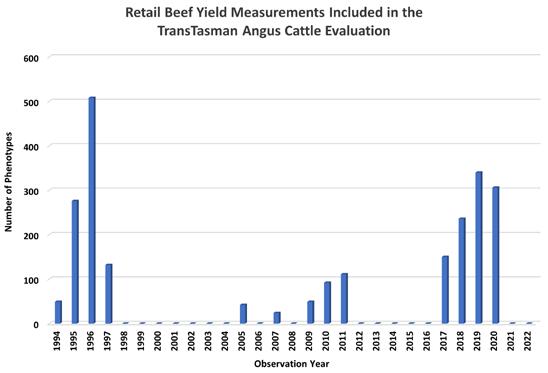
Figure 2 – The phenotypes collected from boned-out carcases in the Angus Sire Benchmarking Program have provided an invaluable resource for the estimation of variance components for retail beef yield
Trait Group
Weight traits
Scan traits
Carcase traits
Fertility
Feed efficiency
Table 1 – Number of performance measurements used to estimate the variance components Trait
Birth weight 200 day weight 400 day weight 600 day weight Mature cow weight
April 2014
308,938 273,546 186,377 108,691 82,576
December 2022
592,028 496,566 361,856 199,954 182,044
Rump fat (Heifer) Rib fat (Heifer) EMA (Heifer) IMF (Heifer) Rump fat (Bull) Rib fat (Bull) EMA (Bull) IMF (Bull) 73,865 73,581 74,338 70,752 76,265 76,249 77,243 73,044 149,420 148,372 150,699 150,356 162,195 161,481 165,858 163,911
Carcase weight Rib fat Rump fat EMA Retail beef yield IMF MSA marble score 7,115 1,419 4,319 2,996 1,069 5,832 0* 18,651 5,088 15,097 7,712 2,241 8,042 10,332
Gestation length Scrotal size Days to calving NFI-P NFI-F 108,747 63,564 175,703 2,983 1,315 229,740 146,396 193,521 3,068 6,912
The most considerable changes to variance components occurred for the carcase and feed efficiency traits. These changes will improve how the abattoir carcase and net feed intake measurements are utilised within the TransTasman Angus Cattle Evaluation. Of particular note is: · more appropriate pre-adjustment of abattoir carcase measurements to remove the effect of differences in age (carcase weight) and dressed carcase weight (carcase rib fat, carcase rump fat, carcase EMA, carcase IMF). · an increase in the heritability of carcase weight, carcase rump fat, carcase EMA and carcase IMF · a decrease heritability of carcase rib fat, carcase retail beef yield and net feed intake While there were some minor changes, the variance components that are modelled for the weight, scan and fertility traits have remained largely unchanged.
Changes to EBVs
While there was general alignment of the EBVs, the updating of the variance components resulted in considerable changes to the EBVs that are calculated within the TransTasman Angus Cattle Evaluation for some traits and animals. To illustrate the change that occurred, the change in EBVs for young bulls (i.e. 2020 born males) and the change in EBVs for sires is provided in Table 2. The correlation listed provides an indication of the amount of re-ranking that occurred, with values close to 1.00 indicating minimal re-ranking will occur. As is evident in the table, considerable re-ranking was evident for the carcase and NFI EBVs, with minimal re-ranking for the weight and fertility traits. The regression co-efficient listed provides an indication in the amount of change that occurred in the spread (or variation) of EBV values between animals. Values less than 1.00 indicate a reduction in the spread of EBVs, while values greater than 1.00 indicate an increase in the spread of EBVs. As is evident in the table, a considerable increase in spread was observed to the carcase weight, EMA, rib fat, rump fat and IMF EBVs, while a considerable decrease in spread was observed in retail beef yield, NFI and days to calving EBVs. Minimal change was observed to the spread of weight EBVs. While not detailed in the table, changes in the EBV accuracy values that are published alongside each EBV was also observed as a result of the updating of the variance components.
EBV
Gestation Length Birth Weight 200 Day Growth 400 Day Weight 600 Day Weight Mature Cow Weight Milk Scrotal Size Days to Calving Carcase Weight EMA Rib Fat Rump Fat Retail Beef Yield IMF NFI-F $A $A-L Table 2 – EBV Change Observed within the TransTasman Angus Cattle Evaluation Young Bulls Sires Correlation Regression Co-Efficient Correlation Regression Co-Efficient
1.00 1.00 0.99 1.00 1.00 0.99 0.99 1.00
n.a 0.95 0.96 0.96 0.93 0.89 0.95 0.91 0.93 0.97 0.98 1.01 1.05 1.05 1.01 0.99 1.00 1.03
n.a 1.13 1.20 1.15 1.22 0.53 1.24 0.84 0.82 0.88 1.00 1.00 1.00 1.00 1.00 1.00 0.97 1.00 0.98 0.98 0.97 0.95 0.93 0.86 0.95 0.96 0.98 0.99 0.98 1.01 1.05 1.04 1.00 1.00 0.87 1.03 0.77 1.08 1.19 1.18 1.22 0.54 1.12 0.89 0.89 0.91
Table 2 provides an indication of the changes that occurred to EBVs at a population level. To illustrate the change that occurred in the EBVs for individual animals, the change in the percentile band value for each EBV for the most widely used sires in the Angus breed in the past 2 years is presented in table 3. A value of 0 in the figure indicates that there was no change in the percentile band in which the sire sits for that EBV. Positive values (highlighted in red) in the figure indicate that the percentile band value increased, while negative values (highlighted in blue) indicate the percentile band value decreased. For example, if a sire’s percentile band value for a particular EBV changed from the 30th percentile to the 10th percentile, the value in table 3 would -20. As illustrated, considerable re-ranking was observed in the carcase traits, with the percentile band value for some individual sires changing by as much as +/- 50 percentile units. Some re-ranking occurred in NFI and Days to Calving EBVs, while minimal change was observed in the ranking of individual animals for the weight traits.
Impact on Selection Indexes
The changes that occurred to the EBVs that are calculated also resulted in some changes to the selection indexes that are published for animals. Most of the changes in selection indexes can be attributed to changes in the spread of EBV values, along with reranking of animals for the Retail Beef Yield, IMF and Days to Calving EBVs.

Changes to EBV Reference Tables
The changes that occurred to the EBVs that are calculated also resulted in some changes to the breed average EBVs and percentile band tables. It will be important for Angus breeders to take time to review the EBV reference tables to “re-benchmark” themselves.

Table 3 - Change in EBV Percentile Band for Most Widely Used Sires

Scientists at the Animal Genetics & Breeding Unit have conducted a number of forward validation analyses to assess the robustness of the EBVs that are now published following the updating of the variance components that are applied in the TransTasman Angus Cattle Evaluation. Specifically, forward validation analyses were conducted using a method that removed all performance measurements collected on animals born from 2018 onwards. EBVs were calculated for these animals with their performance measurements removed, and the EBVs were then used as a validation dataset by comparing the EBVs that were calculated to the performance measurements for these animals. Three statistics were reviewed to assess the robustness of EBVs, being the prediction accuracy, bias and dispersion, as displayed in Table 4. The forward validation analyses have demonstrated that the EBVs calculated using the updated variance components are reliably predicting the breeding value of animals, and can be used with confidence by Angus breeders in Australia and New Zealand. Table 4 – Forward Validation Analysis Results Demonstrating Predictive Ability of New EBVs
Trait Prediction Accuracy Bias Dispersion
GL 0.67 0.01 0.97 BW 0.81 -0.01 1.03 WW 0.81 -0.07 1.04 YW 0.81 -0.07 1.02 FW 0.82 -0.03 1.01 MCW 0.84 0.03 1.03 CWT 0.66 0.03 1.06 CRF 0.66 -0.07 0.99 CP8 0.64 -0.04 1.04 CEMA 0.69 0.01 1.16 CRBY 0.60 -0.04 1.01 CIMF 0.73 0.02 1.18 DTC 0.54 0.01 1.11
> Main impacts
The updating of all variance components in the main multi-trait component of the TransTasman Angus Cattle Evaluation resulted in considerable changes to the EBVs and EBV accuracies that are published for Angus animals. Changes were particularly be observed in Carcase Weight, EMA, Rib Fat, Rump Fat, Retail Beef Yield, IMF, Days to Calving and NFI-F EBVs and EBV accuracies, with resultant changes also observed in selection index values.

The algorithm used to calculate the EBV accuracy values has been improved and is now more efficient, precise and faster.
The large number of genotypes included in the TransTasman Angus Cattle Evaluation adds considerable complexity to the computation demands required for the successful operation of the genetic evaluation. To address the increased computation complexity, staff at the Animal Genetics & Breeding Unit (AGBU) have developed new, more efficient algorithms for the calculation of EBVs and the associated EBV accuracy values. The new algorithm for calculating EBVs, known as TBLUP, was introduced into the TransTasman Angus Cattle Evaluation as part of the annual enhancements in December 2020. A new algorithm for calculating the accuracy value that is published alongside each EBV has now been implemented in December 2022. The new algorithm for calculating EBV accuracy values has several advantages, including: · Efficiency: The new algorithm is more efficient and will cater for the large number of genotypes that are likely to be submitted for inclusion in the TransTasman Angus
Cattle Evaluation in future years. · Speed: The new algorithm is faster and provides considerable savings in memory usage and run time, enabling the bi-monthly schedule for the TransTasman
Angus Cattle Evaluation to be maintained.
Figure 3 – More efficient algorithms have been developed to cater for the large number of genotypes now being included in the TransTasman Angus Cattle Evaluation
· Precision: The new algorithm is more precise in describing the data that is contributing to the estimation of the breeding value. The new algorithm for calculating EBV accuracy was implemented into the genetic evaluations conducted by Sheep Genetics Australia for the Merino, Terminal and Maternal breeds in May 2022, and will now be progressively introduced to the BREEDPLAN genetic evaluations conducted for other beef breeds both domestically and internationally.

> Main impacts
The new algorithm has resulted in some changes to the EBV accuracy values that are published for Angus animals. Animals most impacted will be those with genomic information and limited trait recording, and non-genotyped relatives of genomically tested animals. The new algorithm has not resulted in any changes to the EBVs that are published, only the EBV accuracy values.

Enhancement 3 – New Software for Docility EBVs
The software used to calculate Docility EBVs has been updated, resulting in the publication of Docility EBVs for more animals.
Docility EBVs are calculated within a separate, single trait analysis within the TransTasman Angus cattle evaluation. Previously animals were only included in the docility analysis if they had been scored for docility, or had progeny or grand-progeny scored for docility. New software has been implemented whereby all animals from the main-multi trait component of the TransTasman Angus Cattle Evaluation are included in the docility analysis, resulting in the publication of Docility EBVs for a greater number of animals. While all animals from the main multi-trait component of the TransTasman Angus Cattle Evaluation will now be included in the docility analysis, similar to other EBVs, Docility EBVs will only be published if they meet the minimum accuracy threshold of 25%.

Figure 4 – More than 90% of animals will now have a Docility EBV published in the TransTasman Angus Cattle Evaluation
> Main impacts
· Docility EBVs for more animals: More than 90% of animals will now have a Docility EBV published. Previously, Docility EBVs were published for approximately 25% of animals.
· Docility EBVs published for animals without docility
scores: Animals may now have Docility EBVs published despite having never been scored for docility, or having being bred in a herd that has never collected docility scores. The EBVs published for these animals will be calculated from the docility scores collected on relatives in other herds, subject to the EBV meeting the minimum accuracy threshold. · New Breed Average EBV: The breed average EBV for Docility is approximately +20. The increase from the previous breed average EBV of +7 is due to the inclusion of more animals in the docility analysis, along with the implementation of a base adjustment aiming to minimise the number of animals with a negative Docility EBV value. · Changes to Docility EBVs: While minimal change in the ranking of animals occurred, the implementation of a base adjustment resulted in an increase in the magnitude of the Docility EBV that is published for most animals. In circumstances where the ranking of some individual animals has also changed for docility, the change is due to the inclusion of more complete pedigree information in the docility analysis for these animals, better linking the animals to their relatives.

Enhancement 4 – Publication of Leg Angle EBVs
A new Leg Angle EBV will now be published.
Leg Angle EBVs will now be published for Angus animals recorded with Angus Australia, complementing the existing Claw Set and Foot Angle EBVs. Leg Angle EBVs (Leg) are estimates of genetic differences in rear leg structure when viewed from the side. Leg Angle EBVs are calculated from a subjective assessment of rear leg structure when viewed from the side (angle at the front of the hock), and are expressed in score units. Lower Leg Angle EBVs indicate an animal is expected to produce progeny with, on average, a lower score for leg angle (i.e. straighter angle through the hock joint). Leg Angle EBVs are calculated using a similar analytical model to the model used for Claw Set and Foot Angle, including: · a single trait, linear model · facility to incorporate breeder assessed scores, along with scores collected by an accredited assessor
· facility to incorporate multiple scores per animal · facility to incorporate scores on both yearling animals and mature females · facility to incorporate genomic information into the calculation of EBVs · facility to only incorporate scores of 5 – 9 in the calculation of EBVs In contrast to the Claw Set and Foot Angle EBVs, scores are only included in the calculation of Leg Angle EBVs for animals recorded with Angus Australia. Leg Angle EBVs are not published for animals recorded with the American or Canadian Angus Associations.
> Main impacts
Leg Angle EBVs will now be published for Angus animals recorded with Angus Australia

Figure 5 - Leg Angle EBVs are estimates of genetic differences in rear leg structure when viewed from the side. Figure 6 - Leg Angle EBV distribution for sires with 5 or more progeny scored for leg angle.


Enhancement 5 – Publication of ImmuneDEX RBVs for genotyped animals
Other Enhancements
ImmuneDEX RBVs will now be published for all animals with a genotype.
ImmuneDEX Research Breeding Values (RBVs) will now be published for all animals that have a suitable genomic profile, being HD50K for Angus or Angus GS, or their predecessors. ImmuneDEX RBVs provide estimates of genetic differences between animals for overall immune competence, a key component of resilience. ImmuneDEX RBVs are calculated from an animal’s genomic profile, based on a genomic reference population comprised of animals primarily from the Angus Sire Benchmarking Program. Animals in the genomic reference population have been assessed for immune competence combining measures of antibody-mediated immune responses (Ab_IR), through a blood test, and cell-mediated immune responses (Cell_IR), through a skin reaction test. Higher ImmuneDEX RBVs indicate an animal is expected to produce progeny with an enhanced ability to resist disease challenges and therefore have lower disease incidence. Lower ImmuneDEX RBVs indicate an animal is expected to produce progeny with a higher incidence of disease and associated production losses. The availability of ImmuneDEX RBVs on a larger number of animals will enable Angus breeders to place selection emphasis on immune competence and resilience traits, while continuing selection for other traits of importance within their breeding objective.
> Main impacts
ImmuneDEX Research Breeding Values will now be published for all animals that have a suitable genomic profile, being HD50K for Angus or Angus GS, or their predecessors.
In addition, a number of other enhancements were also implemented. These enhancements were less significant, but formed an important part of the ongoing maintenance of the TransTasman Angus Cattle Evaluation.
Maintenance of Genomic Pipeline
Several elements of the pipeline by which genomic information is incorporated into the calculation of EBVs have been updated, including: · Re-estimation of the reference haplotype library: The reference haplotype library that is used when converting (imputing) the raw genotypes from different genotyping platforms into a standard set of SNPs for use in the genetic evaluation has been updated. Some changes in EBVs were observed for animals with low density genotypes (i.e. <20K) or their close relatives as a result of this enhancement. · Incorporation of additional SNPs: The single nucleotide polymorphisms (SNPs) that are used in the genetic evaluation have been updated to include additional
SNPs from the latest genotyping platforms. · Re-estimation of the allele frequencies: Allele frequencies are used to assess whether an animal is sufficiently related to the genomic reference population
to enable the utilisation of its genomic information in the genetic evaluation. The allele frequencies used as part of these quality assurance checks and may result in the inclusion of a small number of genotypes that were previously excluded, or conversely the exclusion of a small number of genotypes that were previously included in the genetic evaluation. The updating of these elements has resulted in minor changes in EBVs and EBV accuracies for most animals.
Importation of Overseas EPDs
A revised set of EPDs have been included for imported animals that are recorded with the American and Canadian Angus Associations. The inclusion of updated EPDs has resulted in changes to the EBVs for some imported animals, and their relatives. EPDs will no longer be updated for imported animals that are recorded with the Red Angus Association of America.


