The TransTasman Angus Cattle Evaluation (TACE) is the genetic evaluation program adopted by Angus Australia for Angus and Angus influenced beef cattle. TACE uses Best Linear Unbiased Prediction (BLUP) technology to produce Estimated Breeding Values (EBVs) of recorded cattle for a range of important production traits (e.g. weight, carcase, fertility).
What is an EBV?
An animal’s breeding value can be defined as its genetic merit for each trait. While it is not possible to determine an animal’s true breeding value, it is possible to estimate it. These estimates of an animal’s true breeding value are called EBVs (Estimated Breeding Values).
TACE includes pedigree, performance and genomic information from the Angus Australia and New Zealand Angus Association databases to evaluate the genetics of animals across Australia and New Zealand.
TACE EBVs are expressed as the difference between an individual animal’s genetics and a historical genetic level (i.e. group of animals) within the TACE genetic evaluation, and are reported in the units in which the measurements are taken.
EBVs are calculated for a range of traits within TACE, covering calving ease, growth, fertility, maternal performance, carcase merit, feed efficiency, temperament and structural soundness.
TACE analyses are conducted by the Agricultural Business Research Institute (ABRI), using software developed by the Animal Genetics and Breeding Unit (AGBU), a joint institute of NSW Agriculture and the University of New England. Ongoing BREEDPLAN research and development is supported by Meat and Livestock Australia.
Using EBVs to Compare the Genetics of Two Animals
Using EBVs to Benchmark an Animal’s Genetics with the Breed
TACE EBVs can be used to estimate the expected difference in the genetics of two animals, with the expected difference equating to half the difference in the EBVs of the animals, all other things being equal (e.g. they are joined to the same animal/s).
For example, a bull with an IMF EBV of +3.0 would be expected to produce progeny with on average, 1% more intramuscular fat in a 400 kg carcase than a bull with a IMF EBV of +1.0 (i.e. 2% difference between the sire’s EBVs, then halved as the sire only contributes half the genetics).
Importantly, TACE EBVs can only be used to estimate the difference in the genetics of two animals who both have TACE EBVs. TACE EBVs are not directly comparable with BREEDPLAN EBVs calculated in other genetic evaluations.
TACE EBVs can also be used to benchmark an animal’s genetics relative to the genetics of other Angus or Angus influenced animals in Australia and New Zealand.
To benchmark an animal’s genetics relative to other Angus animals, an animal’s EBV can be compared to:
• the breed average EBV
• the percentile table
The current breed average and percentile table for each EBV can be found on the Angus Australia website, or they are normally listed in most TACE reports, sale and semen catalogues.
Example: Expected Difference in Progeny Performance
All other things being equal, a bull with a 200 Day Growth EBV of +60 would be expected to produce progeny that are, on average, 10 kg heavier at 200 days of age than a bull with a 200 Day Growth EBV of +40 kg (i.e. 20 kg difference between the sire’s EBVs, then halved as the sire only contributes half the genetics).
kg +10 kg +10 kg
Bull A
Bull B
Example: Using EBVs to Benchmark an Animal’s Genetics
Relative to the two year old animals analysed in TACE, the example bull would be expected, all other things being equal, to:
EXAMPLE BULL
cause more calving difficulty than average when joined to heifers who calve down at 2 years of age (Calving Ease Direct EBV in the bottom 20% or 80th percentile)
have calves that are heavier than average when weighed as yearlings (400 Day Weight EBV in the heaviest 10% or 10th percentile)
produce daughters with lower fertility than average (Days to Calving EBVs in the bottom 20% or 80th percentile)
produce progeny with heavier carcase weights than average (Carcase Weight EBV in the heaviest 10% or 10th percentile)
produce progeny with higher marbling than average (IMF EBVs in the highest 40% or 40th percentile)
Considering Accuracy
An accuracy value is published in association with each EBV, which is usually displayed as a percentage value immediately below the EBV.
The accuracy value provides an indication of the reliability of the EBV in estimating the animal’s genetics (or true breeding value), and is an indication of the amount of information that has been used in the calculation of the EBV.
TACE EBVs with accuracy values below 50% should be considered as preliminary or of low accuracy, 50-74% as of medium accuracy, 75-90% of medium to high accuracy, and 90% or greater as high accuracy.
True Breeding Value
Performance
Pedigree
Genomics
TACE analyses pedigree, performance and genomic information to calculate an estimate of an animal’s true genetic merit.
Calving Ease Direct
Calving Ease Direct EBVs are estimates of genetic differences in the ability of a sire’s calves to be born unassisted from 2 year old heifers.
Calving Ease Direct EBVs are calculated from calving difficulty scores, birth weights, gestation length records and/or genomic information, and are expressed as differences in the percentage of calves that will be born unassisted.
Higher Calving Ease Direct EBVs indicate an animal is expected to produce fewer calving difficulties in 2 year old heifers (i.e. greater calving ease).
Easy birth for bull’s progeny
Calving Ease Daughters
Calving Ease Daughters EBVs are estimates of genetic differences in the ability of a sire’s daughters to calve unassisted at 2 years of age.
Calving Ease Daughters EBVs are calculated from calving difficulty scores, birth weights, gestation length records and/or genomic information, and are expressed as differences in the percentage of daughters that will calve unassisted.
Higher Calving Ease Daughters EBVs indicate an animal is expected to produce a higher percentage of daughters who will calve unassisted at 2 years of age.
2 year old heifer daughter Easy birth for daughters at 2 years
Gestation Length
Gestation Length EBVs are estimates of genetic differences between animals in the length of time from the date of conception to the birth of the calf.
Gestation Length EBVs are calculated from the joining date and date of birth records for calves conceived by either artificial insemination (AI) or hand mating, and/or genomic information, and are expressed in day units.
Lower Gestation Length EBVs indicate an animal is expected to produce calves that are born with a shorter gestation length.
Calf born
Birth Weight
Birth Weight EBVs are estimates of genetic differences between animals in calf weight at birth.
Birth Weight EBVs are calculated from the weight of animals at birth and/or genomic information, and are expressed in kilogram units.
Lower Birth Weight EBVs indicate the animal is expected to produce progeny with lighter birth weight.
200 Day Growth
200 Day Growth EBVs are estimates of genetic differences between animals in live weight at 200 days of age due to genetics for growth.
200 Day Growth EBVs are calculated from the live weight performance of animals when they are between 80 and 300 days of age, and/or genomic information, and are expressed in kilogram units.
Higher 200 Day Growth EBVs indicate the animal is expected to produce progeny with heavier live weights at 200 days of age.
400 Day Weight
400 Day Weight EBVs are estimates of genetic differences between animals in live weight at 400 days of age.
400 Day Weight EBVs are calculated from the live weight performance of animals when they are between 301 and 500 days of age, and/or genomic information, and are expressed in kilogram units.
Higher 400 Day Weight EBVs indicate the animal is expected to produce progeny with heavier live weights at 400 days of age.
600 Day Weight
600 Day Weight EBVs are estimates of genetic differences between animals in live weight at 600 days of age.
600 Day Weight EBVs are calculated from the live weight performance of animals when they are between 501 and 900 days of age, and/or genomic information, and are expressed in kilogram units.
Higher 600 Day Weight EBVs indicate the animal is expected to produce progeny with heavier live weights at 600 days of age.
Mature Cow Weight
Mature Cow Weight EBVs are estimates of genetic differences between animals in live weight of cows at 5 years of age.
Mature Cow Weight EBVs are calculated from the live weights of cows when their calves are 200 days of age (i.e. at or around weaning), and/or genomic information, and are expressed in kilogram units.
Higher Mature Cow Weight EBVs indicate the animal is expected to produce daughters with heavier mature weights. Heavier mature weights are associated with higher feed and maintenance costs, but conversely higher returns for cull cows.
Milk
Milk EBVs are estimates of genetic differences between animals in live weight at 200 days of age due to the maternal contribution of its dam.
Milk EBVs are calculated from the live weights of calves at 200 days of age (i.e. at or around weaning), and/or genomic information, and are expressed in kilogram units.
Higher Milk EBVs indicate the animal is expected to produce daughters that have heavier calves at 200 days of age due to superior maternal attributes (e.g. more milk).
Days to Calving
Days to Calving EBVs are estimates of genetic differences between animals in the time from the start of the joining period (i.e. when the female is introduced to a bull) until subsequent calving.
Days to Calving EBVs are calculated from the joining records submitted for both heifers and cows who have been mated naturally in a paddock situation, and are expressed in day units.
Lower Days to Calving EBVs indicate an animal is expected to produce progeny that conceive earlier in the joining period. Females with lower Days to Calving EBVs also tend to show earlier puberty as heifers and earlier return to oestrous after calving.
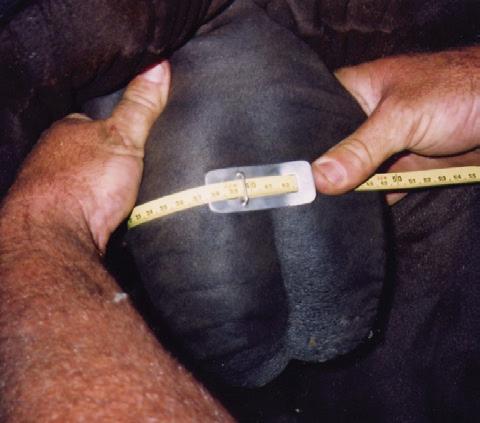
Scrotal Size
Scrotal Size EBVs are estimates of genetic differences between animals in scrotal circumference at 400 days of age.
Scrotal Size EBVs are calculated from scrotal circumference measurements of bulls that are between 300 and 700 days of age, and/or genomic information, and are expressed in centimetre units.
Higher Scrotal Size EBVs indicate the animal is expected to produce sons with larger scrotal circumference as yearlings and daughters that reach puberty earlier.
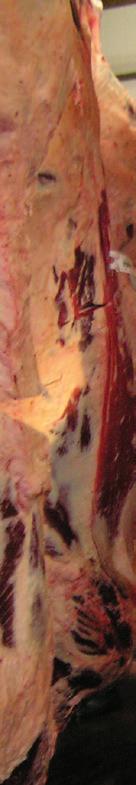
Carcase Weight
Carcase Weight EBVs are estimates of genetic differences between animals in hot standard carcase weight at 750 days of age.
Carcase Weight EBVs are calculated from the hot standard carcase weight of animals between 300 and 1000 days of age, and/or genomic information, and are expressed in kilogram units.
Higher Carcase Weight EBVs indicate the animal is expected to produce progeny with heavier carcase weights.
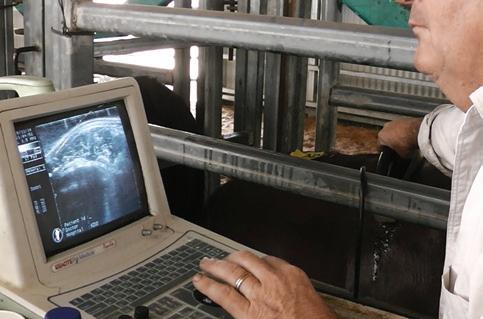
Eye Muscle Area
Eye Muscle Area (EMA) EBVs are estimates of genetic differences between animals in eye muscle area at the 12/13th rib site in a 400 kg carcase.
EMA EBVs are calculated by measuring the area of the cross section of the longissimus dorsi muscle
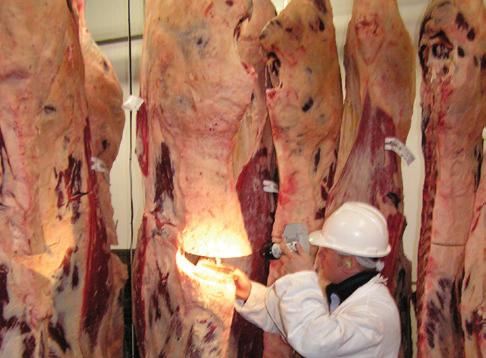
Rib Fat
Rib Fat EBVs are estimates of genetic differences between animals in fat depth at the 12/13th rib site in a 400 kg carcase.
Rib Fat EBVs are calculated by measuring the fat depth at the 12/13th rib site via either live animal ultrasound scanning or direct measurement of carcases in the abattoir, and/or genomic information. Rib Fat EBVs are expressed in millimetre units.
Higher Rib Fat EBVs indicate the animal is expected to produce progeny with greater fat depth in a 400 kg carcase.
Rump Fat
Rump Fat EBVs are estimates of genetic differences between animals in fat depth at the P8 rump site in a 400 kg carcase.
Rump Fat EBVs are calculated by measuring the fat depth at the P8 rump site (located at the intersection of the line from the high bone with a line from the inside of the pin bone) via either live animal ultrasound scanning or direct measurement of carcases in the abattoir, and/or genomic information. Rump Fat EBVs are expressed in millimetre units.
Higher Rump Fat EBVs indicate the animal is expected to produce progeny with greater fat depth in a 400 kg carcase.
Retail Beef Yield
Retail Beef Yield (RBY) EBVs are estimates of genetic differences between animals in boned out saleable meat from a 400 kg carcase.
RBY EBVs are calculated by measuring the boned out saleable meat of carcases in the abattoir, or from known relationships between saleable meat yield and other carcase measurements (e.g. fat depth). RBY EBVs are expressed in percentage units.
Higher RBY EBVs indicate the animal is expected to produce progeny that yield a higher percentage of saleable beef from a 400 kg carcase.
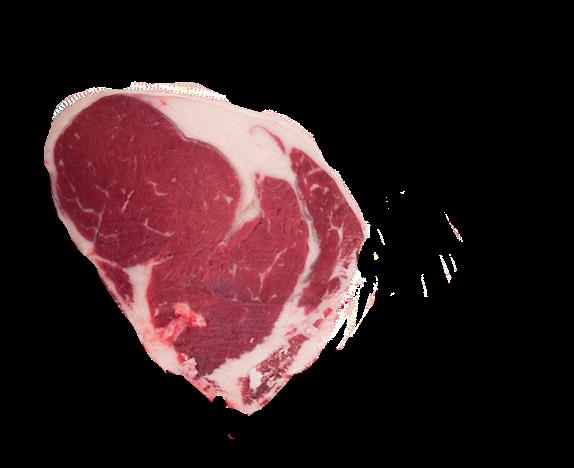
Intramuscular Fat
Intramuscular Fat (IMF) EBVs are estimates of genetic differences between animals in intramuscular fat (marbling) at the 12/13th rib site in a 400 kg carcase.
IMF EBVs are calculated by measuring intramuscular fat in the longissimus dorsi between the 12th and 13th rib via either live animal ultrasound scanning or direct measurement of carcases in the abattoir, and/or genomic information. IMF EBVs are expressed in percentage units.
Higher IMF EBVs indicate the animal is expected to produce progeny with a higher percentage of intramuscular fat (marbling) in a 400 kg carcase.
Net Feed Intake (Feedlot) EBVs are estimates of genetic differences between animals in feed intake at a standard weight and rate of weight gain when animals are in a feedlot finishing phase.
NFI-F EBVs are calculated from the differences in the amount of feed consumed by animals in feed efficiency trials where animals are placed in a feedlot while in a finishing phase, and are expressed in kilogram per day units.
Lower NFI-F EBVs indicate the animal is expected to produce progeny that eat less feed per day, relative to their weight and rate of weight gain.
Docility
Docility EBVs are estimates of genetic differences between animals in temperament.
Docility EBVs are calculated from a subjective assessment of temperament when animals are between 60 to 400 days of age and are expressed in percentage units.
Higher Docility EBVs indicate an animal is expected to produce a higher percentage of progeny with acceptable temperament.
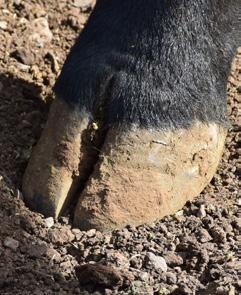
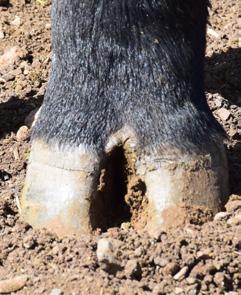
Claw Set
Claw Set EBVs (Claw) are estimates of genetic differences in claw set structure.
Claw Set EBVs are calculated from a subjective assessment of claw set on both the front and back feet (shape, spacing and evenness of claws), and are expressed in score units.
Lower Claw Set EBVs indicate an animal is expected to produce progeny with, on average, a lower score for claw set (i.e. more even claws with less curl).
Claw set structure reflects the shape on the inside edge of each claw, and the space between the claws
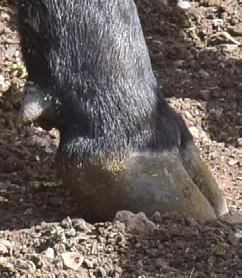
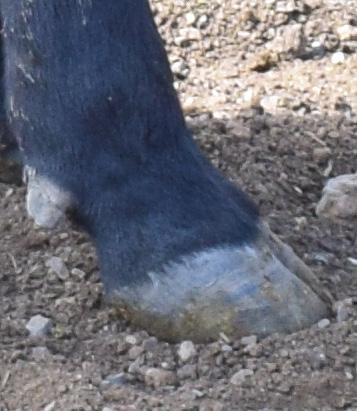
Foot Angle
Foot Angle EBVs (Angle) are estimates of genetic differences in foot angle.
Foot Angle EBVs are calculated from a subjective assessment of foot angle (strength of pastern, depth of heel), and are expressed in score units.
Lower Foot Angle EBVs indicate an animal is expected to produce progeny with, on average, a lower score for foot angle (i.e. straighter pastern joint with more heel depth).
Foot angle structure reflects the angle of the pastern joint, indicated by the depth of heel & angle of the front of the claws
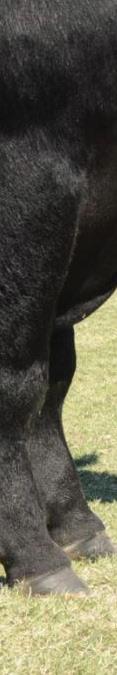
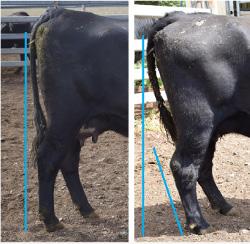
Leg Angle
Leg Angle EBVs (Leg) are estimates of genetic differences in rear leg structure when viewed from the side.
Leg Angle EBVs are calculated from a subjective assessment of rear leg structure when viewed from the side (angle at the front of the hock), and are expressed in score units.
Lower Leg Angle EBVs indicate an animal is expected to produce progeny with, on average, a lower score for leg angle (i.e. straighter angle through the hock joint).
Right: Leg Angle EBVs are estimates of genetic differences in rear leg structure when viewed from the side.
Angus Selection Indexes
In addition to the EBVs that are published, four selection indexes are also calculated for animals within the TACE analysis.
• Angus Breeding Index
• Domestic Index
• Heavy Grain Index
• Heavy Grass Index
The selection indexes assist in making “balanced” selection decisions, taking into account the relevant growth, carcase & fertility attributes of each animal to identify animals that are most suitable for use within a particular commercial enterprise.
Selection indexes reflect both the short term profit generated by an animal through the sale of their progeny, and the longer term profit generated by their daughters in a self-replacing cow herd.
Calculation of Selection Indexes
All selection index values have been derived using BreedObject technology, as developed by the Animal Genetics & Breeding Unit (AGBU) in Armidale, NSW.
Selection index values are reported as an EBV, in units of net profit per cow joined ($) for the given selection scenario.
Selection Index Descriptions
The Angus Breeding Index is a general purpose selection index that is suitable for use in the majority of commercial beef operations, whereas the Domestic, Heavy Grain and Heavy Grass selection indexes are specific to beef operations targeting a defined production system and market endpoint.
Angus Breeding Index
The Angus Breeding Index estimates the genetic differences between animals in net profitability per cow joined in a typical commercial self replacing herd using Angus bulls.
This selection index is not specific to a particular production system or market end-point, but identifies animals that will improve overall profitability in the majority of commercial grass and grain finishing beef production systems.
The Angus Breeding Index is particularly suited to commercial producers who sell progeny into different markets, or to seedstock producers supplying bulls to commercial clients who produce for a range of different production systems and market end points.
Trait Emphasis
The graph below shows the emphasis that has been placed on each trait group in the Angus Breeding Index.
Indicative Response to Selection
The following table shows the indicative change in traits after one generation if producers select animals using the Angus Breeding Index.
The indicative response reflects the change if the Angus Published Sires (at the November 2014 TransTasman Angus Cattle Evaluation) were ranked on this selection index and the Top 10% selected for use within a breeding program. The response will differ if a different group of animals was available for selection and/or a different selection intensity was applied.
Domestic Index
The Domestic Index estimates the genetic differences between animals in net profitability per cow joined in a commercial self replacing herd targeting the domestic supermarket trade.
Steers are assumed to be finished using either grass, grass supplemented by grain or grain (eg. 50 – 70 days) with steers slaughtered at 490 kg live weight (270 kg carcase weight with 12 mm P8 fat depth) at 16 months of age.
Daughters are retained for breeding and therefore maternal traits are of importance. Emphasis has been placed on eating quality and tenderness to favour animals that are suited to MSA requirements.
Trait Emphasis
The graph below shows the emphasis that has been placed on each trait group in the Domestic Index.
Indicative Response to Selection
The following table shows the indicative change in traits after one generation if producers select animals using the Domestic Index.
Group
The indicative response reflects the change if the Angus Published Sires (at the November 2014 TransTasman Angus Cattle Evaluation) were ranked on this selection index and the Top 10% selected for use within a breeding program. The response will differ if a different group of animals was available for selection and/or a different selection intensity was applied.
Heavy Grain Index
The Heavy Grain Index estimates the genetic differences between animals in net profitability per cow joined in a commercial self replacing herd targeting pasture grown steers with a 200 day feedlot finishing period for the grain fed high quality, highly marbled markets.
Steers are assumed to be slaughtered at 760 kg live weight (420 kg carcase weight with 30 mm P8 fat depth) at 24 months of age.
Daughters are retained for breeding and therefore maternal traits are of importance. There is a significant premium for steers that exhibit superior marbling.
Trait Emphasis
The graph below shows the emphasis that has been placed on each trait group in the Heavy Grain Index.
Indicative Response to Selection
The following table shows the indicative change in traits after one generation if producers select animals using the Heavy Grain Index.
Group
The indicative response reflects the change if the Angus Published Sires (at the November 2014 TransTasman Angus Cattle Evaluation) were ranked on this selection index and the Top 10% selected for use within a breeding program. The response will differ if a different group of animals was available for selection and/or a different selection intensity was applied.
Heavy Grass Index
The Heavy Grass Index estimates the genetic differences between animals in net profitability per cow joined in a commercial self replacing herd targeting pasture finished steers.
Steers are assumed to be slaughtered at 620 kg live weight (340 kg carcase weight with 12 mm P8 fat depth) at 22 months of age.
Daughters are retained for breeding and therefore maternal traits are of importance. Emphasis has been placed on eating quality and tenderness to favour animals that are suited to MSA requirements.
Trait Emphasis
The graph below shows the emphasis that has been placed on each trait group in the Heavy Grass Index.
Indicative Response to Selection
The following table shows the indicative change in traits after one generation if producers select animals using the Heavy Grass Index.
Group
The indicative response reflects the change if the Angus Published Sires (at the November 2014 TransTasman Angus Cattle Evaluation) were ranked on this selection index and the Top 10% selected for use within a breeding program. The response will differ if a different group of animals was available for selection and/or a different selection intensity was applied.
Calving Ease Direct
Calving Ease
Daughters
BIRTH
(%) Genetic differences in the ability of a sire’s calves to be born unassisted from 2 year old heifers.
(%) Genetic differences in the ability of a sire’s daughters to calve unassisted at 2 years of age.
Gestation Length days
Birth Weight kg
Genetic differences between animals in the length of time from the date of conception to the birth of the calf.
Genetic differences between animals in calf weight at birth.
GROWTH
Higher EBVs indicate fewer calving difficulties in 2 year old heifers.
Higher EBVs indicate fewer calving difficulties in 2 year old heifers.
Lower EBVs indicate shorter gestation length.
Lower EBVs indicate lighter birth weight.
200 Day Growth kg
400 Day Weight kg
600 Day Weight kg
Mature
Cow Weight kg
Milk kg
Genetic differences between animals in live weight at 200 days of age due to genetics for growth.
Genetic differences between animals in live weight at 400 days of age.
Genetic differences between animals in live weight at 600 days of age.
Genetic differences between animals in live weight of cows at 5 years of age.
Genetic differences between animals in live weight at 200 days of age due to the maternal contribution of its dam.
Higher EBVs indicate heavier live weight.
Higher EBVs indicate heavier live weight.
Higher EBVs indicate heavier live weight.
Higher EBVs indicate heavier mature weight.
Higher EBVs indicate heavier live weight.
Days to Calving days
Scrotal Size cm
Carcase Weight kg
Eye Muscle Area cm2
Rib Fat mm
Rump Fat mm
Retail Beef Yield
Intramuscular Fat
FERTILITY
Genetic differences between animals in the time from the start of the joining period (i.e. when the female is introduced to a bull) until subsequent calving.
Genetic differences between animals in scrotal circumference at 400 days of age.
CARCASE
Genetic differences between animals in hot standard carcase weight at 750 days of age.
Genetic differences between animals in eye muscle area at the 12/13th rib site in a 400 kg carcase.
Genetic differences between animals in fat depth at the 12/13th rib site in a 400 kg carcase.
Genetic differences between animals in fat depth at the P8 rump site in a 400 kg carcase.
% Genetic differences between animals in boned out saleable meat from a 400 kg carcase.
% Genetic differences between animals in intramuscular fat (marbling) at the 12/13th rib site in a 400 kg carcase.
Genetic differences between animals in feed intake at a standard weight and rate of weight gain when animals are in a feedlot finishing phase.
TEMPERAMENT
Docility % Genetic differences between animals in temperament.
STRUCTURE
Lower EBVs indicate more feed efficiency.
Claw Set score
Foot Angle score
Genetic differences between animals in claw set.
Genetic differences between animals in foot angle.
Higher EBVs indicate better temperament.
Lower EBVs indicate a more desirable structure.
Lower EBVs indicate a more desirable structure.
Angus Breeding Index
Domestic Index
Heavy Grain Index
SELECTION INDEXES
$ Genetic differences between animals in net profitability per cow joined in a typical commercial self replacing herd using Angus bulls. This selection index is not specific to a particular production system or market end-point, but identifies animals that will improve overall profitability in the majority of commercial grass and grain finishing beef production systems.
$ Genetic differences between animals in net profitability per cow joined in a commercial self replacing herd targeting the domestic supermarket trade.
$ Genetic differences between animals in net profitability per cow joined in a commercial self replacing herd targeting pasture grown steers with a 200 day feedlot finishing period for the grain fed high quality, highly marbled markets.
Higher selection index values indicate greater profitability.
Heavy Grass Index
$ Genetic differences between animals in net profitability per cow joined in a commercial self replacing herd targeting pasture finished steers.
Higher selection index values indicate greater profitability.
Higher selection index values indicate greater profitability.
Higher selection index values indicate greater profitability.