

1.2 Tiêu chí chấm điểm IELTS Writing
Bài Writing IELTS được đánh giá dựa trên 4 tiêu chí (marking criteria) gồm Task Response, Coherence & Cohesion, Lexical Resource, Grammatical Range & Accuracy, mỗi tiêu chí chiếm 25% số điểm.
Cụ thể:
Task Response: Thí sinh phải đáp ứng những yêu cầu đề bài đặt ra.
Example: “Summarize the information by selecting and reporting the main features, and make comparisons where relevant. Write at least 150 words”.
• Từ khóa mà bạn cần nắm là: selecting (lựa chọn), main features (đặc điểm chính), make comparisons(so sánh), 150 words.
• Những từ này giúp bạn hiểu được yêu cầu của bài viết là: nhận dạng, nêu những đặc điểm chính, nổi bật và so sánh phù hợp.
• Bài viết tối thiểu 150 từ.
• Nên sử dụng văn phong trang trọng, học thuật.
Coherence & Cohesion: Nên chia các đoạn trong bài một cách hợp lí và có sự gắn kết, mạch lạc của ngôn ngữ trong bài viết. Coherence là sự liên kết về mặt ý tưởng, Cohesion là liên kết về mặt ngữ pháp và từ vựng, được thể hiện qua cách sử dụng Linking Verb.
Lexical Resource:
• Sử dụng từ vựng tự nhiên, linh hoạt
• Áp dụng từ vựng một cách đa dạng vào bài viết
Grammatical Range & Accuracy:
• Hạn chế lỗi chính tả trong bài
• Sử dụng đa dạng các kiểu câu đơn, câu ghép và những câu phức tạp
• Dùng đúng và sử dụng linh hoạt các cấu trúc ngữ pháp, đặt đúng dấu câu
Band Descriptors cho IELTS Writing Task 1
1.3 Cấu trúc bài làm
Có 3 phần nội dung được đưa vào dàn bài, được áp dụng với các dạng bài IELTS Writing Task 1.

• Introduction (đoạn 1): Giới thiệu nội dung
• Overview (đoạn 2): Nhận định chung
• Details (đoạn 3): Mô tả chi tiết
2. Các dạng bài IELTS Writing Task 1
2.1 Line Graph (Biểu đồ đường)
Line Graph (biểu đồ đường) biểu thị các yếu tố về thời gian. Ở dạng bài này, ta thường thấy sự thay đổi, xu hướng của một hay nhiều đối tượng thông qua thời gian cụ thể.
• Trục tung (biểu thị số liệu)
• Trục hoành (biểu thị các mốc thời gian).
Các dạng Writing Task 1 IELTS dạng Line Graph

2.2 Bar Chart (Biểu đồ cột)
Bar Chart (biểu đồ cột) biểu thị số liệu để so sánh hoặc thể hiện sự thay đổi của nhiều đối tượng tại một thời gian nhất định. Biểu đồ được thể hiện ở dạng hình cột,
có trục tung và trục hoành. Ngoài ra, biểu đồ cột còn có dạng xếp chồng, nằm ngang (nhưng không thay đổi gì về nội dung thể hiện).
Dạng biểu đồ cột trong IELTS Writing Task 1
2.3 Pie Chart (Biểu đồ hình tròn)
Pie Chart (Biểu đồ tròn) gồm các tỉ lệ phần trăm của nhiều đối tượng. Hoặc biểu thị phần trăm các thành phần của một đối tượng. Thông thường, biểu đồ tròn sẽ có số lượng từ 2 đối tượng trở lên. Biểu đồ này có thể mang yếu tố về thời gian, đại diện cho từng đối tượng cụ thể

Dạng biểu đồ hình tròn trong các dạng Writing Task 1 IELTS
2.4 Table (Bảng số liệu)
Table (số liệu) cho biết các số liệu liên quan đến từng đối tượng, hạng mục cụ thể.
Dạng này sử dụng Language of Comparison và Language of Change ngôn ngữ mô tả sự thay đổi (nếu có từ hai mốc thời gian trở lên) và diễn đạt số liệu giống với biểu đồ. Bảng số liệu có thể được chuyển hóa đa dạng thành các dạng biểu đồ khác nhau.

Dạng bảng số liệu trong IELTS Writing Task 1

2.5 Mixed Charts (Biểu đồ kết hợp)
Mixed Charts (biểu đồ kết hợp) được tạo thành từ các dạng bài ở trên. Các cặp thường gặp là biểu đồ tròn bảng số liệu, biểu đồ tròn biểu đồ cột. Các biểu đồ đều có mối liên hệ nhất định, bạn cần nhận biết và trình bày ở phần mở đầu bài viết.
Dạng biểu đồ kết hợp trong IELTS Writing Task 1
2.6 Process (Quy trình)
Có 2 quy trình ở dạng bài Process:
1. Natural Process (quy trình tự nhiên): Mô tả quá trình phát triển, sinh trưởng, tiến hóa và đặc điểm từng giai đoạn của sinh vật.
2. Man Made Process (quy trình nhân tạo): Mô tả quá trình sản xuất, chế tạo, tái chế đồ vật, sản phẩm, cơ chế làm việc của hệ thống, máy móc dưới tác động của con người.


Maps (bản đồ) trong các dạng bài IELTS Writing Task 1 thường cung cấp khoảng 2-3 bản đồ khu vực cụ thể, bố cục tòa nhà, cơ sở và nơi ở vào những thời điểm khác nhau.

Dạng bài Maps trong IELTS Writing Task 1
Tham khảo cách chinh phục dạng MAP trong bài thi IELTS
3. Cách viết các dạng bài IELTS Writing Task 1 chi tiết cho từng dạng
3.1 Đọc và phân tích kỹ đề bài Trước khi bắt đầu làm các dạng Writing Task 1 IELTS, bạn cần trả lời những câu hỏi sau:
• Biểu đồ cho biết điều gì?
• Biểu thị mấy đối tượng, hạng mục?
• Biểu đồ có mấy mốc thời gian?
• Người viết cần sử dụng thì gì?
• Biểu đồ có xu hướng không?
• Biểu đồ có đơn vị là gì?
Bạn cần đọc và phân tích kỹ đề bài

3.2 Cách viết đoạn mở bài Introduction
3.2.1 Diễn đạt khác đi Sau khi nắm rõ thông điệp của đề bài, tiếp theo là triển khai bài viết. Bạn nên viết Introduction Task 1 bằng cách paraphrase diễn đạt đề bài khác đi nhưng vẫn giữ ý nghĩa gốc.
Example:
The line graph below shows the consumption of fish and different kinds of meat in a European country between 1979 and 2004.
Đề bài dạng line graph
Có một số cách viết Introduction trong IELTS Task 1, những cách này nên dùng kết hợp với nhau: 3.2.2 Thay đổi động từ trong xuất hiện ở đề bài
The graph/chart/table/diagram:
• shows
• illustrates
• gives information about/on
• provides information about/on
• compares (nếu có từ hai đối tượng trở lên)
Example:
“The line graph below shows the consumption of fish and different kinds of meat in a European country between 1979 and 2004”.

→ The line graph illustrates the consumption of fish and different kinds of meat in a European country between 1979 and 2004.
Lưu ý: Không sử dụng những từ như below, above trong bài viết.
3.2.3 Sử dụng cấu trúc: How something changed Bạn nên áp dụng cấu trúc này chỉ khi ở dạng bài có từ 2 mốc thời gian trở lên.
Example:
The line graph below shows the consumption of fish and different kinds of meat in a European country between 1979 and 2004.
→ The line graph illustrates how the consumption of fish and different kinds of meat in a European country changed between 1979 and 2004.
3.2.4 Thay cụm từ chỉ nội dung trong đề bài bằng cách sử dụng từ đồng nghĩa hoặc diễn đạt khác đi
Example:
The line graph below shows the consumption of fish and different kinds of meat in a European country between 1979 and 2004.
→ The line graph illustrates the amount of fish and various types of meat consumed in a European nation between 1979 and 2004.
3.2.5 Thay thế cụm từ chỉ thời gian trong đề bài bằng giới từ
Example:
The line graph below shows the consumption of fish and different kinds of meat in a European country between 1979 and 2004.
→ The line graph illustrates the amount of fish and various types of meat consumed in a European nation from 1979 to 2004/over 25 years.
Ngoài ra, nếu đề bài chỉ cho một năm (in 2004) thì có thể paraphrase thành (in the year 2004).
3.3 Cách viết đoạn mô tả chung Overview
Overview là một phần quan trọng của các dạng bài IELTS Writing Task 1. Thí sinh có thể dùng các từ dưới đây dành cho phần mở đầu:
• Overall/ In general
•
As can be seen from the graph/chart
• It is apparent/ clear that
Phần Overview trong IELTS Writing Task 1
3.3.1 Overview của Line Graph, Bar Chart, Pie Chart, Table, Mixed Charts Khi luyện viết Overview Task 1 cho các dạng trên, bạn cần quan sát kĩ biểu đồ và tìm ra khoảng 2 đặc điểm quan trọng (key features) của biểu đồ đó. Ở dạng bài biểu thị nhiều mốc thời gian, hãy chỉ ra sự thay đổi, xu hướng qua giai đoạn được cho. Nên đặt ra câu hỏi để xác định được key features:

• Biểu đồ có mấy mốc thời gian, có xu hướng không?
• Đối tượng nào thay đổi nhiều nhất?
• Điểm nào trên biểu đồ là điểm cao nhất, thấp nhất?
• Có sự chênh lệch đáng kể giữa các đối tượng không?
• Với Mixed Charts, mối quan hệ giữa những biểu đồ này là gì?
3.3.2 Overview của Process
Bạn phải nêu được số lượng các bước hoặc giai đoạn trong quy trình, các bước/giai đoạn đầu và kết thúc khi viết Overview dạng Process trong các dạng bài IELTS Writing Task 1. Có thể dùng các cấu trúc sau:
• There + be + … steps/stages/phases (involved)
Example:
As can be seen in the picture, there are nine steps involved in the process of recycling plastic bottles, beginning with bottles being thrown out and finishing with end products being made.

• The process + be + composed of/comprised (bao gồm) … steps/stages/phases
Example:
As can be seen in the picture, the process of recycling plastic bottles is composed of nine steps, beginning with bottles being thrown out and finishing with end products being made.
Đối với dạng này, bạn cần làm nổi bật được những thay đổi quan trọng của khu vực, cơ sở được cho.
Example: The development of the village of Ryemouth.

Dạng bài Maps trong phần thi viết IELTS Writing Task 1
Overview: It is apparent that the village of Ryemouth has undergone some major changes, with the most noticeable one being the construction of sports areas, the addition of more housing facilities, and the demolition of the fishing port.
3.4 Cách viết đoạn mô tả chi tiết Detail
Với những dạng bài có thay đổi/xu hướng, bạn có thể nhóm các chi tiết theo:
• Những chuyển động/xu hướng giống nhau
• Các chi tiết theo thời gian để so sánh Nhóm các chi tiết giống nhau giữa các hạng mục cho những dạng bài chỉ có một mốc thời gian hoặc không có yếu tố thời gian.
Miêu tả mỗi đoạn một biểu đồ với dạng bài Mixed Charts với 2 biểu đồ.
Chia đôi các bước/giai đoạn trong bài Process ra để viết thành 2 đoạn.
Dạng bài Maps nên chia theo:
• Khu vực
• Những loại thay đổi giống nhau
• Thành phần giống nhau
• Có một số cách triển khai Details như sau:
• Theo hạng mục, đối tượng có giá trị từ cao đến thấp
• Theo trình tự thời gian
Lưu ý khi viết Details:
• Nêu số liệu cụ thể (nếu có)
• Đưa ra thời gian cụ thể (nếu có)
• Có từ hoặc cụm từ nối
4. Kinh nghiệm luyện viết các dạng bài IELTS Writing Task 1
Luyện viết bài IELTS Writing Task 1

Sau đây là một số phương pháp giúp bạn hoàn thành bài thi trong tất cả các dạng bài IELTS Writing Task 1 hiệu quả nhất:
• Tổng hợp các loại câu hỏi: Tổng hợp tất cả câu hỏi ở các dạng bài có thể xuất hiện rồi in ra giấy. So sánh để thấy sự khác nhau và yêu cầu đưa ra của mỗi dạng.
• Luyện viết theo từng phần: Luyện viết khoảng 10 lần cho mỗi phần của bài viết. Từ đó, bạn sẽ rút được cách viết đặc trưng của mỗi đề cũng như cách mô tả số liệu trong thân bài của từng loại.
• Tận dụng các mẫu câu: Sử dụng các tài liệu IELTS tham khảo, hoặc các tài liệu online, bài mẫu để tìm hiểu cách dùng từ vựng, ngữ pháp, cụm từ và cấu trúc câu. Điều này sẽ giúp bạn có khả năng sáng tạo và viết đúng hướng đề bài đưa ra.
• Sử dụng hiệu quả 20 phút làm bài: Với thời gian 20 phút để làm bài, trung bình mỗi đoạn của Task 1 sẽ cần 5 phút để thực hiện. Sau đây là cách phân bổ thời gian làm bài hợp lý:
• 5 phút đầu: Đọc kỹ câu hỏi, bảng biểu đề. Sau đó viết đoạn mở đầu bằng cách paraphrase đề bài.
• 5 phút tiếp theo: Tìm ý bao quát trong biểu đồ, tóm tắt lại trong khoảng 2 câu
• 10 phút còn lại: Đi sâu vào chi tiết, chia thành 2 đoạn nhỏ để cấu trúc bài hợp lý hơn.
Tham khảo video dưới đây để chinh phục các dạng bài IELTS Writing Task
1 một cách dễ dàng

Các bạn thường mắc lỗi về tỉ lệ phần trăm vì chưa hiểu cũng như chưa biết cách phân biệt những từ như “ Percent”, “Percentage”, “Proportion”, “Rate” và “Ratio”. Bạn nên nắm bắt và tìm hiểu thêm các từ này và các giới từ đi theo để sử dụng phù hợp.
5.2 Paraphrasing, Overview chưa rõ ràng
Kỹ năng Paraphrasing rất quan trọng và có thể nâng cao điểm số trong phần thi IELTS Writing Task 1. Bạn cần phải biết cách paraphrase tốt, trình bày Overview rõ ràng về các xu hướng chính, sự khác biệt hoặc các giai đoạn để có thể đạt được Band điểm 6.5+ trở lên.
5.3 Lỗi sai về thì Trường hợp sai về thì thường hay gặp trong các bài thi IELTS Writing. Bạn cần chú ý sử dụng thì trong bài thi chính xác bằng cách xem số liệu được hiển thị trên đề thi có đi kèm các mốc thời gian hay không? Và nhận biết các dấu hiệu liên quan.
6. Các bài mẫu IELTS Writing Task 1 tham khảo
6.1 Bài mẫu dạng Line Graph
Đề thi: The chart below shows the percentage of Australian people who were born in different places of the world. Summarize the information by selecting and reporting the main features and make comparisons where relevant.
Bài mẫu Writing Task 1 dạng Line Graph
Bài tham khảo:
The line graph illustrates the proportion of Australians born overseas between 1976 and 2011.
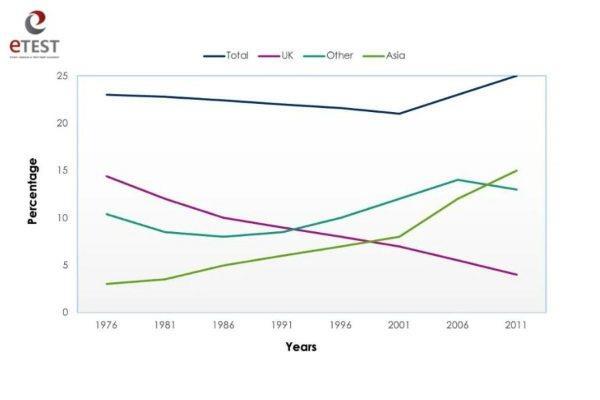
Overall, it is apparent that the percentage of those born in the UK witnessed a downward trend while those from Asia and other places were on the rise. In addition, despite a moderate drop throughout most of the period, the total foreign born population experienced a rising trend in the final decade.
The proportion of British born Australians started at around 15%, which was followed by that of other places (about 11%) and Asia (approximately 3%). Over the following ten years, both the UK and other places saw a falling trend whereas the reverse was true for Australians of Asia descent. From 1986 to 2001, the figures for the UK and Asia continued their respective trends while the percentage of Aussies born in other locations bucked its trend and increased considerably to almost 15%. The first 25 years also recorded a drop from roughly 23% to slightly over 20% in the overseas-born population.
In the 2000s, the percentage of Australian residents born in the UK had a gradual decline before finishing at just below 5%. Meanwhile, the figures for Asia and other places enjoyed increases, going up to high points of about 15% and 13%, respectively. There was also a significant rise in the figure for the total population to a peak of 25% in 2011.
Từ vựng:
• foreign born/overseas born population of Australia: nhóm những cư dân Úc được sinh ra ở nước ngoài
• to be of Asian descent: gốc châu Á
• continue one’s trend: tiếp tục xu hướng
• buck one’s trend: không theo xu hướng
6.2 Bài mẫu dạng Bar Chart
Đề thi: The bar chart below shows the number of visitors to four London museums. Summarize the information by selecting and reporting the main features, and make comparisons where relevant.
Bài mẫu Writing Task 1 dạng Bar Chart

Bài tham khảo:
The bar chart compares the number of visits to four museums in London in five different months, namely June, July, August, September, and December. It is clear that the British Museum almost always led in popularity, whereas the National Museum was the least prevalent choice for visitors in these months. In addition, visitor numbers fluctuated over time, with August seeing the highest visitor volume in all these sites apart from the Science Museum.
In the first two months, there were hardly any changes in the popularity of the four places as the History Museum, the British Museum and the Science Museum received about 400,000 visits each, while visitor numbers to the National Museum hovered around 200,000. However, the remaining months witnessed more remarkable changes, with the figures for the History Museum, the British Museum, and the National Museum soaring in August to peak at 600,000 visits, roughly 710,000 visits and slightly above 300,000 visits, respectively, before dropping substantially in September and December. Meanwhile, there was no change in the number of visitors to the Science Museum in August, which was followed by a marked rise to a high of 500,000 in September and a noticeable fall to merely 300,000 in December. It is worth noticing that visitor traffic to both the History Museum and the National Museum was also lowest in the last month, at only 200,000 visits, more or less.
Từ vựng:
• To lead in popularity: dẫn đầu về mức độ phổ biến.
• To be the least prevalent choice: là lựa chọn kém phổ biến nhất.
• There were hardly any changes: gần như không có sự thay đổi nào.
• To hover around: đứng gần với 1 giá trị.
• Merely (trạng từ): dùng tương tự như “only” để nhấn mạnh một giá trị/ con số nhỏ trong trường hợp của bài này.
• Visitor traffic (danh từ): lưu lượng khách tới một địa điểm hoặc lưu lượng truy cập một website.
6.3 Bài mẫu dạng Pie Chart
Đề
thi: The charts show the percentage of people working in different sectors in town A and B in two years, 1960 and 2010. Summarize the information by selecting and reporting the main features and make comparisons where relevant.

Bài mẫu Writing Task 1 dạng Pie Chart
Bài tham khảo:
The pie charts provide information on the proportion of people with jobs in three sectors, namely manufacturing, sales, and services, in two towns in 1960 and 2010.
Overall, it is clear that the manufacturing sector witnessed a substantial increase in both towns A and town B over the 50 year period. There was also a decline in the proportion of people working in sales in both towns.
In 1960, town A’s workforce was more evenly distributed than town B’s which was more concentrated in the sales sector. More specifically, while two thirds of the workforce in town A work in either manufacturing or services, sales workers in town B accounted for a massive 72%. This figure was almost double the percentage of those with sales-related jobs in town A (41%).
By 2010, manufacturing had become the dominant sector in town A with a hefty 64% of workers and had tripled to nearly a quarter of the labor force in town B. In
contrast, the figures for sales in town A and B dropped to 20% and 54%, respectively. In addition, while the percentage of town A’s workers with servicerelated jobs halved to 16% in 2010, the figure for town B rose slightly from 20% to 22%.
Từ vựng:
• the workforce/ labor force: lực lượng lao động
• distribute (v): phân bố
• dominant (adj): lấn át, vượt trội
6.4 Bài mẫu dạng Table
Đề thi: The table below shows daily oil production in 4 countries from 2000 to 2004.

Bài mẫu Writing Task 1 dạng Table
Bài tham khảo:
The table compares the number of barrels of oil produced in a single day in four African countries, namely Nigeria, Chad, Congo, and Somalia between 2000 and
2004. As can be seen, all countries witnessed an upward trend in their daily oil output, except for Congo. Noticeably, despite seeing the most rapid growth rate over 5 years, Chad remained one of the two smallest producers.
To begin with, there was a switch in ranks between Nigeria and Congo whose daily oil volume far outnumbered the other countries’. In 2000, Congo led in production, at 275,000 barrels whereas Nigeria only made 205,000 barrels per day. However, in 2004, Nigeria overtook Congo to rank first with 213,000 barrels being produced in a single day, 10,000 barrels more than the figure for Congo. However, the daily oil production in the other two countries was insignificant. Specifically, 5000 barrels was the figure for Somalia in 2000, which then saw a steady rise until 2004 when it grew more than two fold to reach 50,000 barrels per day. As for Chad, not until 2003 did this country record its very first 8000 barrels of crude oil produced on a daily basis and this amount surged to finish at an equal level of production to Somalia’s in the last year.
Từ vựng:
• oil output (noun): sản lượng dầu
• a switch in ranks (noun): sự thay đổi về vị thế
• oil volume (noun): sản lượng dầu
• outnumber (verb): cao hơn về mặt giá trị, lượng, số lượng.
• to lead in production (verb): dẫn đầu về sản xuất
• overtake (verb): vượt qua về mặt giá trị và chiếm lấy vị trí của ai/ cái gì.
• record (verb): ghi nhận
• surge (verb): tăng vọt
• level of production (noun): mức độ sản xuất/ sản lượng.
6.5 Bài mẫu dạng Mixed Charts
Đề thi: The table and pie chart give information about the population in Australia according to different nationalities and areas. Summarize the information by selecting and reporting the main features and make comparisons where relevant
Bài mẫu Writing Task 1 dạng Mixed Charts
Bài tham khảo:
The pie chart illustrates the proportion of people of different nationalities in Australia while the table shows their whereabouts.
Overall, the majority of the population has Australian nationality. It is also apparent that people mostly reside in urban areas.
According to the pie chart, a hefty 73% of people living in Australia are Australians. This is followed by the figure for those who hold other nationalities (14%), which is twice as much as that for people of British origin (7%). The remaining groups only account for a minority of the population, with New Zealanders comprising 3%, the Chinese occupying 2% and the Dutch making up 1%.
Regarding the table, it is evident that an overwhelming proportion of residents in Australia are city dwellers regardless of their nationality. Almost all Chinese people, New Zealanders and British people live in cities, at 99%, 90% and 89%, respectively. Likewise, the figures for people of Australian and Dutch descent also

show a preference for urban areas, with a ratio of around 8 urbanites to 2 country dwellers.
Từ vựng:
• whereabouts (n): nơi ở
• urban areas: khu vực đô thị, thành thị
• a city dweller = an urbanite (n): người sống ở thành phố
• a country dweller: người sống ở nông thôn
6.6 Bài mẫu dạng Process
Đề thi: The picture shows the process of making wool. Summarise the information by selecting and reporting the main features, and make comparisons where relevant.

Bài mẫu Writing Task 1 dạng Process
Bài tham khảo:
The diagram illustrates how wool is produced for both personal and industrial use. Generally, it is clear that there are various steps involved, beginning with the sheep
being sheared and ending with the woolen yarns being knitted or woven into commercially made jackets and carpets.
The process commences when the sheep are sheared for their fleece. Once the collective amount of fleece is cleaned with water and chemicals to get rid of contaminants such as grease, twigs, dried sweat, and other debris, it is taken to a drying machine. Following this, the fleece is carded, which results in tufts of wool and pieces of string as byproducts, with the latter being reintroduced into the process to maximize productivity.
Then, woolen tufts are sent to a warehouse for storage before being spun into balls of yarn. In the last stage, these yarn balls are sold for either individual pastimes, like knitting, or the commercial purpose of making jackets or carpets.
Từ vựng:
• Shear (v): xén lông cừu
• Weave (v): dệt
• Fleece (n): bộ lông cừu
• Collective amount (n): lượng tổng hợp
• Contaminant (n): tạp chất
• Grease (n): dầu mỡ
• Twig (n): nhánh cây nhỏ
• Dried sweat: mồ hôi khô
• Debris (n): mảnh vụn
• Card (v): chải len
• Tuft of wool: búi len
• String (n): sợi, thớ
• Byproduct (n): sản phẩm phụ trong quá trình sản xuất
• Reintroduce (v): đưa vào lại
• Spin (v): quay sợi
• Ball of yarn (n): cuộn len
• Pastime (n): trò giải trí
• Commercial purpose (n): mục đích thương mại
6.7 Bài mẫu dạng Maps
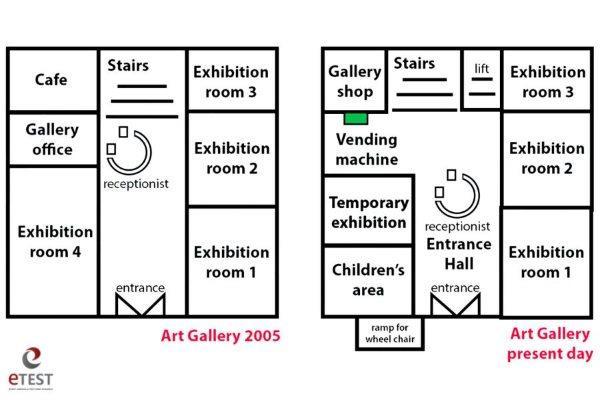
Đề thi: The maps below show the changes in the art gallery ground floor in 2005 and the present day. Summarize the information by selecting the main features, and make comparisons.
Bài mẫu Writing Task 1 dạng Maps
Bài tham khảo:
The maps reveal some changes taking place to the layout of an art gallery’s ground floor between 2005 and the present day.
In general, while the eastern part of the gallery has remained more or less intact over time, the opposite side has undergone significant transformations, with the whole area becoming more accessible for the disabled.
Originally, the gallery was designed merely for its exhibition purpose and visitors could enter the hall through the entrance in the south of the building. Inside the hall, there was a reception desk to welcome visitors, which led to a staircase in the
north end. The remaining part simply consisted of functional areas with a set of 3 exhibition rooms on the eastern wing, one large exhibition space together with an office taking up the entire southwestern corner, and a café in the northwest.
At present, the location has become modernized and versatile, providing more facilities for visitors, especially with the addition of a wheelchair slope right outside the entrance to the west and a lift next to the stairs. To the west, exhibition room 4 was converted into a children’s indoor playground and one smaller room for temporary display, while a gallery shop and a vending machine were opened in place of the original gallery office and the cafe. The final alteration that happened was the relocation of the reception towards the entrance of the gallery.
Từ vựng:
• Layout (N C1): bố cục
• Intact (Adj C1): nguyên vẹn
• Transformation (N C1): sự biến đổi hoàn toàn
• Accessible (Adj C1): có thể tiếp cận
• Merely (Adv C1): chỉ duy nhất (giống only)
• The eastern wing (N B1): chỉ khu vực cánh phía đông của một tòa nhà
• Entire (Adj B2): hoàn toàn
• Versatile (Adj C2): đa năng, linh hoạt
• Convert into (V B2): chuyển đổi thành
• In place of (Phrase B2): thay cho cái gì
• Alteration (N C1): sự thay đổi Nếu bạn còn băn khoăn gặp khó khăn với các dạng bài IELTS Writing hay chưa biết bắt đầu từ đâu, bạn có thể đến các trung tâm giảng dạy tiếng Anh uy tín, có trình độ chuyên môn cao và luyện thi IELTS như Anh ngữ Du học ETEST. Tại Anh ngữ Du học ETEST, bạn sẽ được thử sức với các dạng bài IELTS Writing Task 1 được ra đề trong những năm trước hoặc tổng hợp đề bài dễ xuất hiện trong các kì thi IELTS. Bên cạnh đó, các thầy cô đầy tâm huyết tại trung tâm sẽ giúp bạn cải thiện khả năng viết, khắc phục điểm yếu khi học tiếng Anh trước đây.
