Transportation and Equity
A Case Study In Implementing Quantitative Equity Metrics

Mari Daniels, AICP, Alachua County Assistant County Manager
Chris Dawson, AICP, Alachua County Transportation Planning Manager
Diedre Houchen, PhD, Alachua County Equity & Community Outreach Manager
Ramon D. Gavarrete, P.E., Public Works Director
Aaron Gerber, P.E., Mott MacDonald, Vice President - Asset Management
Speaker Introduction


2
Aaron Gerber, P.E.
Mott MacDonald Vice President | Asset Management
Ramon D. Gavarrete, P.E.
Alachua County Public Works Director
Chris Dawson, AICP
Alachua County Transportation Planning Manager
Diedre Houchen, PhD Alachua County
Equity & Community Outreach Manager
Mari Daniels, AICP Alachua County Assistant County Manager
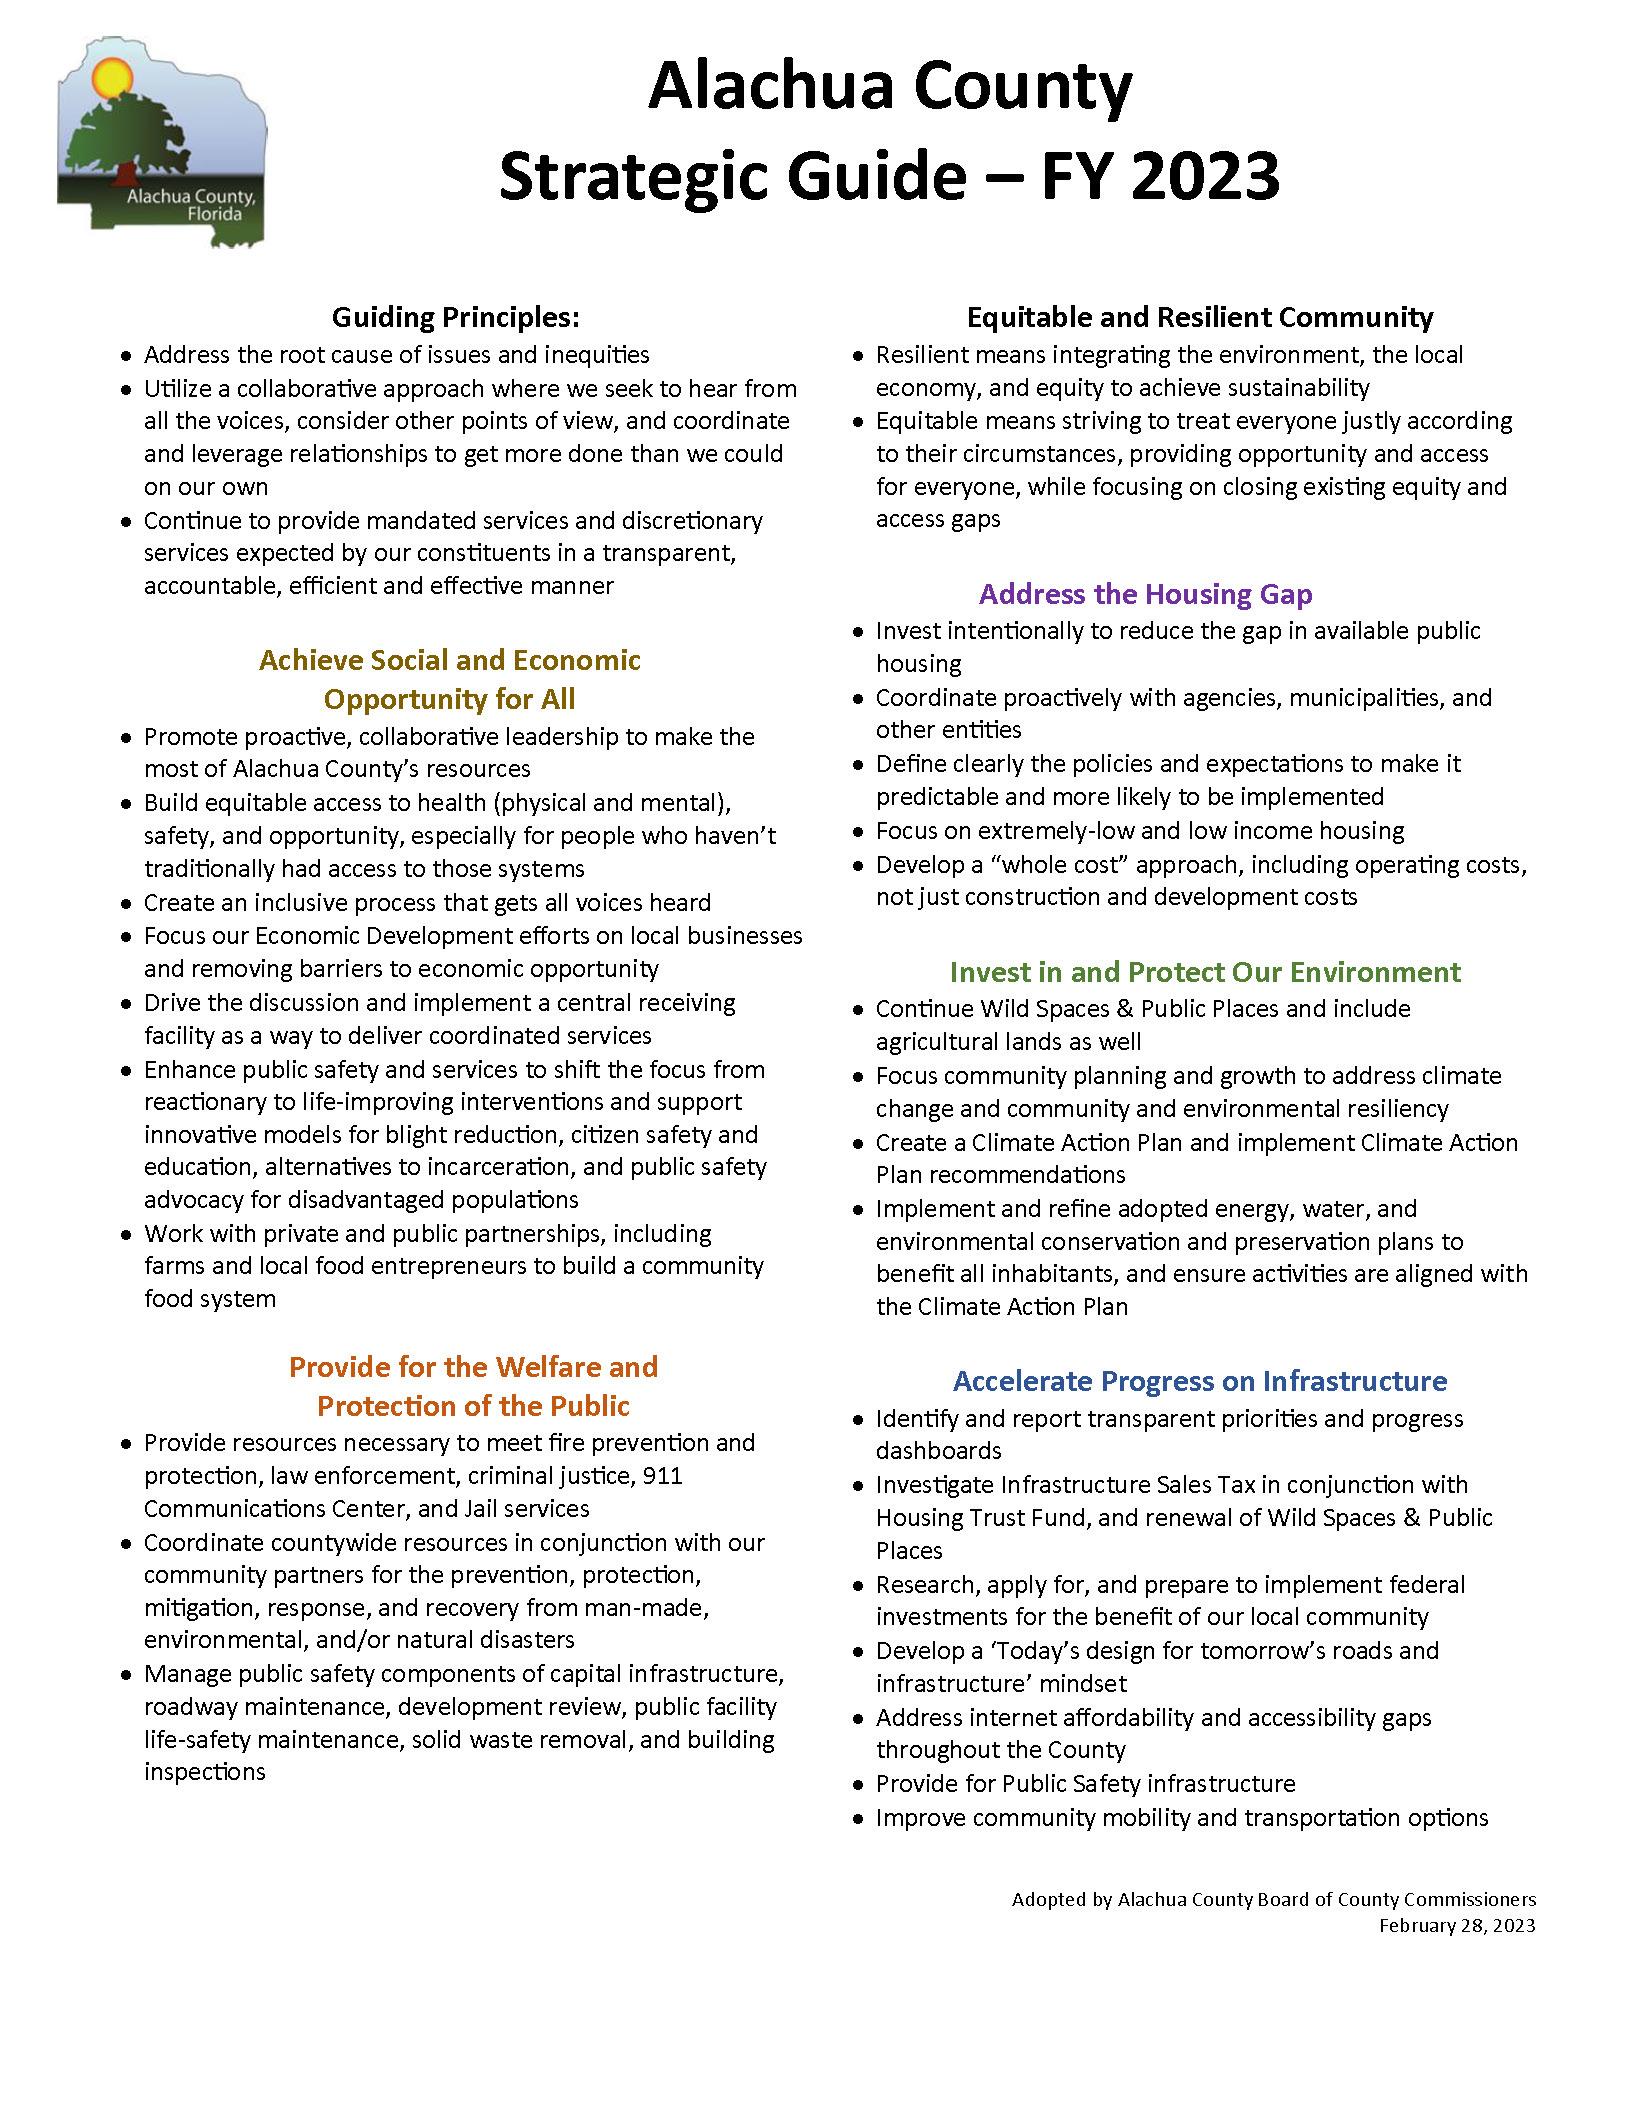
Alachua County Board Level Strategic Guide


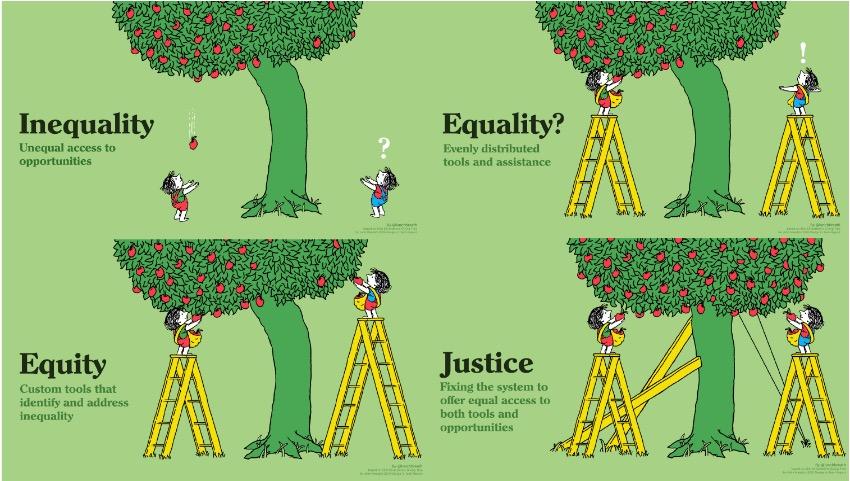
Equity Tree


4
County Overview & Documenting Need

 Ramon D. Gavarrete, P.E., Public Works Director
County Overview & Documenting Need
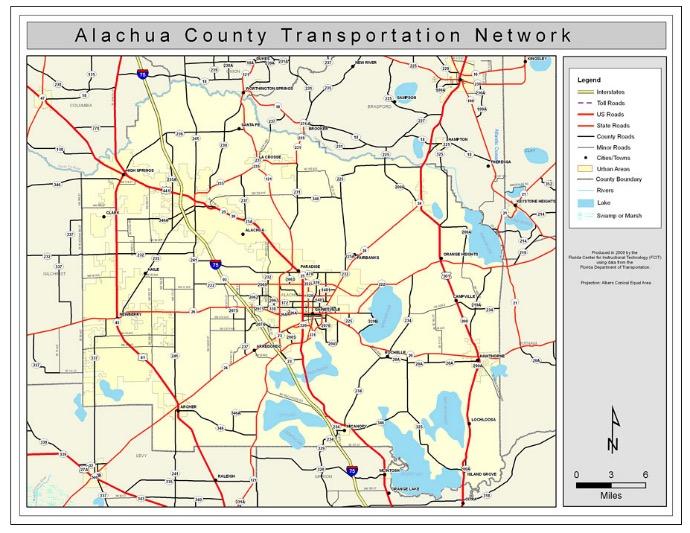

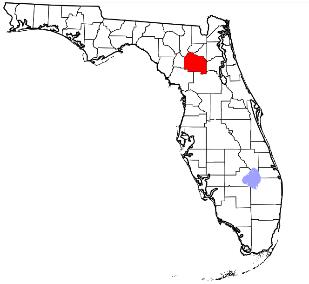
• 278,000 Population (2020)

• 9 Municipalities
• 269 Square Miles
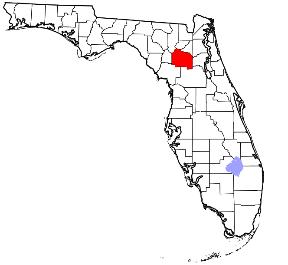
• 690 Paved Road Miles (centerline)
• 200 Unimproved Road Miles
• $4 Million Paving Budget (2022)
6
County Overview & Documenting Need


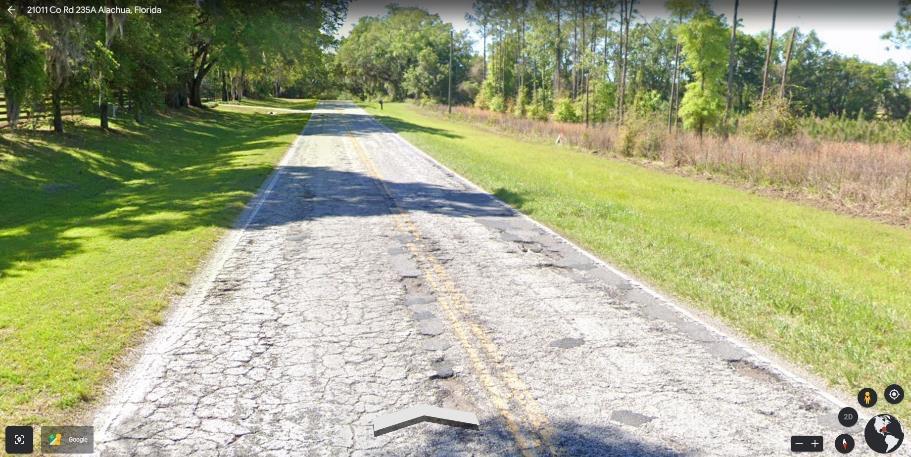
County Road 235A
7
County Overview & Documenting Need

2021 Pavement Management Report by The Kercher Group
– 2020 Pavement Condition Survey (visual)
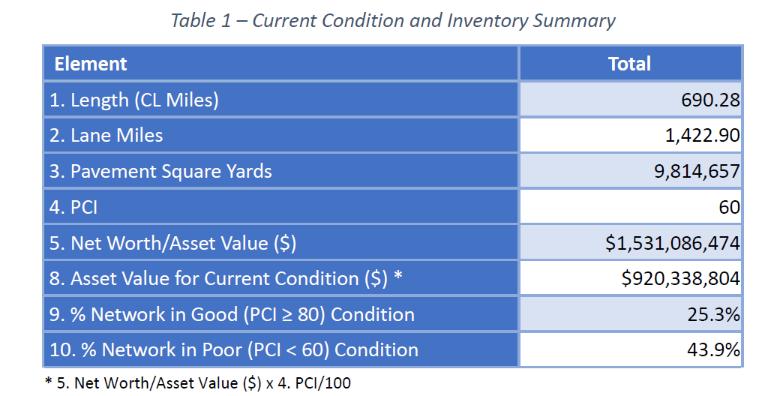

– FHWA Long Term Pavement Performance Methodology
(Average, 2020)
•
8
2021 Pavement Management Report by The Kercher Group
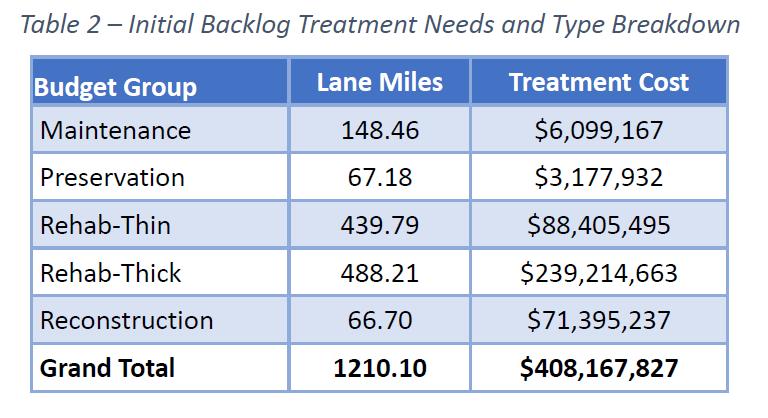


County Overview & Documenting Need 9
Surtax Passes
Thanks to the voters, Alachua County now has a Pavement Management Plan!
• November 8, 2022, Alachua County Voters Pass Ten Year One Penny Surtax

• 1st half cent is dedicated to “Wild Spaces & Public Places (WSPP)”
• 2nd half cent is dedicated to roads, fire stations and other public facilities
• BOCC allocates 70% to roadways

• New Surtax will generate approximately $11.7 million/year for roadways
• $4.2 million in 2023 after city allocations
10
Pavement Management
 Aaron Gerber, P.E., Mott MacDonald, Vice President - Asset Management

Pavement Management
 Aaron Gerber, P.E., Mott MacDonald, Vice President - Asset Management

What is Pavement Management?


“The effective and efficient directing of the various activities involved in providing and sustaining pavements in a condition acceptable to the traveling public at the least life cycle cost.”
• “A coordinated set of activities, all directed toward achieving the best value possible for the available public funds in providing and operating smooth, safe, and economical pavements.”
13 •
Pavement Management – Traditional Process
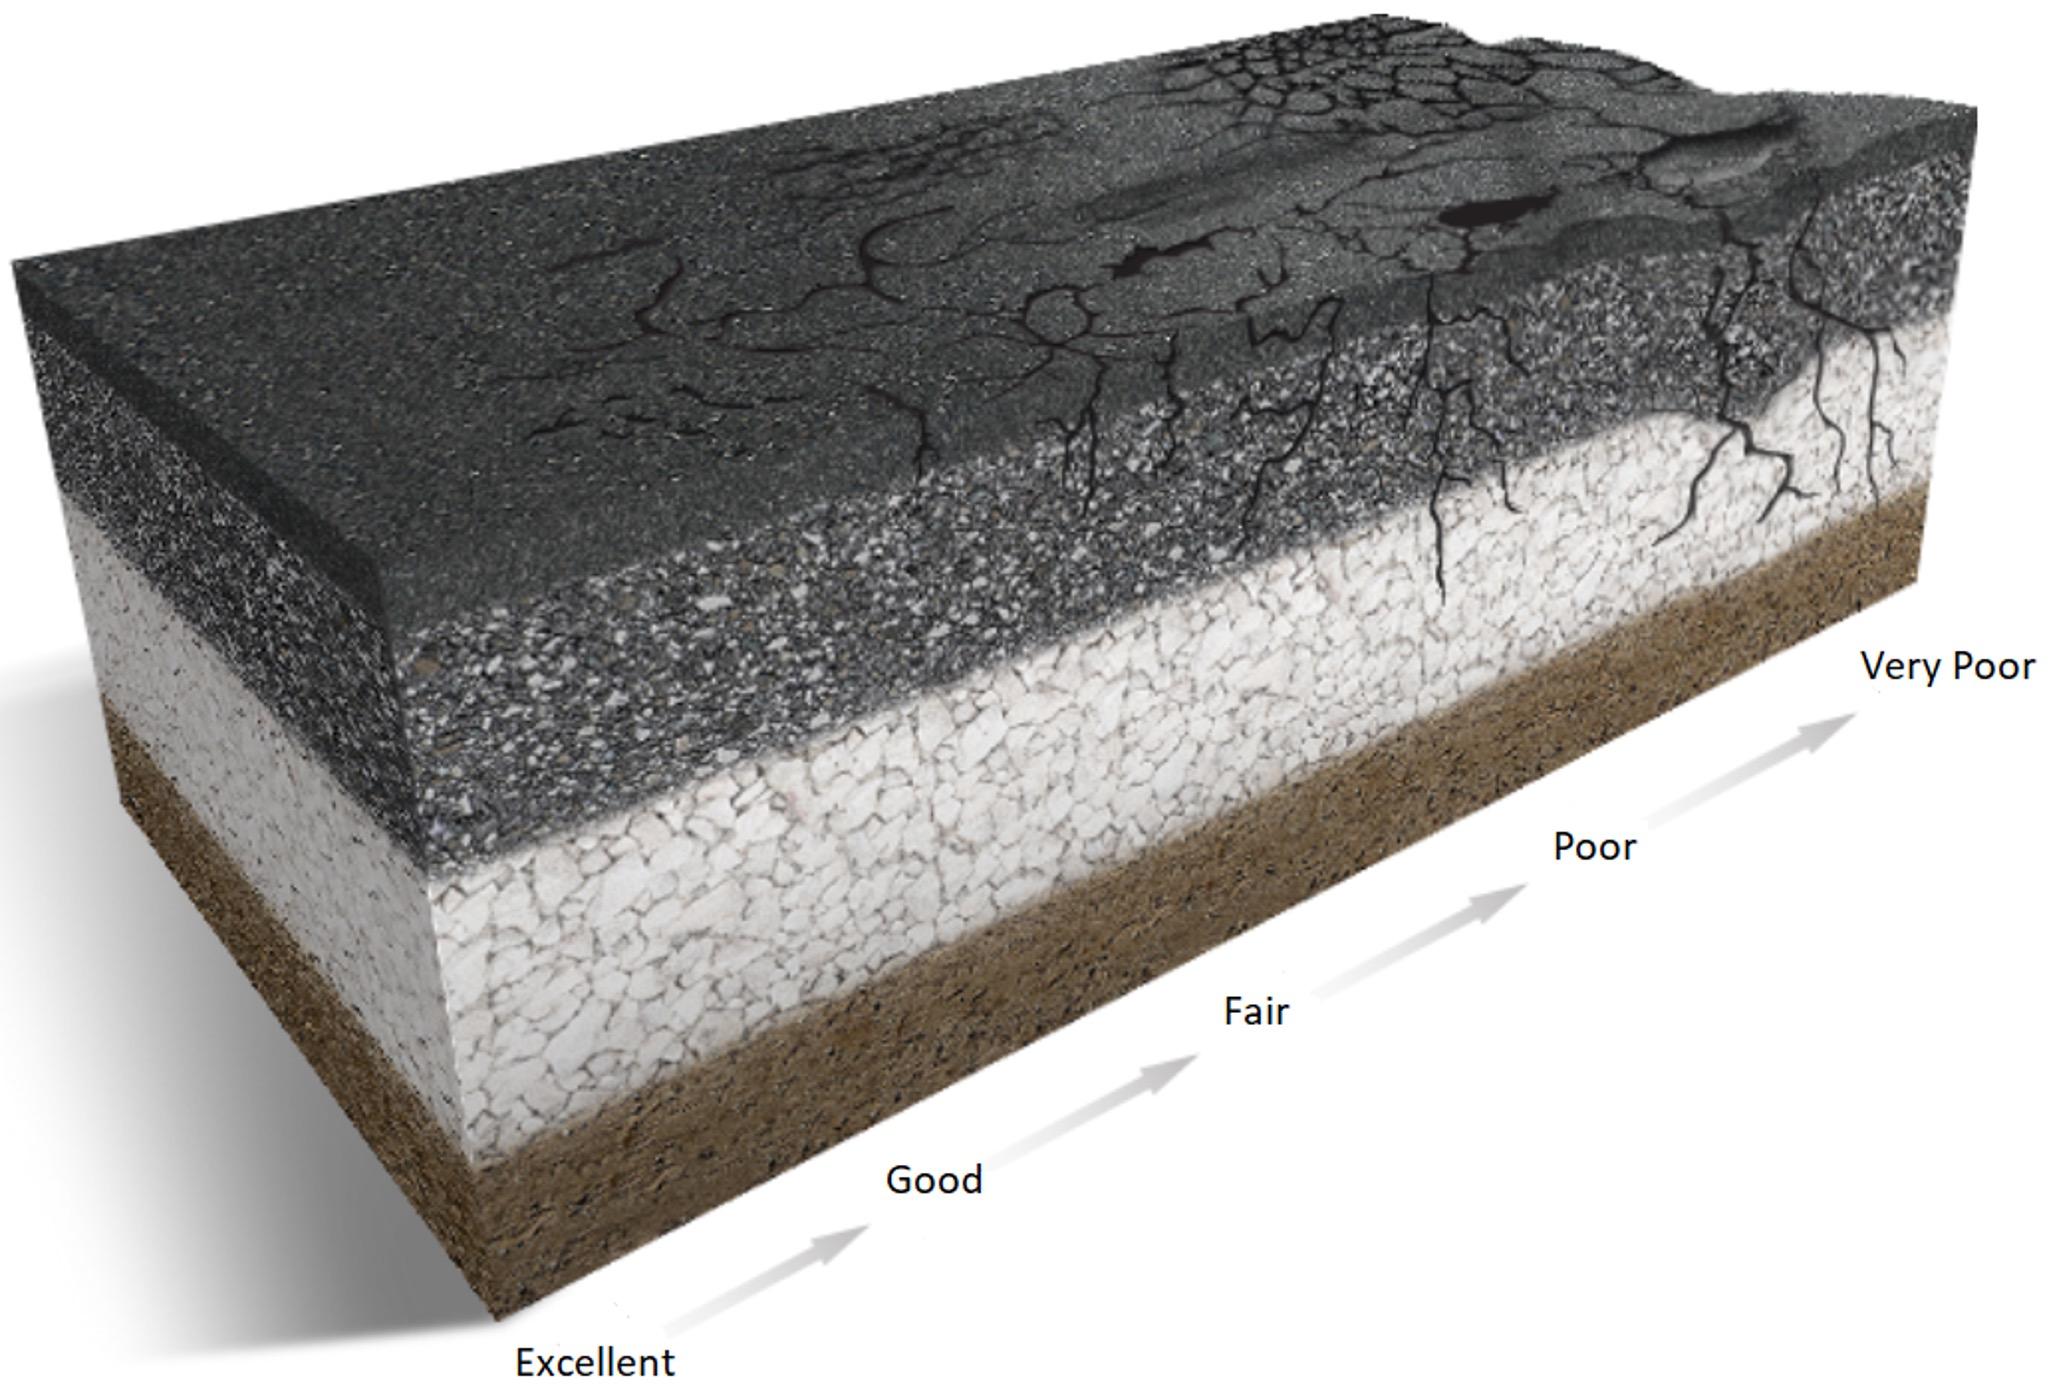
Objective: Maintain Network in Good Condition for as Long as Possible to Minimize Cost


14 100>PCI>=90 90>PCI>=80 80>PCI>=60 60>PCI>=30 PCI<30
to Traveling Public! https://roadresource.org/
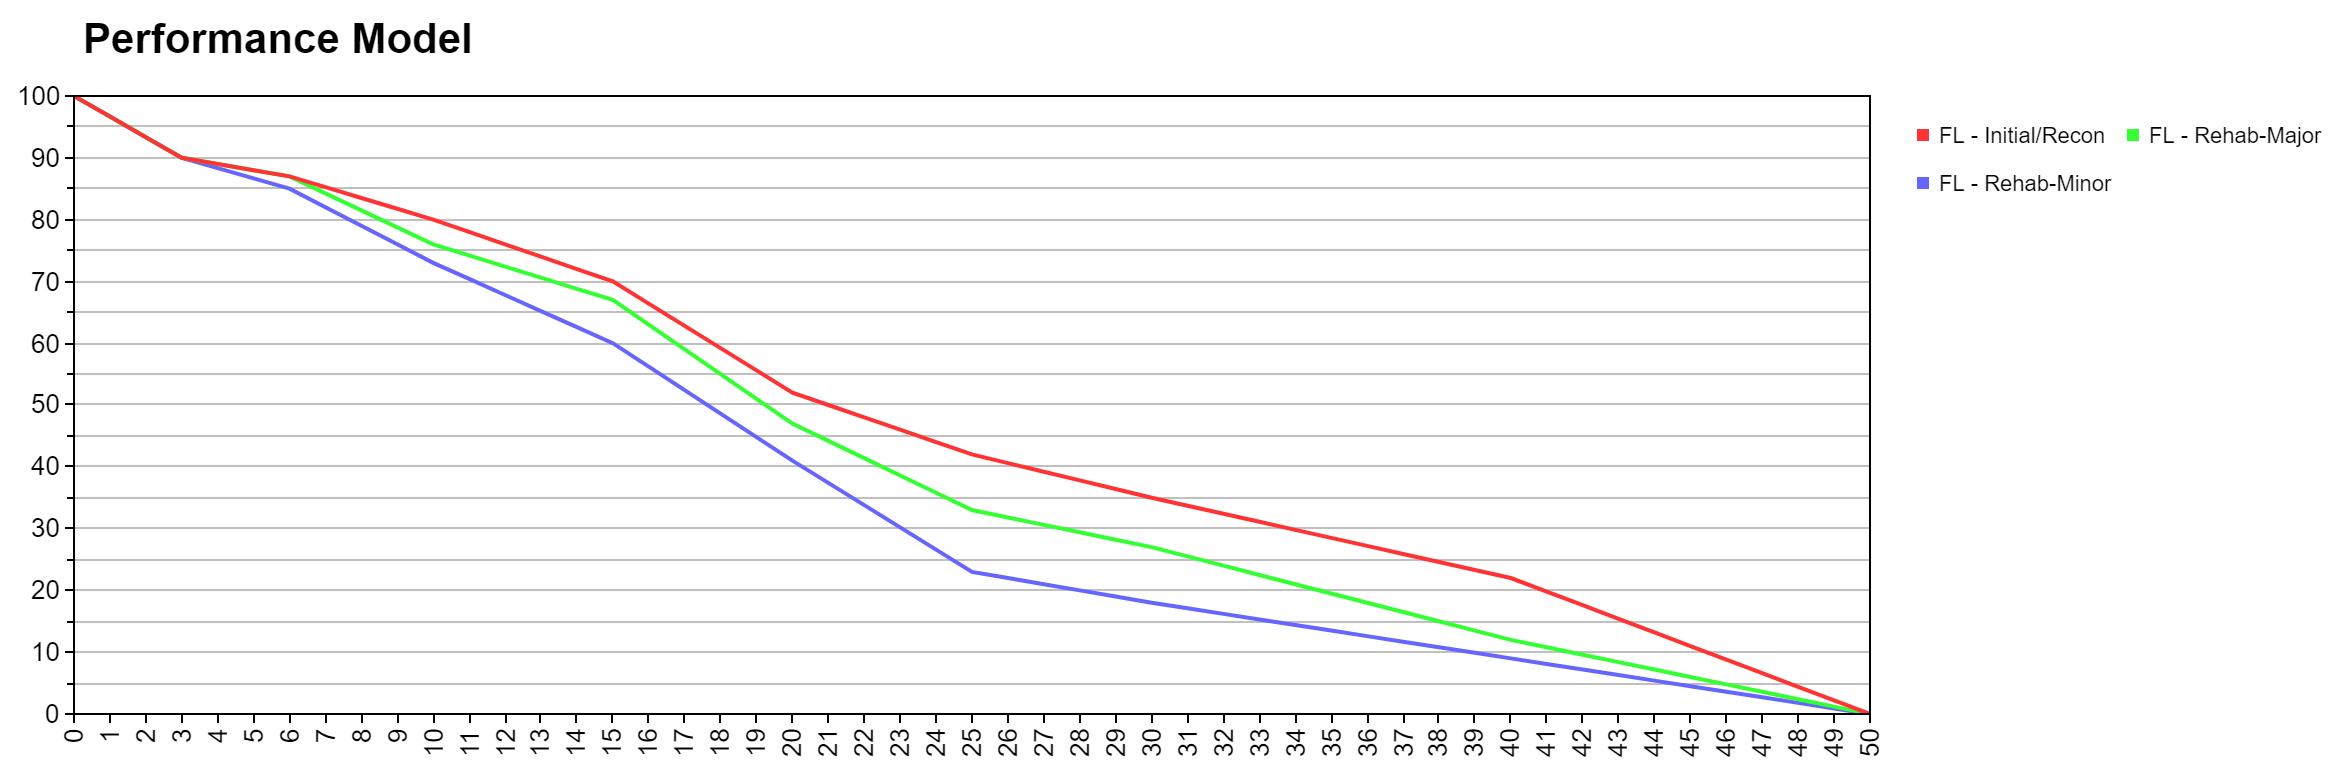
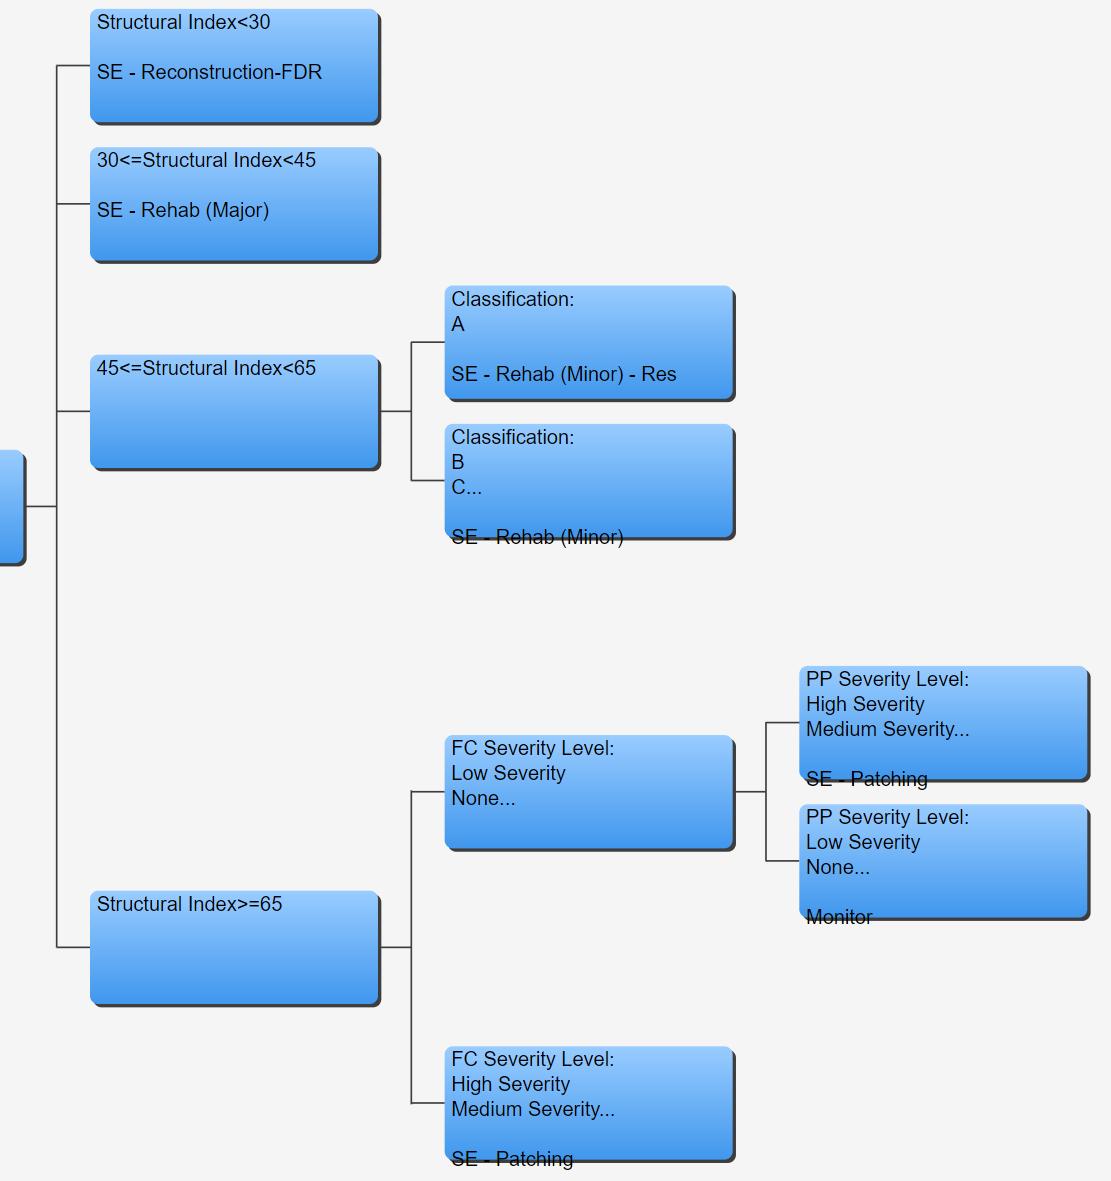
Pavement Management System Settings


INVENTORY/GIS


CONDITION DATA
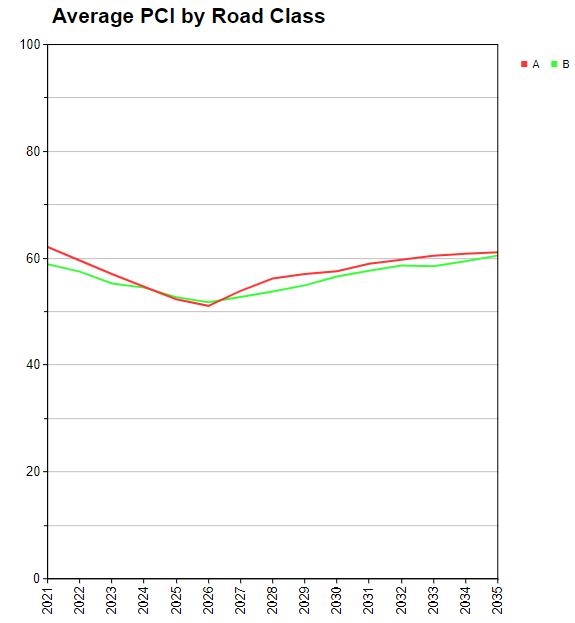
WORK PLAN/HISTORY
Data Management


TREATMENTS
DECISION TREES

PERFORMANCE MODELS
Policy Management
ANALYSIS & REPORTING

15
Benefit/Cost Optimization
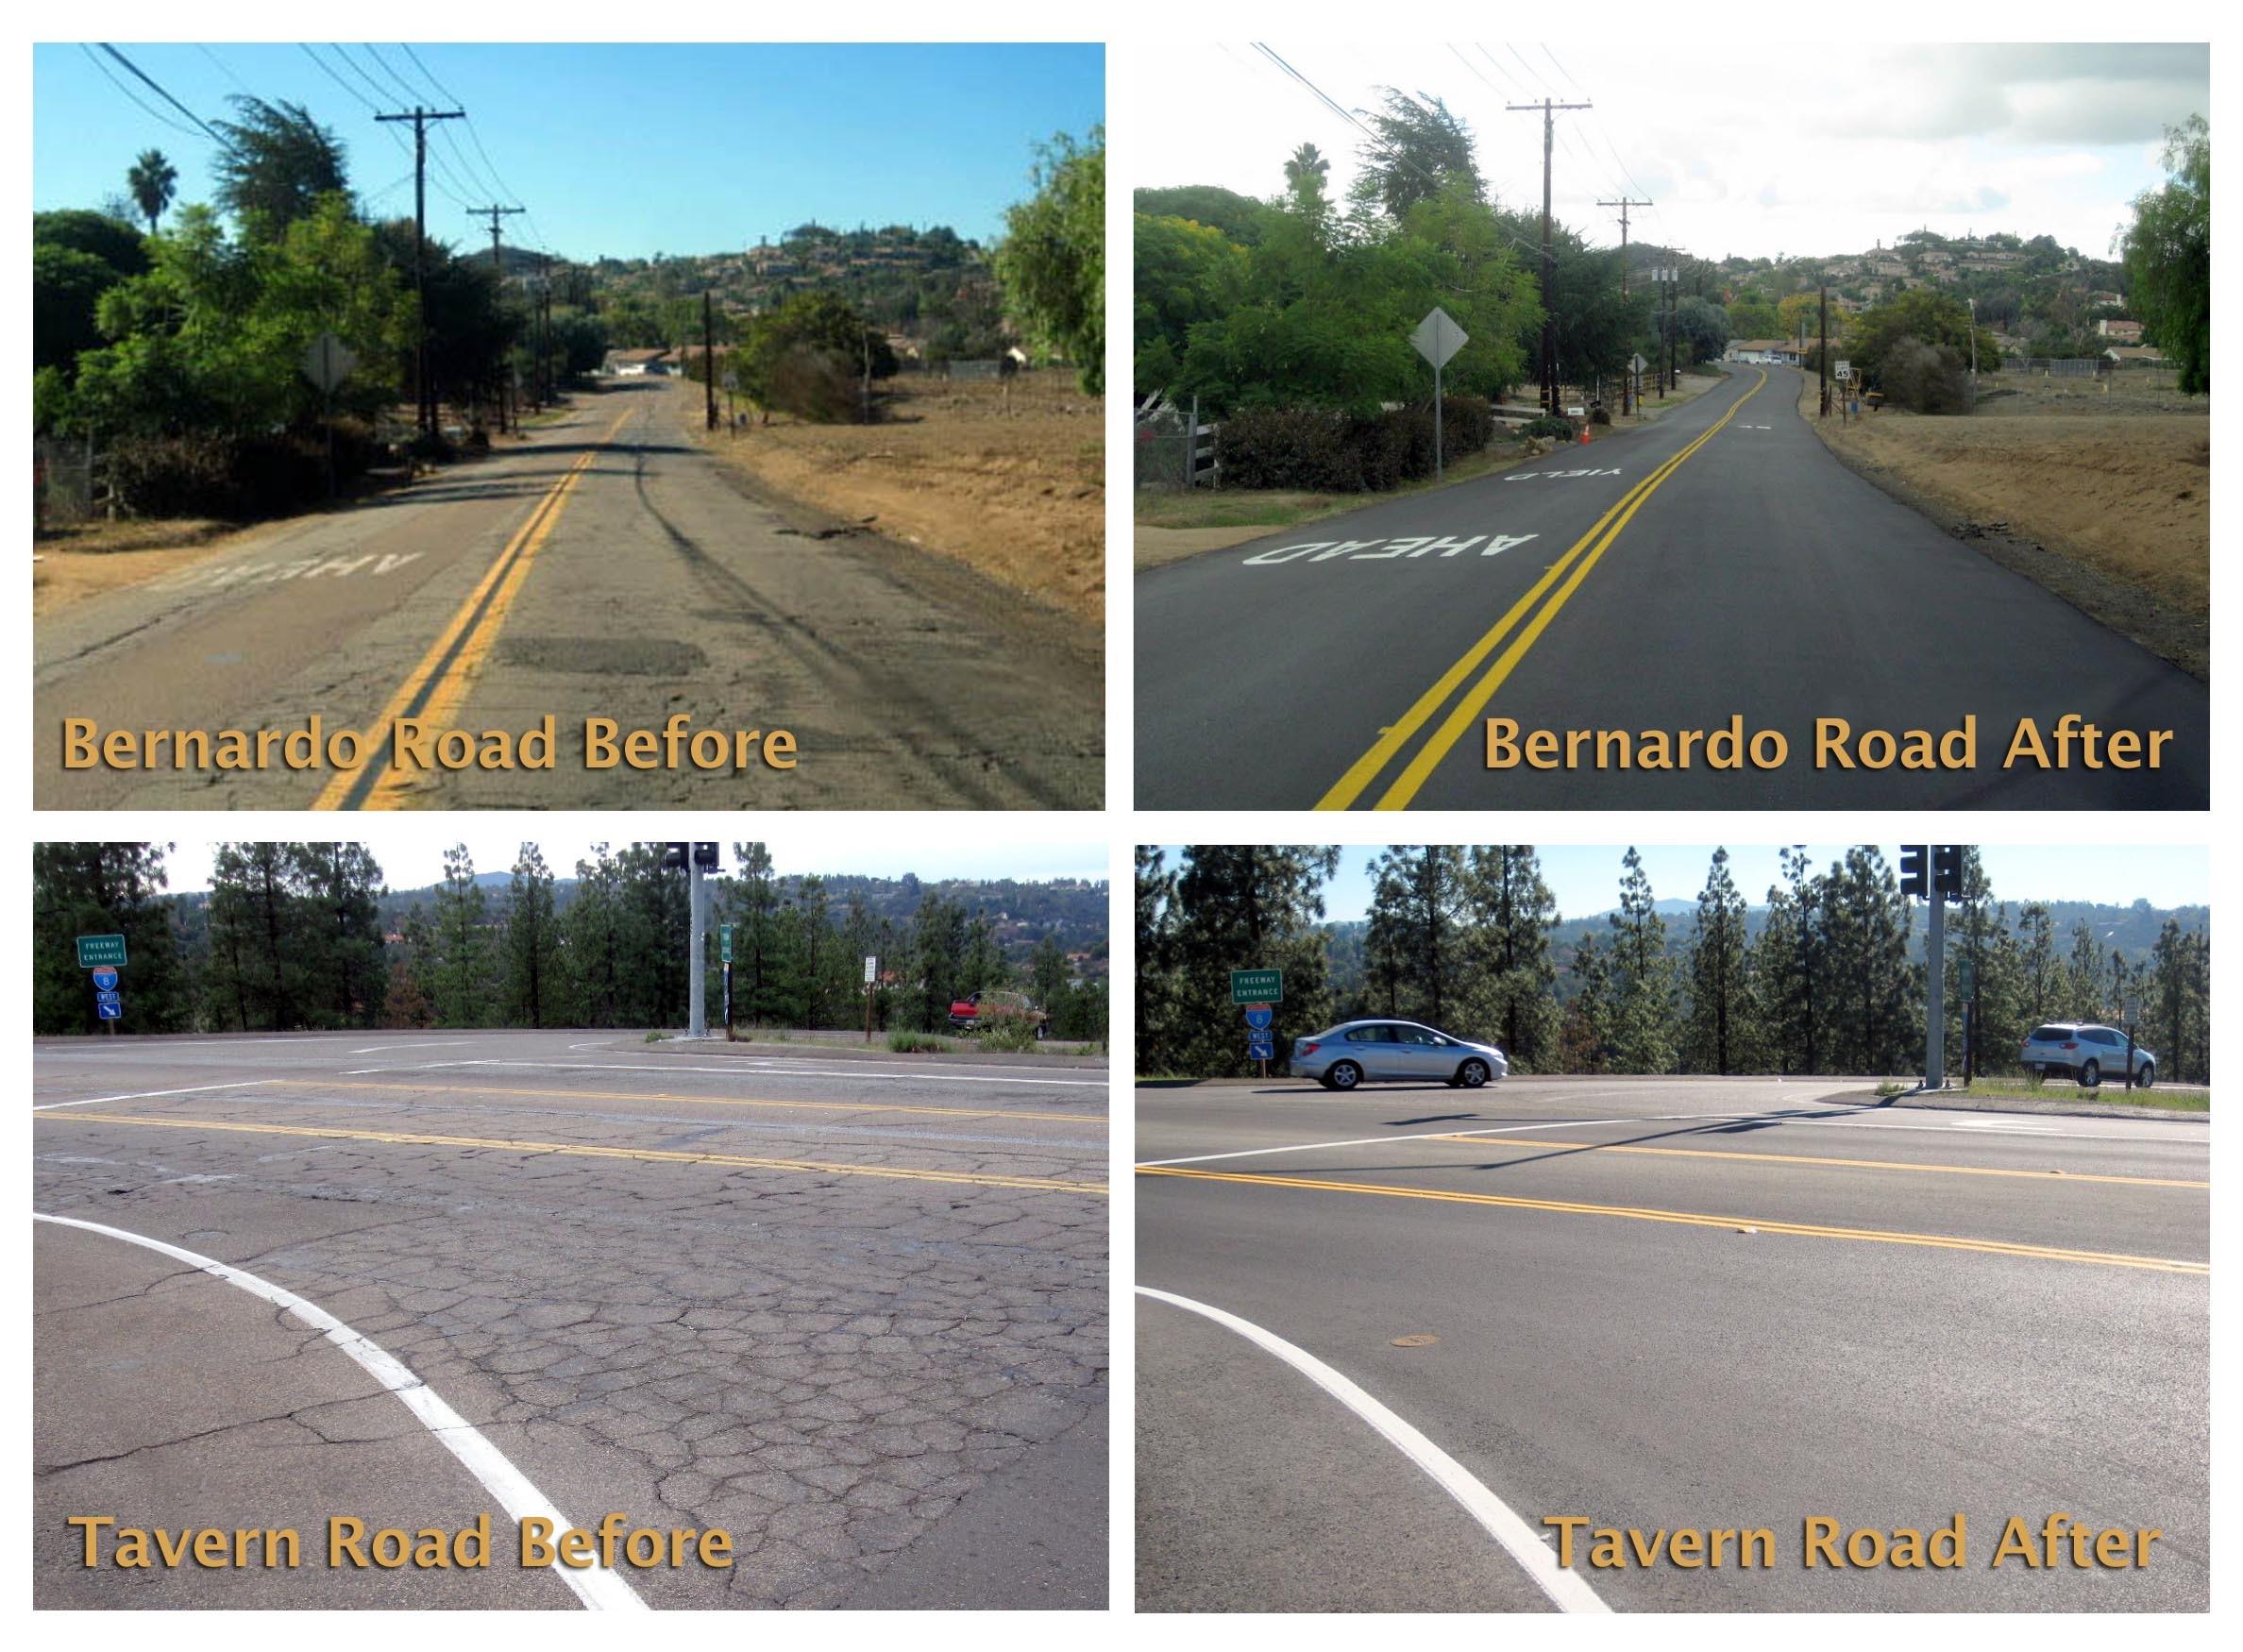

Before: Poor Condition (PCI=30)
After: Good Condition (PCI=100)
Condition Improvement = 70 PCI Points (100-30)
Life Extension = 20 Years
Benefit = Condition Improvement * Life Extension

16
A Change in Thinking…
• Pavement management traditional approach
– Condition based – Budget and funding constrained – Predict future funding needs and projects
• New industry focus – the program needs to consider when picking projects: – Equity* – Sustainability

– Resiliency
• This analysis is a game changer for asset management, supported by IIJA
• Alachua County is a leading agency with this type of analysis

17


100 0 Pavement Condition Pavement Age Optimization Approach Incorporating Equity 30 +70 100 20 Years Life Extension Benefit Benefit = Condition Improvement * Life Extension * Equity Factor
Incorporating Equity to Transportation Planning

Chris Dawson, AICP, Alachua County Transportation Planning Manager
Diedre Houchen, Ph.D., Equity & Community Outreach Manager

Incorporating Equity


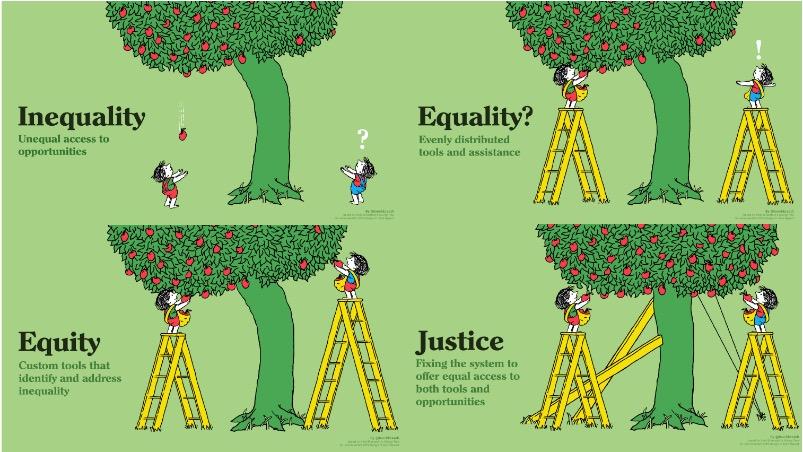
What is Equity?
20
Inequity Area Development
• Board Direction to develop a metric to evaluate equity in the pavement management program
• Staff utilized three metrics to identify Inequity Areas:
o U.S. Housing and Urban Development Qualified Census Tracts
§ 50 percent of households with incomes below 60 percent of the Area Median Gross Income (AMGI) OR,
§ have a poverty rate of 25 percent or more
o Census Tracts with Median Income <185% of Federal Poverty Guideline
o Properties with residential improvement values in the bottom 20% of all values
§ Added a buffer of 1,320 ft.

• Population in Inequity Area:
o 2020 Population is just less than 90,000, or about 1/3 of County Population
o Includes both incorporated and unincorporated residents

21
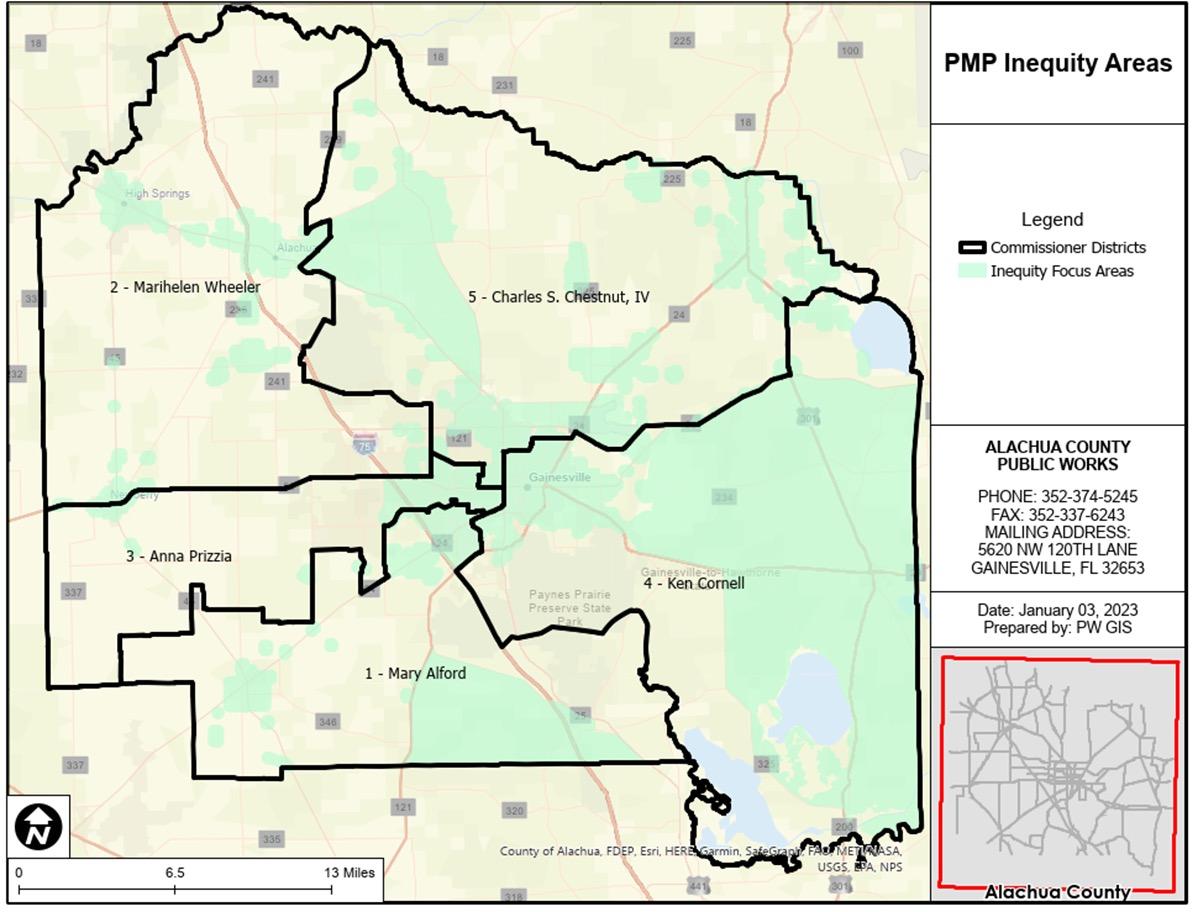
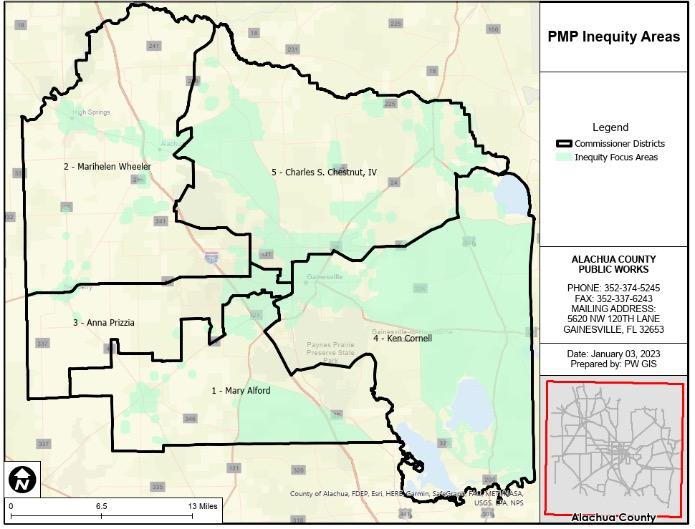
Inequity Focus Area Maps


22
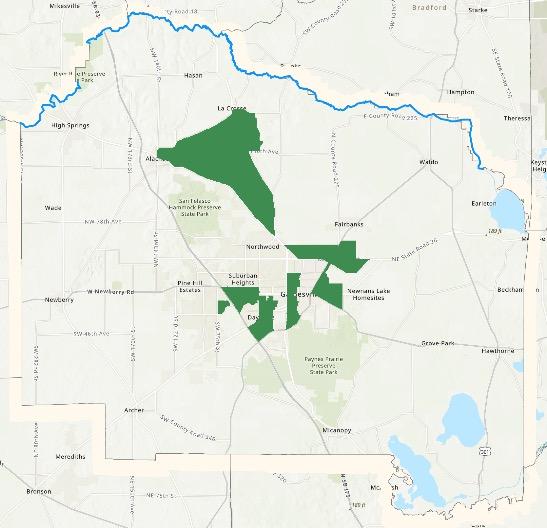
Mapping Inequity
HUD Qualified Census
Tracts
• 50 percent of households with incomes below 60 percent of the Area Median Gross Income (AMGI)

• poverty rate of 25 percent or more

23
Mapping Inequity
Census Tracts


• Median Income < 185% Federal Poverty Guidelines

24
Mapping Inequity
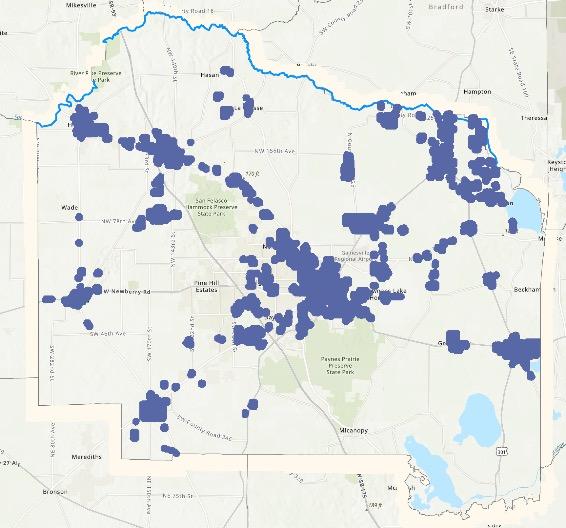

Growth Management

• Bottom 20% Residential
Improvement Values
• With a 1,320 Foot Buffer
25
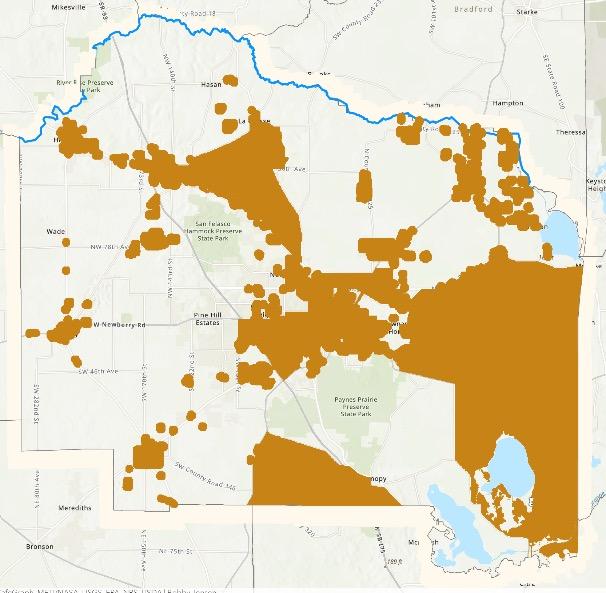
Mapping Inequity
Final Inequity Areas
• Combination of All 3 Maps
• Incorporated & Unincorporated
• 1/3 of County Population (90,000)


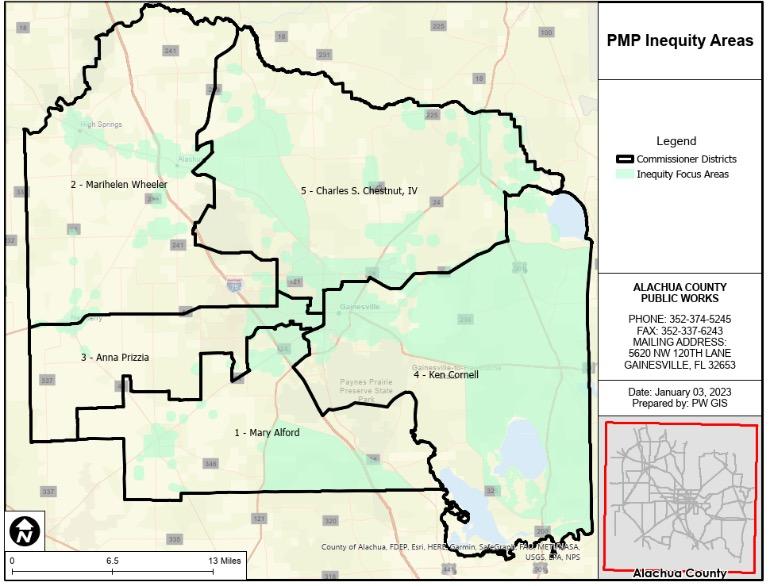
Mapping Inequity
Inequity Areas


• By Commission Districts

Final Parameters

 Ramon D. Gavarrete, P.E., Alachua County Public Works Director
Parameters: Board Direction

• For revenue projections:
§ The above revenue projection assume a $30,000,000 bond in 2028 from the “ELMS” Nickle with the revenues being spent over 5-years.
§ Bond is paid over 30-years
§ Infrastructure SurTax is not being bonded.

§ 3% Cost Inflation each year of the analysis
§ Pavement Preservation budgets capped to 3% of revenue, capped at $500,000 per year
29
Parameters: Board Direction

• Based on the discussion held on March 7 & April 4, 2023, the following criteria has been used:
• Use 40% benefit weighting to Inequity Areas.
• Allocate $750k / year to Residential Roads within Ares of Inequity Area.
• 3% Cost Inflation each year of the analysis.
• Pavement Preservation budgets capped to the lesser of 3% of revenue, or $500,000 per year.
• Include Road Segments with 15 or more work orders for Surface issues as recorded in Alachua County’s CityWorks database (One work order may contain multiple potholes along the road segment).
• Staff to analyze and smartly include roadways within one neighborhood and continuous road segments.

30
Using Cityworks
City Works Database
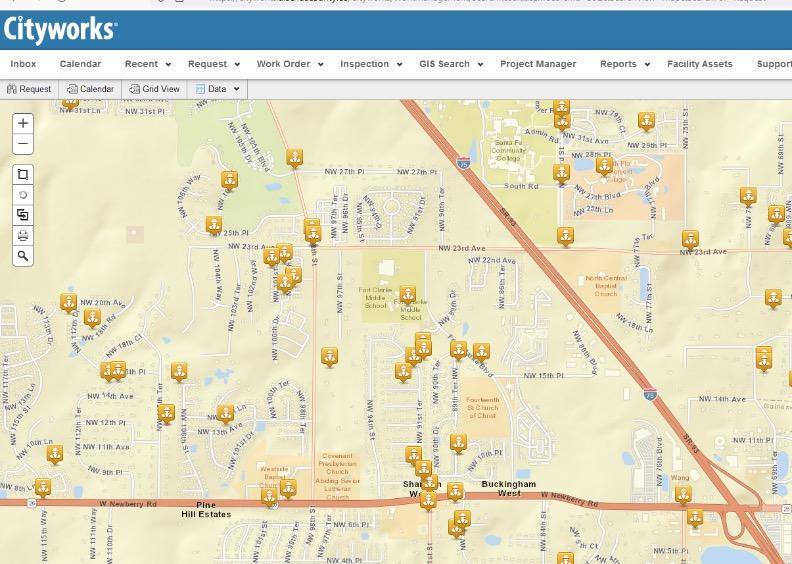

Include road segments with >15 work orders for pothole repair.

31 •
Using Cityworks

• City Works Database

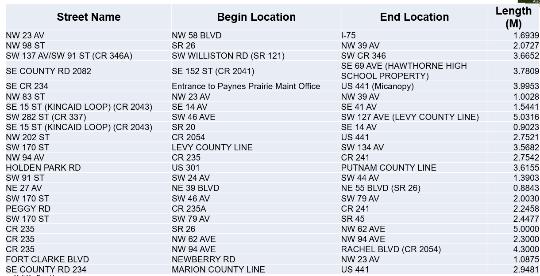

Include road segments with >15

32
Incorporating Equity

How Should We Incorporate Inequity Areas Into the PMP
This is a leading-edge analysis considering Inequity – very important topic in Asset Management, but few examples available from around the US
How much should we allocate to residential roads $750,000

Iterative Process with the Board
• Weighting factor 20%, 30%, and 40%


33 •
•
•
48.2 49.3 49.7 49.5 47 47.5 48 48.5 49 49.5 50 $- $500,000.00 $750,000.00 $1,000,000.00 PAVEMENT CONDTIION INDEX
ALLOCATED ANNUALY TO RESIDENTIAL
FUNDS
ROADS Total County PCI in 2032
Incorporating Equity


Dedicating $750K/year to Residential Roads within the Areas of Inequity Yielded the Best (highest PCI) for both Collector/Arterial and Residential Roads
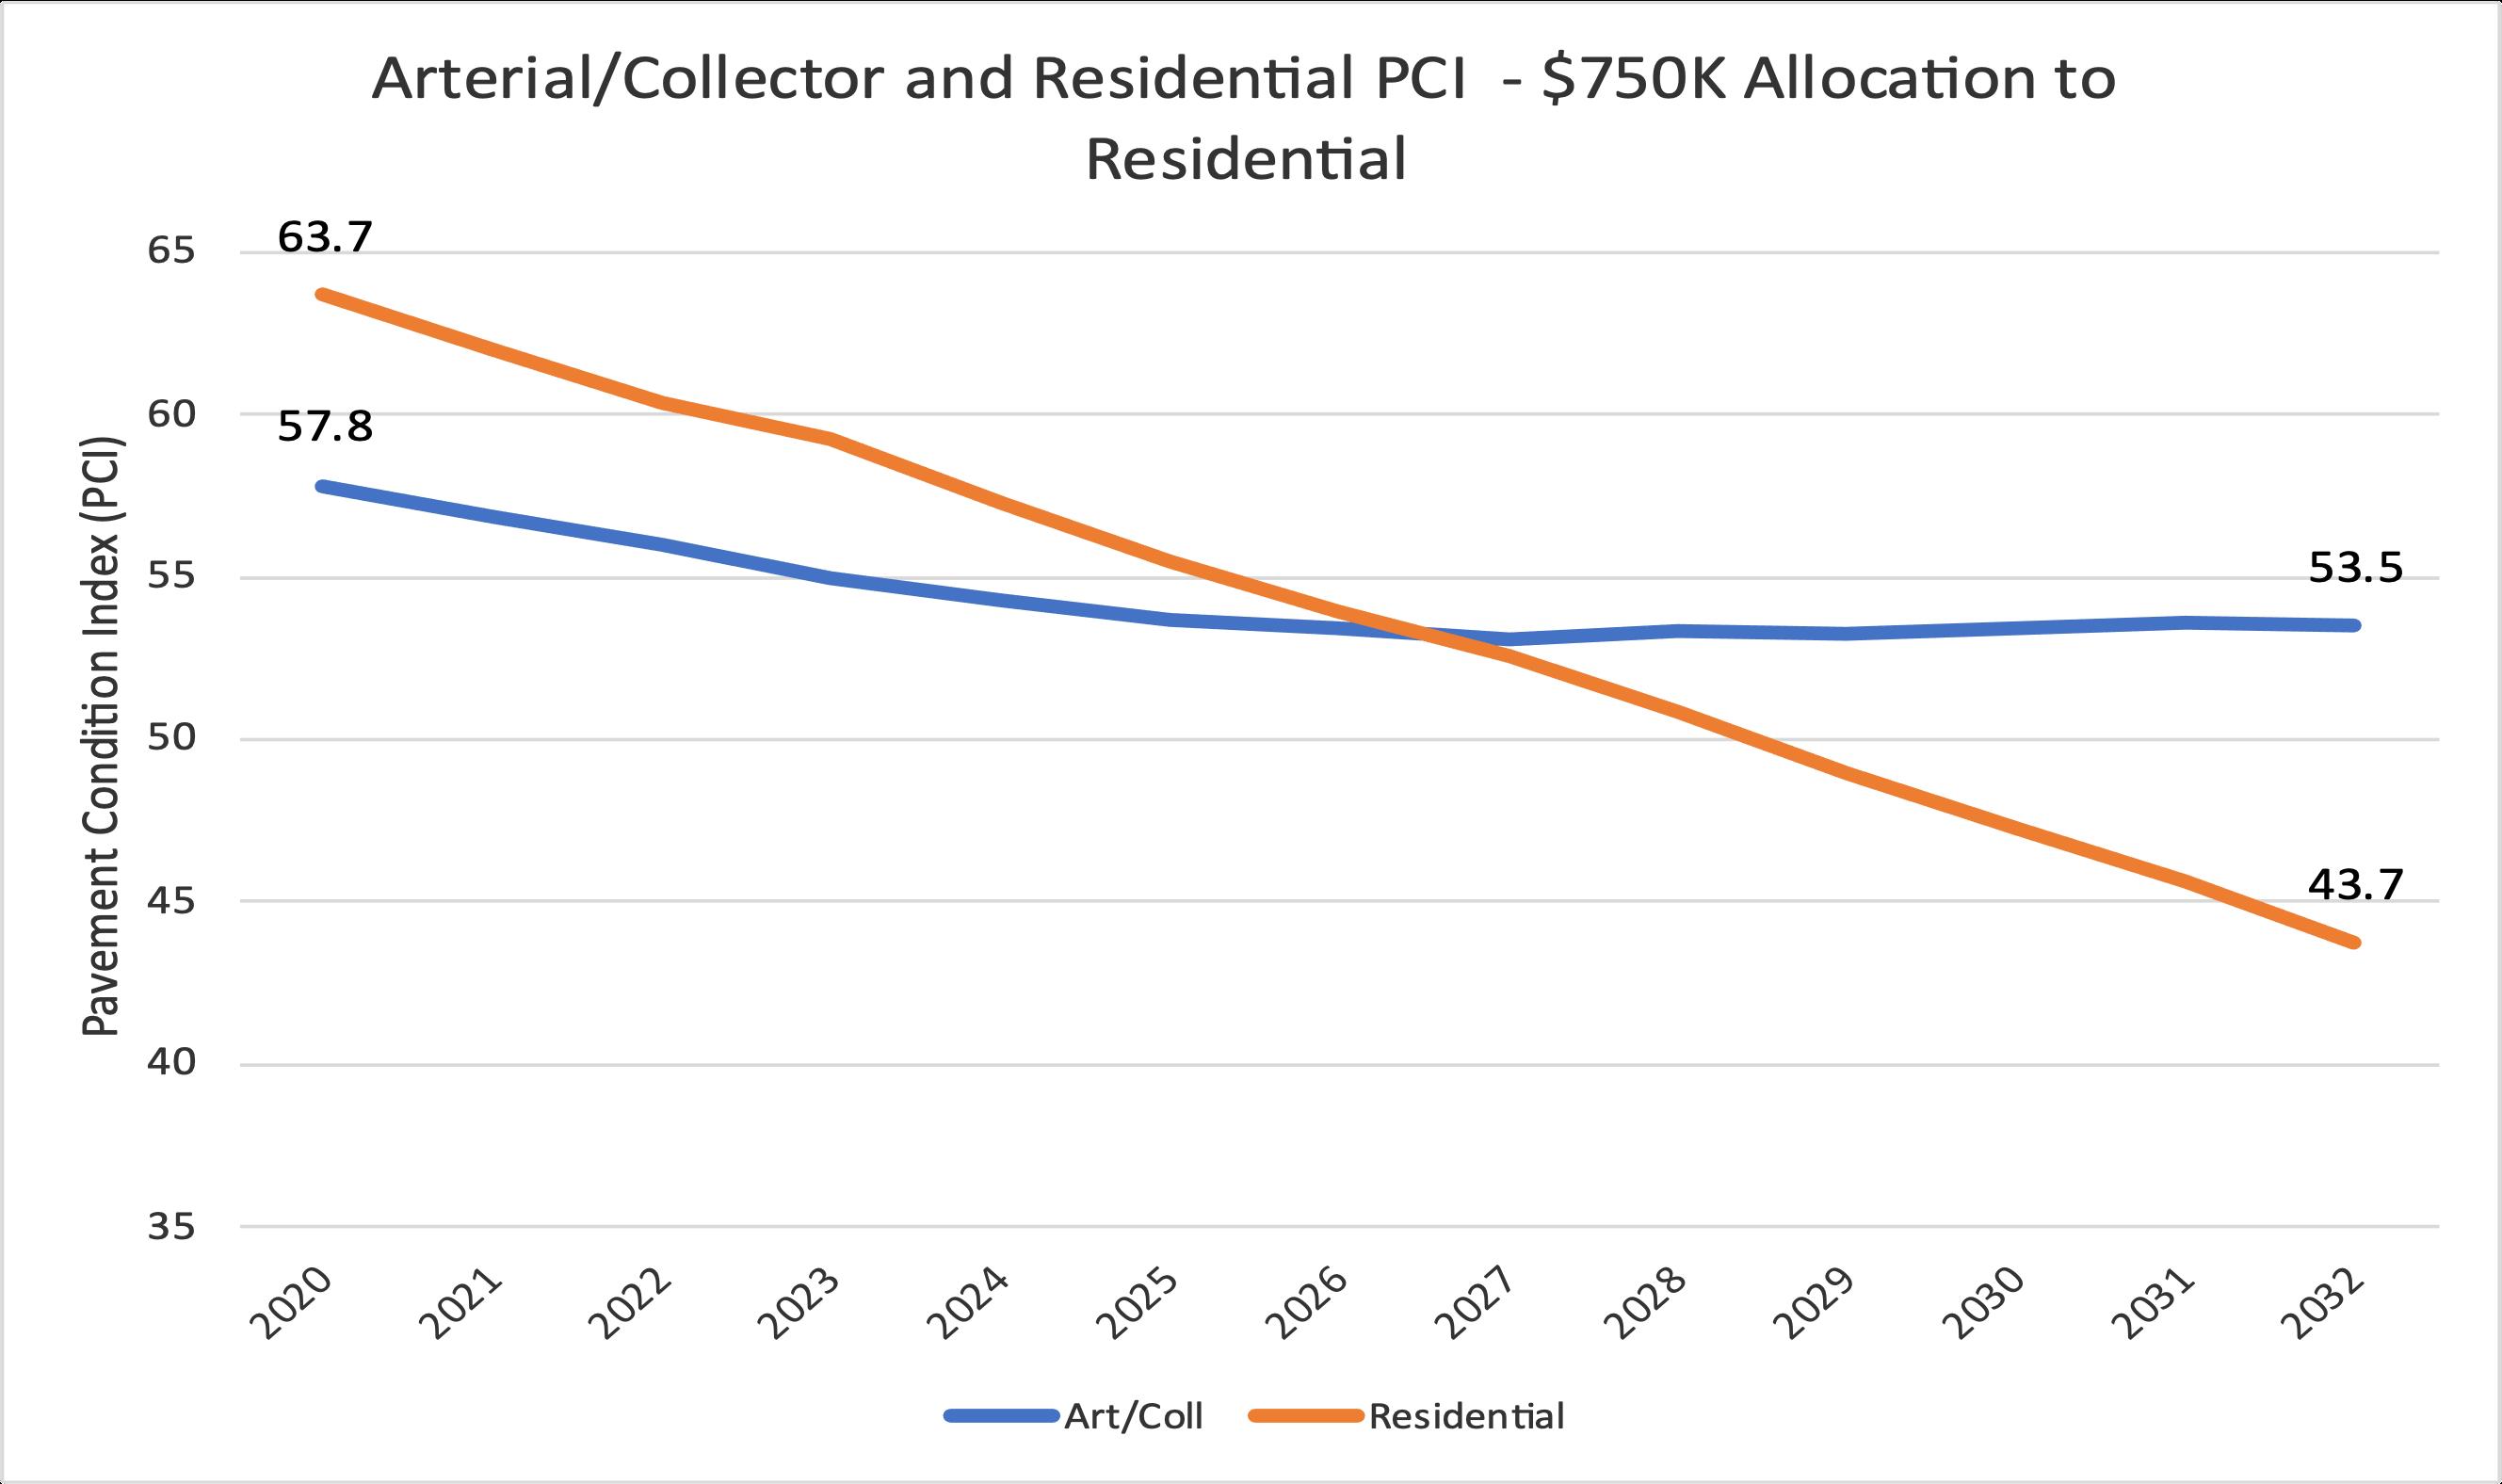

Incorporating Equity


35 60.1 49.7 35 40 45 50 55 60 65 2020 2021 2022 2023 2024 2025 2026 2027 2028 2029 2030 2031 2032 Pavement Condition Index (PCI) Total County Network PCI Total Network • Originally Projected 41.2
Summary


Transportation Capital Improvement Program


Summary 37
2023 - 2032 Totals (10-Year) Project Totals (Thru 2032) 1. Roadways - Widening & Other Major Improvements $ 8,010,276 $ 16,658,951 2. Roadways - Pavement Management Program with Minor Improvements $ 219,552,620 $ 219,552,620 3. Program - Signals $ 6,007,411 $ 6,007,411 4. Program - Bridge Rehabilitation / Construction $ 3,287,517 $ 3,942,517 5. Program - Bike/Ped Program $ 5,034,413 $ 5,034,413 Transportation Capital Improvement Program (2023 - 2032): $ 241,892,238 $ 251,195,912


Transportation Capital Improvement Program 2023 - 2032 38 60.1 49.7 35 40 45 50 55 60 65 2020 2021 2022 2023 2024 2025 2026 2027 2028 2029 2030 2031 2032 Pavement Condition Index (PCI) Total County Network PCI Total Network • Originally Projected 41.2
Need More Funding
• November 2022, Voters approved 1 Cent Sales Tax –

½ Cent for Wild Spaces and Public Places –

½ Cent for Infrastructure (70% roads) $11.7 million
• BOCC allocates another $4 Million General Fund for a total of $8 Million
• BOCC agrees to budget ELMS nickel in 2028 for planning purposes
Summary
39
•
Consultants and software are very useful in demonstrating the need for funding
–
Consultants are “experts”
• Sales tax for road funding is more likely to pass with conservation land funding

• Road Segments should be the same in each software
• Inequity will look different for every community

–
Demographics are different
– Key indicators or metrics may be different
– It is an iterative process with the Board, Public and Staff. • There is always a limited budget • Not all roads will be fixed in the first 10 years
Summary
40
Good News • Incorporating Inequity Areas raised the overall County PCI


• Most of the highly travelled collector roads, which yielded most of the work orders, will be repaired • County Roads will Improve
NE 27th Avenue Paving started the 2nd Week of June 2023
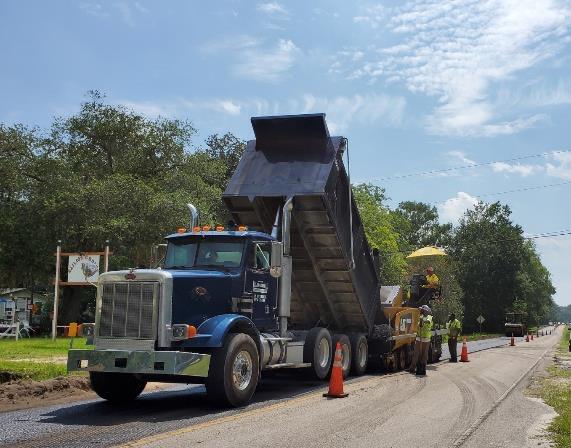
($1.56 Million)
• Eight Additional Projects to start construction in 2023
($25.5 Million)
Summary •
•
Questions


42


