
Purpose

Multi-County coastal MPO


High population density in Flood Zones
Tourism and Service Industries dominate
Continued widespread growth
Many critical facilities in high impact areas


Multi-County coastal MPO


High population density in Flood Zones
Tourism and Service Industries dominate
Continued widespread growth
Many critical facilities in high impact areas

Promoting Resilient Operations for Transformative, Efficient, and Cost-Saving Transportation (PROTECT)
• Building Resilient Infrastructure and Communities (BRIC)
• Florida Resilient Coastlines Program (FRCP)

• Rebuilding American Infrastructure with Sustainability and Equity (RAISE) Grant Program


Miles Exposed to Combined Flood Hazards: 145



• Causeways

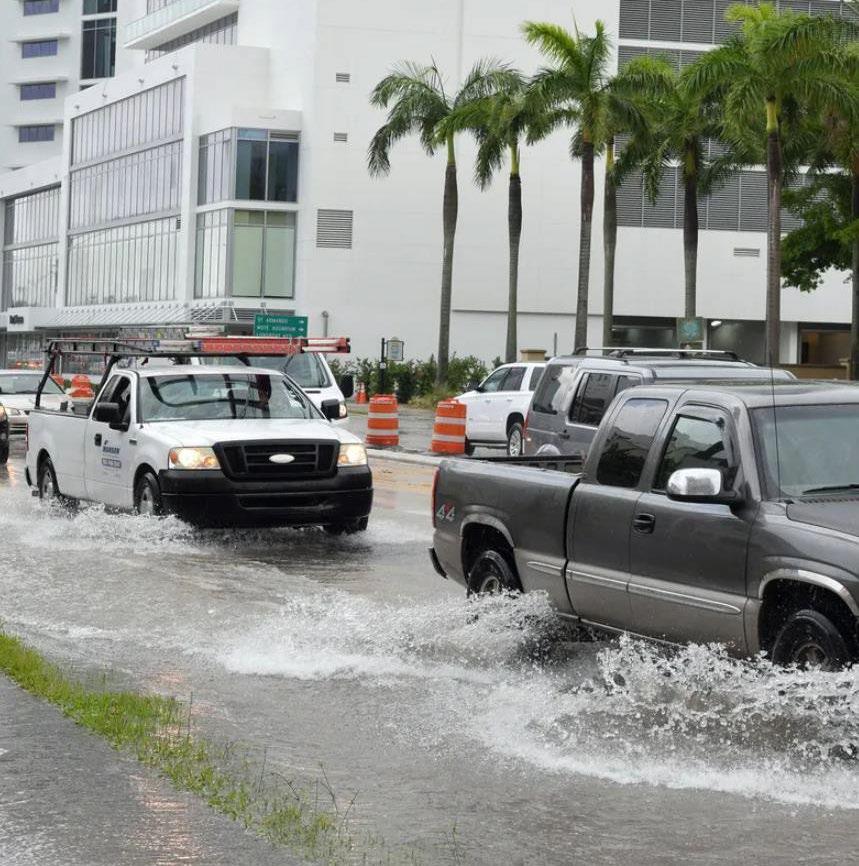
• Inland flooding
• Detour routes
• Newer structures and housing survived
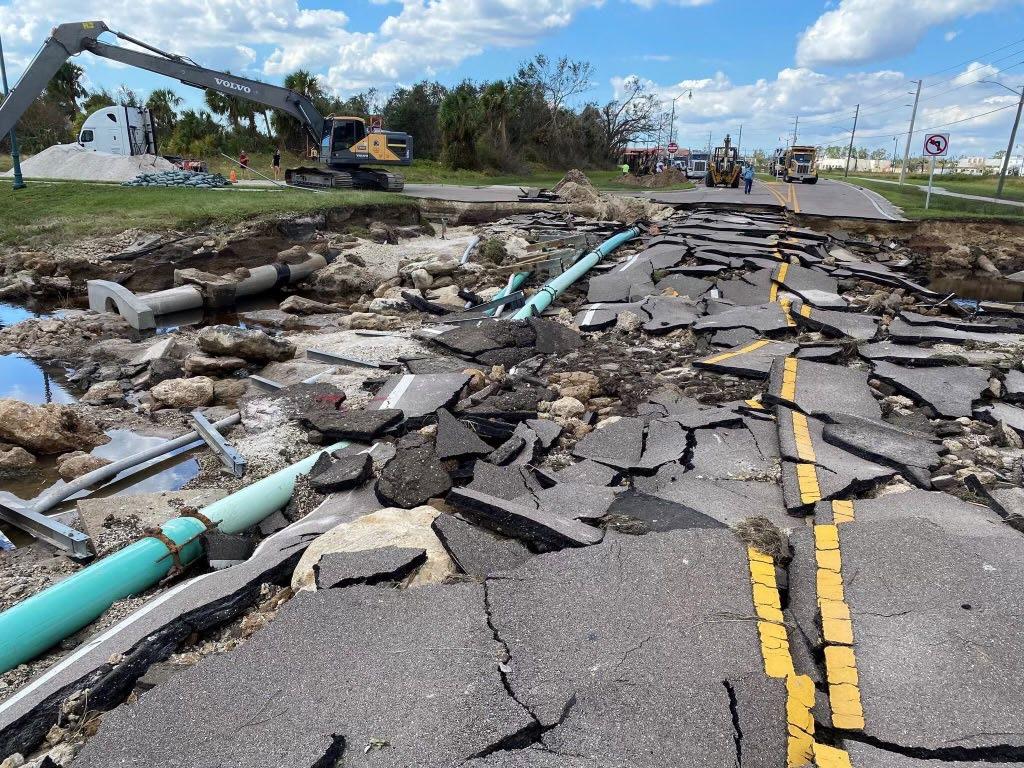
 Roadway Damage in North Port from Hurricane Ian. Photo Credit: City of North Port Facebook
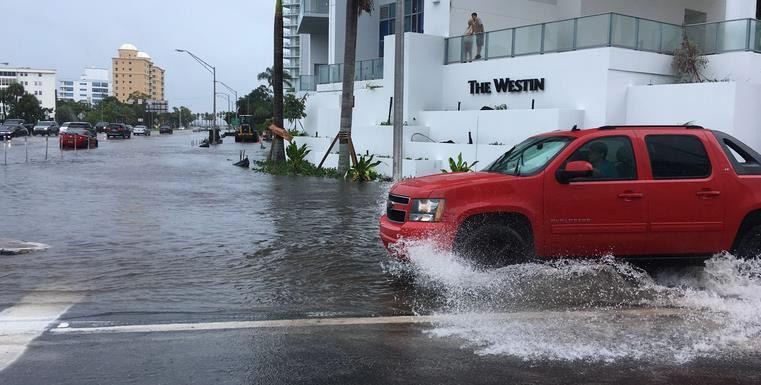
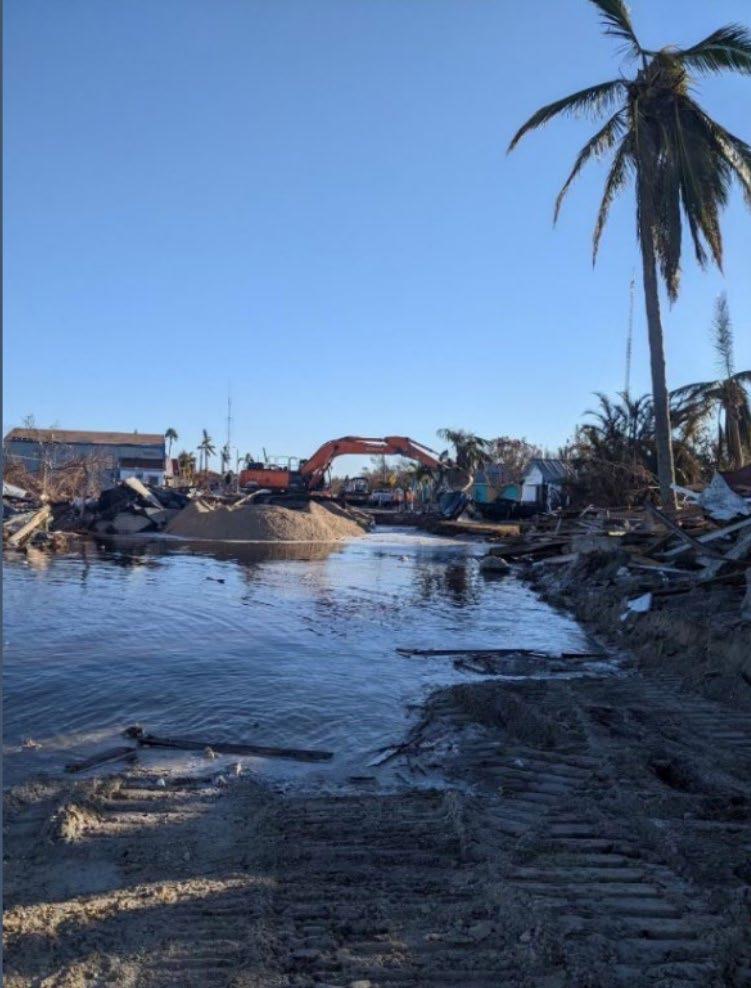
Flooding, debris, and roadway washout due to Hurricane Ian.
Shocks
(e.g., unexpected disruptions - pandemic, hurricane)
Probability
(e.g., storm surge, nuisance flooding, wildfires)
Resilience
Vulnerability
Risk
Stresses
(e.g., sustained trendsseal level rise, changing climate patterns)
Criticality
(e.g., evacuation route, SIS Facilities)
Exposure
(e.g., storm surge, nuisance flooding, wildfires)
AdaptiveCapacity
(e.g., asset’s age)

Consequences
(e.g., storm surge, nuisance flooding, wildfires)


Review Plans

Local Mitigation Strategy
Comprehensive Emergency Management Plan
Post Disaster Redevelopment Plan
Municipal Plans
MPO Plans

Hazards Identified:
Storm Surge Nuisance


Flooding
Wildfires

Review Plans
• Criticalforanalysis
Critical for Analysis
Supporting data
• Roads and bridges, hazard data, and critical facilities
Data Collection
• Supportingdata
• Government facilities, activity and employment centers


• Informational
• Waterbodies, potable water supply
Review Plans
Data Collection
Transportation Assets
Transportation Assets
Regional Assets
Natural Assets
Roadway and Bridge Facilities
Airports, Seaports, rail and Freight facilities
Airports, Seaports, rail and Freight facilities
Public Transportation facilities
Regional Bicycle and Trail Facilities
Regional Assets
Employment and Activity Centers

Storm Surge Zones
Government and Critical Facilities
Evacuation Zones
Water and Energy Facilities
Flood Zones
Topography

Areas at Risk of Wildfires
Natural Assets
• Provide an understanding of the system’s vulnerabilities
• Develop a prioritized list of assets that are at risk to extreme weather


• Make informed decisions about the costs & benefits of potential mitigation options
• Support making decisions on how to best prioritize solutions with limited resources
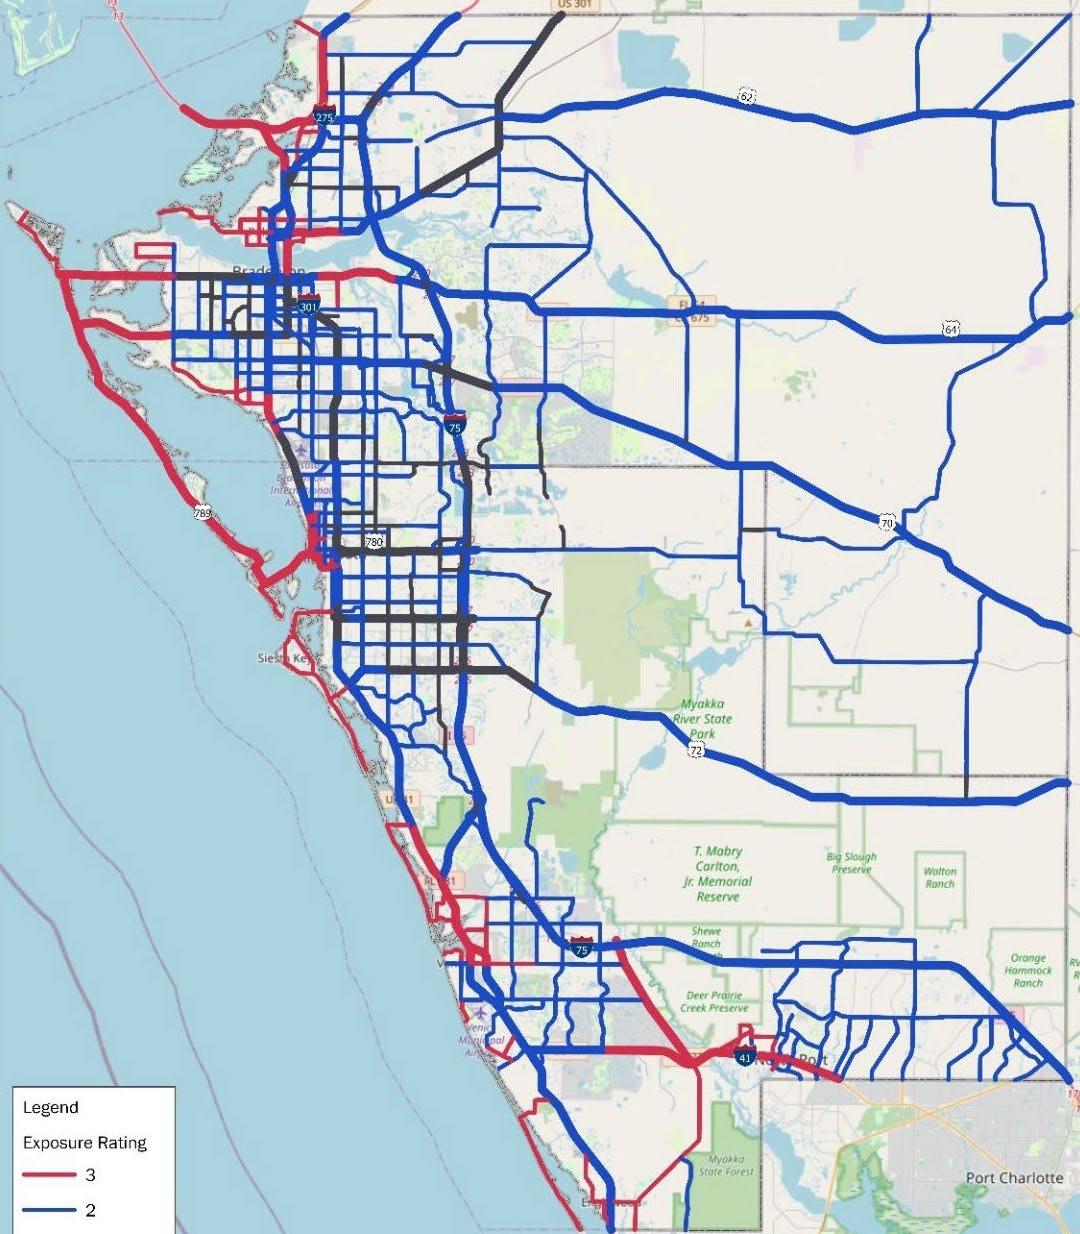
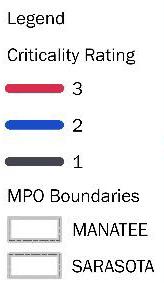
• An overall vulnerability score is developed by weighting the three components

• Vulnerability scores reviewed to ensure scores reflect local conditions
Criticality (e.g., evacuation route)

Exposure (e.g., storm surge depth)
Adaptive Capacity (e.g., asset age)


Asset Type Indicator
Description

Asset Storm Surge
Road Elevation of Asset

Storm Surge
Nuisance Flooding
Wildfires
The higher the asset is, the less likely it would be inundated and damaged from storm surge.
Exposure Score
Bridge Bridge Height Bridges with less clearance above the waterway are more likely to experience storm surge heights that reach their deck.
Scour Rating
Bridges that have already been identified as having problems with scour are more likely to be damaged during storm surge events.
Nuisance Flooding
Elevation of Asset
Road
Proximity to Coast
Bridge Bridge Age
If an asset is located at a relatively low elevation compared to surrounding areas, water may tend to "pond" there, causing flooding during heavy precipitation events.

Areas near the coast, to where water drainage flows, could back up and flood sooner than the inland areas.
Older bridges may have been built to outdated design standards, rendering them more sensitive to precipitation events than bridges designed more recently.
• Annual Average daily traffic
• Functional classification
• Goods movement levels
• Access to employment/educational/medical facilities

Asset Storm Surge Nuisance Flooding Wildfires Exposure Score

• Evacuation route

• Transit route
• SIS facilities
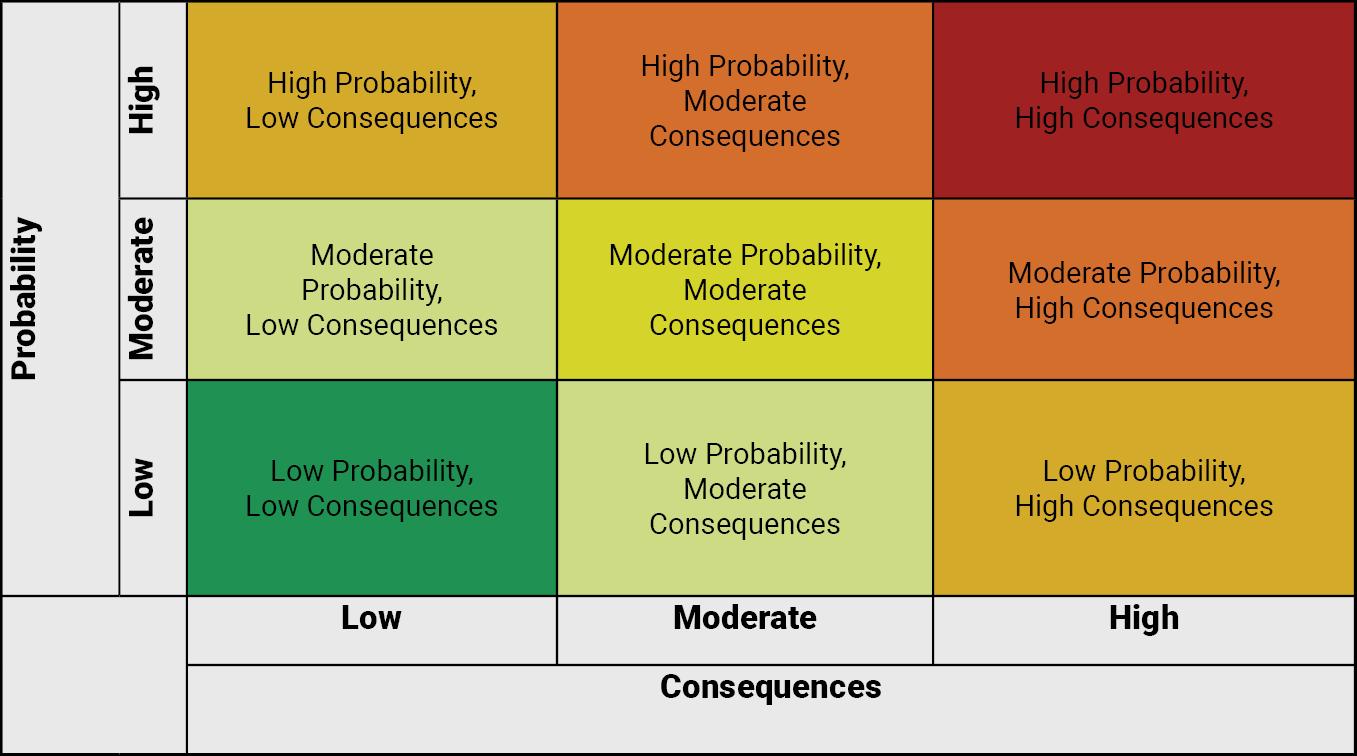
• Risk considers the probability that an asset will experience a particular impact and the severity or consequence of the impact.

• Assessment will be used to develop a prioritized list of assets that are at risk to the hazards


Probability

• Likelihood of occurrence
Consequences
• Replacement costs
• System impacts (Detour length, delays)


Type 1
• InfrastructureHardening:Underground Utilities, Retrofitting, Redundancy, Maintenance and Operations


Type 2
• GreenandSustainable Solutions:Landscaping , Natural Stormwater features, Living Shorelines, Natural Barriers
Type 3
• PlanningandPolicySolutions:Land Use and Zoning Revisions, Asset Management Guidebook, Grants
Type 4
• PublicEducationandPreparedness:Tree Education and maintenance, Shelter and Evacuation Route Education

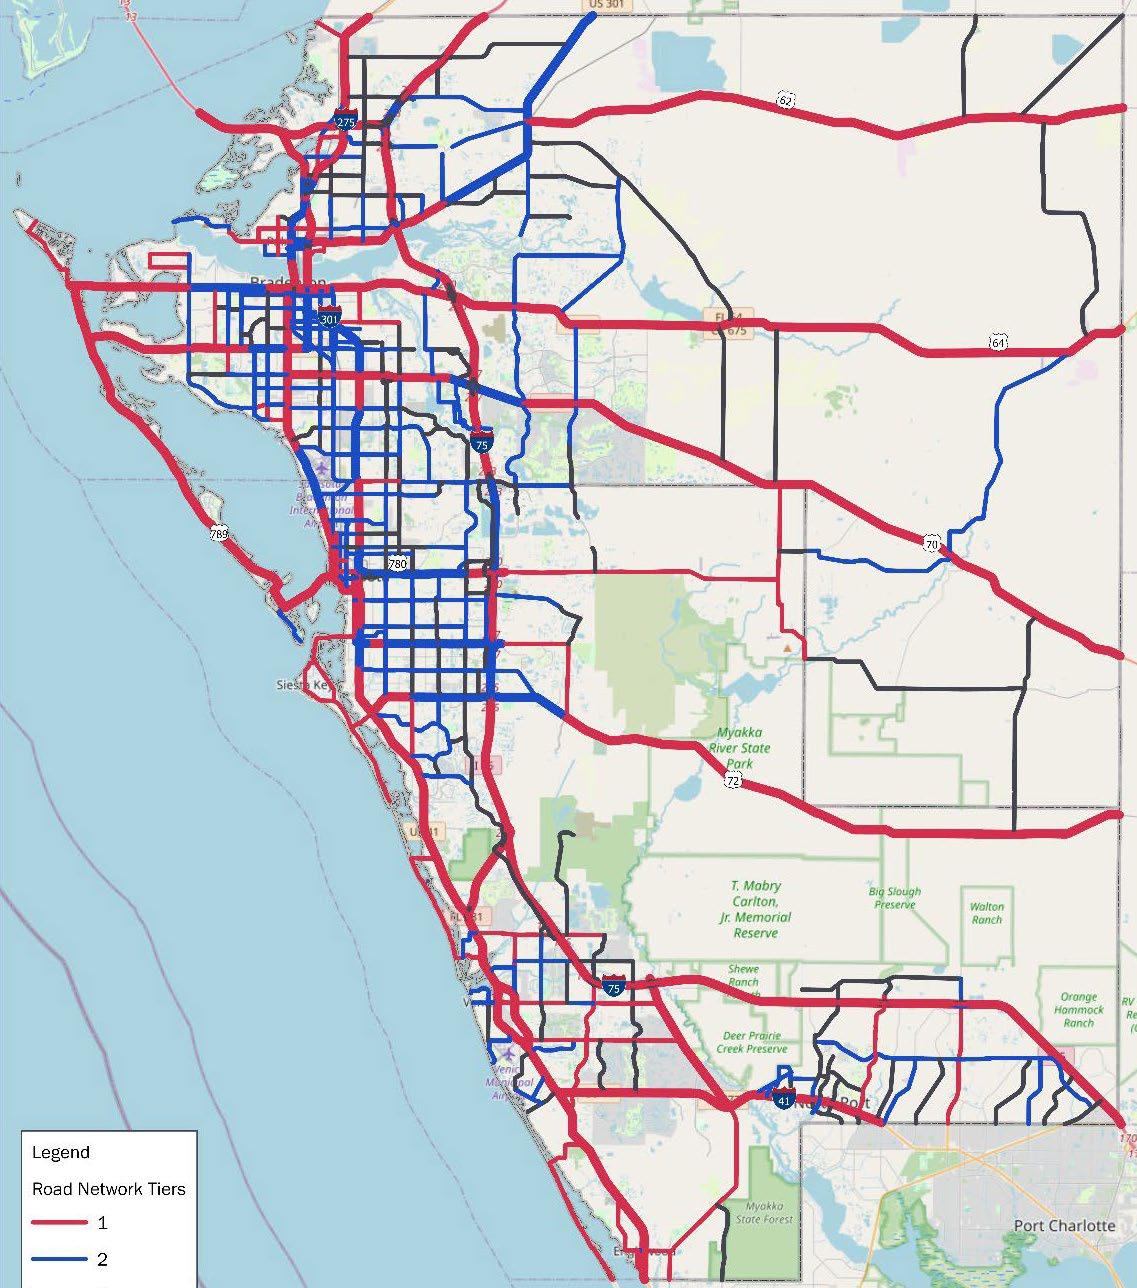
Sarasota/Manatee MPO Resiliency Vulnerability Assessment Study


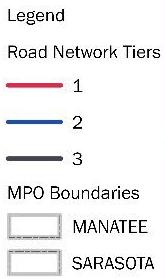
Tier I: Most Vulnerable Facilities


Tier II: Vulnerable Facilities
Tier III: Least Vulnerable Facilities









• Albee Farm Road
• Beneva Road
• Jacaranda Boulevard
• Laurel Road
• Pine Avenue/Gulf Drive
• Venice Bypass

- The refined project list will be informed based on Phase I recommendations, improved data, local jurisdiction guidance and preference.
- Will be further informed based on lessons learned from Hurricane Ian.


- Potential mitigation measures will be identified for project development.
- Foundational element of upcoming 2050 Long Range Transportation Plan
• RefiningPriorityProjects,BoxedFunding, andDiscretionaryGrants


~10-20highpriorityprojectswithdefinedcost feasibility.

Adjustmentstopriorcostfeasibleplanbased onupdatedstatewiderevenueprojections.
Electedofficialsupportandguidance. Definedmulti-jurisdictionalstrategytoapply forandimplementdiscretionarygrantsas definedinIIJA.


