SHAPING TAMPA'S TOMORROW:


SHAPING TAMPA'S TOMORROW:

Key recommendation: Increase the role of public engagement throughout the transportation planning process

https://www.tampa.gov.net/T3


Citywide Mobility Plan

► Effectively engages the community to create a clear vision for mobility in the City
MOBILITY FOR
Everyone should transportation OPPORTUNITY
Connect people economic opportunities.
► Set standards and priorities for all modes of travel based on community context
VISION

Be visionary and sustainable, and

► Creates a data-driven process to proactively identify projects
Remove barriers for people who
► Clearly communicates to the community when and why certain projects move forward
SAFETY
Safety is our top injury on our streets
The Tampa MOVES Commitment:

Listen First. Then Listen Again.
Lead with Data.
Distribute Resources Equitably.
Align Resources and Policies.

Seek Funding from Every Possible Source.
Achieve Greatest Impact.

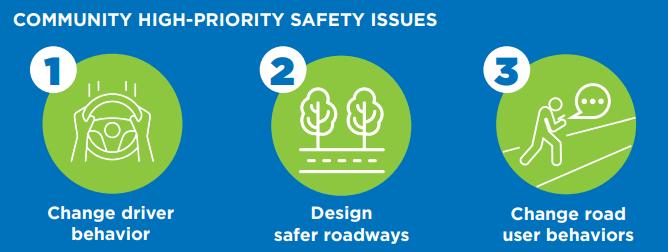


Purpose of meeting:
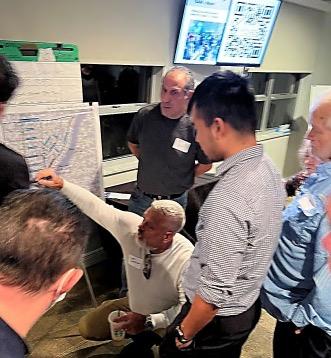
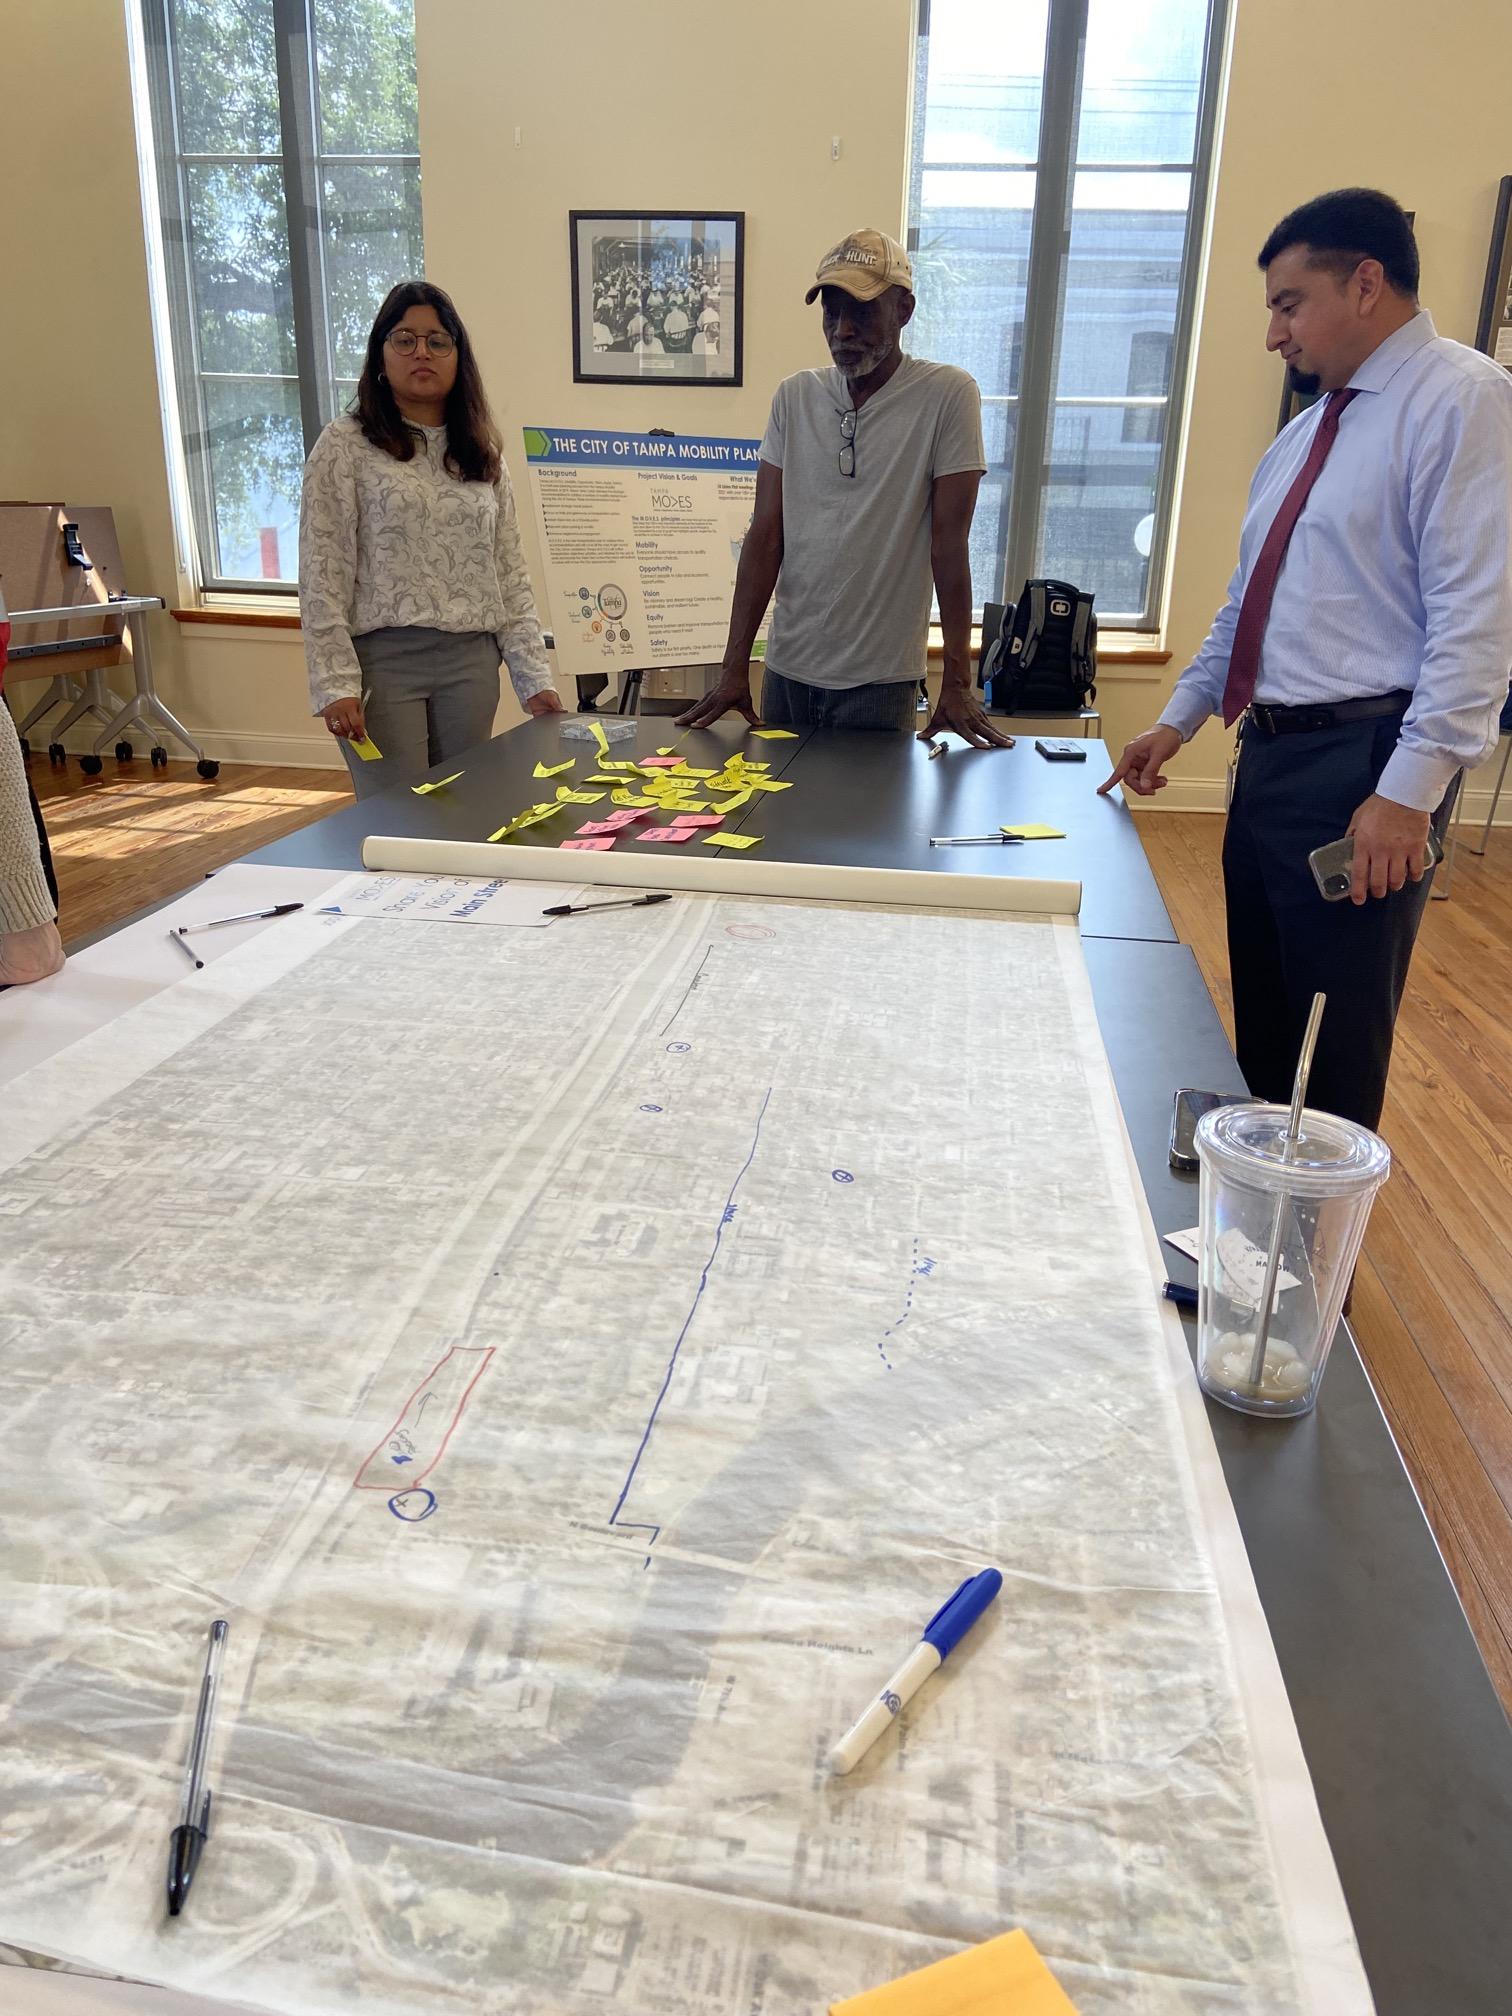
§ Listen to community’s ideas prior to developing plans, making decisions, and building projects


►10 neighborhood listen first meetings
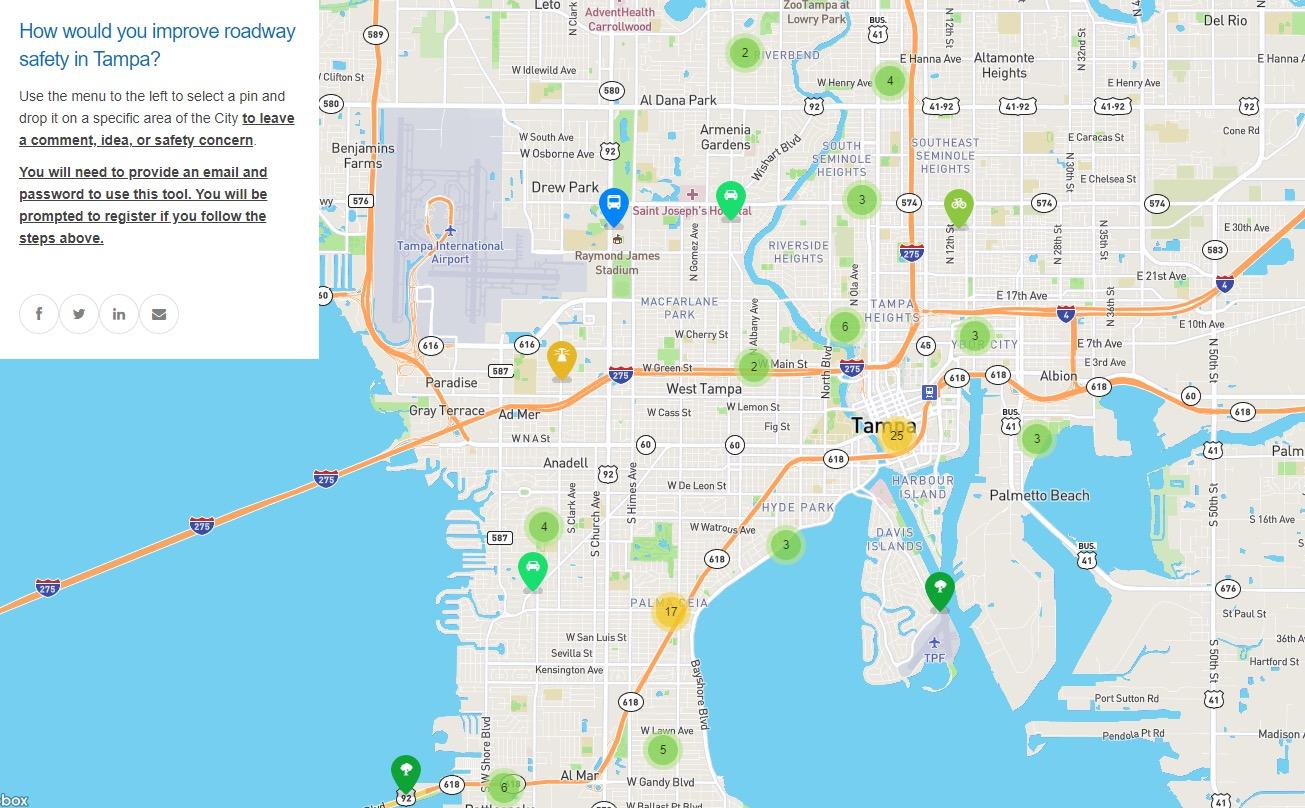
►Interactive questions

►Project website for public comment



“Tampa will provide a safe and equitable transportation system that supports economic opportunity, enhances quality of life, and fosters a healthy, sustainable, and resilient city where people can choose from a variety of affordable mobility options

Everyone should have access to quality transportation choices.
Connect people to jobs and economic opportunities.
Be visionary and dream big! Create a healthy, sustainable, and resilient future.

Remove barriers and improve transportation for people who need it most
Safety is our top priority. One death or injury on our streets is one too many.


We all know there’s a problem…
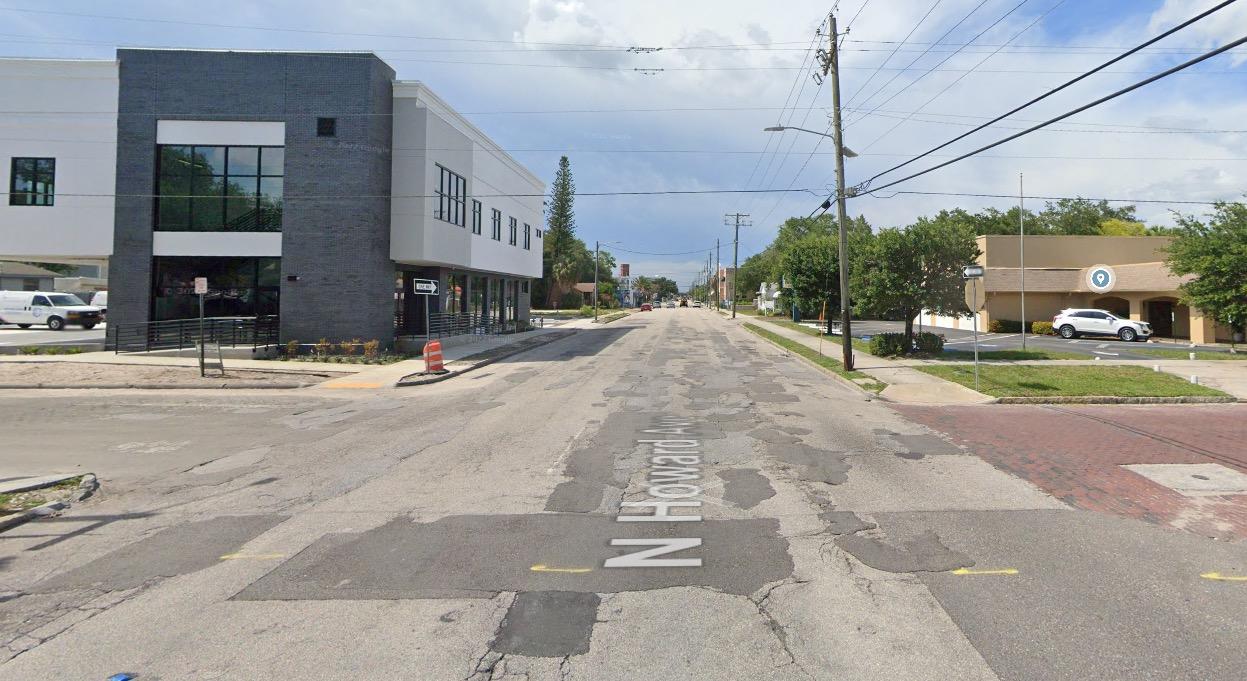
Our streets badly need repaving.

Data Credits: htaindex.cnt.org


And we’re growing rapidly…

And we’re growing rapidly…


Source: https://www.tampa.gov/mobility/transportation/numbers


Key downtown bridges need major rehabilitation.

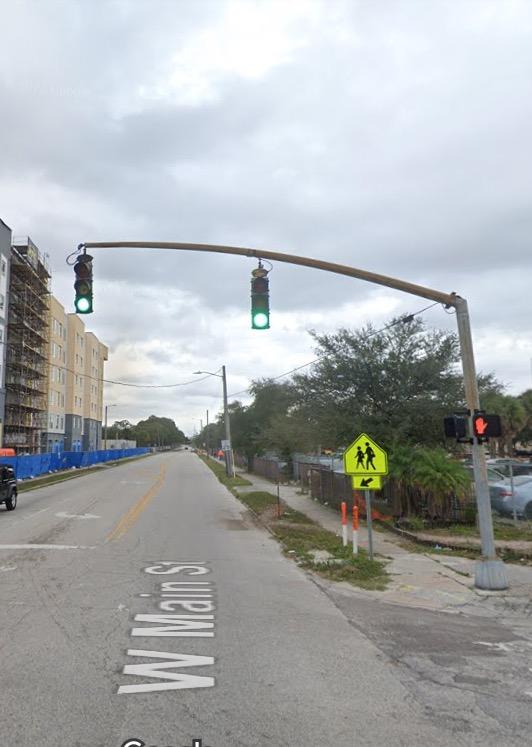
Seawalls need to be replaced. ½ of our traffic signals are past their useful life.

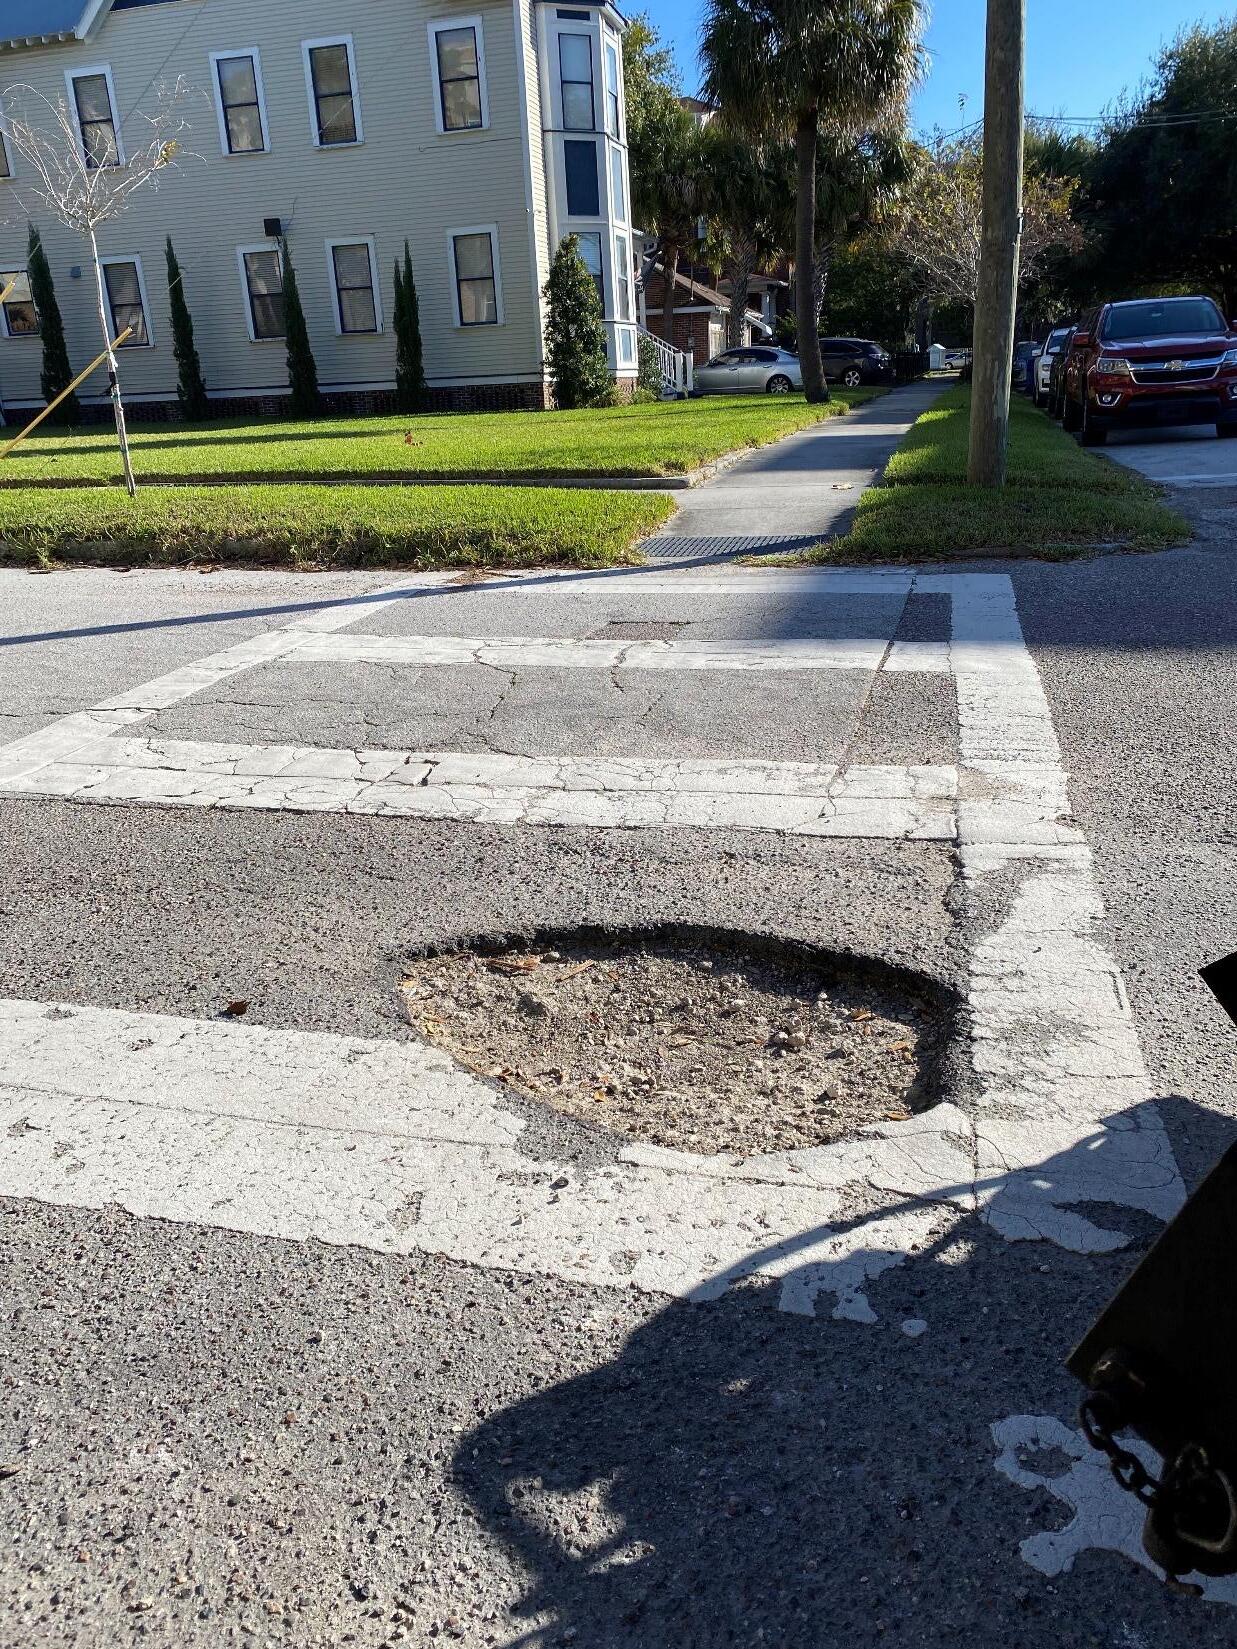
Our current funding is not keeping up with basic maintenance.
1 mile of sidewalk

$800,000


30 miles of repaved roads
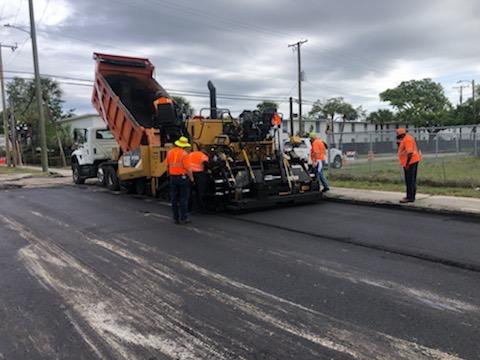
$4,800,000
1 new traffic signal
$750,000

$2.00 per gallon
$5.00 per gallon 1 gallon of gas


18.3 cents


400 Safety Concerns


350 Speeding Concerns
100 Sidewalk Requests
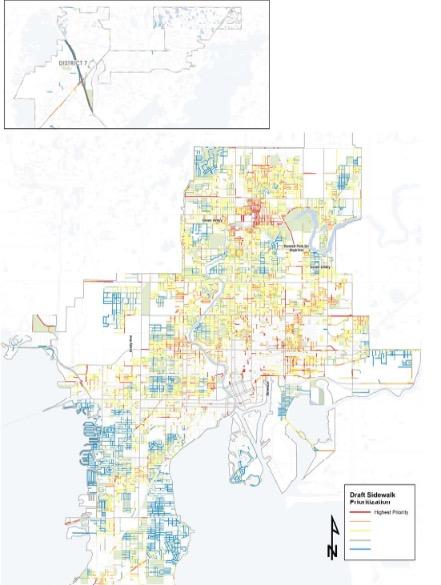
Sidewalk Prioritization Tool
Sidewalk Requests From Public
Sidewalk Prioritization Tool

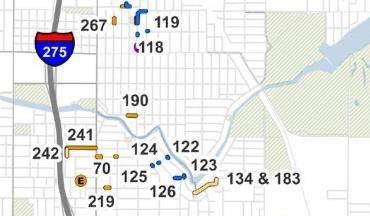
Safety Concerns: Focus improvements on High-Injury Network

Speeding Concerns: Data-driven neighborhood traffic calming program
Sidewalk


Requests: Data-driven priority list

Leadership Buy-In

•
Ensure support and messaging consistency from decision-makers
Staff Empowerment
•
•
Empower staff to say “No”
Educate front-line customer service workers
Public Education
•
•
•
Be empathetic but realistic
Provide transparency
Communicate proactively





choices. jobs opportunities.

dream resilient
Remove barriers and for people who need or


stakeholder outreach, visualizations, community workshops, social media outreach, town halls, and more”
Transportation Advisory Team Final Report


https://www.tampa.gov.net/T3


“Enhance the role of community engagement in the design outcomes and implementation of mobility projects. This program should include more robust


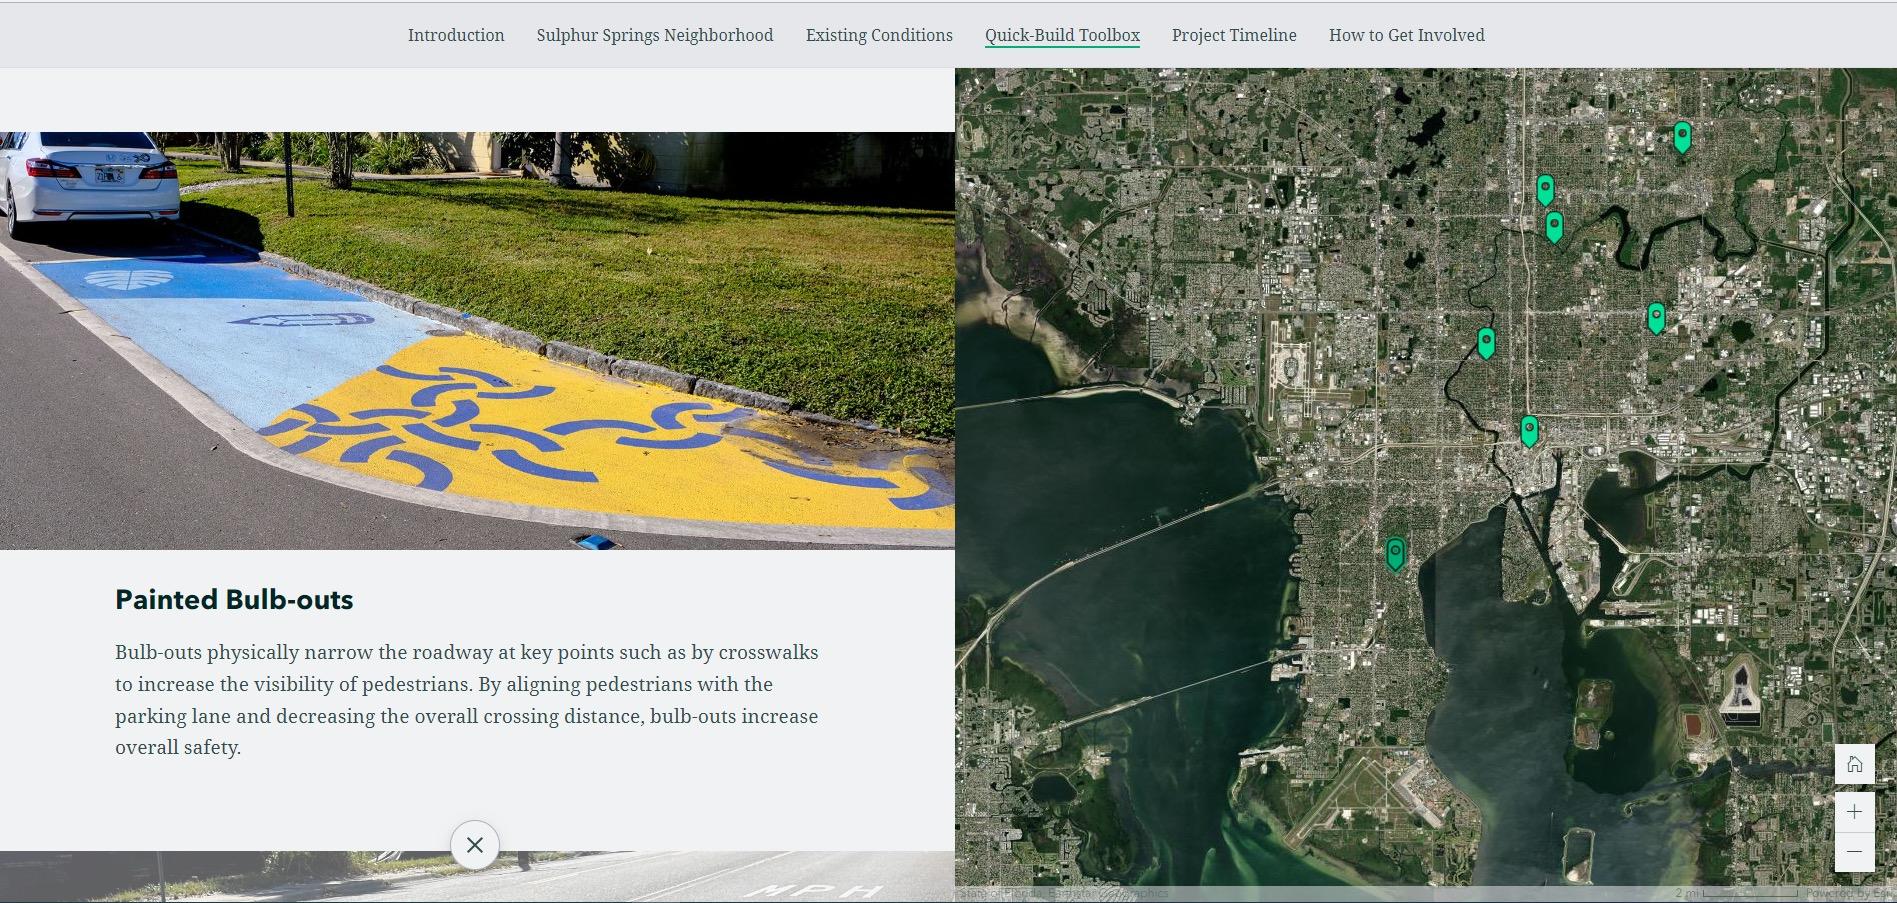
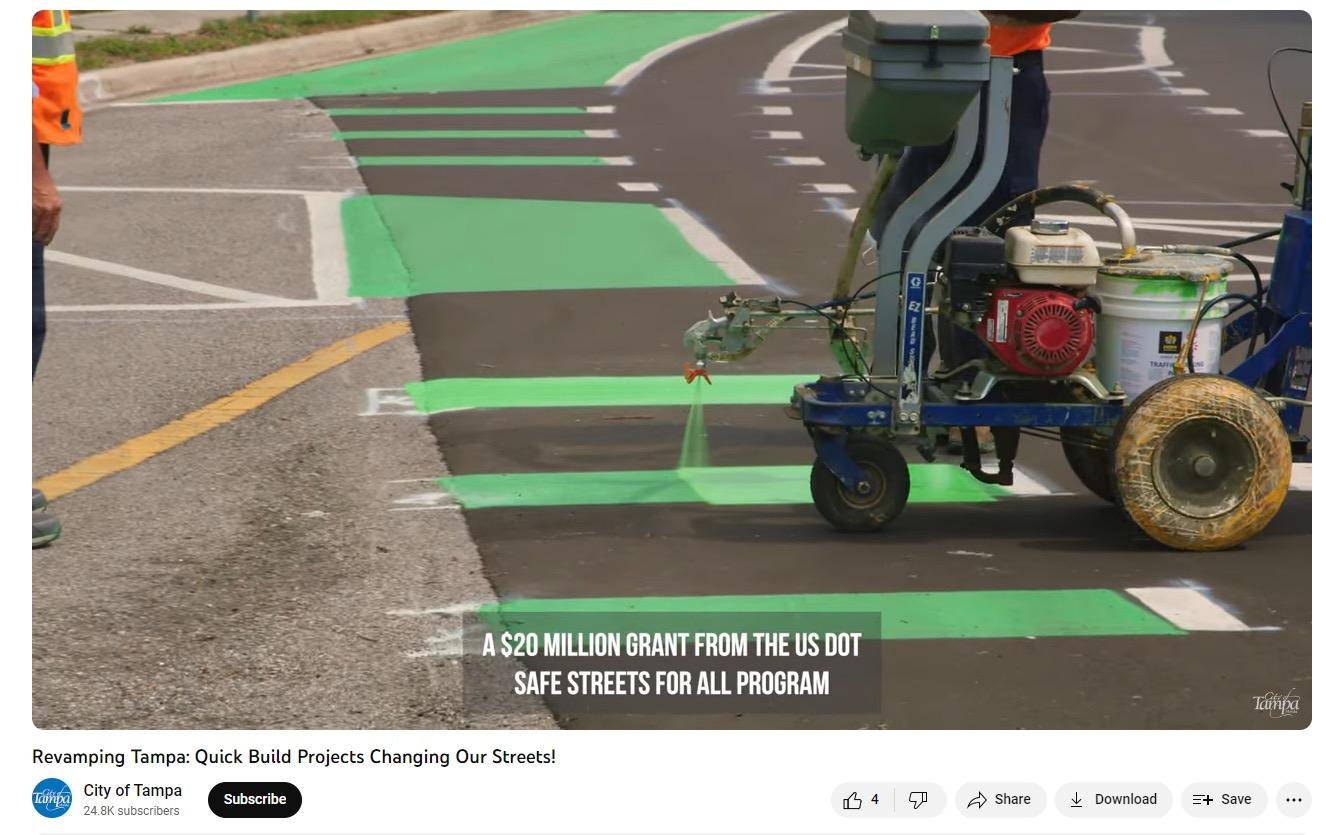
• Lower-cost, quick implementation projects that:


• Are flexible & designed to be easily changed
• Use lower-cost, semi-permanent materials that have a shorter lifespan, but can be implemented more quickly

• Not intended to be pop-ups or demo projects that are removed after short period


uWeekly Meeting
uProduction Meeting
Design PM
Construction PM

Operations Team Lead


u STEPS and responsibility with set dates and instructions to ensure consistency
STEP 2
Project Website
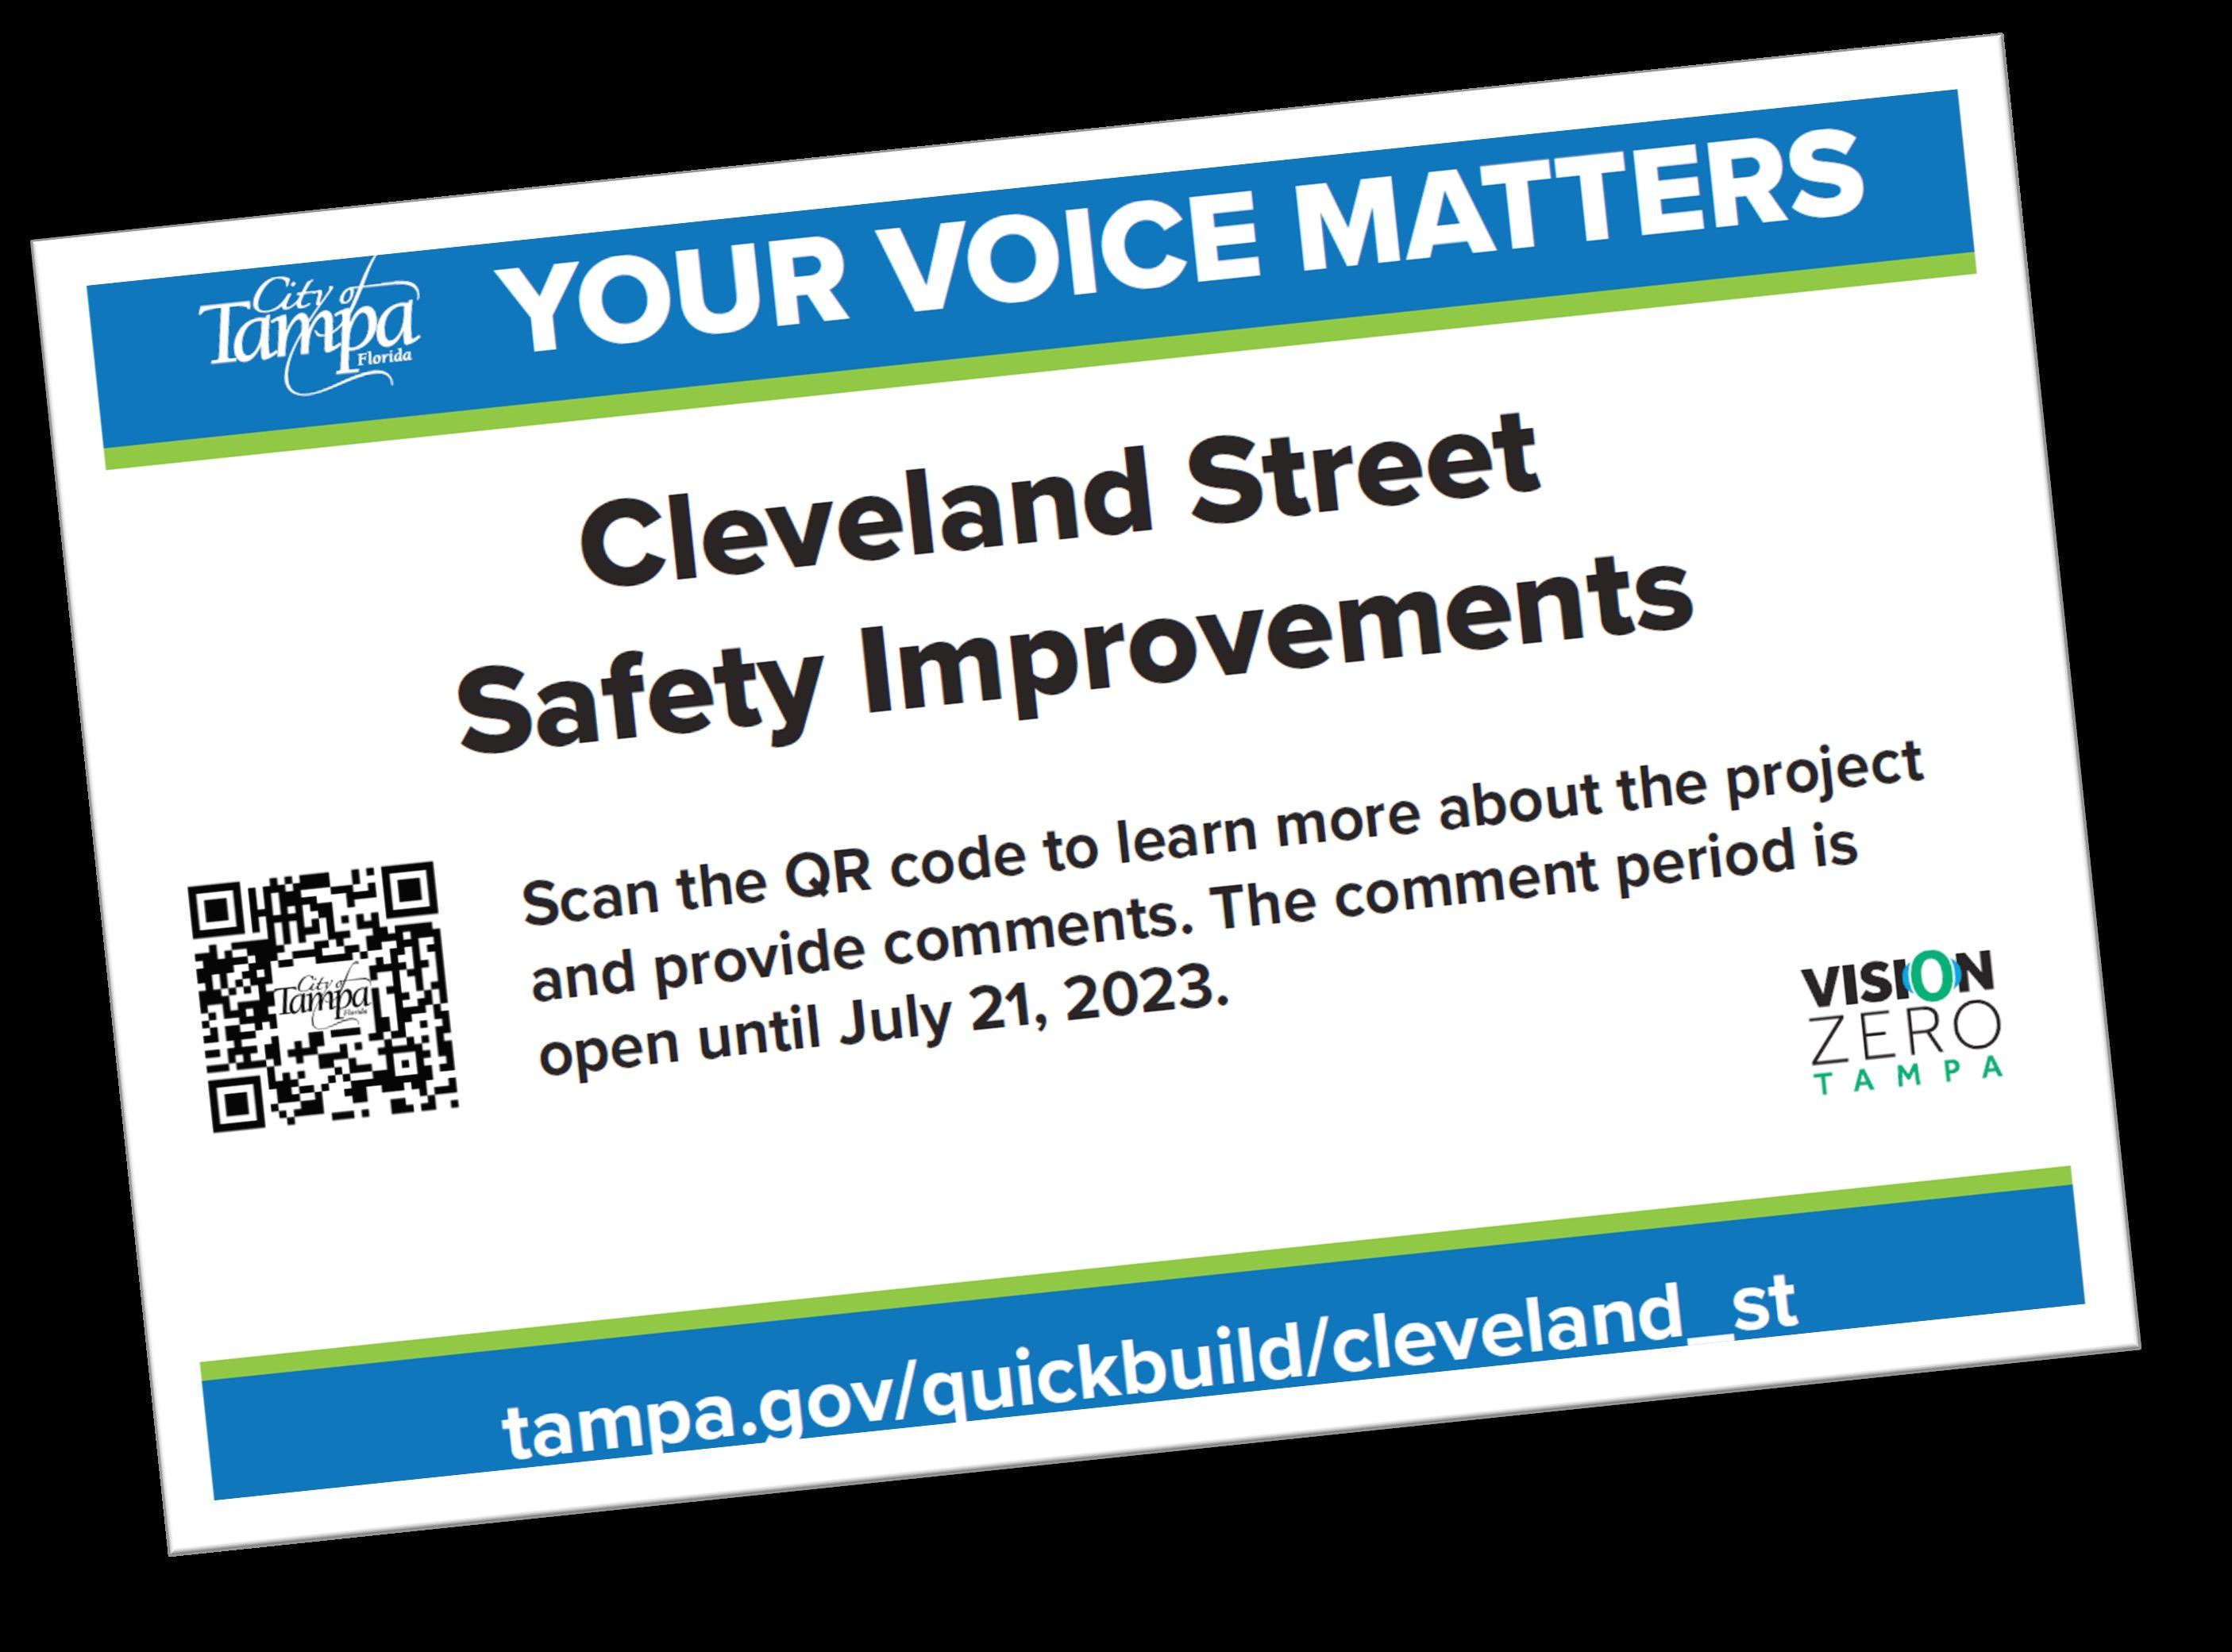
Post Card
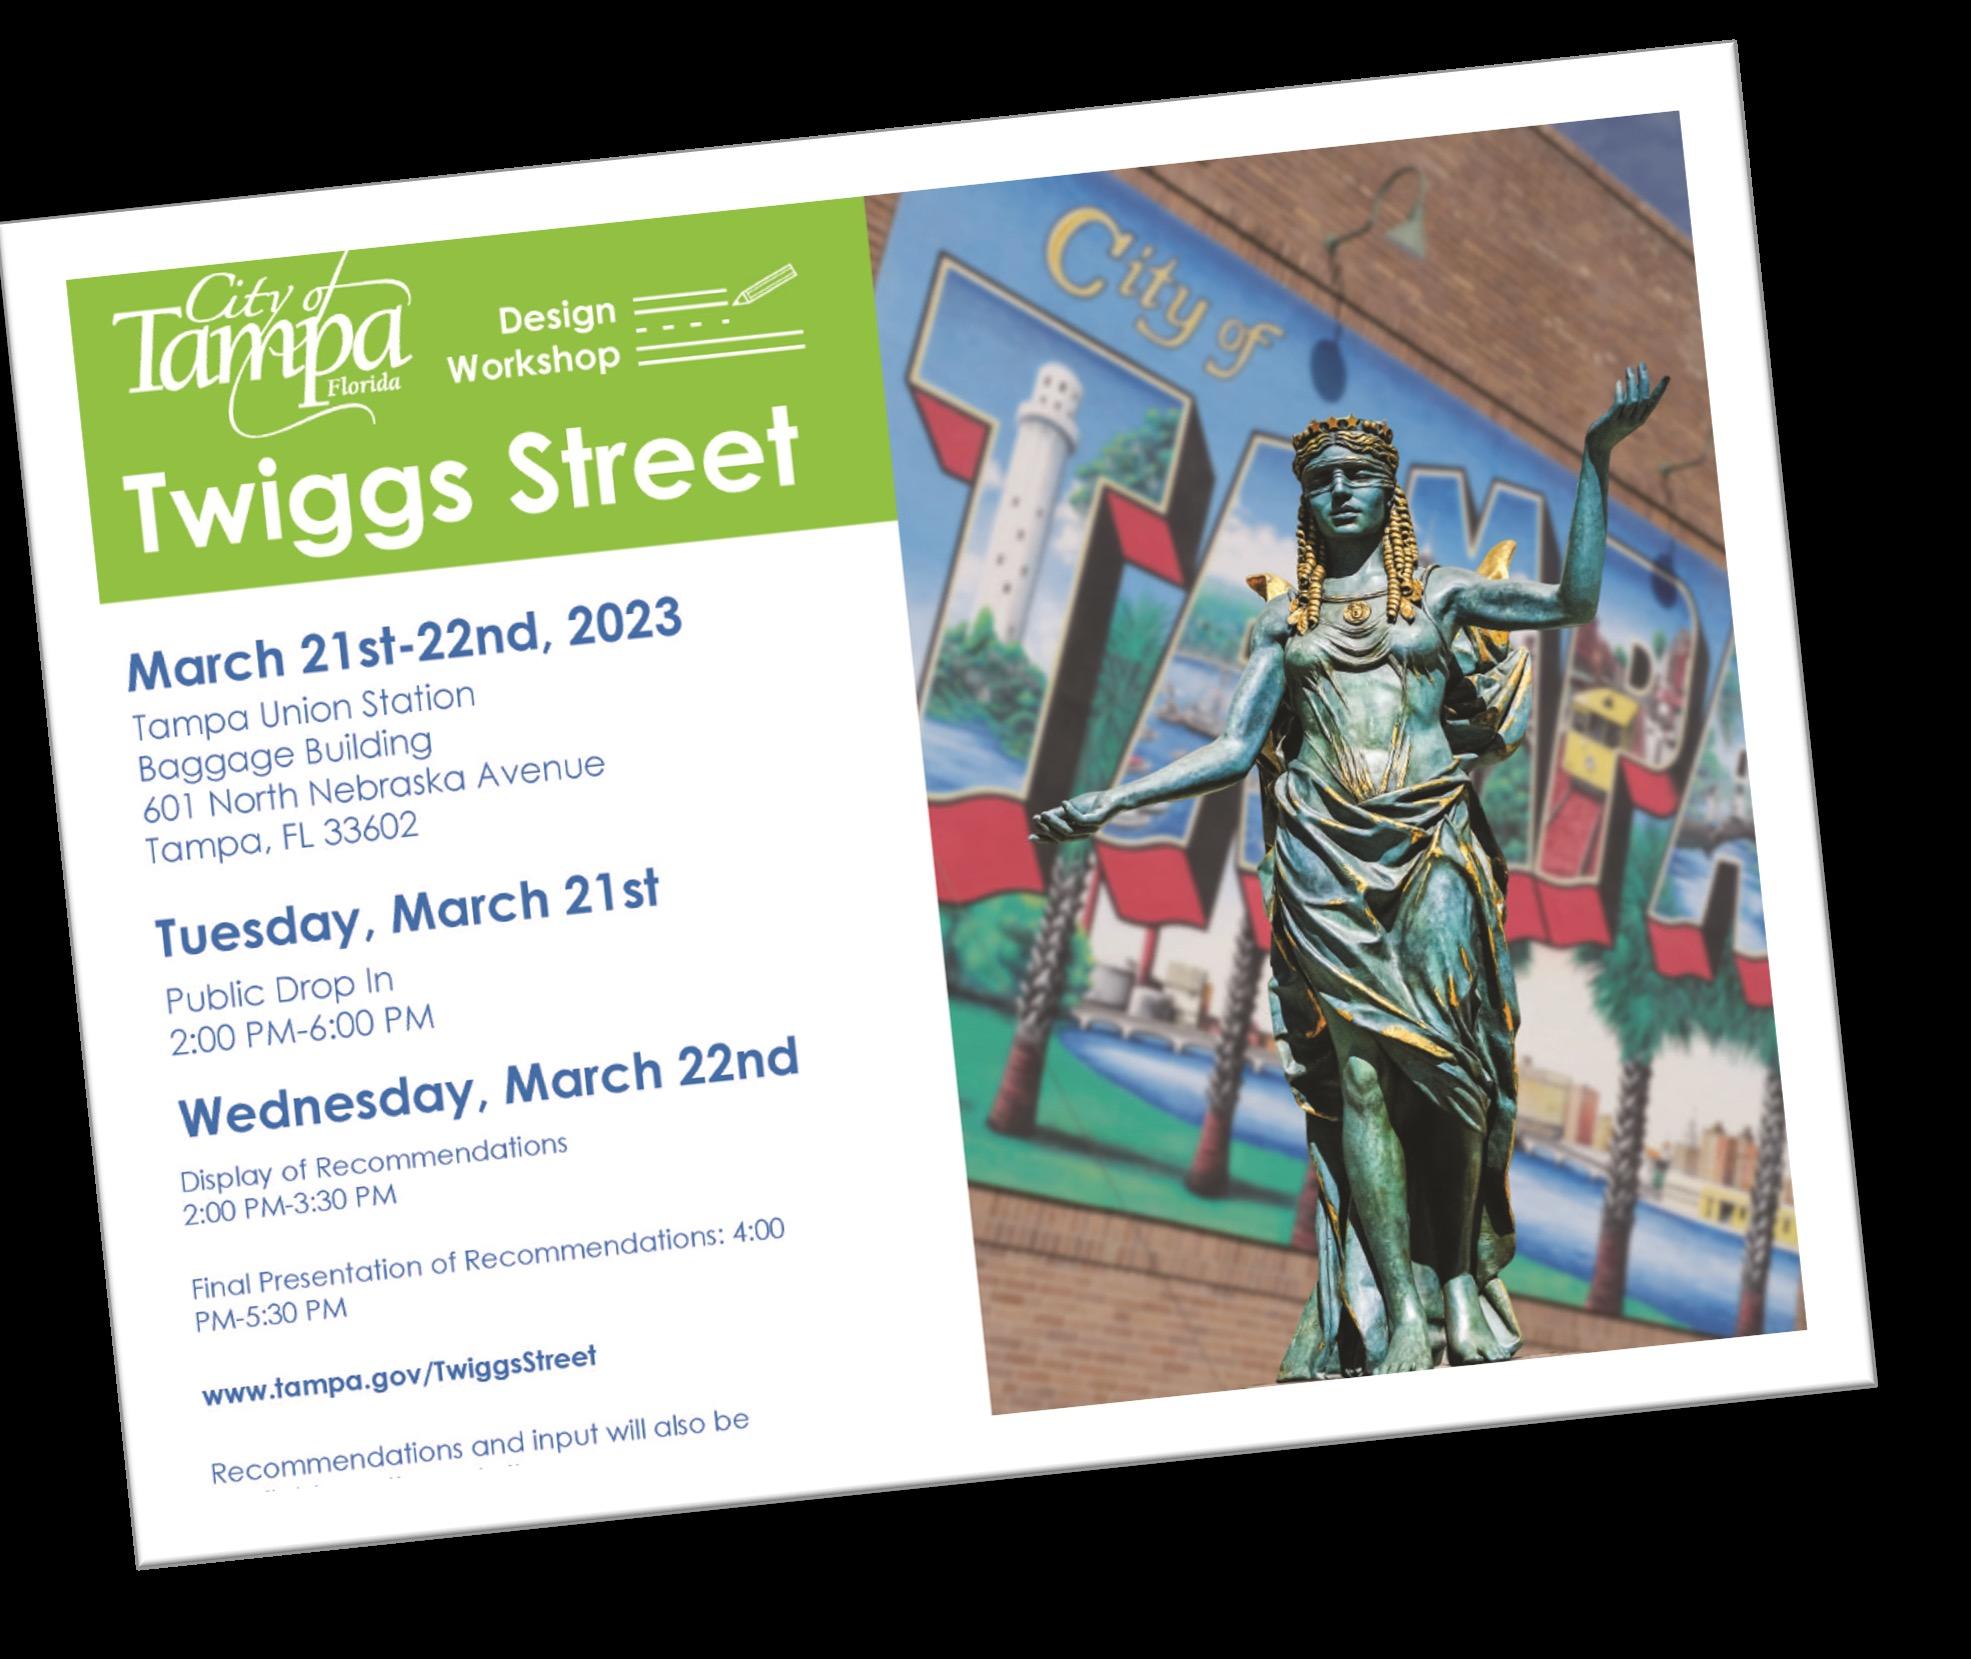
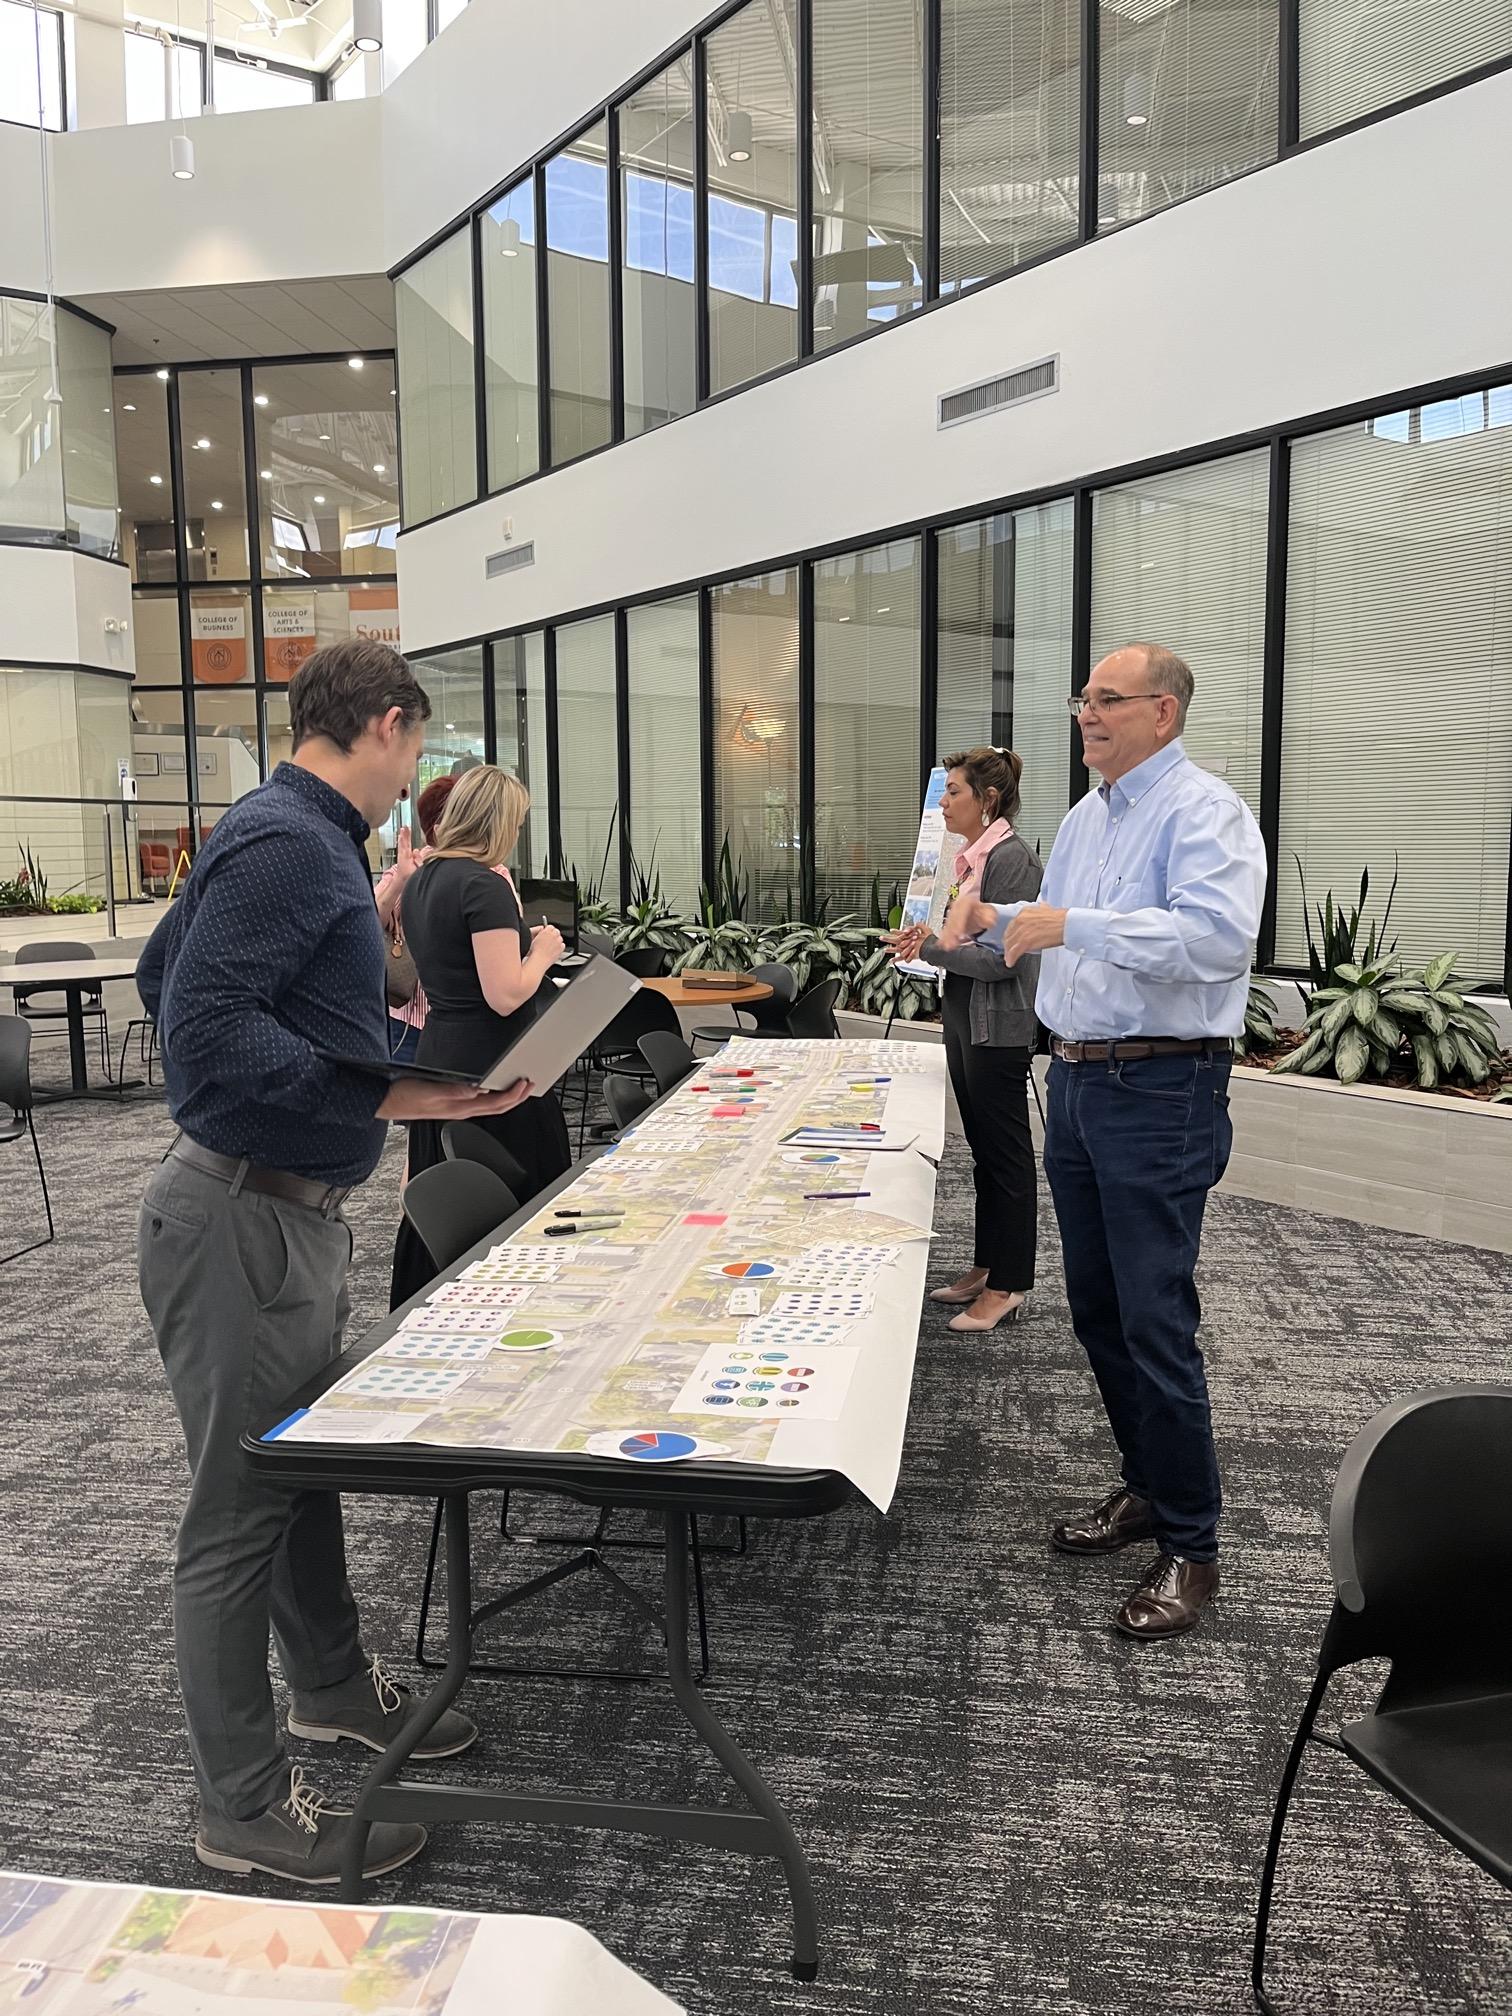
Public Event (Charette / Block Party)
Project Email Address
Mailing List (300 ft Buffer)
Meetings Location and Dates
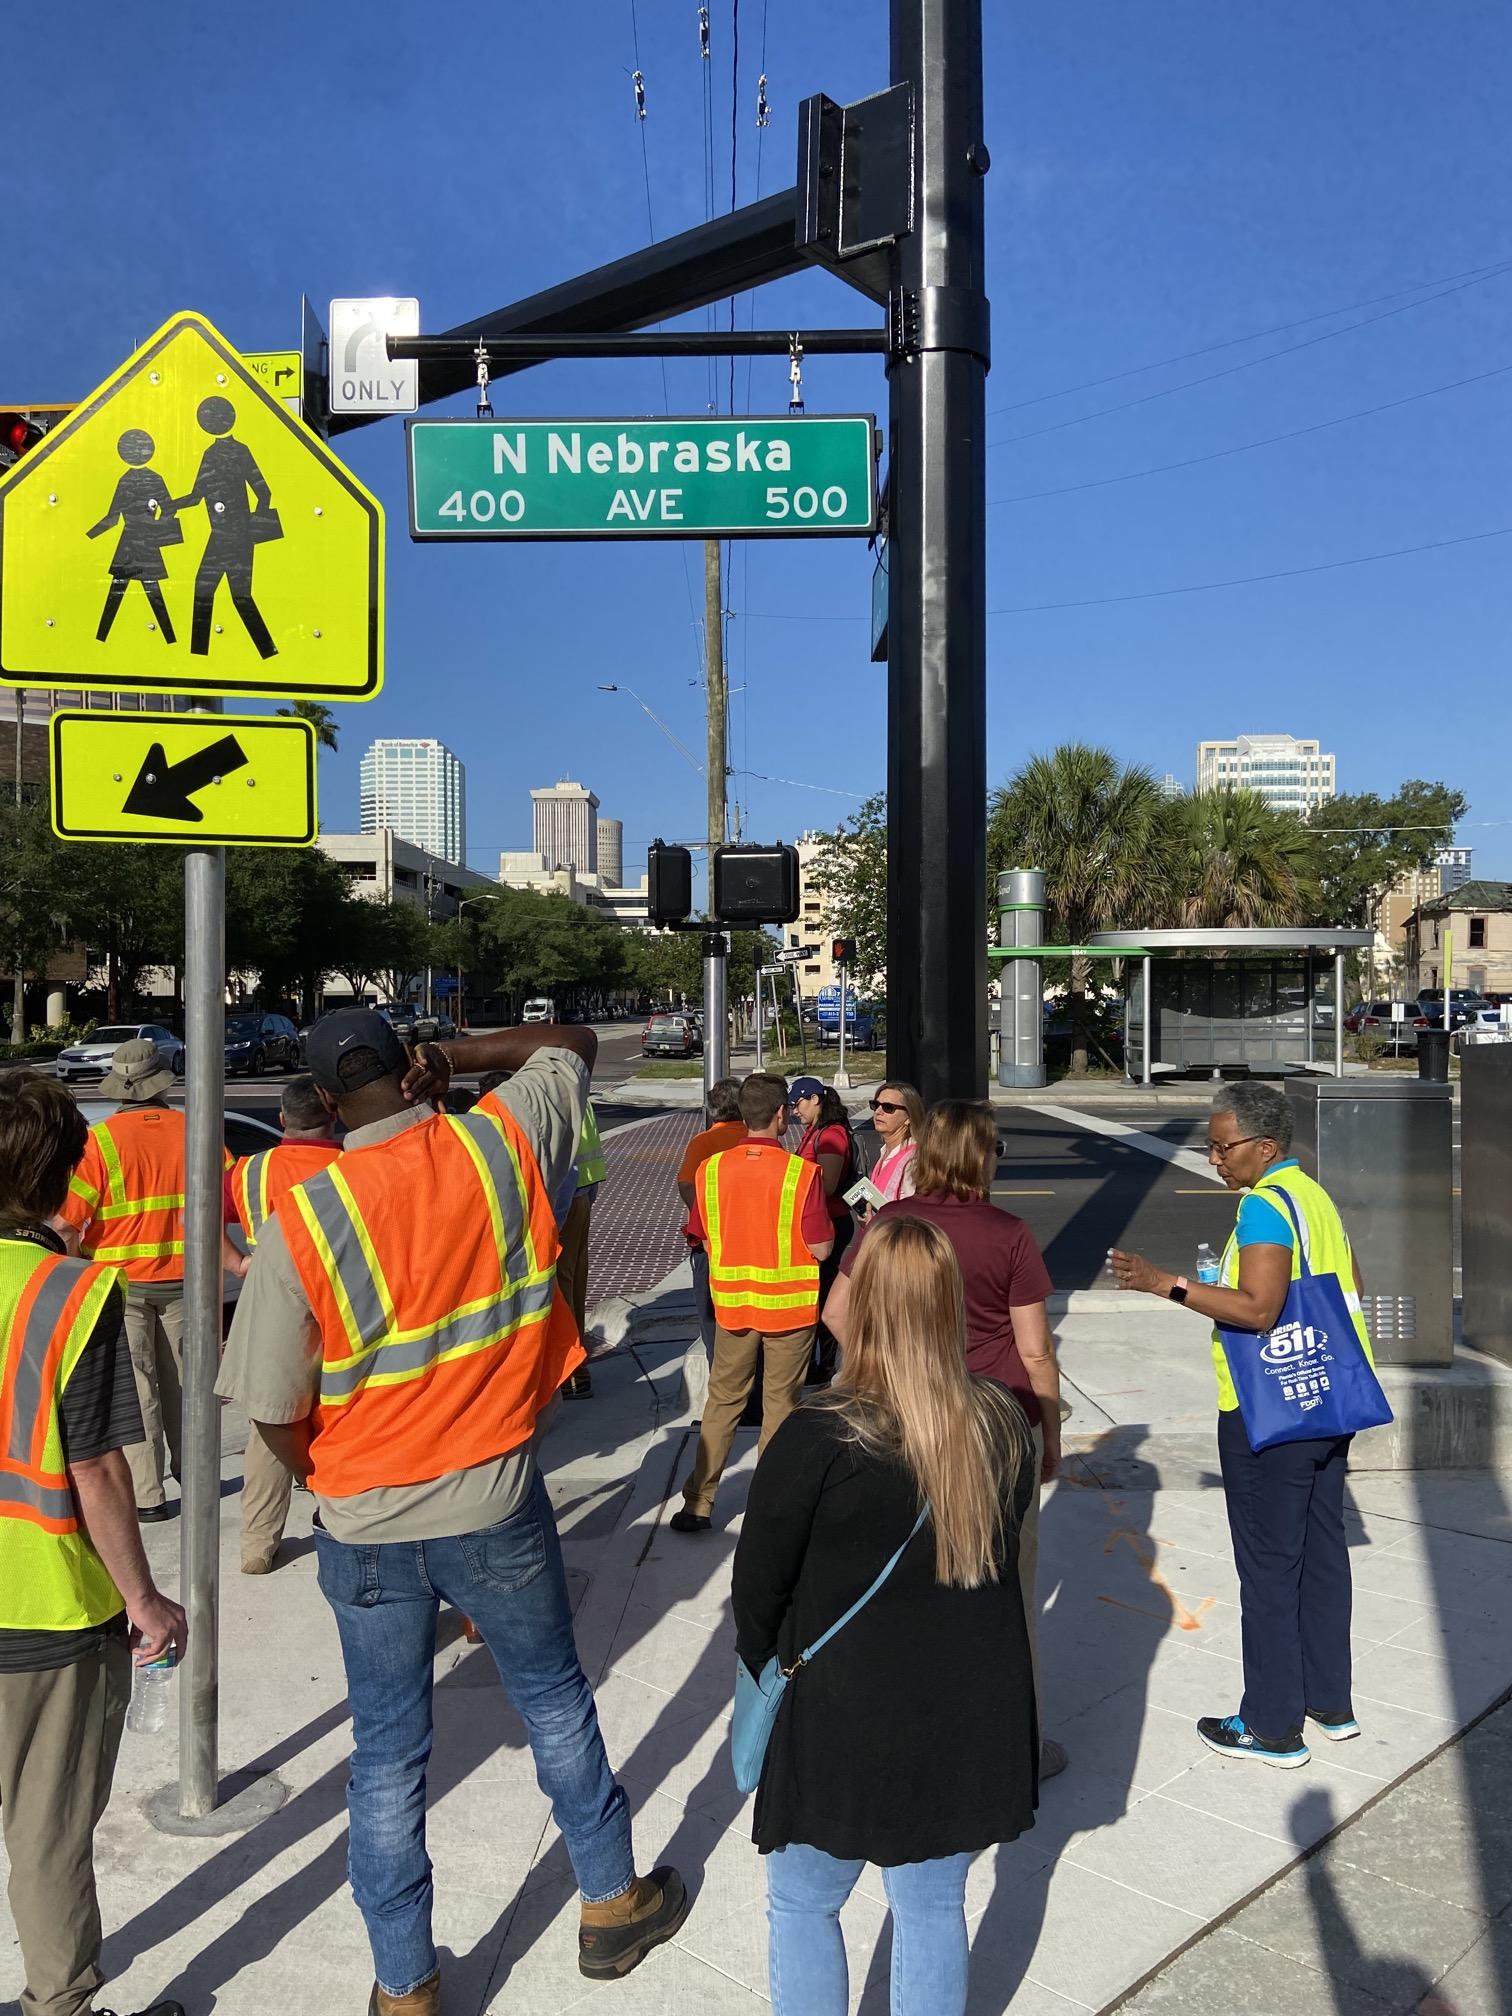
Field Visit and Pictures
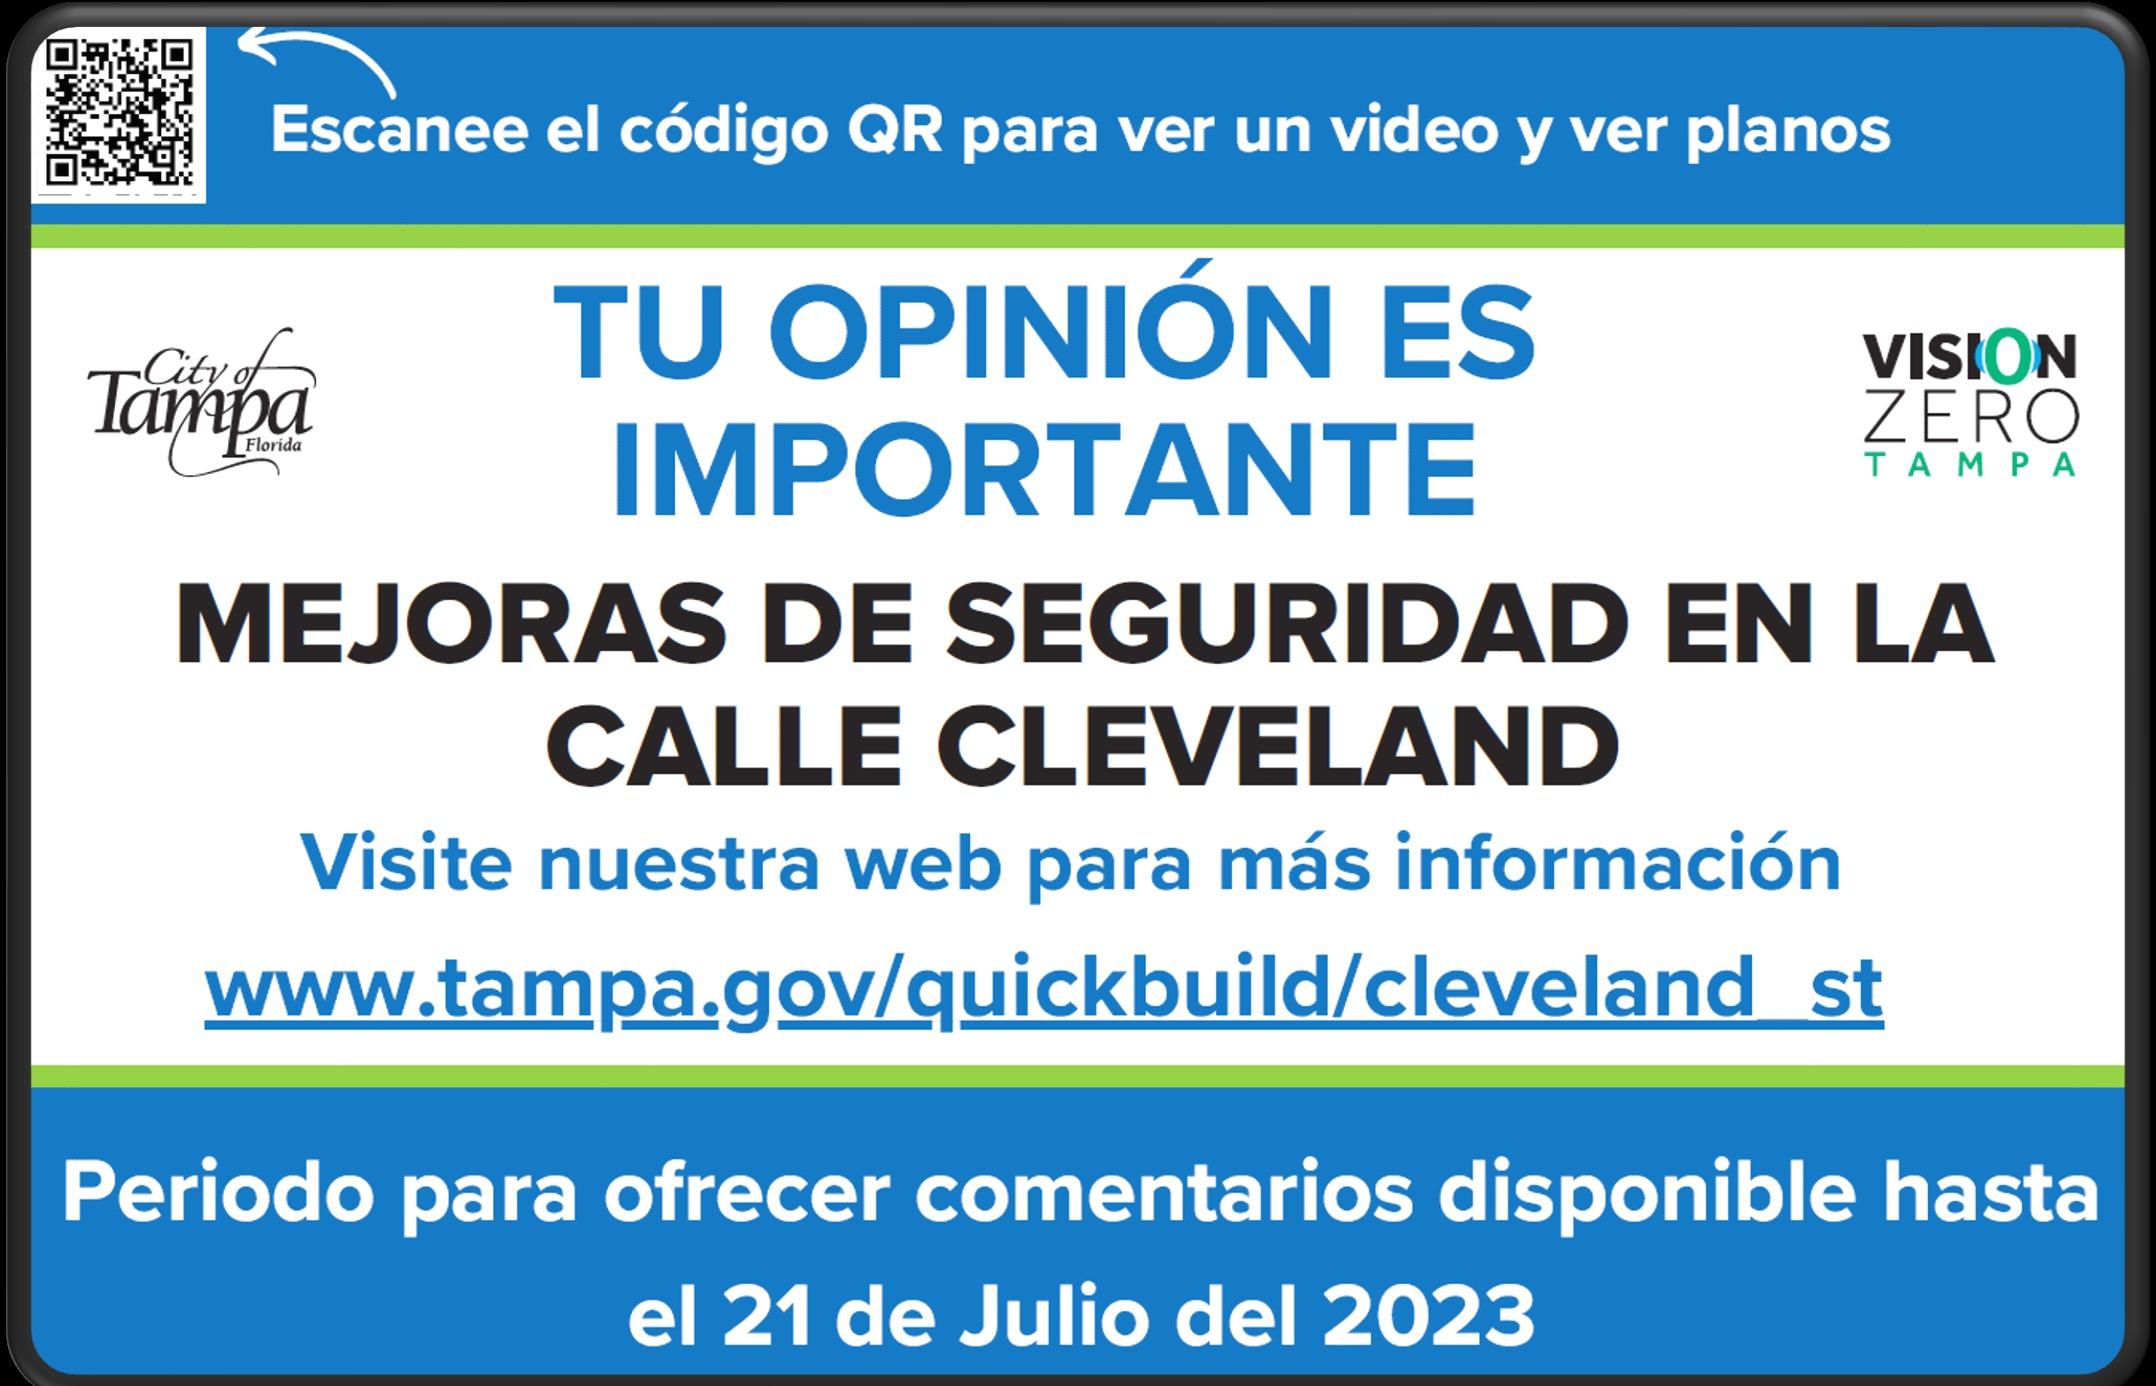
Street Signs
Notification letters with Translations
Stakeholder meetings to discuss their goals (e.g. meeting with THEA, FDOT, CRA and TECO)
Scoping Report with all data gathered in process
Identify Stakeholders and Public Officials
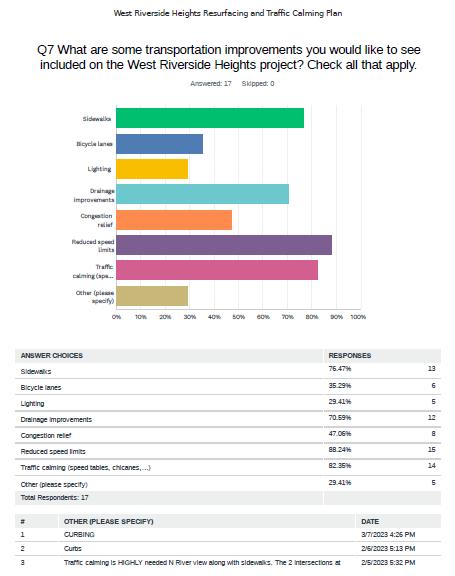
Online NotificationsSocial Media and NextDoor Wikimap/Survey
Comment Period
Departmental Meetings (Meeting with other Departments for input)
Identification:
1. Design Scope

2. Funding Source
3.Procurement Process
4. Schedule












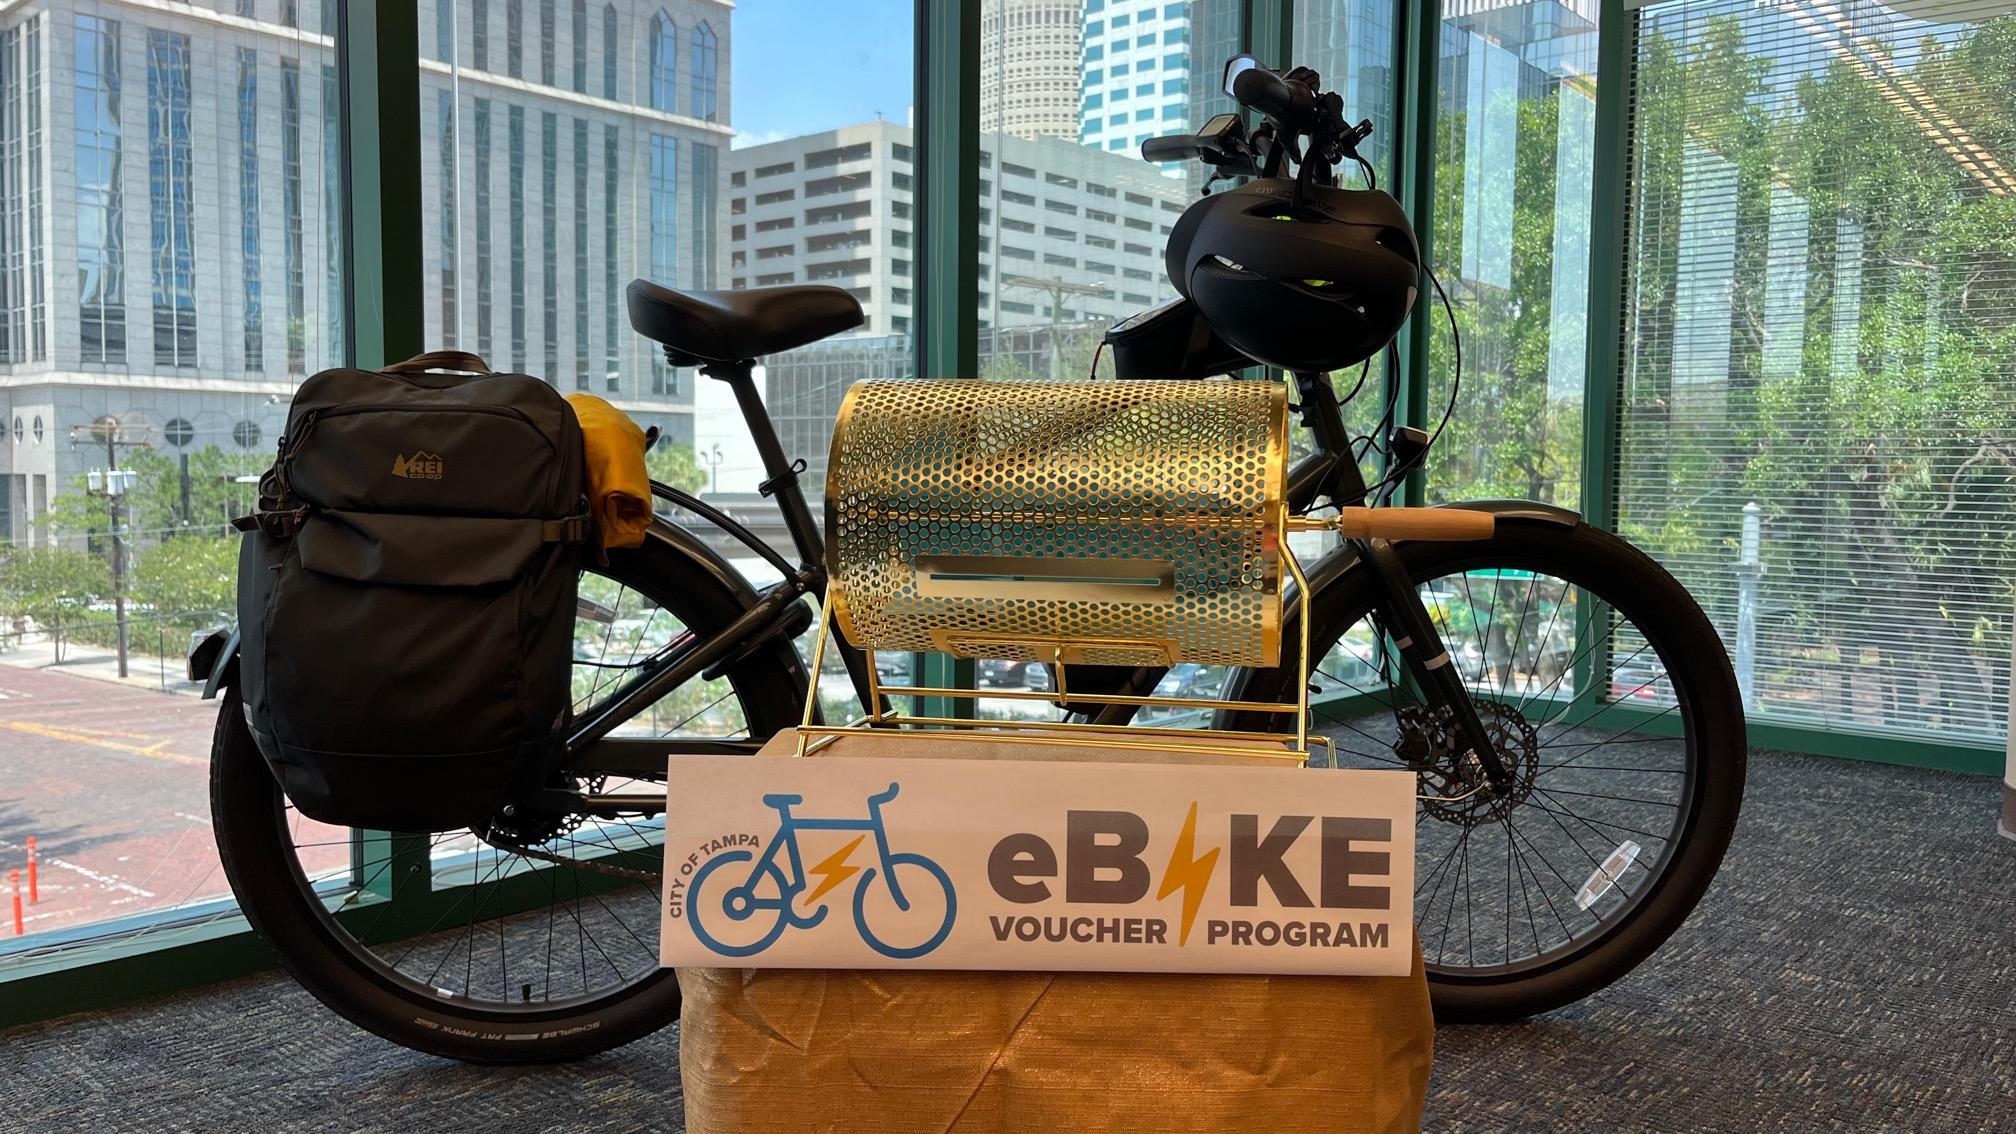
u 180 Vouchers ranging from $500-$2,000
u Low-Income Additional Assistance
u Social, Mass, and Print Media Outreach

u Online & Paper Applications
u Promotion at Community Event in Justice 40 Neighborhood
u In-Person Paper Application Assistance Sessions


u Lottery Selection Process


Never Biked Rarely Biked Biked Monthly Biked Weekly Biked Daily Before Voucher After Voucher

None 1 - 2 Trips 3 - 4 Trips 5 - 9 Trips 10 or More Trips


