Fleet Performance with the


Final-mile distribution can account for a stunning 53% of total transportation costs, even though it represents a tiny proportion of the total miles a product travels through a supply chain.
Because the final mile is just more complicated – especially for distributors with fleets that make hundreds or thousands of deliveries daily.
There’s an increasing demand from customers for faster, more frequent and more timely deliveries. This demand has dramatically raised the performance bar for distributors, causing operating costs to cut further into profit margins. In a recent Eye For Transport survey, distributors and logistics providers named delivery efficiency as their greatest challenge.
All of this suggests a need for distributors to measure and monitor fleet management metrics to optimize delivery. But frankly, except among larger fleet operators, it’s just not happening.
This may be because executives do not see the daily dispatch of delivery trucks as an urgent place to funnel scant investment dollars. And as a result, distributors continue to manage fleets manually, without the benefit of advanced route optimization software. Transportation planners and dispatchers spend their time managing the chaos and getting drivers out the door, with little focus on measuring performance and driving continuous improvement. Other corporate functions, like sales and sourcing, have been using KPIs to drive business excellence for decades. It’s time for lastmile distribution to step up, too.
While we can’t tell you the exact fleet operating metrics to track, we can provide guidance based on our work with thousands of fleet operators globally.
To help you navigate the complicated world of fleet performance, we developed this ebook to help you examine why, what and how to measure your operations. And in doing so, we hope to provide a formula for fleet managers to become true agents for change – helping their organizations capitalize on the substantial financial upside of optimized fleet performance.
To effectively manage fleet performance, you’ve got to measure it. Cost savings provide the most compelling reason to start.
For fleets that plan and schedule routes manually, use spreadsheets or rudimentary route planning tools, we typically see an opportunity to reduce total fleet operating costs by 10–30%. A Bain & Company study found a similar savings potential of 10–25%.
That’s a lot of money back in your pocket.
Let’s say you could optimize routes to eliminate 20% of your fleet’s yearly miles. Using the National Private Truck Council’s cost-per-truck-mile estimate of $2.80, a 30-truck fleet running 1.5 million miles a year would save $840,000 yearly – dollars that move from an expense line straight to the profit line.
Fleet key performance indicator (KPI) dashboards give a clear picture of where there are inefficiencies, helping you identify their causes and make changes that will trim waste and put a chokehold on rising costs.
Another reason to focus more on fleet operating metrics is to prepare yourself for enhanced C-suite scrutiny. Distribution businesses have squeezed every ounce of profit from other functional areas, and attention is now bearing down on transportation operations. The questions are predictable:

› What’s the current baseline on our key fleet operating metrics, like cost per mile?
› What’s been the trend on key operating metrics over the past month/ quarter/year?
› Are we leveraging automation to work smarter and more efficiently?
› Does a continuous improvement program exist?
You’re either ready for these questions or you’re not.
Despite the compelling financial reasons to monitor and improve fleet performance, measuring KPIs is a surprisingly low priority – particularly among small to mid-sized distribution operations with up to 100 trucks.

The main reason is lack of time.
Lean transportation teams are juggling various activities. Between route planning, dispatching, driver management and customer inquiries, reporting gets pushed to the back burner. But what if your execution for each of these tasks is sub-optimal? If you don’t measure each step of the process, you have no way of knowing if you could be more effective with your time and resources.
The good news is that the right route optimization software can do the measuring for you and turn reporting into a manageable task. Instead of crunching numbers, you’re analyzing trends and then attacking your most significant problem areas.
Take post-route driver debriefs as an example. The software can automatically tell you which routes had a significant variance from the planned route. This means you can interview only those drivers instead of weeding through everybody—adding more minutes back into your day.
Another barrier to measuring fleet performance is that inefficiency is not always apparent.
It’s not hard to spot a poorly performing salesperson. He’s either making the sales or he’s not. But with fleet operations, it’s a little less clear.
While things may look good, you may be running more miles, trucks and drivers than needed. Even to your savviest finance people, those inefficiencies may not necessarily stand out on a P&L – until it’s too late. Don’t wait for that to happen. Hard numbers on fleet performance that are regularly reported allow you to spot and address performance gaps before they significantly erode profits.
Routing software provides you with the data you need to make quick decisions. Confident decisions. It allows you to be the leader who identifies the opportunities to reduce operating costs and proactively improves operations.
Effectively measuring fleet performance is challenging without the right technology. Honestly, it’s nearly impossible.
You’ve already got some of what you need in the federally mandated ELD devices in each of your trucks. But if you plan and schedule routes using spreadsheets and other basic tools, you’ll need to expand your tech stack to include route planning software.
Even for fleets operating ten trucks and ten stops per vehicle per day, the number of route permutations is 125,631,301,911,058,944,000. Clearly, even the most brilliant route planner can’t consider all the possible options to create a route plan using the least time and miles if he’s doing it manually.
Meaningful measurement requires the use of advanced routing software to establish a baseline for what is truly optimal. This task is made easier by the fact that the software reduces route planning from hours to minutes.

You then need to compare planned versus actual performance.
With the right software, that’s easier to do than you might think. Most leading route optimization software providers will have pre-built integrations with dozens of in-cab telematics systems.
Every 1–3 minutes, telematics data can be pulled into the software, letting you compare planned versus actual time and distance on each route. These realtime measurements allow you to proactively manage customer expectations in the event of day-of-delivery delays. And all that data is fed into the route planning system so that tomorrow’s route plans reflect today’s learnings.
Measurement can also apply to future performance.
Most measurement programs look at current performance and answer the question: “How are we doing?” The same tools can look to the future to answer an even more powerful question: “How could we be doing?”
For instance, advanced route optimization software with business modeling can provide the exact service and cost impacts of relocating a distribution center or adding a new one. These kinds of strategic changes can realize sixand seven-figure savings. There’s real power behind being the agent for this type of transformational change – made possible by the right software.
There are hundreds of transportation KPIs you can measure. We encourage you to zero in on the ones that matter most to your organization. When deciding which metrics should be on your KPI dashboard, the best place to start is the board room.
Is the company’s priority cost control? Improving the customer experience? Reducing the firm’s carbon footprint?

The related transportation metrics for these corporate goals are quite different. Your KPIs may touch on all these areas, but they absolutely must include measures that feed into the top executive’s priorities.
With this approach, performance in certain areas may have to take a hit to maximize performance in others.
Here’s an example—a small food distributor can’t compete with larger competitors on price. That’s a simple fact. So its CEO has established excellent customer service as the corporate mantra—that’s how they’re going to compete with the giants.
The company’s largest customer on the outskirts of town wants a delivery every Tuesday and Thursday at 7:00 am, so those deliveries are done early in the route sequence, even though it would be far more efficient if that delivery was done later in the morning. To satisfy this customer and the organization’s priority on customer experience, cost metrics will worsen, while service and satisfaction metrics will improve.
Once you’ve identified executive priorities, you can start building your KPI dashboard. There are three levels of metrics:
1. Dispatch and drivers – monitor driver behavior and understand the variance between planned and actual performance.
2. Logistics leaders – measure cost and service metrics that impact profitability and customer satisfaction.
3. C-suite – examine trends over time. Like fleet operating costs as a percentage of revenue, some metrics may require integration of transportation metrics with data from other systems.
Let’s look at some of the KPIs that could make sense for each of these reporting levels.
At the dispatch/driver level, you need to monitor safety and compliance.
In terms of route efficiency, your KPI dashboard should compare planned versus actual performance on the route. This comparison requires your routing software to integrate with in-cab telematics systems. There’s no point in investing to create efficient route plans if you don’t validate drivers’ adherence to those plans.
Miles driven
Depending on the benchmark you use, every excess mile you run costs you from $1.82 (American Transportation Research Institute) to as high as $2.80 (National Private Truck Council).
Stop sequence Drivers that do not follow the designated stop sequence add time and miles.
Number of stops made Stops and miles outside a pre-determined route should be identified and explained.
Time at each stop Unload times will vary with each customer. When you know, from historical performance, how long each stop will take, you can schedule accordingly and provide customers along the route with more precise ETAs. This measure can also signal the need for further analysis of unloading procedures at specific drop points that cause chronic delays.
Arrival/departure times Suppose the sales-committed delivery window is 8:00 – 10:00 am, but the driver consistently arrives and departs between 7:00 and 7:30 am. In that case, the delivery window can be updated in the planning system, so future plans are more accurate.
DOT reportable safety incidents
Each trucking company must report this accident data – any fatality, any injury treated away from the scene, and any tow-away damage caused to any vehicle involved in a crash. Insurance companies closely examine this data, and rates will be higher for fleets with a greater crash frequency per million miles.
Speeding incidents Automatically flagged in telematics systems. Reduced speeding lowers fuel costs and safety incidents. Drivers who know they are being monitored will avoid the behavior.
Harsh acceleration/braking Automatically flagged in telematics.
DOT violations There are many ways to run afoul of the DOT beyond reportable incidents, such as violations related to a driver's license/qualifications, excess vehicle weight and vehicle condition. Fines for such incidents can cost tens of thousands of dollars.
HOS violations
Allows monitoring of available hours to avoid violations. More advanced route planning software will include driver-specific data and do this monitoring for you
This metric identifies when drivers go beyond the legal number of driving hours in a day/week. You don't need to report these violations, but you do need to track them in case of a DOT audit.
These miles happen when a vehicle with an ELD is moved without someone being logged in as the driver. With the federal ELD mandate, carriers must either assign the time to the correct drivers or attach a comment explaining why it couldn't be assigned. This is a key issue during audits, since failing to log in and then driving, or logging out and continuing to drive, is the most common falsification method used by drivers to "create" an 8- or 10-hour break when one does not exist, or to operate past a limit when using electronic logs.
Cost per mile
This is a critical metric to know since it provides the benchmark to gauge the financial impact of improvements such as the ROI on routing software.
Revenue per mile When fleets can enable revenue growth without adding trucks and drivers, that's a substantial competitive advantage.
Cost per stop If, through better route planning, you can add even one extra delivery per day for each truck in the fleet, this can easily equate to six-figure annual savings or more.
Revenue per stop The Truckload Carriers Association Profitability Program considers this measure a "leading indicator," as higher readings (relative to historical or peer group results) should result in higher margins and profitability. When you invest in an asset, whether it's a truck or a rental property, the primary objective is to generate the most revenue in a given time.
Cost per unit/case/pallet/ cube Most companies settle on one unit of measure to be applied uniformly across transportation and warehouse metrics.
Miles per gallon Fuel is your most significant cost contributor after driver salaries, so it pays to monitor this number and keep it in check. It provides the financial impetus to clamp down on gas-guzzling behaviors such as speeding and excessive idling.
On-time delivery percentage Did you deliver when you said you would? Excellent performance here creates happier customers and greater customer retention. Internally, it reduces the cost burden of "where's my delivery" calls to customer service.
Delivered in full percentage Did the customer get what they ordered? Sub-standard performance strains customer relationships.
Delivered on time, in full percentage This metric combines the two above to show how often customers get what they ordered when they wanted it. Rather than focusing on your objectives, this metric focuses on the customer's goals. A good OTIF score helps assess the company's overall warehousing and delivery performance.
Assets inactive over two days This suggests whether
is
to
without
Parts/tires/fuel costs per mile This granular measure flags often invisible expenses that could be driving up your operating costs.
Empty miles Provides a clear view of how assets are used day-to-day, and can lead to much higher profits if these empty miles are lowered.
Preventative maintenance (PM) compliance
This is an important leading indicator to avoid things that impact delivery performance and customer satisfaction, like breakdowns mid-route.
At the logistics executive level, metrics become less tactical and more strategic, with KPIs like cost per mile, revenue per mile and on-time performance.
It’s valuable to have a balanced set of metrics to assess performance accurately. For instance, if the cost per mile is your primary cost metric, then a significant reduction in mileage to complete the same deliveries (a good thing) will actually increase the cost per mile (a bad thing) – assuming you use the same number of trucks. But when you also look at revenue per mile, the payoff of fewer miles becomes clear.
At the C-suite level, executives generally want data aggregated to examine strategic trends rather than point-in-time measures. Fleet management KPIs at this level might include transportation cost as a percentage of revenue, shown over time.
Advanced route optimization software lets you create daily/weekly/monthly dashboard reports for your executive team that provide an at-a-glance look at fleet performance.
All the data from such software resides in a database and can be extracted and combined with other company data using separate business intelligence software. The resulting analysis can lead to critical insights, such as the impact of fleet operating costs on profit over time or the relationship between on-time performance and overall customer satisfaction.
Transportation costs as a percentage of company revenue Measures the relative efficiency of fleet operations as the company scales. Recordable safety incidents trend Safety performance has a massive impact on organizational costs for healthcare, compliance, and insurance. C-level leaders understand this and want to monitor safety performance closely.
On-time delivery trend For distributors, this one statistic is an excellent leading indicator of overall customer satisfaction – a key C-suite priority.
CO2 emissions trend
Organizations of all kinds are under pressure to reduce their carbon footprints. This metric can provide clear evidence of progress that can be shared with customers and stakeholders.
Transportation KPIs are useful only if you review them regularly and make relevant adjustments. If metrics management is a time-intensive task, it will never get done. The right software removes the number-crunching aspect of metrics management and allows you to focus on the analysis.
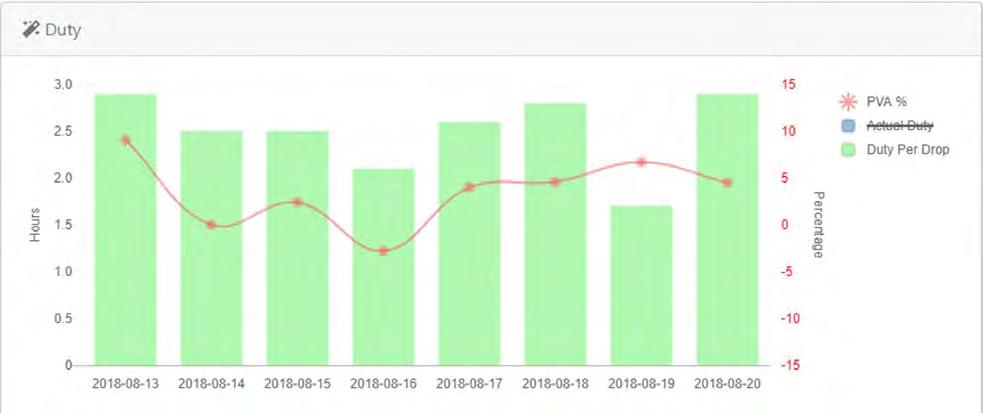
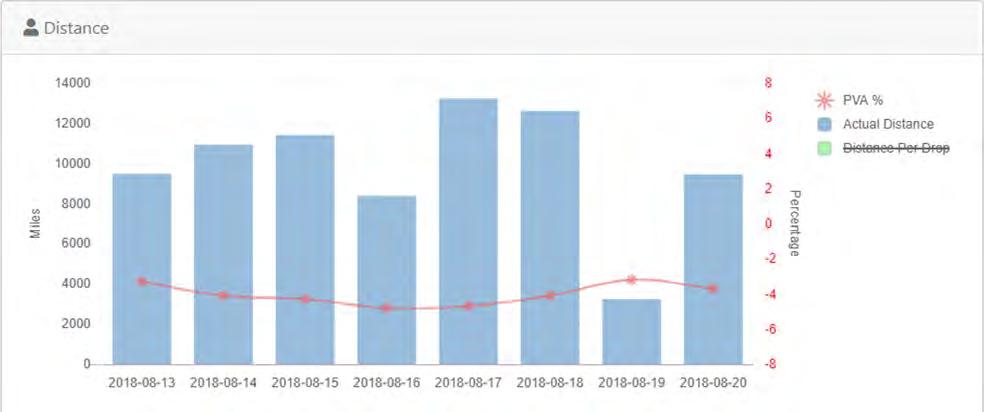
The screen capture below shows an overview of planned versus actual performance over a week within Aptean Route Execution Paragon Edition software. Similar views are available if you want to zero in on driver behavior, delivery performance or asset utilization. If you spot a disturbing trend or anomaly, you can drill down into the details within the software to explore potential root causes.
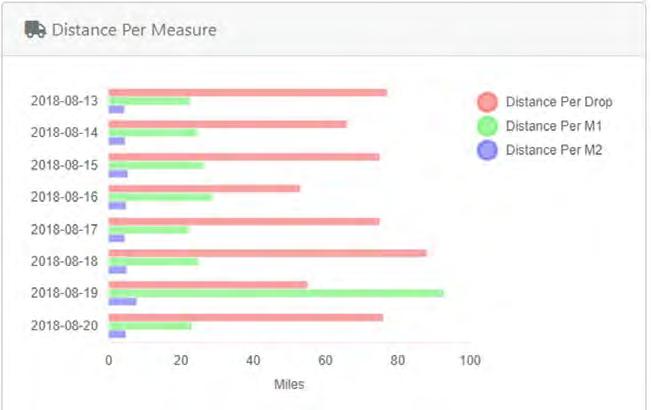
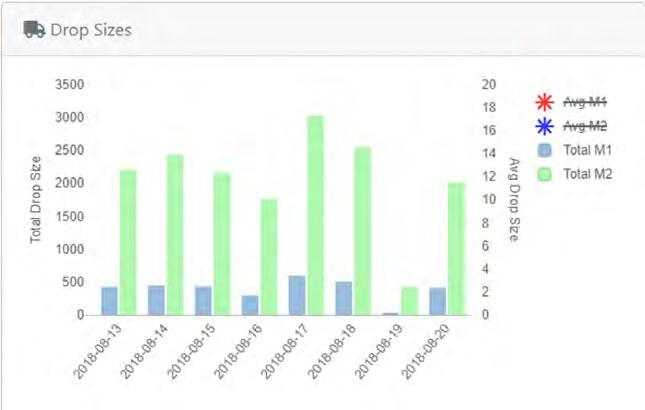
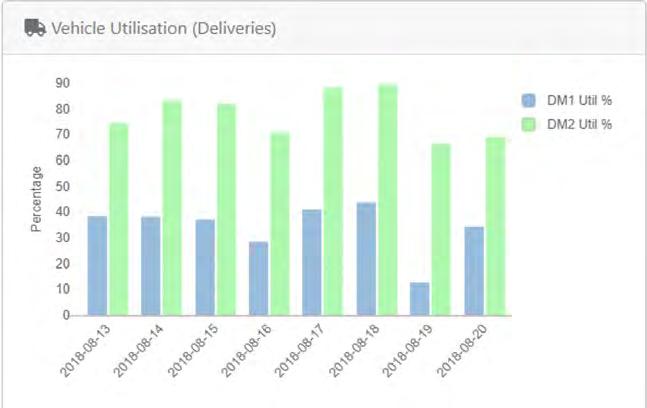
You measure performance to improve it. But if you don’t know your starting point, you can’t know if your numbers are moving in the right direction. It’s critical to establish a baseline for critical metrics so that this baseline allows you to powerfully demonstrate the positive impact of improved fleet performance on customer satisfaction and company profit over months and years.
Just because it can be measured doesn’t mean it should be. Determine the metrics that prioritize your organization’s strategic goals. It comes down to the basic fleet management discipline of PLAN–DO–REVIEW–ACT. You measure to improve, so measure only what you are prepared to act upon. Without action, KPIs are just numbers on a spreadsheet. Whether you’ve got 5 or 50 data points doesn’t matter as much as your commitment to improve continuously.

Your KPIs related to drivers and vehicles can and should be automatically collected by your ELD system and then fed into your routing software. In turn, this should offer pre-configured reports that present the data in ways that are easy to understand. Some software solutions let you custom-design your report templates – that’s especially useful for detailed analysis.
In addition to collecting safety-related metrics, consider posting Driver Safety Scorecards in break rooms and other common areas. This creates competition among drivers to stay near the top of the safe driver rankings and avoid being last on the list. You’ll find that this will influence behavior far more than a stern reprimand from the supervisor – especially if you offer rewards for excellent safety performance, like cash or extra time off.
Fleet operating costs are rising. At the same time, delivery service has become a critical competitive lever. The result is that distribution businesses are taking a much harder look at fleet operating performance. Your best response is to proactively shine a light on that performance – for the entire organization –with clear, objective data that demonstrates the profit-boosting potential of an efficiently run fleet. In doing so, you help management understand that, by investing in fleet optimization technology, they can generate savings that pay for the investment many times over.
The battleground for competitive advantage has shifted away from product features and cost to overall customer experience. For distribution companies, that customer experience is pretty much entirely about last-mile delivery performance. As a result, the final mile is getting far more attention than ever before.
Fleet managers who, for years, have managed this function in relative obscurity will emerge from the shadows and into the spotlight.
How prepared are you for this added level of scrutiny?
If your route planning and scheduling environment is still largely manual, and KPI management has not been a priority, the time to change is now.
Technology enables the shift to a more data-driven fleet operation, but that alone won’t solve the problem. What’s required is a vision for change and at least one person committed to making it happen.
Every difficult journey needs a hero, and you can be that catalyst for change.
The journey starts with numbers. It’s the language of business. It’s what your top executives understand. Start today by deciding what fleet metrics to measure and how.
We encourage you to use this ebook as a guide, as a resource, as a tool to help you on your journey.
Your fleet management KPI dashboard is your opportunity to align better with your company’s boardroom-level priorities and demonstrate, through data, the transformative power of a well-run fleet.
Aptean provides very specific industries with very specific ERP, supply chain management, and customer experience solutions. In today’s fast-paced, highly competitive economy, organizations don’t have time to waste forcing homegrown software, spreadsheets, and one-size-fits-all solutions to do things they were never designed to do. Aptean is on a mission to end those workarounds – with industry-specific solutions instead of generic software, expert support instead of making you go it alone, and a steady influx of new ideas instead of the status quo.
For more information, visit www.aptean.com.