
Sharon Friedberg & Hanna Krohberger
Chair of Architectural Informatics Technical University of fromMunich infrastructures of security to safe environments
Chair of Architectural
2 from infrastructures of security to safe environments
Informatics
Sharon
Prof. Dr.-Ing. Frank Petzold Critical Modeling Ivan Bratoev, Nick Förster, Frank Petzold Friedberg, Hanna Krohberger 03738860, 03740769
3 30221614100604 EthnographyResearchTopic Workshop Sensor PrototypeConceptPrototypingDevelopment Reflection and Outlook Table of Contents
4 Topic
Currently safety planning in the city equals taking care of security. Stakeholders involved with providing security at Sonnenstraße are the city of Munich, the KVR (Kreisverwaltungsreferat), the Police, the Münchner Verkehrsgesellschaft (MVG), and residing companies (retail, gastronomy, etc.). The way they approach providing security is through infrastructures, such as surveillance cameras, manpower (security services, police officers), lighting, and barriers. Through this, the focus lies on a concept called objective safety. With this concept safety/security is measured in numbers such as crime statistics, traffic accidents, or the chance of a truck breaking through barriers. But objective safety and how people perceive safety do not align (Schewe 2006).
With the rising digitalization in today’s urban planning diverse datasets, digital infrastructure, such as sensor networks, simulations, and city models become integral parts of the urban decision-making process. The line between the built environment and digital infrastructures is blurring, thereby prejudices in data, data gaps, and technical possibilities co-determine the shape of our cities because digital technologies are neither objective nor apolitical and transplant into the built environment. With the city of Munich developing a city 3D-Model we took a closer look at the topic of security and safety in Sonnenstraße.
Infrastructures implemented to create security are often perceived as ambivalent and can create feelings of unsafety (Gierke 2013). Further, research results show that spaces with the lowest crime statistics are not where people feel safest. The subjective perception of safety goes beyond fear of crime,
5 more so it includes disturbance caused by indirect impairments such as worrying about incidents (Schewe 2006).
Subjective safety is the main factor in the accessibility of public space. When talking about it, it is not an abstract factor but rather an individual necessity to go to places and take part in life. It is highly dependent on personal experiences but also influenced by intersubjective markers such as gender, age, health, or social class (Hane et al.). In literature, this understanding is called subjective safety.
Subjective safety falls under the concept of a “Wicked Problem” (Rittel and Webber 1973). Meaning, it cannot be solved linearly since the definition of the problem evolves as new possible solutions are coming up, it occurs in a social context and has a high diversity amongst actors. Ritchey (2013:2) says about them: „Pure study amounts to procrastination because little can be learned about a wicked problem by objective data gathering and analysis. Wicked problems demand an opportunity-driven approach; they require making decisions, doing experiments […], testing prototypes […].“. This leads us to our final approach: taking on reframing the conversation about what factors have to be considered in safety planning and prototyping a tool for informing, gathering information, and collaboratively shaping the city towards creating safer environments.
3D-Models can be divided into three types of city models. The first is a 3D mesh model, it is a realistic and very accurate model based on photogrammetry.
Data types are achitectural-, cadastral-, georeferenced application data, digital aerial photos, digital terrain models or georeferenced thematic data. All that data then goes into the virtual 3D-Model system. The architecture and principal components of that system can be seperated into the following five components. The 3D Editor which is responsible for modeling specific 3D
The second is a semantic 3D-Model, meaning that it is based on a simple geometry which is modeled in different levels of detail. The third one is a multi scale 3D-Model which seamlessly integrates data from different platforms and resolutions. This is the model necessary for smart city solutions (Spatial Source 2020). The data required for 3D-Models is diverse. Sources vary depending on the level of detail aimed for and can for example be photogrammetry and laser scanning, LIDAR/LADAR sensors or high resolution stereo cameras (HRSC).
There are different levels of detail (LoD) which are depending on the purpose the model is aiming for.
6
ResearchCity Scale 3D-Models
The initial research was conducted about City Scale 3D-Models, which essentially are digital three-dimensional models of an urban environment with all of its geometry of objects and structures. By embedding heterogenous geoinformation into one single framework they help create and manage complex urban information. They can be applied in various fields of application.
7 objects. It stands in exchange with the 3D City Model Authoring System which is responsible for creating, editing and versioning of the 3D city model and its components out of the existing data. Updates can be done manually, which is labour extensive and time consuming or they can happen in an automated way. There are different approaches to that automation but it is not yet solved. The authoring system has an interactive access to the 3D Geo-Databse System managing the virtual 3D city model and relying on the 3D Geo-Databse storing the model. Files generated from the Database are then fed into the 3D city model Presentation system targeted at media and users. It is the real-time visualization of and the interaction with the virtual 3D-Model. Other components fed by the database are the 3D City Model Geodata Services which provide access to geo databases to facilitate complex analysis tasks and find application in the indsutrial field (Döllner et al. Arising2007:108-109).outofthis„black box“ is the 3D-City-Model as an interface and tool for a wide range of uses. It can help with decision making, communication, urban planning and tackling political and economoic issues. For the latter it is required to have total data. The fields of application contain the integration of different departments, communication to citizens, sustainable land management, information (e.g. accessibility), simulation (e.g. traffic, environmental simulations, etc.), emergency response, visualization and analysis. The outcome of the model is dependant on the available and collected data as well as the modelling approach - the possibilities are seemingly limitless. Exemplary uses can be urban twins (like the one the city of Munich is aiming for in cooperation with Leipzig and Hamburg), sustainable land management, simulation (e.g. environmental simulations like wind, floods, seismic damage, heat, etc.), emergency response or visualization.
8 virtualreal DATA SOURCES photogrammetry and laser scanning LIDAR / LADAR syntheticHRSCSensors aperture radar mobile extrusionmappingfrom2D footprints architectural models and drawings development plans handheld proceduraltransactionswebvolunteereddevicesgeoinformationsitesmodeling DATA TYPES Architectural Data Cadastral GeorefencedDataApplication Data Digital Aerial Photo Digital Terrain GeoreferencedModelsThematic Data FIELDS OF APPLICATION integration of analysisvisualizationemergencysimulationinformationsustainablecommunicationdifferentlandresponseCHALLENGESCITY PROBLEMS AS A COMPLEXGOVERNMENT DECISION MAKING OPPORTUNITIES VIRTUAL 3D MODEL architecture and principal of a virtual 3d city PROJECT DEVELOPMENT 1. Analysis and design of requirements and per formance in relation to virtual 3D-City-Models 2. Search for cooperation partners (PPP, Out3.sourcing,...)Preparation of data as base for virtual 3D city models 3D EDITOR modeling of specific 3D MESH MODELS realistic + photogrammetryaccuratebased 3D CITY MODEL creating, editing and its components manually automated political effect ACTORS Government Citizens 3rd Parties Planners + Stakeholders Interface Object urban transformation urban transformation field of action base for
9APPLICATION different departments communication to citizens land responsemanagment MAKING COMMUNICATION URBANTOOLPLANNING TACKLING POLITICAL + ECONOMIC ISSUES MODEL SYSTEM principal components model system specific 3D objects 3D CITY MODEL PRESENTATION SYSTEM real-time visualization of and interaction with the virtual 3D city model 3D CITY MODEL GEODATA SERVICES access to geo database to retrieve and facilitate complex analysis tasks 3D GEO-DATABSE SYSTEM managing the virtual 3D city model MODELS accuratebased SEMANTIC 3D MODELS simple geometry I modeled in different levels of detail MULTI SCALE 3D seamless integration of data from different platforms and resolutions I necessary for smart city solutions 3D GEO-DATABSE storing the virtual 3D city model MODEL AUTHORING SYSTEM and versioning of the virtual 3D city model components out of the existing data manually - labor intensive + time consuming automated - different approaches, not yet reconstructionaccessibilityvisualizationaccessibleparticipationsolvedinformationofsunlight direction ... traffic environmentalconsumer simulations ... seismicwind damage floods heat relatable experience inductive analysis behavioral patterns consumer ...internationalbehaviourterrorism application in industry exchange accessinteractive generated files use 3D CITY MODEL Illustration based on Döllner et al. 2007:108-109
WorkshopEthnography
In the first approach the accessibility of public space was explored, more accurately the accessibility of toilets in the public space. We walked up and down the Sonnenstraße, asking at multiple restaurants, shops and cafes if we could use their restrooms.
Deriving from that little experiment we ended up with the conclusion that for public space to be accessible one has to feel safe in it. Therefore we started our second approach which was all about security and safety on the Sonnenstraße. We wanted to find out what impacts the feeling of safety and what the difference between safety and security is. We started by doing a sensing walk down the Sonnenstraße and taking geotagged photos of the spaces we felt unsafe in. For each photo we wrote down the reason for feeling unsafe. In the map shown on the right you can see that there are accumulatuions of spaces perceived as unsafe by us. Those are around the Sendlinger-Tor-Platz and the Stachus.
10
In addition to our own sensing we conducted literature research. Important parameters for creating a safe environment is the design of spaces. Different parameters influence the perception of safety, just to give a few examples the height of vegetation may obstruct visibility and thus cause a feeling of unsafety. So-called „natural surveillance“ and the concept of „eyes on the street“ can
11 increase safety since opportunities for positive interactions with others are more likely. Technology can have a positive impact on safety as well. This can be achieved by providing a steady mobile network coverage or through the use of apps for tracking or emergency contacting (Atkins 2021: 11). By creating infrastructures made for people and not only vehicles, a clear separation of different traffic participants and a focus on pedestrians - the safety of a space can be expanded. Another important aspect are cared for spaces. Meaning that walking through them one gets the feeling that someone is responsible and involved (Atkins 2021: 11-12). The topic of cared for spaces is likewise addressed by Oscar Newman, an american architect. He states „that physical characteristics play an important role, but ultimately only a subordinate one compared to socio-strucutral and socio-spatialIllustration based on Google Maps

The conclusion of the research was that there clearly is a safety paradox. This is because the subjective percpetion of safety does not correspond to the criminal activity rate. However, the security production of institutions nowadays works precisely on the data and statistics collected on crimes.
In his defensible space theory he expresses that there are three factors that have an influence on perceived safety. The first is territoriality, meaning that if a space is clearly seperated into private, semi-private and public spaces and associated areas of responsibility the perceived safety increases. The second aspect is the one of „natural surveillance“. It includes the built environment with buildings that are not too high, were not too many apartments are accessed via one entrance. Furthermore a good overview of public spaces and unrestricted view from windows and doors has to be given. The third aspect is the one of image and milieu. Newman states that the appearance and its‘ related perception impact the willingness of residents to practice social control over the space (Hahne et al. 2013: 35).
12 characteristics.“ (Hahne et al. 2013: 36). Newman hereby describes that care plays an important role in the perception of safety (ibid.).
13 all pictures from own source


The third and last version consisted out of three parts. In the first part we asked about general information like age and gender, what safety means to the respondent and how they use the Sonnenstraße. The second part (shown on the right) was about places of safety on the Sonnenstraße. Respondents could place a pin on a map at a place where they feel safe, afterwards they were asked why they feel safe at that place and at what time. The time was differentiated by daytime - when it is light - and nighttime - when it is dark. The third and last part (also shown on the right) was about places of unsafety. It was built up in a similar way as the one about safety. The first question was where respondents feel unsafe and requesting to place a pin at that place on the map. Then they should give reasoning for their feeling of unsafety and the answer at what time. The last question was how their feeling of safety could be improved at that spot of unsafety.
14
The survey was shared and interviews were conducted on site. The map on the right is showing some of the gathered findings. The derived information was the base for further actions and widened our understanding for safety in the study area of the Sonnenstraße.
To find out more about perceived safety on the Sonnenstraße we developed a survey, with the lime survey tool, designed for users of the space. There were three stages to the survey. After developing the first version and trying it out we realized that some changes in the structure and formulation of the questions had to be done. Trying out the second version we made some more changes, so that we would get more precise and useful information.
Sensor Prototyping
15 safeunsafecreated with lime survey


After looking into the actual issues the different aspects of perception where extracted out of the survey and literature research. Aspects that could be categorized into personal and spatial aspects were determined. The personal aspects are age, gender, experience and the knowledge of the space. On the spatial level predictability, visibility, liveliness and orientation are of importance. Furtermore the spatial factors play an important part of feelings of safety. They
DevelopmentConcept
With the information derived from the sensing walk, literature research and the survey different layers and aspects impacting personal feelings of safety were found.
16
The issue in the beginning of the process was the accessibility of public space, building on that a deeper look into the issue of safety in public spaces was taken. Since the two topics are strongly interconnected the conclusion was that one could not be analyzed without the other. Certain places of fear in the Sonnenstraße were figured out and different perspectives explored. Quickly a great difference between genders was discovered. The female perspective on safety is a totally different one than the male perspective. Furthermore safety is perceived differently by different groups. Based on that the decision was made that one of the aims should be to include as many perspectives as possible into the process and when taking part, sharing ones voice and opinion it should be particularly easy.
After determining all those influencing factors ways to measure and sense feelings of security were thought about. Things like nervousness and tension - measurable in heart frequency, the speed of walking, an increase in looking around and turning ones head, a change of posture or talking to someone on the phone, detectible in phone data came into mind. The suggested ways to collect that data were determined to not being very accessible to a large mass of users.
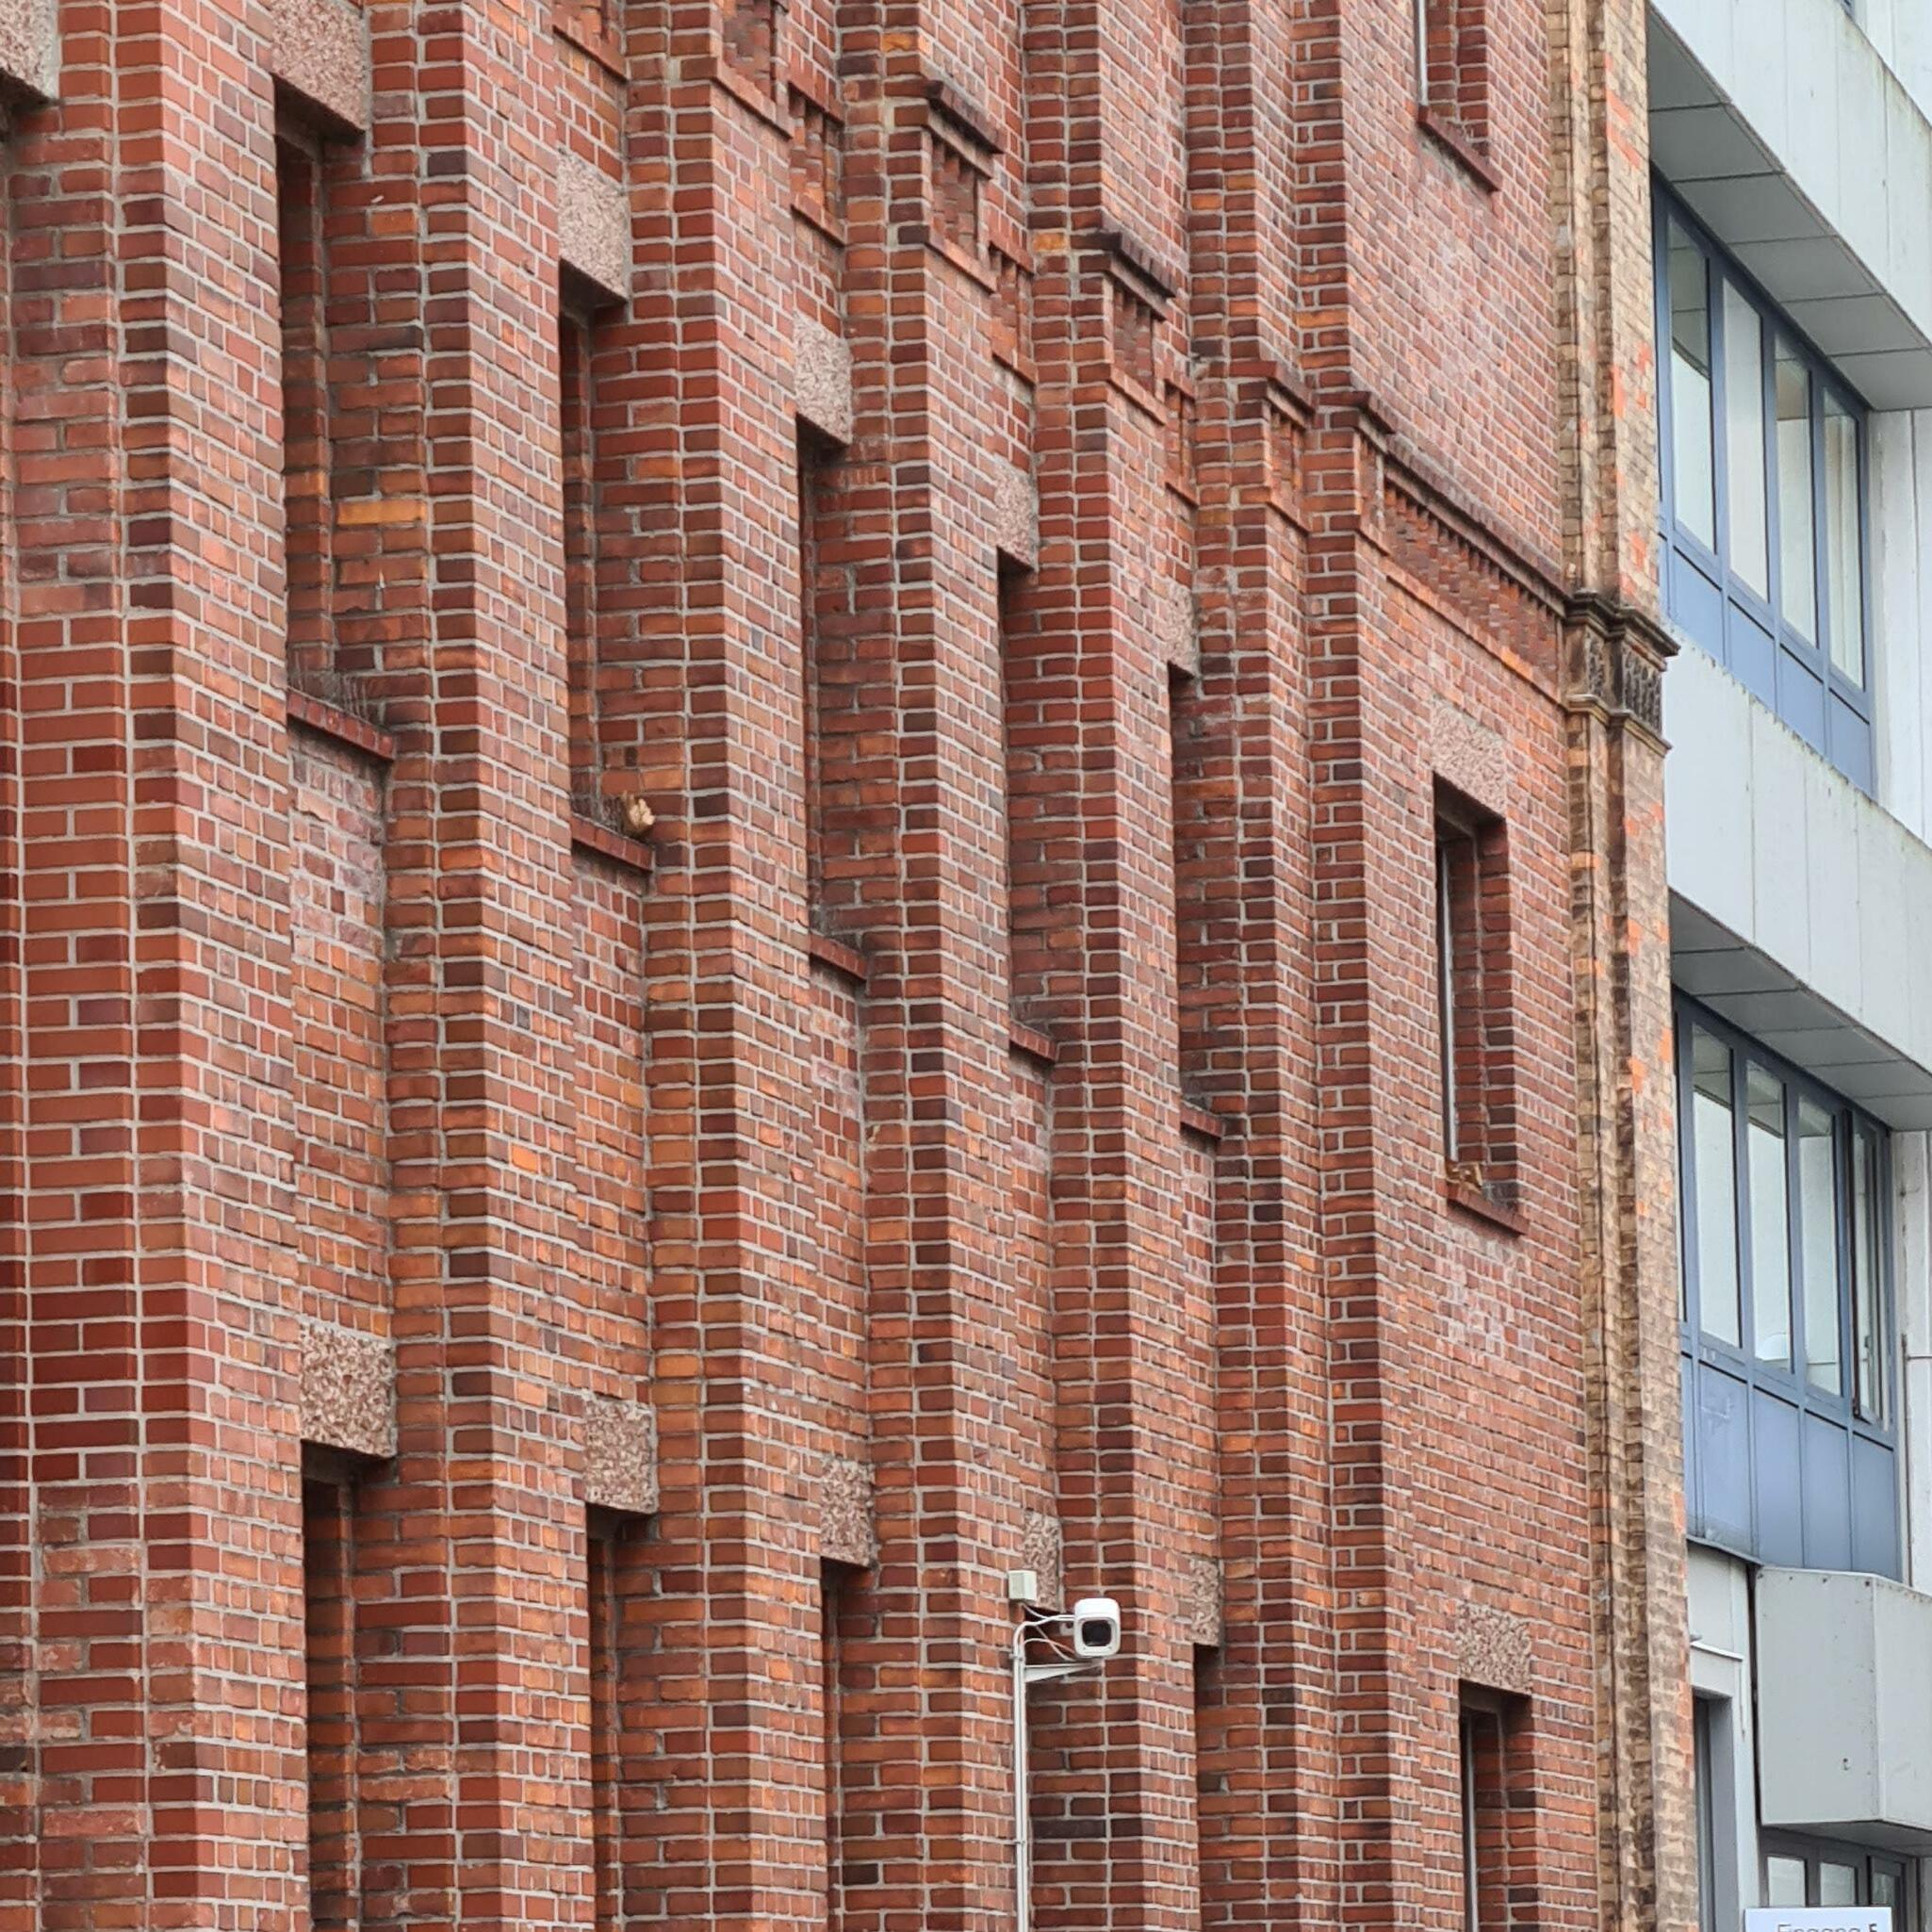
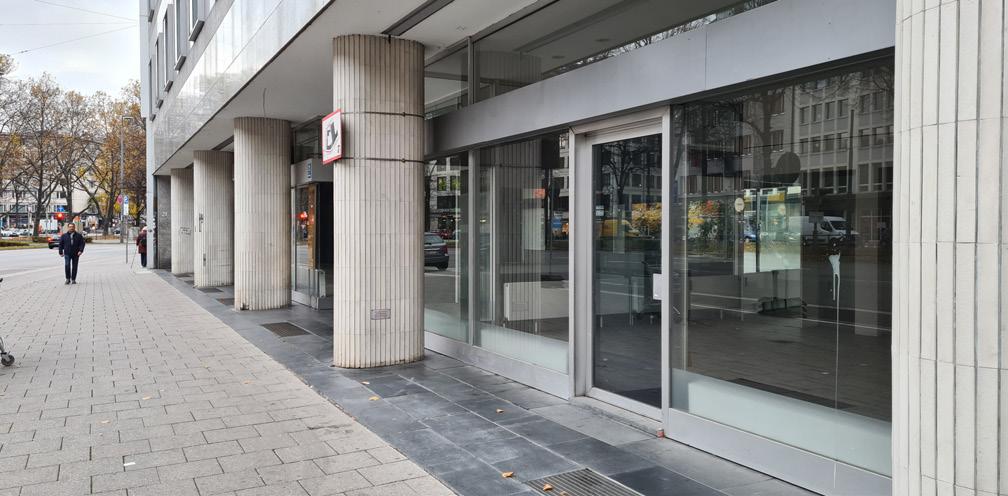
17 are differentiated by use and structural aspects. Use means audience, traffic, length of stay (e.g how long does one have to wait at a traffic light), opening hours, cleanliness, smell and time of day. The structural aspects include facade setbacks, lighting, barriers, construction sites and public transport with its infrastructures.
Based on those findings two storyboards were designed to put into concrete terms what the concept should be. The two stroyboards are shown on the following pages.
The Cities approaches towards Safety in the Sonnenstraße are driven by creating Infrastructures of Security.
>>Creating a Survey to map and classify places and reasons of unsafety (Place, Group and Reason, Real Time experience missing)
>> Mapping Infrastructures of Security But How do people feel?? People who feel unsafe will avoid to enter the Feelingstreet.sof unsafety are very subjective and limit the access to public spaces.
>>modeling the collected data about infrastructures of safety and the subjective Safety in the 3D Model. Using the Data from the surveys and reasons for feeling safe and unsafe we can further model infrastructures of safety The 3D model now shows how and wehre subjective Safety aligns or contradicts with planned Safety approaches and which technical and social infrastructures benefit the subjective safety of different groups.
The results can now be used as an additional layer in the 3D City Model to influence planning decisions and eventually create a higher accessibility for all people. People who feel unsafe will avoid to enter the street. Feelings of unsa fety are very subjective and limit the access to public Modelingspaces.the collected data of infrastruc tures of safety and the subjective safety in the 3D-Model. Using survey data and reasons for feeling safe/unsafe to further model infrastructures of safety. The 3D-Model now shows if subjective safety aligns or contradicts with planned safety approaches and which technical and so cial infrastructures benefit the subjective safety of different groups.
safetyofinfrastructures
>>modeling the colle infrastructures of safety Safety in the 3D Model. Using the Data from the for feeling safe and unsafe model infrastructures
The results can now be used as an additional layer in the 3D-CityModel to influence planning decisions and eventually create a hig her accessibility for all people.
The cities' approaches towards safety in the Sonnenstraße are dri ven by creating infrastructures of security. But how do people feel? Creating a survey to map and clas sify places and rea sons of unsafety (Place, group and reason, real time experience are missing)
InfraInfrastrstr
OR>> Creating a Sensing Devices where a push is an Impuls of safety to measure where people feel unsafe (Reason missing)
Infrastructures of safety (Reason missing) model infrastructures of safety. s anuencadditional e y create a on missing) onal map and classify unsafety (Place, Group rience missing) evices where a push measuremissing)where

>>cleanlinessRHinogeotagged Photo of trash USE Place, type- and period of use
care-o-meter
>> Area Photos -> remodeling entlightment in Rhino Urban furniture >> is it already there? otw. Geotag and insert in
Collecting Data about these factors through visibilityLight + Setbacks
Care-Care-O-meterSpaceswheretheneedsofpeo ple are met increase the accessibility to social Feelingparticipation.safeis a big issue of accessibility. "Cared for spaces" increase the subjective feeling of safety. Light, Urban furniture, cleanliness, type- and period of use (...)are factors of a space being cared for.
>> Time coded Google Maps Data, FNP Plan Inserting and remod Model shows time and Care-O-meter Concept of "care" comes out of literature and used factors are period of use Maps Data, FNP Plan >>2D Heatmap "care-o-meter" onnenstraße gets cts. s a new perspective on further city planning and decision making ors through eling entlightment in Rhino Geotag and insert in of use Data, FNP Plan Inserting and remodeling the Data into the 3D Model shows time and extent of "care" Using this data and colour-coding it creates a pattern of colour (care) and grey/black (non care) spaces. TIME DIFFERENTIATED >>3D Care non Care layer >>2D Heatmap "care-o-meter" a different perspective on sonnenstraße gets created, focusing on positive aspects. >> experience maybe in 3D VR? The tool can also be used as a new perspective on further city planning and decision making
Spaces where the needs of people are met increase the acces sibility to social particiFeelingpation. safe is an issue of Insertingaccessibility.and remodeling the data into the 3D-Model shows time and extent of „care“. Using the data and colour-coding to create a pattern of colour (care) and grey/black (noncare) spaces.
• 3D care/non-care layer • 2D Heatmap „care-ometer“ Care-o-meter app showing infrastructures of care. Can be used to navigate through the streets but also for in creasing attractivity as a shop owner or city. „Cared for spaces“ increase the subjective feeling of safety. Light, urban furniture, cleanliness, type- and period of use (...) are factors of a space being cared for. Collecting data about these factors through visibility, cleanliness and use.


The process of building that game is described in the next chapter. During the process of prototyping the concept changed and was phrased as follows:
In the next step we decided to follow the infrastrucutrues of safety storyboard.
We started with the mapping of surveilled areas, which are around the Stachus and the Sendlinger Tor. Other surveilled spaces are shops, banks, restaurants and entrance areas of some buildings. Since the law is that those private surveillance cameras are allowed to film one meter in front of the property they were also mapped. Besides that light posts located in the area were mapped as well. The data about traffic separation was included in the model provided by the city of Munich. All of that information was then transferred into a map. Due to a lack of knowledge of programs to help implement the concept we started by working on the different modules the prototype should contain. The initial thought was that in the end it would be an app. Users would open it and first see a word cloud connected to the survey. Each word would be connected to its reasoning. Users could then look into different spaces and see if others felt safe or unsafe there. They could take part in the survey and in another step register for a workshop were the collaborative making should happen. The workshop would have worked with an analogue 3D model and participants could have placed objects (e.g. made out of modelling clay). The aim would have been to find solutions together. Since the accessibility would not have been particularly low-threshold and the pandemic made personal interaction less attractive, there was a need for another solution.
That was when the unity workshop took place. It was the reason for choosing unity to build a game that essentially everyone could play in their browser with no need to download and install anything or to be at one spot at a certain time.
20
21
The prototype deals with the Sonnenstraße in Munich therefore the outcome of the process will always be site-specific. If transferred to other cultural contexts, cities, or even a different neighborhood in Munich, the result will be different but still mirroring and explaining the perceived safety in the space.Further we distanced ourselves from the idea of mapping places of perceived unsafety to prevent sitgmatization of places. Instead the focus was on showing a working model of aspects of safety and infrastructures to enhance the safety.
„The concepts aim is providing a tool for collaboratively creating safe environments in distinct spaces instead of relying on infrastructures of security and changing the planning conversation.“
Prototype
The final version of the prototype got developed in Unity. Unity is a runtime and development environment for games (game engine) from the eponymous company. The engine provides many built-in features to make a game work. That means things like physics, 3D rendering, and collision detection. Further, it is possible to write scripts via C# to create more complex outcomes or shorten the manual process. Before starting with the build, the different parts of the prototype were mapped out in a flow chart (as shown exemplarily on the right). The technical process was approached by first transferring the provided 3D-Model of the Sonnenstraße into Unity. Secondly, scoping the provided semantic data and taking out what was needed, thirdly transferring and remodeling the collected data from the self sensing, the survey and the on-street interview into the Unity 3D-Model and lastly building the interactions and user interface via UI and C# in Unity.
Transferring the data
The provided 3D-Model included the semantics of buildings, information on street markings, traffic separation, trees, street signs and other information. The relevant data was then exported from Rhino as dfx, fbx and obj files and imported into Unity. Information about use, areas of surveillance or the positions of streets lights were first drawn in Rhino, exported and then imported into Unity as well. The colours were then assigned to the objects
22
23

24 with the help of various shaders. Trees and their respective positions should have been entered into Unity as a JSON file and then read out and positioned with the help of a C# script. But since this did not work out, the trees were positioned individually.
At first the street markings and traffic separation could not be made visible in unity. In Rhino the simple lines provided in the 3D-Model were extruded and exporting them in various data formats was tried, but none of them worked properly. In the end the problem could be solved by using a double sided shader, giving both directions of the extrusions a colour and therefore their visibility.
Through a workshop we got to know the basic functions of the program and taught ourselves the rest via tutorials. Therefore, it is to say that technical solutions used in the beginning of the prototyping process are simpler, whilst they get more complex the longer the learning process was. After the merging of information into the Unity 3D-Model this part was created to exhibit what the user can see and do. After introducing the project to the user, the Player Information Interface collects data about the participant. This is important to trace a person and their perceived safety through the prototype, but more so to show the reasoning behind individual answers and perceptions. This part got implemented via UI elements and C# Script to store and insert the input text later.
The first scene shows the overview of the model "Sonnenstraße" by creating a "planning view" via a movable, rotatable, and zoomable camera pointing
Interaction and User Interface
25 towards a camera rig (C#). The selected view helps the understanding of the space. At the bottom right corner, the menu shows the current state of the model and its' layers divided into safety and security. Through the division, the difference gets pointed out and the topics defining the space become visible. Using the buttons which activate/deactivate game objects the layers can be viewed together. A discussion box is linked to each layer and shows the collected data to the topics. Participants can see the ambiguity of infrastructures and the reasoning and also leave their comments. If there is a missing aspect affecting the users sense of safety, they can request it via the "add safety layer", as well as leave a vote for new layers others suggested. This function got implemented by voicing a request towards the

26 data owners rather than immediately creating a new one, since the data is not available yet in the model and might not even be collected. For example, the use of buildings was a layer that was added after the research, but a 3D plan showing the use of buildings was non-existent, and had to be mapped.
The second scene (see page 28) changes the perspective from the planning view into the personal experience. The user walks through the scene as a player. It is important to note that the level of detail displayed in this scene is not aimed for but set by the provided data. With a higher level of detail, e.g. signages and images, the orientation for the user and thereby projecting experiences would be easier. To still provide a sense of place, the minimap

27 in the top right corner, implemented via 2nd camera, shows the position of the player, and the uses simulate more detail of the streetscape. Following a collaborative planning approach, each user can change the space by placing improvements and voicing issues. A C# Script button triggers the instantiation of a prefab. Thereby objects are placeable and one can leave comments to them. If issues or ideas are not existing yet, users can create a new boxand button prefab, which will also be accessible to others. Newly created issues and boxes will afterwards be fed back into the requested layers of safety, discovering new aspects relevant for safe environments and giving an overview of important objects and infrastructures.

28
Eventually, the findings can be used by planners and private entities. On the one hand, if private owners want a more customer-friendly environment the tool can help them with decision-making and lead to the implementation of a safer space. And on the other hand, the collected data and its process become visible, marking a change in the formerly security-driven conversation about safety.

29
Coming from an urbanism background the process of the project was more open than what we are used to. This gave us the opportunity and difficulty, to find a topic we thought of as puzzling and important also from an urban planning perspective.
Like every project and its' resulting tools there are some critical points. In the case of the developed game one could argue that accessibility could be problematic. How should users be made aware of the tool? But like with every new intervention planned by the government, institutions or individuals, communication is key. There could be posters put up or an initiating event could kick off a new kind of participation. Another aspect is how the game is supposed to deal with discriminating content. One solution could be to involve a moderator and set up usage rules.
Reflecting on the process and the used tools, such as the workshops, taught us a lot about what is possible and how one might start. Before starting on the project, the topic of the digital city always seemed abstract to us. Having the chance to try technical approaches firsthand, rather than just getting provided with information was very insightful. We always were provided with finished models, using results and user interfaces of provided data, never producing the data ourselves. Taking part in the course led to a deeper understanding of how models are generated and what alternative ways exist to gather information and display them in an engaging way.
Reflection and Outlook
30
31 Finally we invite you to watch the video of our prototype for getting a better idea of our critical modeling project. Thank you for reading, best SharonregardsFriedberg & Hanna Krohberger

32 Contact Sharon M.03738860FriedbergSc.Urbanistik, 3rd semester Hanna M.03740769KrohbergerSc.Urbanistik,3rd semester

33
34 Sources Atkins, SNC-Lavalin GRoup (2021). Getting home safely. Safe by Design by Women Transport Döllner,Planners.J., Baumann, K., & Buchholz, H. (2007). Virtual 3D City Models as Foundation of Complex Urban Information Spaces. Retrieved from: https://www.corp.at/archive/CORP2006_ DOELLNER.pdf (last accessed: 01.03.2022) Gierke, S. (2013). Wie Kameras unser Verhalten verändern. Retrieved from: Ritchey,urbanenHahneveraendern-1.1735946www.sueddeutsche.de/bayern/videoueberwachung-wie-kameras-unser-verhalten-https://(lastaccessed:27.02.2022).M.,L.Hempel,R.Pelzer(2020).(Un-)SicherheitsgefühleundsubjektiveSicherheitimRaum.LandeskommissionBerlingegenGewalt:Berlin.T(2013).WickedProblems*-ModellingSocialMesseswithMorphologicalAnalysis. Retrieved from: Wicked_Problems_Modelling_Social_Messes_with_Morphological_Analysis/https://www.researchgate.net/profile/Tom-Ritchey/publication/236885171_
block-for-digital-twins/RetrievedSpatialSchewe,No.Rittel,Morphological-Analysis.pdflinks/00463519e5f08e672a000000/Wicked-Problems-Modelling-Social-Messes-with-(lastaccessed:27.02.2022).H.,M.Webber(1973).DilemmasinaGeneralTheoryofPlanning.PolicySciences.Vol.4,2.Springer:Berlin.C.(2006).SubjektivesSicherheitsgefühl.SpringerProfessional:Berlin.Source(2020).3DCitymodels:thefundamentalbuildingblockfordigitaltwins.fromhttps://www.spatialsource.com.au/3d-city-models-the-fundamental-building-(lastaccessed:28.02.2022).
35