
Chair of Architectural Informatics Department of Architecture Technical University of Munich
ResiliMucTheUrbanResilienceDashboard
Caspar Kleiner

Prof. Dr.-Ing. Frank Petzold Urban Bratoev and Nick Förster
Caspar August03673815Kleiner2021
Data Ivan
2 The ResiliMuc Documentation of the Semester Project Chair of Architectural Informatics
Big
3 3938353434302622181814108664 Data-ConceptIdeationExplorationIntroductionResilienceComplexSystemRetrieval,Processing and Assessment Climate Indicator Mobility Indicator Social Indicator Application Prototype and Implementation Discussion and ContactReferencesQuantativeResilienceOutlookMethodology Table of Contents
Stadtbezirk:K=Kelvinkm=kilometresm=metresGerman administrative level 9 “urban district“ Stadtbezirksteil: German administrative level 10/11 “borrough/neighbourhood“
This documentation is the product of the semester project “Big Urban Data“ at the chair of Architectural Informatics at Technical University of Munich. The work has been done by Caspar Kleiner.
The documentation concludes with lessons learned from this project in the discussion chapter. Special thanks to Anna Laura Kamm for innumerable discussions on urban resilience, and of course to Ivan Bratoev and Nick Förster for their critical and productive feedback as well as technical assistance. Thank you also to everyone else who followed this process for your insights, opinions and your support.
4
The chapter exploration gives a general insight into the main terms and positions, the chapters ideation and concept into the project’s idea and approaches. Following, a technical explanation and the presentation of the prototype.
Introduction
Used units and abbreviations:
The product of the project is an urban resilience platform that is targeted at planners and stakeholders in the planning process to identify neighbourhoods’ specific resilience potential, their weaknesses and difficulties. The objective of the platform is to enable planners to allocate interventions efficiently and precisely. For this, climate, mobility and social indicators are used and the results are visualised on the platform.
Resilience can be interpreted in many ways. In general, it refers to the capacity of a system to withstand stressors. An examination of different references has revealed that it can be understood in three main different ways: resilience as robustness, resilience as recovery, and resilience as Theadaptation.termbeing worked with for the project work is “adaptive resilience”, that means the ability of a system to not only withstand a threat but also overcome into an improved state. However, it is difficult to quantify resilience. Whether a system is resilient or not can only be evaluated by having it undergo a stressor and see how and to which degree it compensated the problems. In doing so, the focus of resilience shifts towards the threat being evaluated itself rather than the system’s ability to withstand stressors in general.
Meerow et al. Defining2016:urban resilience:A reviewmultiple 50% risks
(Dieleman climate change 2013)
specific 50% threat
Resilience MeaningResistanceRobustnessPersitanceRecoveryReorganisationTransformationMitigation, Absorption, Adaptation dependencieshomogenous, hierarchicalHeterogenity and ResilienceSystem argumentationsimple linear/monofunctionalinterconnected/complex dependencies ExplorationResilience.
6 ecosystem resilience (Holling 1973) (Andersson ecological urban resilience 2006)social-ecological systems (Leichenko 2011;Pelling 2003)economic recovery (Pendallet al.2010)


If a system is tested for a specific threat, the result is also always a reflection for this specific threat. The message a planner could take home would be how to make the system or urban environment strong towards this specific threat. Thus, it is important to understand resilience as a generic property of a system rather than an ability in regard to a specific threat. For this reason, the projects focus is on resilience potential rather than trying to measure resilience itself. Another dimension is the degree of severity of the stressor and much more importantly also the perceived severity. A growing lack of supply reliability for example can pose a much greater risk than a more immediate threat like a weather disruption. However, the focus of discussions lays heavier on surprising disruptions. The threat of a slowly changing condition can pressure the city even more, if the elements are too dependent on specific parts. This leads to the second exploration.
m50%ultiplerisks
resistance, persistence, recovery, transition, mitigation, transformation, adaptation, absorption, reorganization (Fu, Wang 2018) primarilylinkedto
7 argumentationSystem
ecosystemresilience(Holling1973)ecologicalurbanresilience(Andersson2006)
social ecological systems 2(Leichenko011;Pelling2003) (economicrecoveryPendalletal.2010) climatechange (Dieleman2013)
Meerow et al 2016: Defining urban resilience: A review 50% specificthreat
Resiliencemeaning


ecosystem resilience (Holling 1973) (Andersson ecological urban resilience 2006)social-ecological systems (Leichenko 2011;Pelling 2003)economic recovery (Pendallet al.2010)(Dieleman climate change 2013)
8
specific 50% threat dependencieshomogenous, hierarchicalHeterogenity and ResilienceSystem argumentationsimple linear/monofunctionalinterconnected/complex dependencies
Complex System. Another critical approach is the understanding of the city as a complex system. As such the elements of the system function in complex interrelations and dependencies that are not directly visible. In case of a failure of one element, the functions can be bypassed, replaced by another element, or Opposedremoved. to other systems like hierarchical or linear systems, complex systems can compensate more stressors at once without collapsing as a whole. In a linear system, if one element fails all the subsequent elements fail as well and become useless.
Meerow et al. Defining2016:urban resilience:A review


9
The idea is to give urban planners a basis for their ideas and to help them decide what places need what kind of attention. Resilience is seen as an unanimously desired condition for a city and heterogeneity as a key to achieve a higher potential.
For this, the concept foresees an information-based platform that planners can use as a tool to get a loose overview as well as to develop an argumentation for specific interventions in the neighbourhoods. The dashboard design is thus aimed at planners to know what kind of weaknesses exist and what deficits they have to adress and to give an understanding of what elements pose vulnerabilities. Furthermore, the platform aims to prevent planning misallocations and errors.
The conception condemns a misallocation of measures and interventions that are aimed at strengthening climate, social and mobility resilience towards places that have already received a lot of attention. This misallocation seems to privilege places and neighbourhoods that have a higher visibility and that have already received planning efforts. Places that have not received as much attention could benefit from fewer and smaller interventions and improve their resilience potential more effectively and efficiently. Moreover, the criticism is in the high cost of interventions in places that already have a high resilience potential over places that could advance at a lower cost and thereby improving the overall resilience potential of the whole city.
Ideation
10
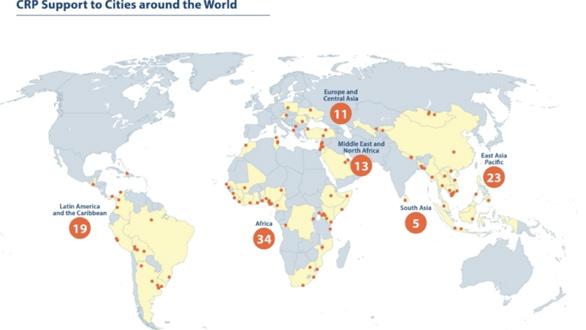
11 For these reasons, the concept not only aims to present the information and scoring in a precise and concise way but also to narrate how the scorings are developed. This is to give the planners the ability to better assess the information value for their specific projects. A comparison of existing indices has revealed that many indicators exist, but few incorporate the element of also including the methodology for putting the index into perspective. Furthermore, many indices are aimed at specific threats like climate change or flooding rather than interpreting resilience as a property of a system. On the following page, the concept is pictured in a short storyboard. comparable indices Arup FrameworkResilience City Fraunhofer:CaesarGFDRR+World bank:City Resilience Program NIST MethodologyCommunity (US): Resilience www.nist.gov Development of a FirstGeneration Community Resilience MethodologyAssessment Community resilience is a complex, multi-dimensional problem that relies on engineering, social sciences, earth sciences, and other disciplines to improve the way communities prepare for, resist, respond to, and recover from disruptive events, whether t… CityUNHabitat: Profiling Resilience Tool Collection of Comparable Indices


12 Cars are a humanurbanright!farming on roofsRatzingerplatz is the mostmorepressingbikepaths! What about the kids? We need a multi-scholar deep adaptation approach. Well, it breaks down to identifying the places with high mobility, low number of services and high amount of sealed surfaces! Sounds smart, but how do we find out what places need extra attention and which ones will probably be fine? ! ! ! ! Mobility behaviour analysissurfacesealed Density servicesof indicatorssocio-demographic 1. Ideas on how to shape the resilient city of to morrow exist in plentiful variety and are contradic tory at times. 2. The implemented ideas are promising. Howev er, they are costly and often times focus big scale adaptation and trends. 4. A number of different data points can help identifying places that need attention. 5. The interface points out the most urging places.
13 Places with mixed uses and high heterogenity tend to adapt easier to crises and stressors. Identifying homogenous and single-use places can help augmenting urban resilience by implementing site-specific interventions! You were right, Ratzingerplatz is the most urgent! told you so! Scenario 1: Urban Resilience Potential Mapping 3. Places with high diversity tend to have a higher potential for resilience. Identifying and reinforcing places with lower potential is more efficient and effective.6.Andsuggest potential interventions that can improve the resilience potential of these sites. Concept Scenario Storyboard
The concept is an urban resilience dashboard that helps planners to improve the resilience potential of neighbourhoods and the city. Based on the research introduction, the city is a complex system that functions with a heterogenous selection of different elements. In case of a threat or disruption parts of this system can fail or not function properly. The resilience potential of the city lays in its ability to replace or overcome these misfunctioning elements of the system. This can be in the form of abandoning, replacing, or improving the element. Such elements can be built structures in the city, technical infrastructure but also social infrastructures.
subcategoriesresilience urban Ecological resilience
resilienceclimate food suply resilienceresilienceSocial infrastructureemergency
wellbeinghealth and Possible Resilience Subcategories
14 Concept
resiliencemobility
If an element of the system that is part of the built environment fails, its function does not have to be improved or replaced by another part of the built environment but can also be improved or substituted by a social part. For example, in a case of flooding, the lack of flooding gates can be replaced by a community’s effort to collaborate and overcome the situation. However, it is difficult to measure this willingness to participate in case of a disruption. It breaks down to a feeling of belonging and identification with the neighbourhood. For this reason, it is important to use indicators of the built environment as well as social indicators. The proof of concept aims to quantify the potential for urban resilience with the help of three subcategories: a climate index, a mobility index, and a social index. The concept would include more indicators for the subcategories in order to make a stronger comparison between the


15 individual neighbourhoods. Strengthening one of the elements, strengthens the whole. On the next page the technical implementation concept is outlined. It can be read either from the left or from the right. From the left it shows the way in which data is being processed and how the findings are applied and visualised in the concept prototype. From the other side, it shows the user interaction with the platform. The three main aspects of the platform are presented, and it is shown how they relate with one another. On the following pages, the technical process for the data processing is shown in detail. For the proof of concept one indicator for each one of the three subcategories climate, mobility and social is selected and worked on. subcategoriesresilience urban resilienceresilienceresilienceclimate mobility Social heat helps me understand what data types are valuable accessibilitywaterbiodiversitypublic transport traffic flowwalkabilityfood and supplyinstitutions and emergency infrastructurerentorpublic health surface/amount sealed ofgreenery geospatial image analysis Information infrastructure, on surface informationgeospatial #measurement information #index analysis Geoinformation Bus/Tram/Train stops informationgeospatial Informationcongestion on (individual mobility) congestion google traffic api #measurement google traffic route traffic informationdata Geoinformation Bus/Tram/Train stops informationgeospatial police/hospituniversity/school/Gymal/firestation informationgeospatial Mietenspiegel #information onqmpricesmapping Chosen Resilience subcategories, possible indicators and data types


16 INDIVIDUAL SHEET PROCESS, REPEATABLE MAP DEVELOPER MODE / RAW DATA PROCESSING Chat RoomHelp interactive Trend Analysis Environmental Data Heat Watertemporal)(geospatial, (geospatial)imagedata Biodiversity Heterogenisation Geospatial Image Analysis + MobilityClimateScoringScoringSocialScoring+ Mobility Data Time(GoogleAccessibility (geospatial)TrafficFlowAPI)toWalk Walkability Google API walking distance Social Data socialInfrastructure (geospatial)Supply(geospatial)indicator Social diversity Social Statistics (DeStatis or sim.) ClimateScoring //VISUALISATION:MobilityScoring
17 Dashboard User Login Map View interactive visualisation Legendinteractionuser processingdata retrieval SheetResilience Index ResiliencesStatistic ScoringSocial + User Neighbourhood NeighbourhoodInterestMoreFeaturesSheets //VISUALISATION: Python/Dash Plotly; Unity/C# User Interaction //PROCESSING: Custom C#-Script, User Interaction //INTERACTION: Custom C#-Script Concept Implementation Flowchart
For the proof of concept, only the month July for each year was used and all the hourly values for each position were averaged. The values for the
18
Data- Retrieval, Processing and Assessment Data Retrieval.
Climate Indicator
The Climate Indicator is based on data retrieved through European Space Agency Copernicus Open Data Programme. The Data is based on a study conducted by VITO(2019) and offers climate information on 100 European cities. The information includes above ground air temperature, wind speeds, specific and relative humidity, as well as basic information on land cover (rural-urban and land-sea). For the proof of concept, only the ground air temperature has been requested. The retrieved data consists of data points on a 100mx100m grid surrounding 30kmx30km Munich and the immediate proximity (301x301 data points). These climate data points come at an hourly frequency. The retrieved files came in the NC-format, one file for each month 2008 through 2017. This results in 301x301=90601 data points that provide a value for each hour; over 60 million data points for each month. Thus, this database rightfully deserves the term ‘big data’. Processing.
For proceeding with the database and working with the other indicators, the years were shifted to 2020; the 2017 data was used for 2020, 2016 data for 2018 etc. A conversion of the files to Excel-tables resulted in a split of the dataset into four separate files: one for the climate information in Kelvin, one for the time information, and one each for the data points’ latitude and longitude. This meant that the values’ location information was stored in different files in the same place, i.e. the A1 value in the climate information belongs to the A1 longitude information and A1 latitude information.
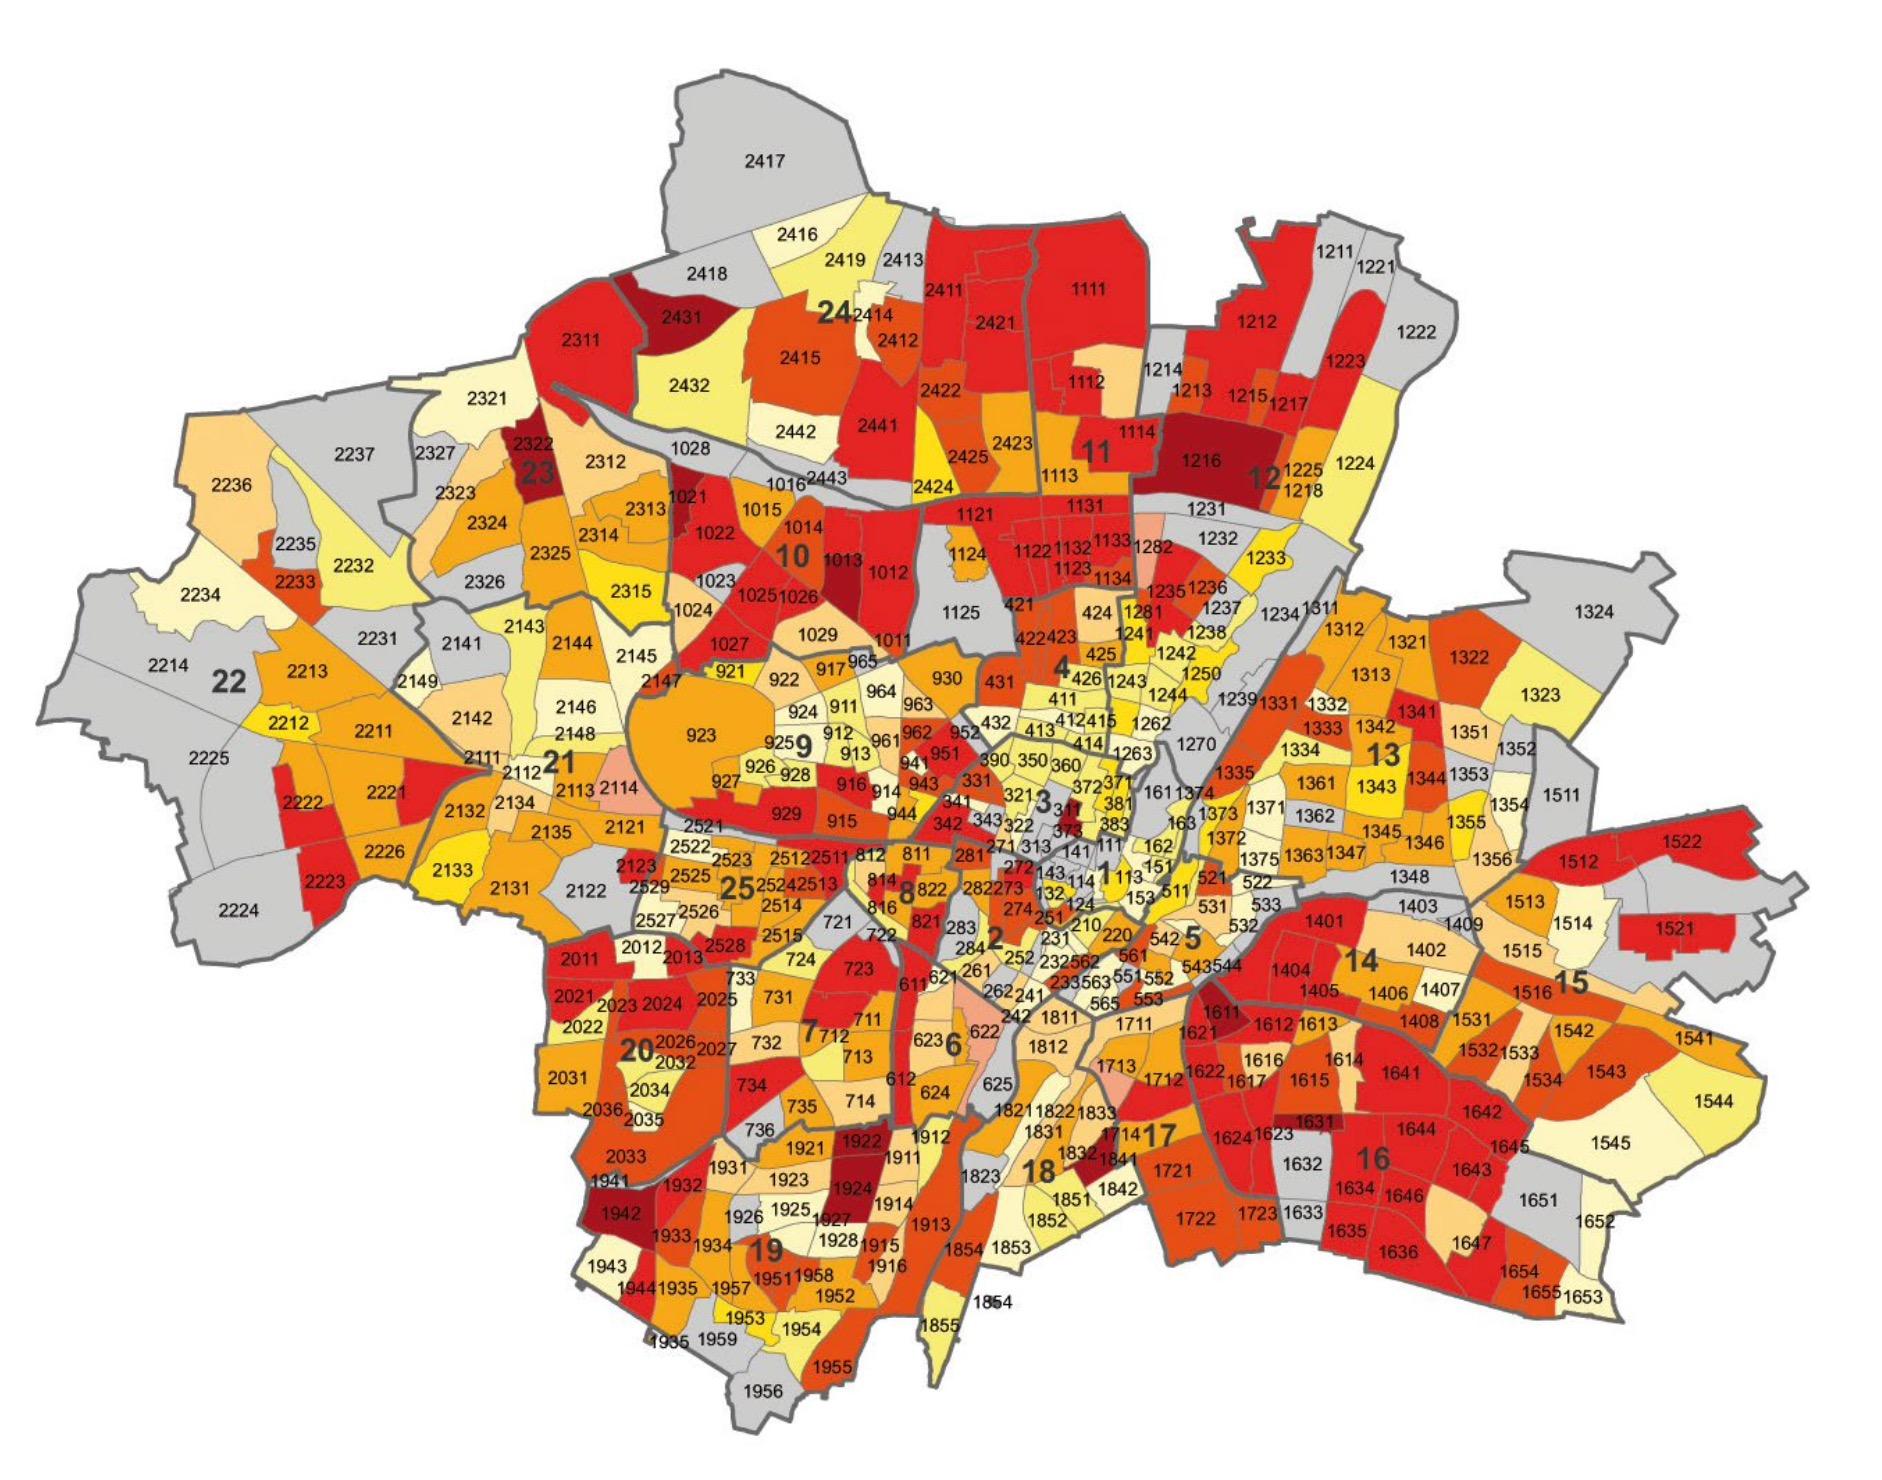
19 years 2011-2020 were then put into a new table reconnecting them to their longitude and latitude information. Finally, the resulted table was converted to the JSON-format for further processing resulting in a file with geolocated points with their climate averages in their properties. Assessment. The Data is finally evaluated in a Grasshopper Script. The process can be divided into four steps that will be explained on the next pages: Mapping of the climate grid, mapping of the individual areas/Stadtbezirksteile, selection of the relevant points and comparison of the values to the values in Perlacher Forst, south of Munich (close to the geographical center of Munich, without Urban Heat disturbance).
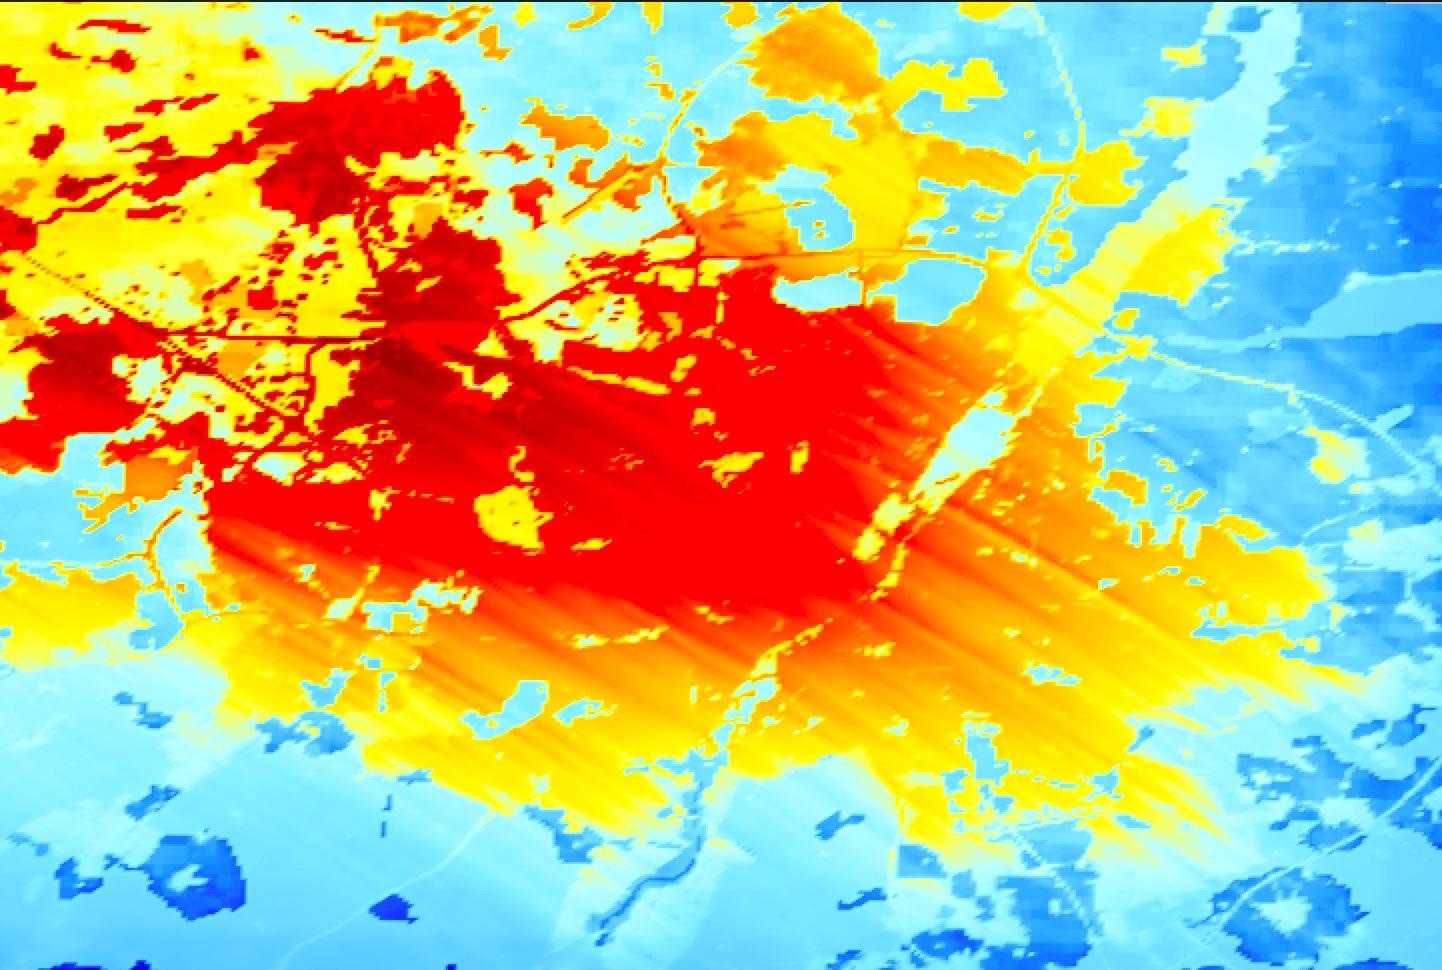
Visualisation of the dataset using Panoply(NASA)
20
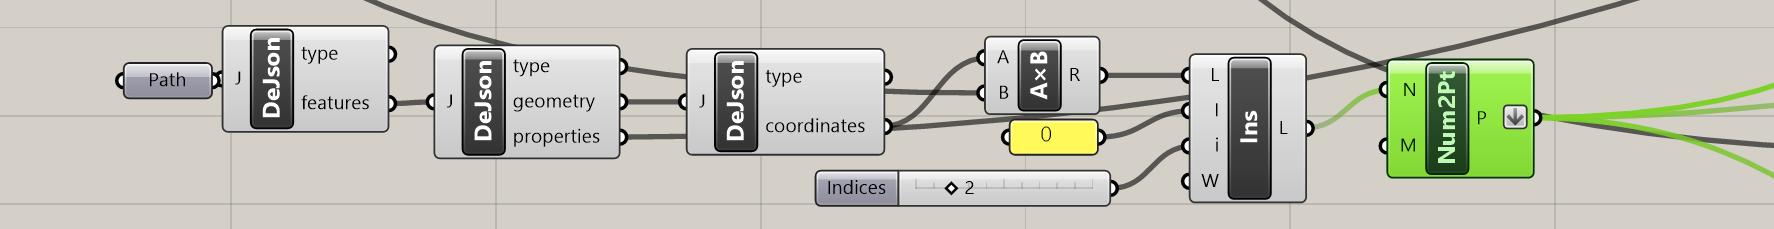
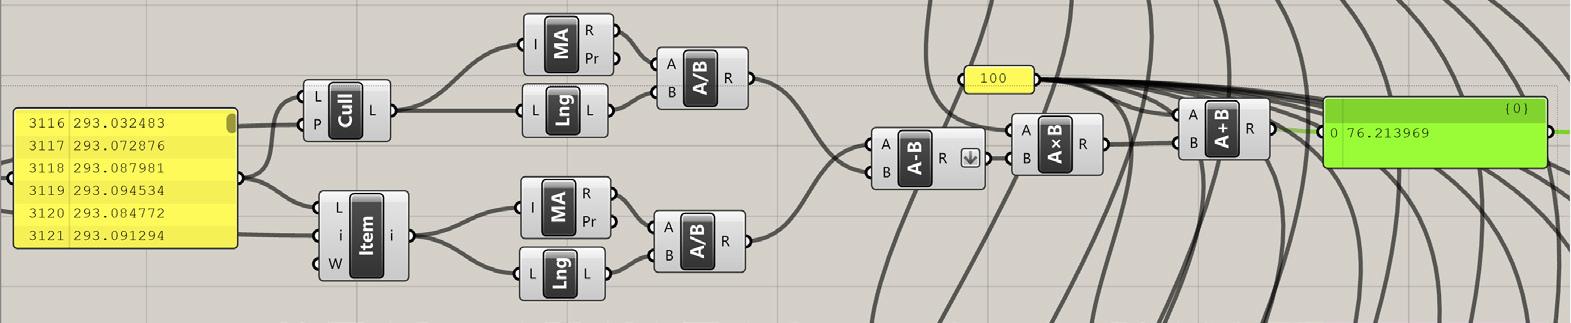
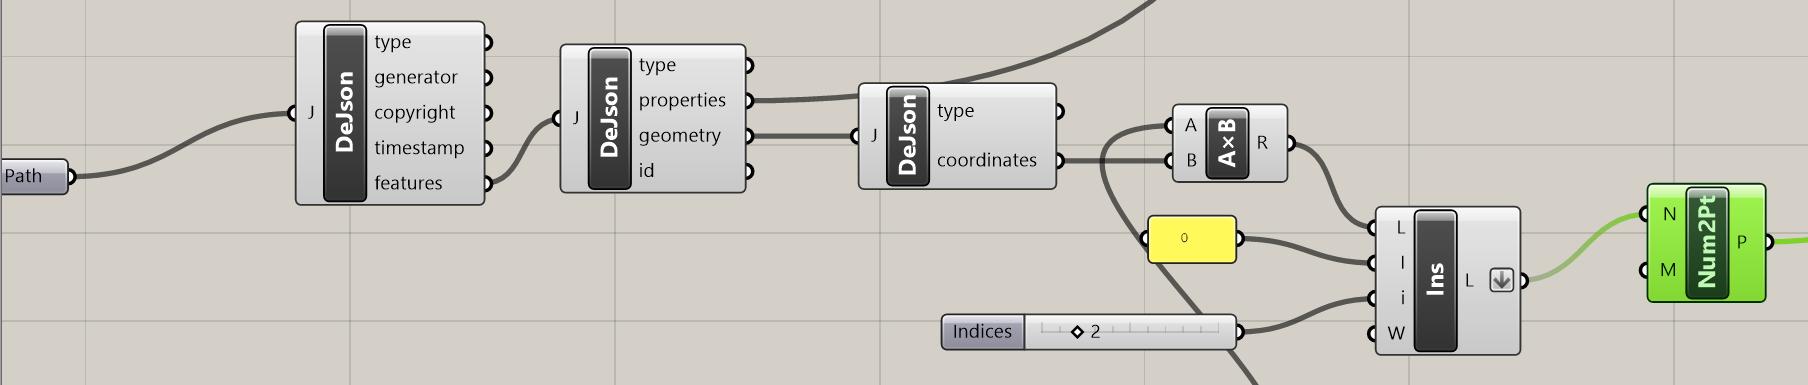
1. Mapping of the Climate-Grid The JSON-file with all the data points is accessed using the jSwan-Plugin DeJSON. In the file’s tree structure, the information for all geolocations is being accessed (coordinates), the AxB function scales the values times 100, so the geometries do not become too small for Grasshopper. Next, the INS-function adds a z-coordinate (0) to the values, so that the Num2PT function can recreate the climate grid in a three dimensional space.
2. Mapping of Stadtbezirksteile In a similar way, the information for each individual area/Stadtbezirksteil of Munich are being imported, scaled, z-coordinate added, points generated and the points connected to a Polyline. The files for the Stadtbezirksteile derive from OpenstreetMap. The Data Retrieval and Processing are explained with the Mobility Index. Rhino View Rhino View Grasshopper View Grasshopper View

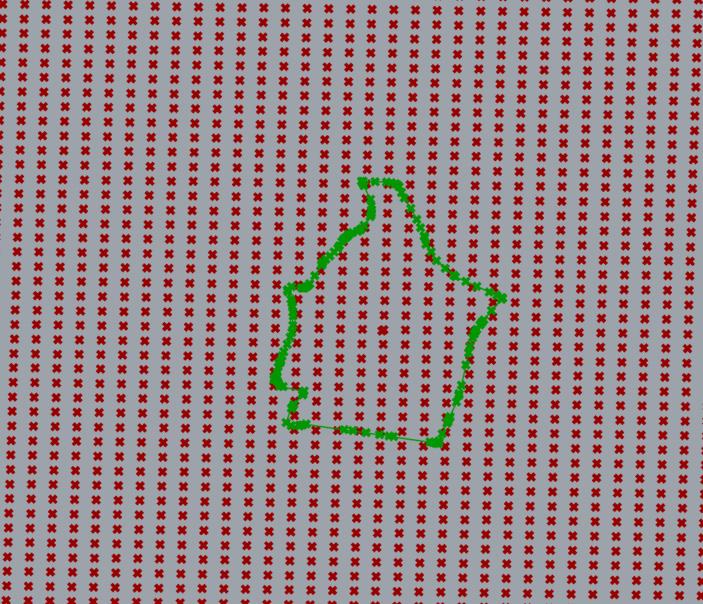
213+4. Selection and Comparison The values for the points within the Bezirk are selected. Simultaneously, the values for the compared area in Perlacher Forst are selected. With the MassAddition, ListLength and Division functions, the average values for both areas are being generated.
Finally, the percentual deviation of the individual Stadtbezirke is calculated. This process is executed simulatenously for all the analysed years. This process is performed for all the individual Stadtbezirksteile and the generated values for all the files were saved to an individual Excel-Spreadsheet for the implementation prototype.RhinoView Grasshopper View
Full Grasshoppper Process available: here.
22
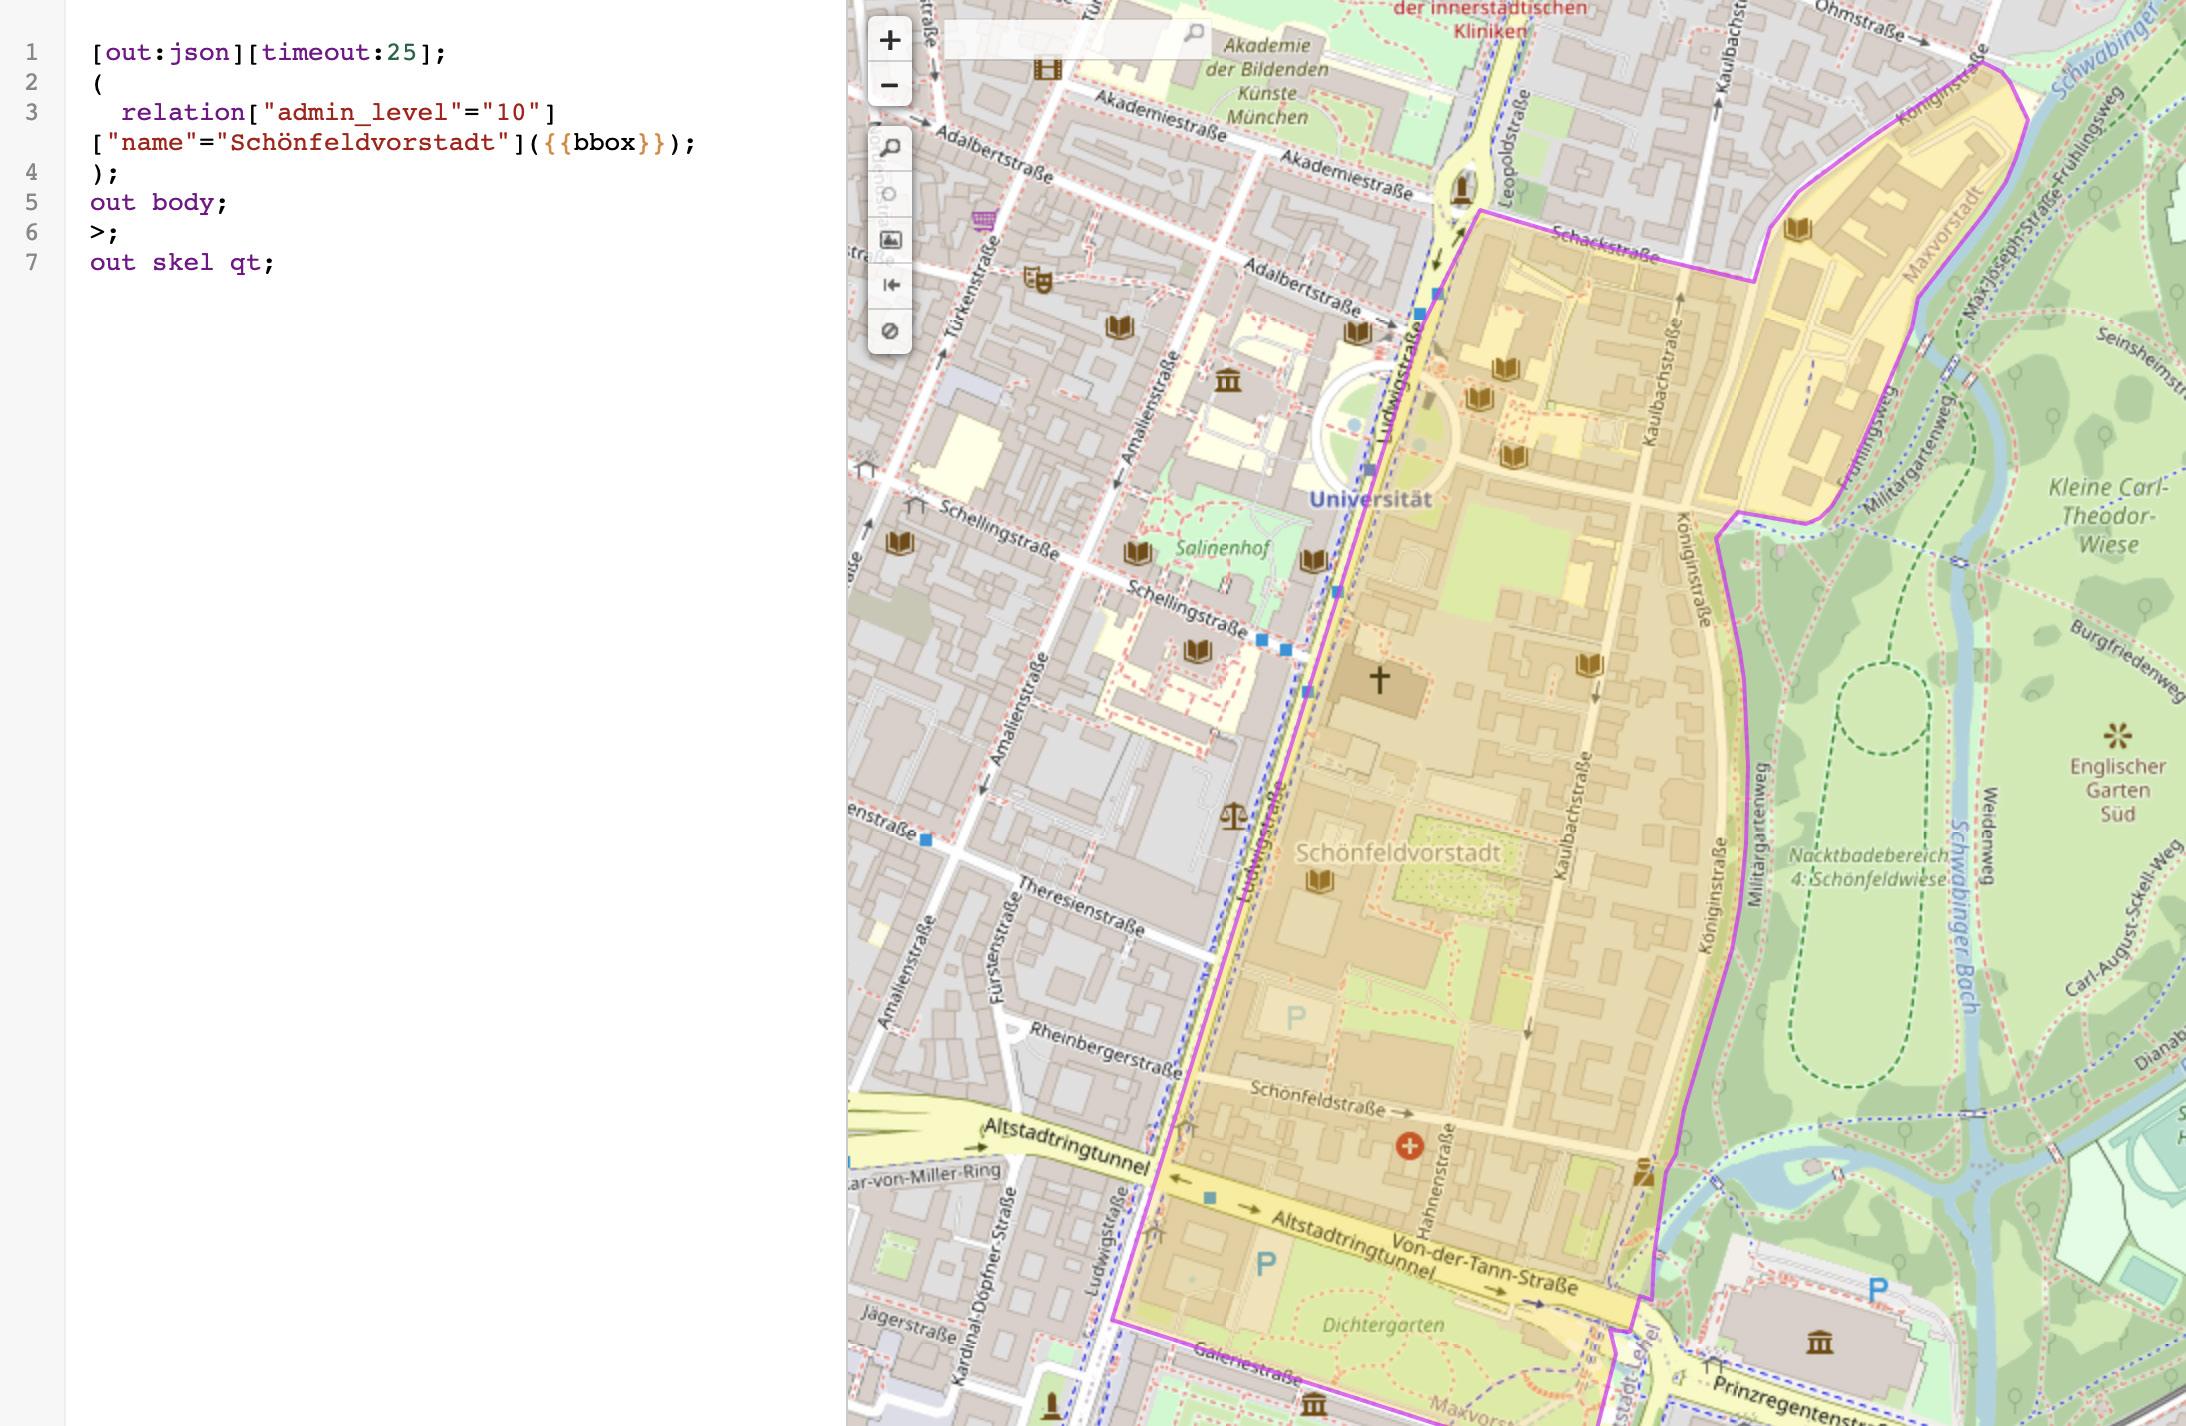
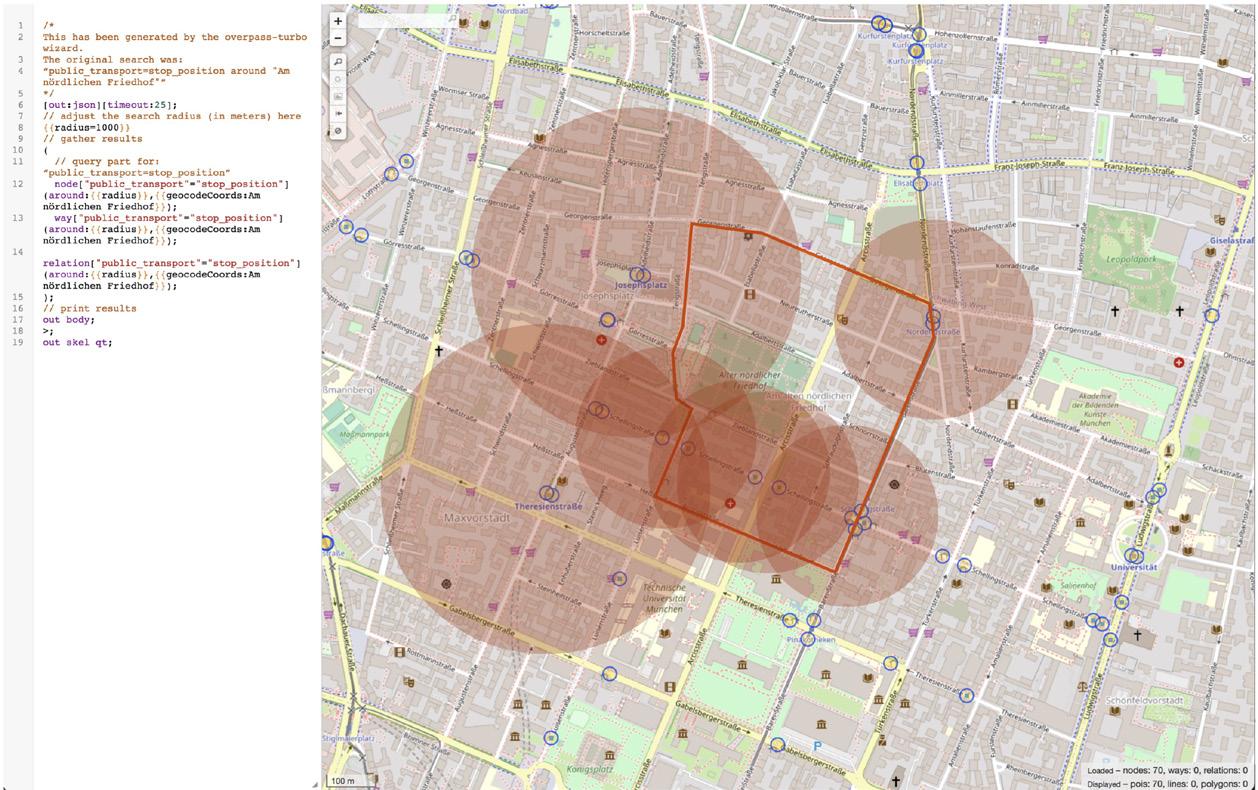
Exemplaray Request for one Stadtbezirksteil in Overpass-Turbo
Mobility Indicator
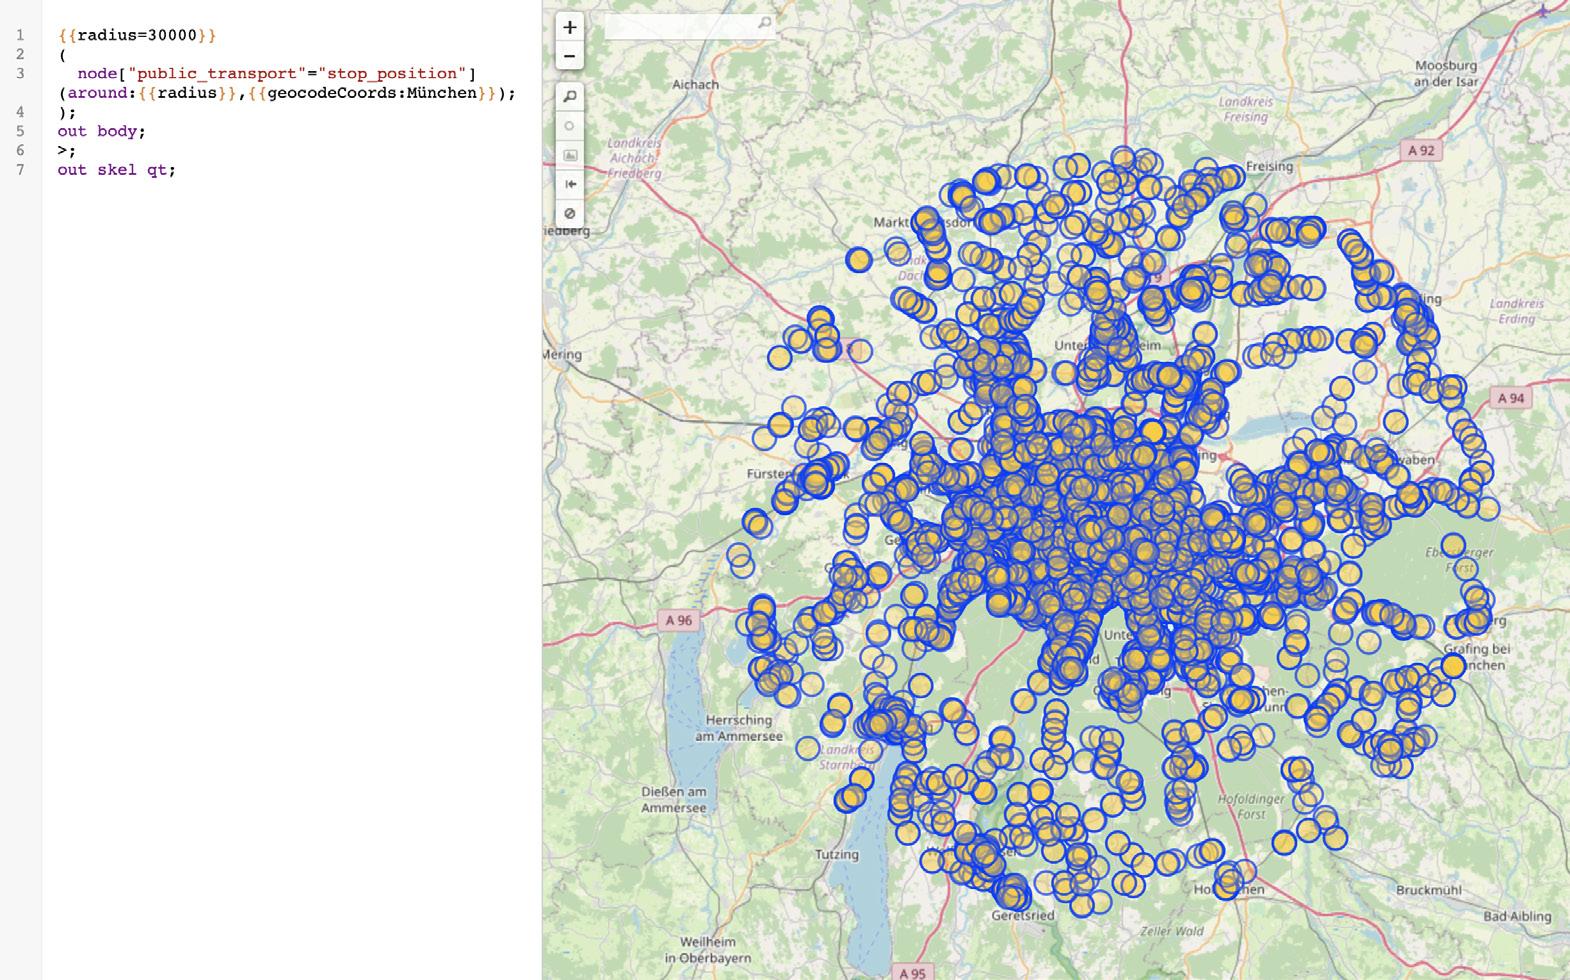
The Mobility Indicator is based on bus, tram and subway stop information surrounding the analysed areas. For this, both the area of the Stadtbezirke and all the stops in Munich are required. The datasets derive from OpenStreetMap where the necessary information is available. The data is loaded via the Overpass Turbo API and exported in the JSON Format as well. For this, all the stops are requested at once and the 108 individual Stadtbezirksteile are generated separately:
Data- Retrieval, Processing and Assessment Data Retrieval & First Processing.
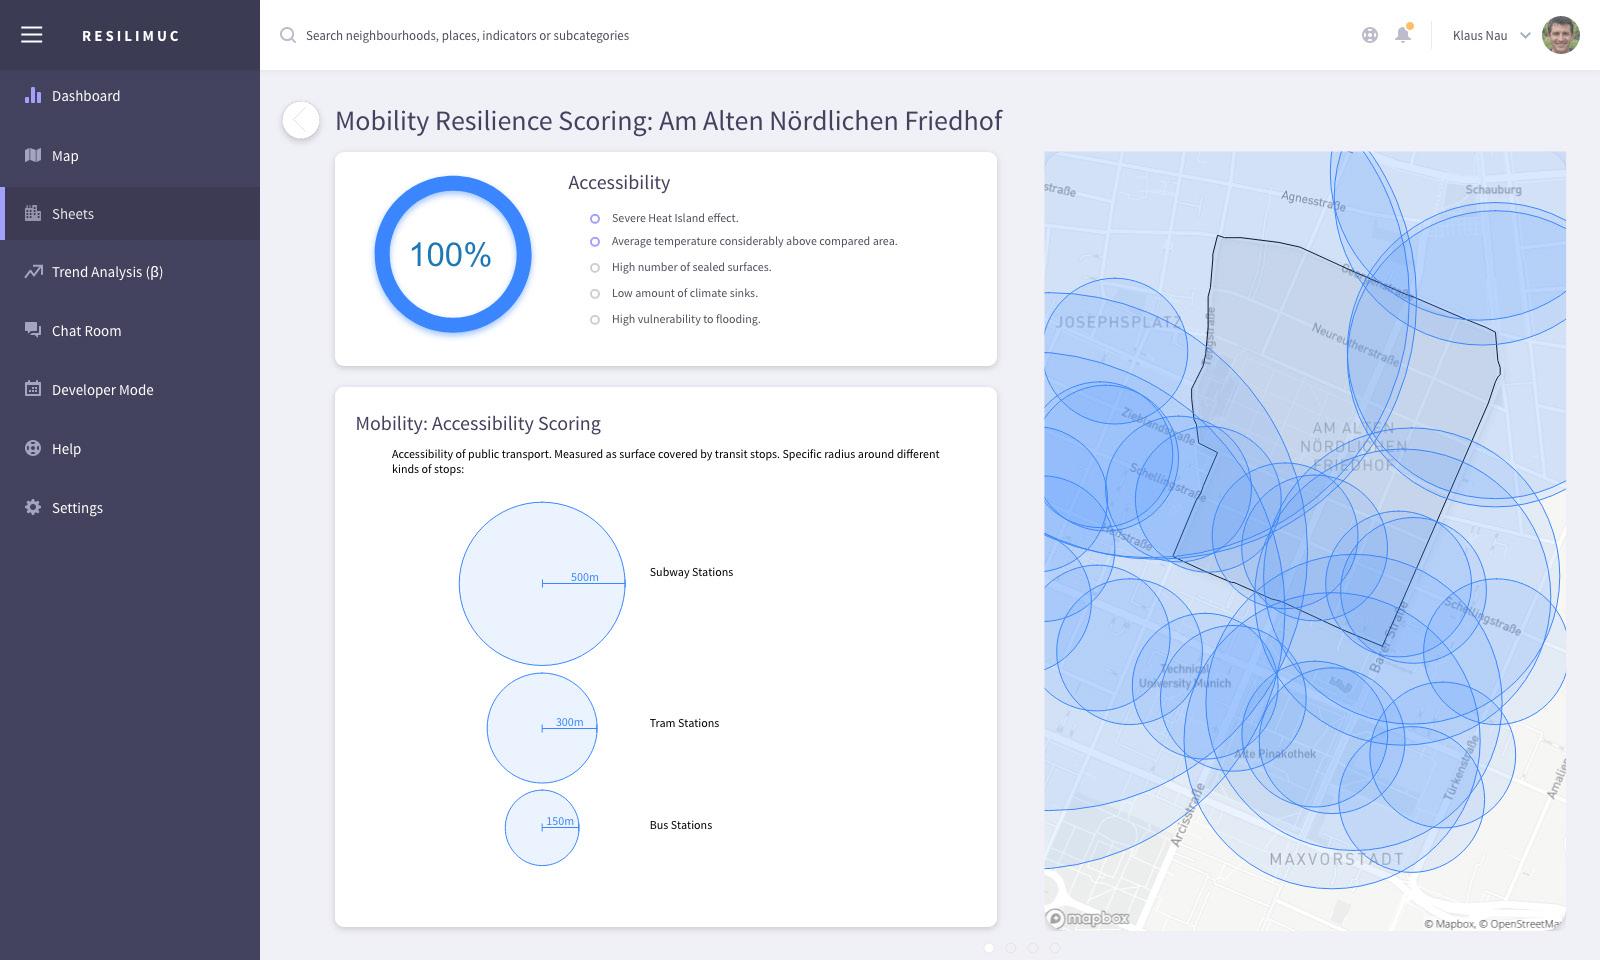
The relevance of the public transport stops is in the accessibility for the individual areas. The accessibility of the areas augments the potential for a resilient response to disturbances. The individual traffic stops project a radius of accessibility. The covered surface of the Stadtbezirksteile is measured and the relative cover of the area is calculated. This percentage represents the specific Stadtbezirkteil‘ mobility index scoring.
23 Processing.
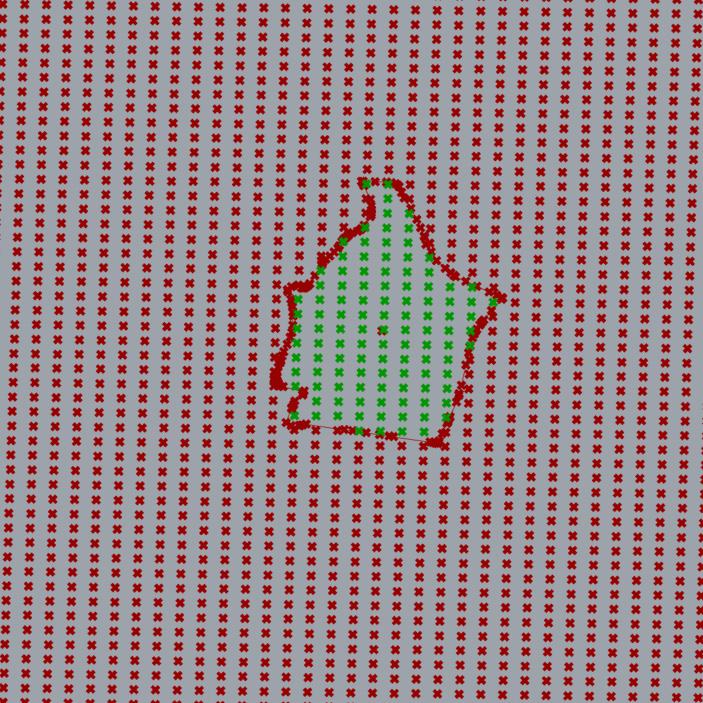
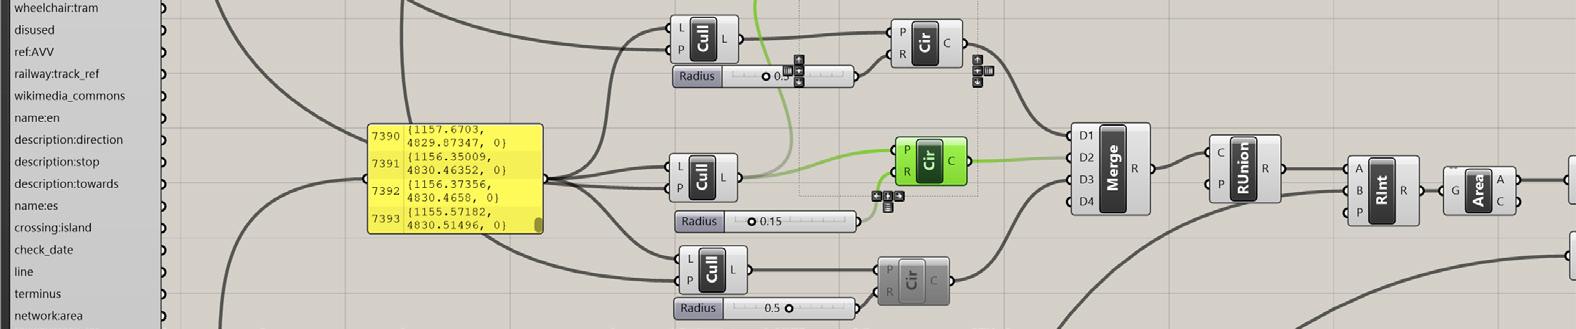
The stop positions are requested at a specific radius around Munich in Overpass-Turbo Processing Concept visualised
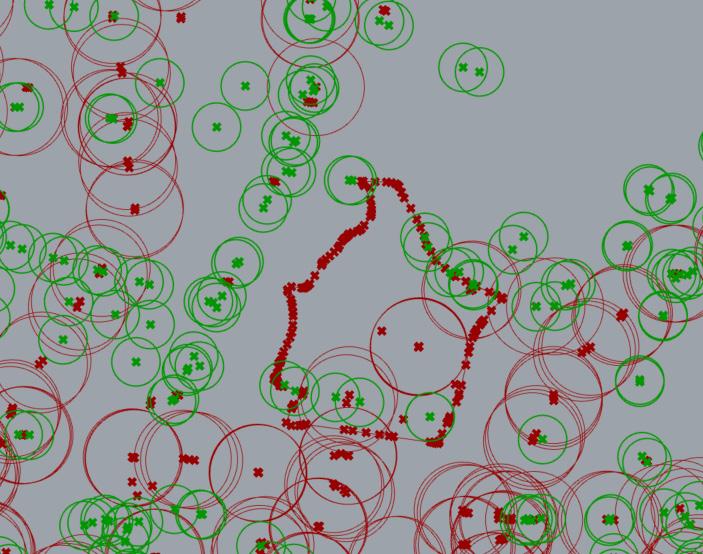
Circle Generating The different kind of stops, tram, bus and subway stations receive different radii. Here, in green the bus stops and in red the tram stops are visible. The Cull-function matches the points with the records in the JSONfile that match the specific kind of stops (visible as panel of properties on the left). The circle function than generates the circles. Rhino View Rhino View Grasshopper View Grasshopper View
24
ThePointAssessmentMappingassessment of the public transport stops is also solved in Grasshopper. Similar to the Climate Process, the JSON-file is opened, accessed, scaled and the stop positions are mapped
Rhino View Grasshopper View
Full Grasshoppper Process available: here.
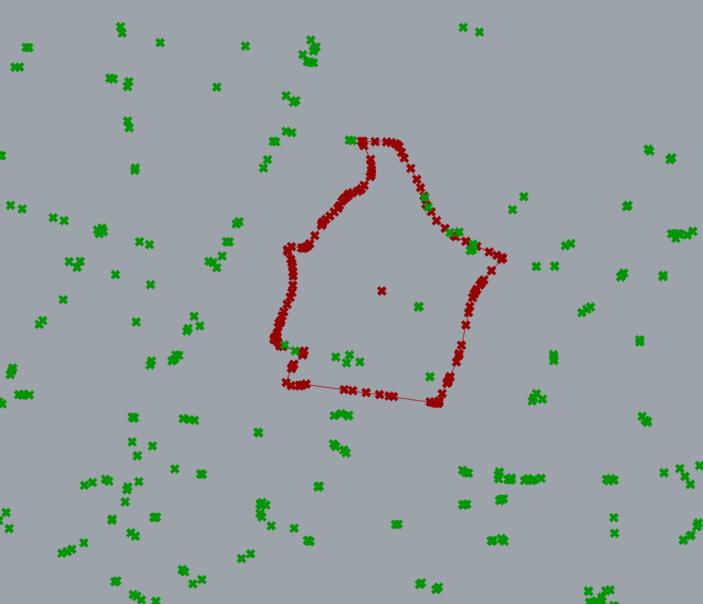
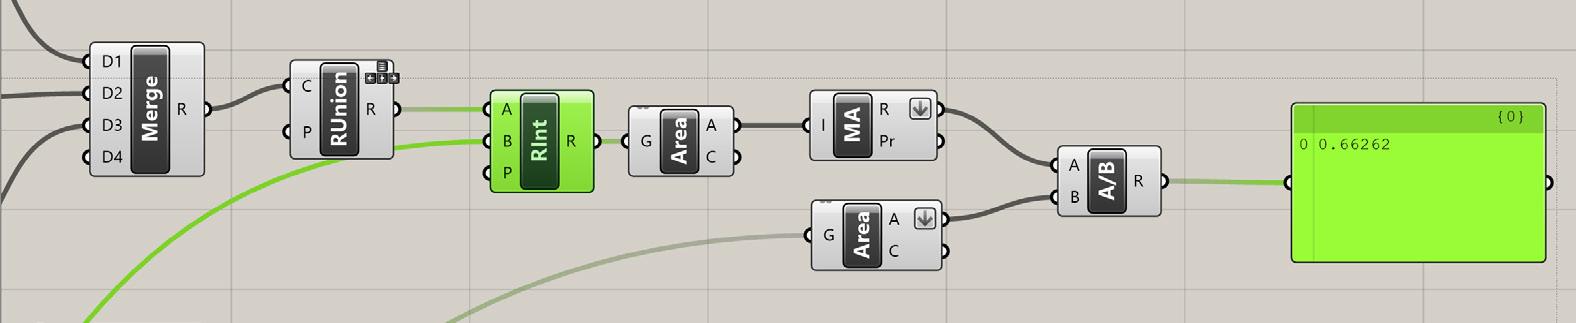
The generated circles are merged, the RUnion-function eliminates double areas and creates one accessibility cover area for Munich. At this point the specific Bezirksteilareas become relevant. These derive from the same process as described for the Climate Process. The Region Intersection, RInt-function, identifies the overlapping areas. Next, the surface areas are calculated and the percentage of covered surface is calculated.
The two processes for the Climate Resilience Index and Mobility Accessibility Index are exectued in the same Grasshopper file, so that the individual Stadtbezirksteile only have to be loaded once.
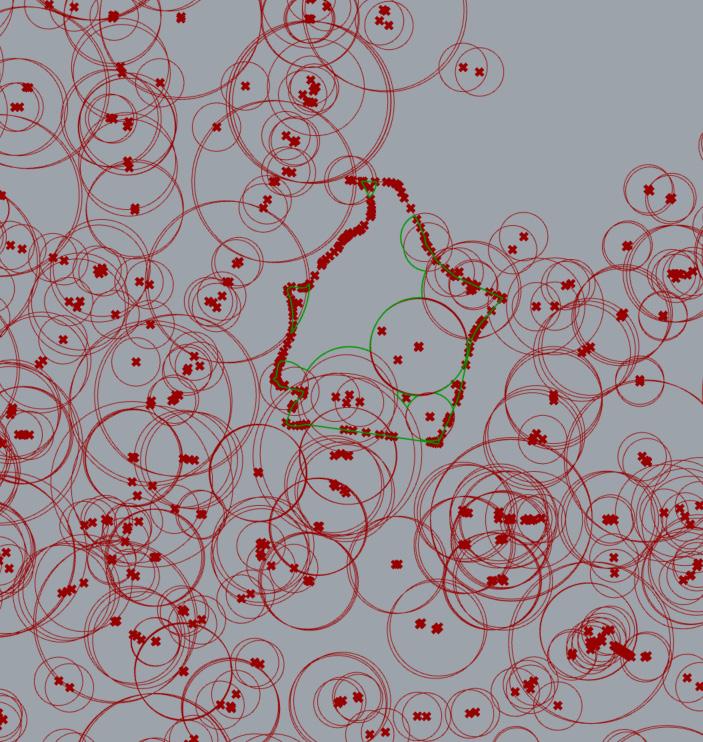
25Covered Surface Analysis
Social Indicator
Image of Münchner Stadtteilstudie
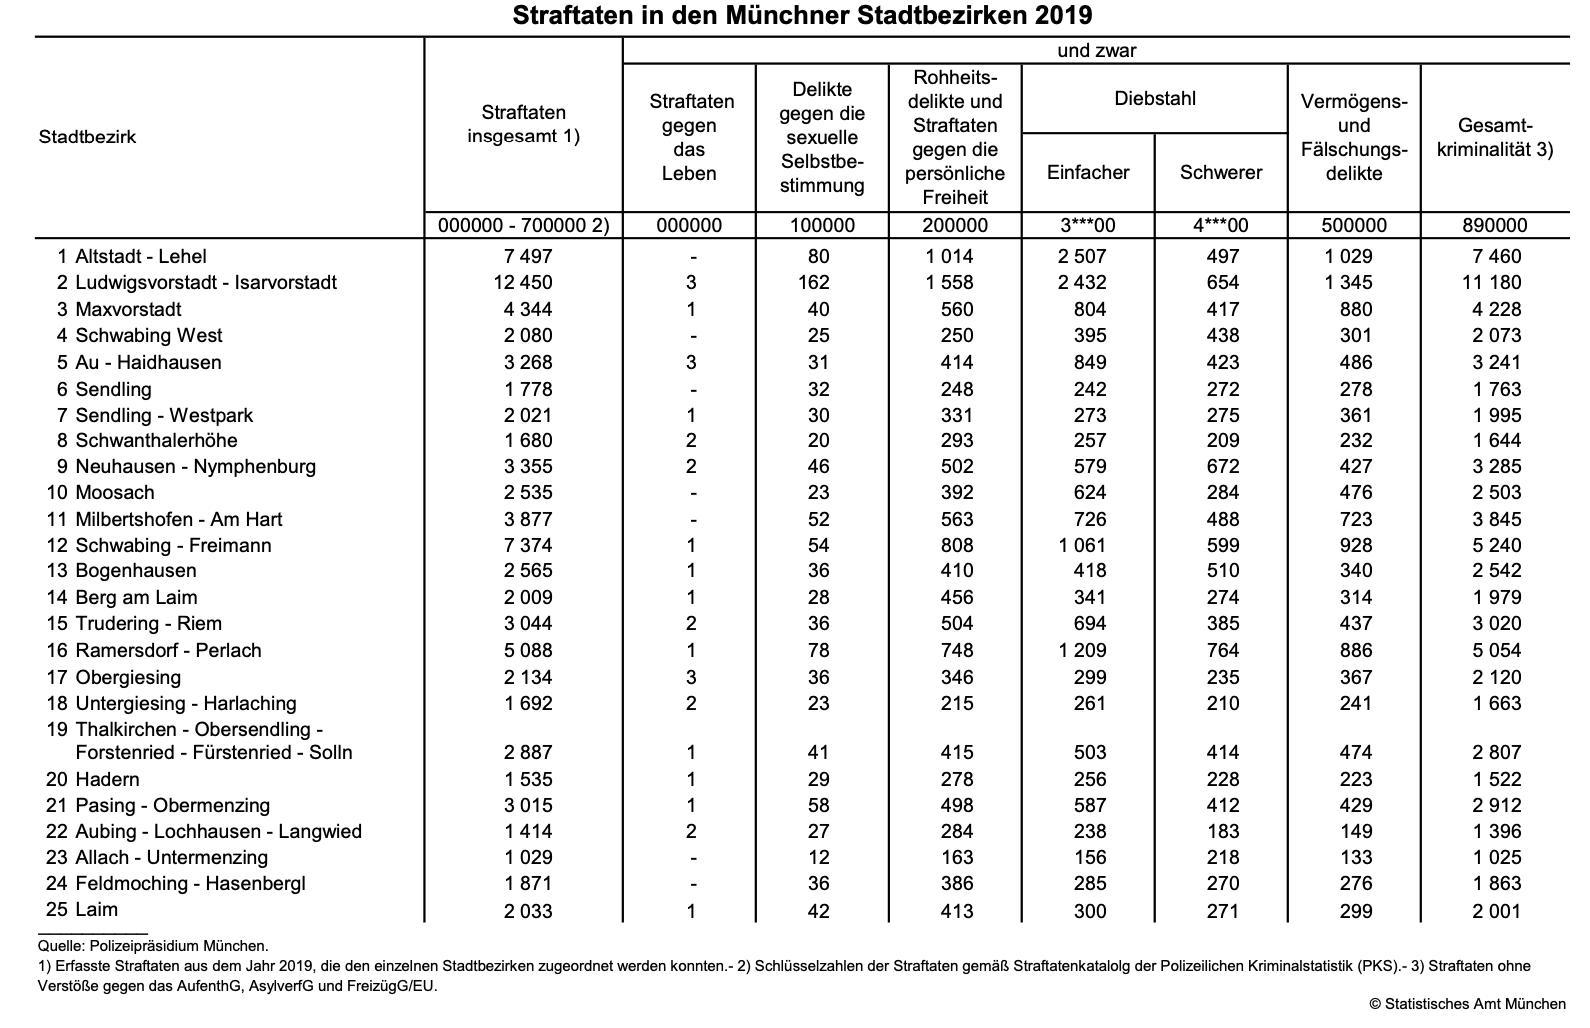
The Social Indicator is based on an evaluation of Munich’s crime report that is The Social Indicator is based on an evaluation of Munich’s crime report that is published annually by Munich Police as well as the statistics for inhabitants in each Stadtbezirk published by the City of Munich. The crime report dataset is available from 2001 through 2020. For comparability, only the years 2011-2020 were considered. The report divides the crime statistics into the 25 Stadtbezirke of Munich and classifies five crime subcategories: murder, crimes against sexual autonomy, assault, minor and major theft as well as economic crimes.
26
Data- Retrieval, Processing and Assessment Data Retrieval.
27
Available as a PDF-file, the statistics are not easy to access and process as a data source. Bypassing the need to copy the values by hand, the pdf files tables were converted to excel tables using Adobe Acrobat Pro’s PDF to Excel interpreter. The further assessment is done in Excel with basic functions. Exemplarary Table of Munich Crime Report 2019
Based on a study conducted by Pertegas and Olmos (2014), perceived insecurity and crime rates have an effect on urban identity, quality and the willingness of individuals to participate in the community. For this reason I am using the crime statistic as a proxy for perceived security and also openness and identification with the city. This means that neighbourhoods with high crime and low identification of its inhabitants, have a lower resilience potential. As the importance of different crime statistics and the relation to perceived security or participation is controversial, the different crime categories are weighed differently. Processing.
Next,
Full
28 Assessment.
available:ExcelExcelhere.ViewView
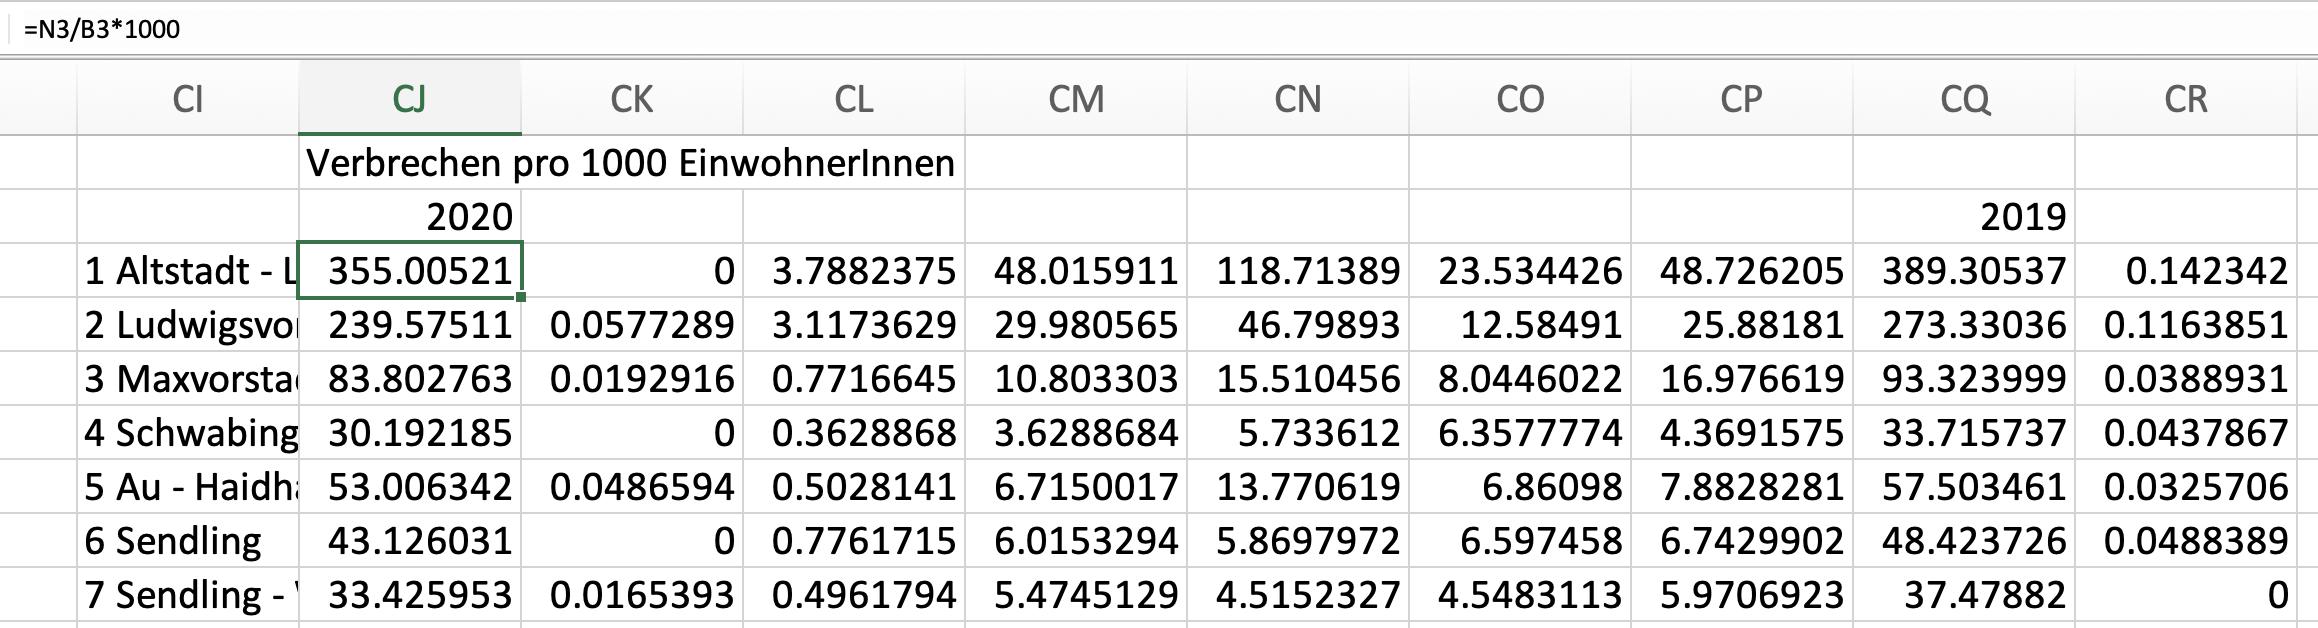
The data is first set into context with the population numbers in the specific Stadtbezirke and calculated as commited crimes per 1.000 inhabitants. The first row refers to overall crimes, the second to murder, crimes against sexual autonomy, assault, minor and major theft and the last to economic crimes. the individual values are compared to the Munich‘s mean crime rate per 1.000 inhabitants. All values above 0% lay above Munich‘s average. Excel Spreadsheet
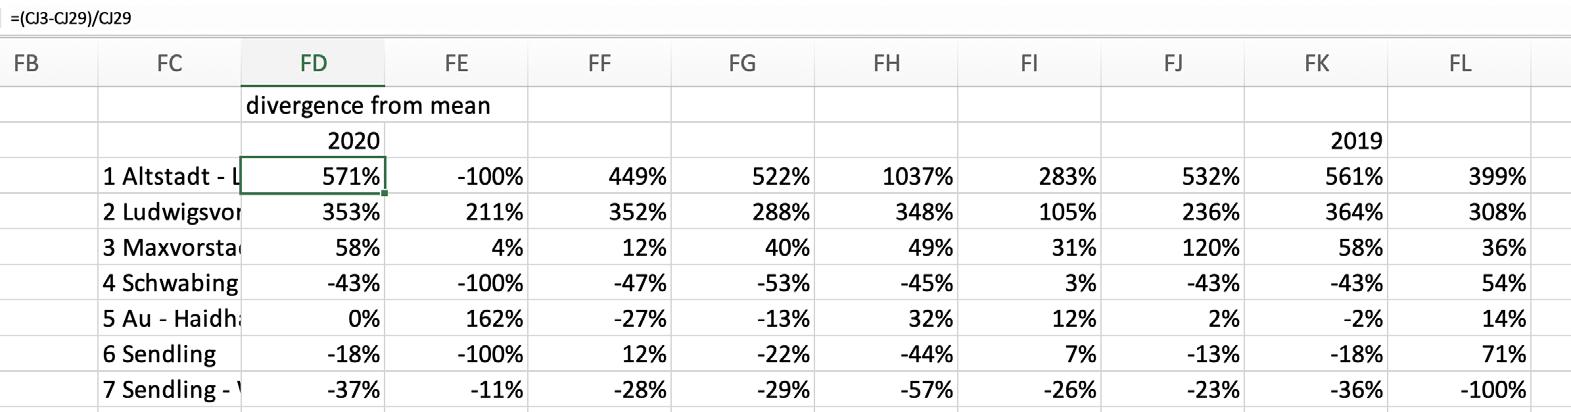
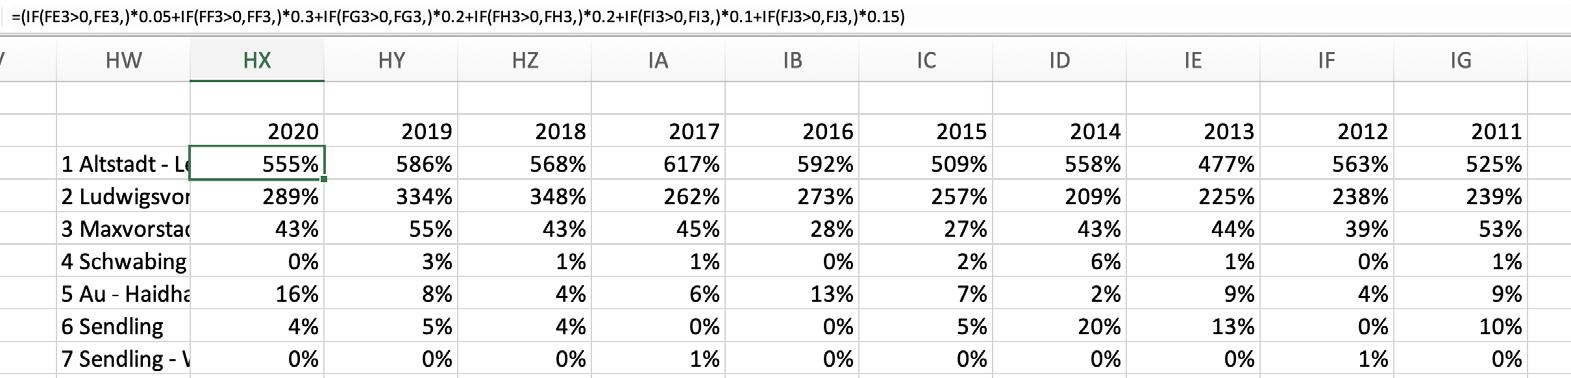
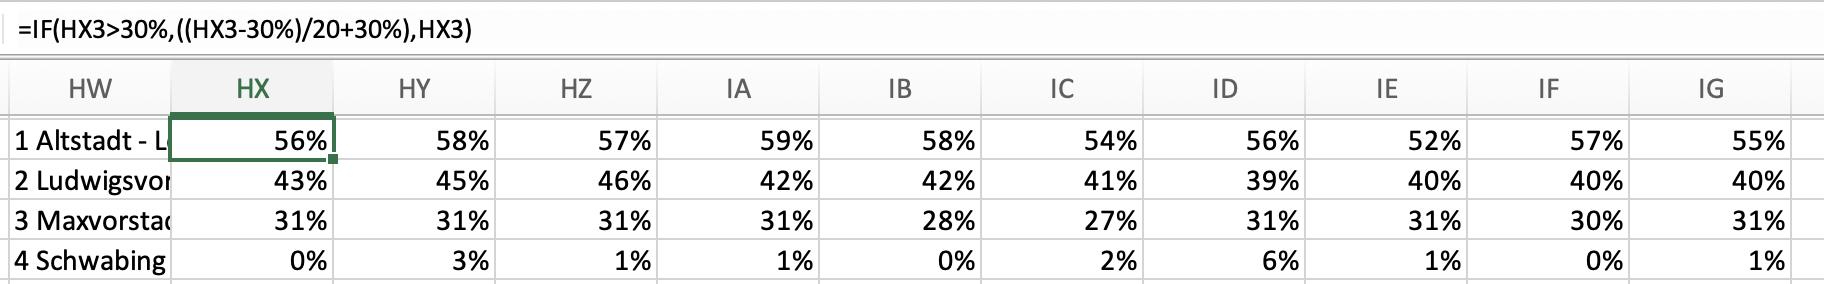
29In the next step, the crime rates that lay above Munich‘s average are selected using the IF-statement: IF(condition, true, false); IF(Value>0, Value, ). The different rates are simultaneously weighed with a specific factor that is based on an argumentation as to how much the type of crime has an effect on an individuals’ behaviour.
Excel View Excel View Factors Used for Crime Categories Crime Categories Crime Report Munich 2011 2020 SexualisedMurderViolenceAssaultSimpleTheftSeriousTheftEconomicCrimesOtherCrimes Weighing as Indicator Factor x xxxxx0.532211.5
Murders for example occur rarely and thus do not play a major role on the perceived security. Assualt and sexualised violence however, play a stronger role in perceived security and willingness to participate in the Interestingly,community.
it is visible that the inner city Stadtbezirke Altstadt and Ludwigsvorstadt, have a high percentage of crime rates in this calculation. This is due to the high number of people traveling/spending their time in these neighbourhoods compared to the low number of people living in them. Adding to this, there is much more night life that is also prone to higher crime rates. For these reasons, the extreme values have been systematically dampened, to better compare the values. The percentage points above 30% only count with one twentieth of the preceding weight.
30
Prototyping
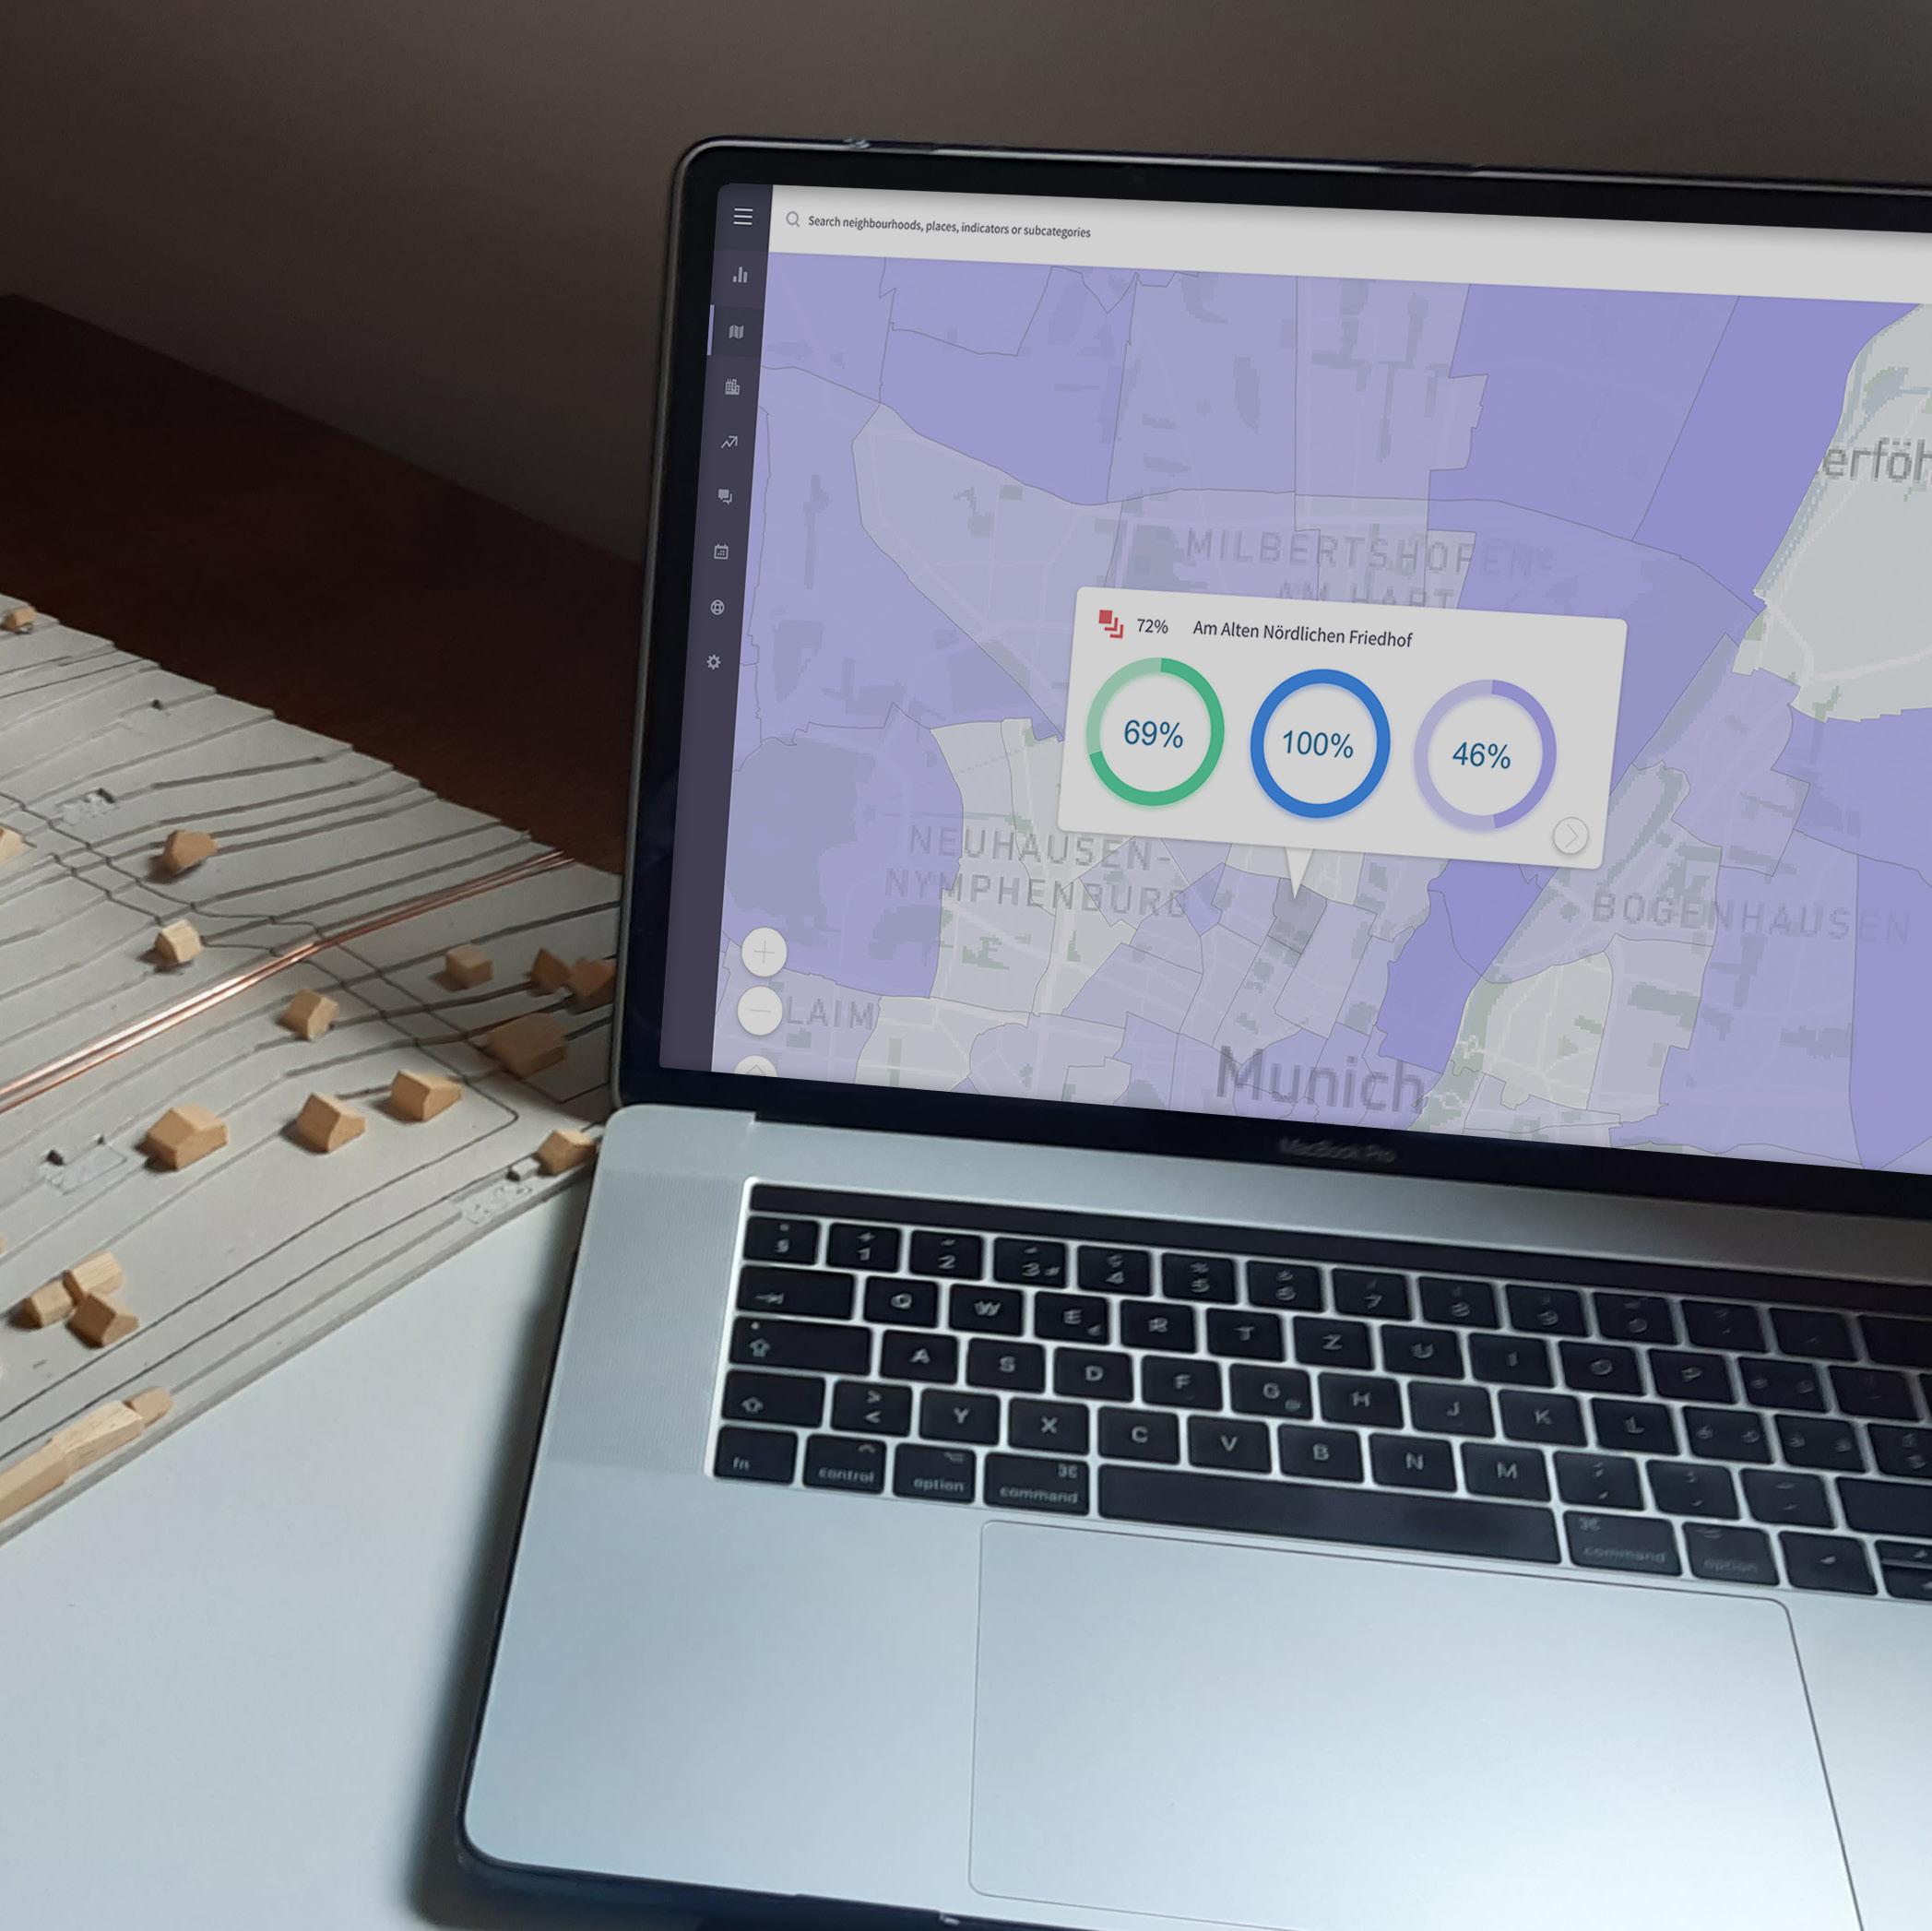
The User Interface is realised as an Adobe XD prototype. The generated indices and values for the neighbourhoods are implemented and visualised on an interactive platform. For the moment, the proof of concept is only applied for Munich at this point.
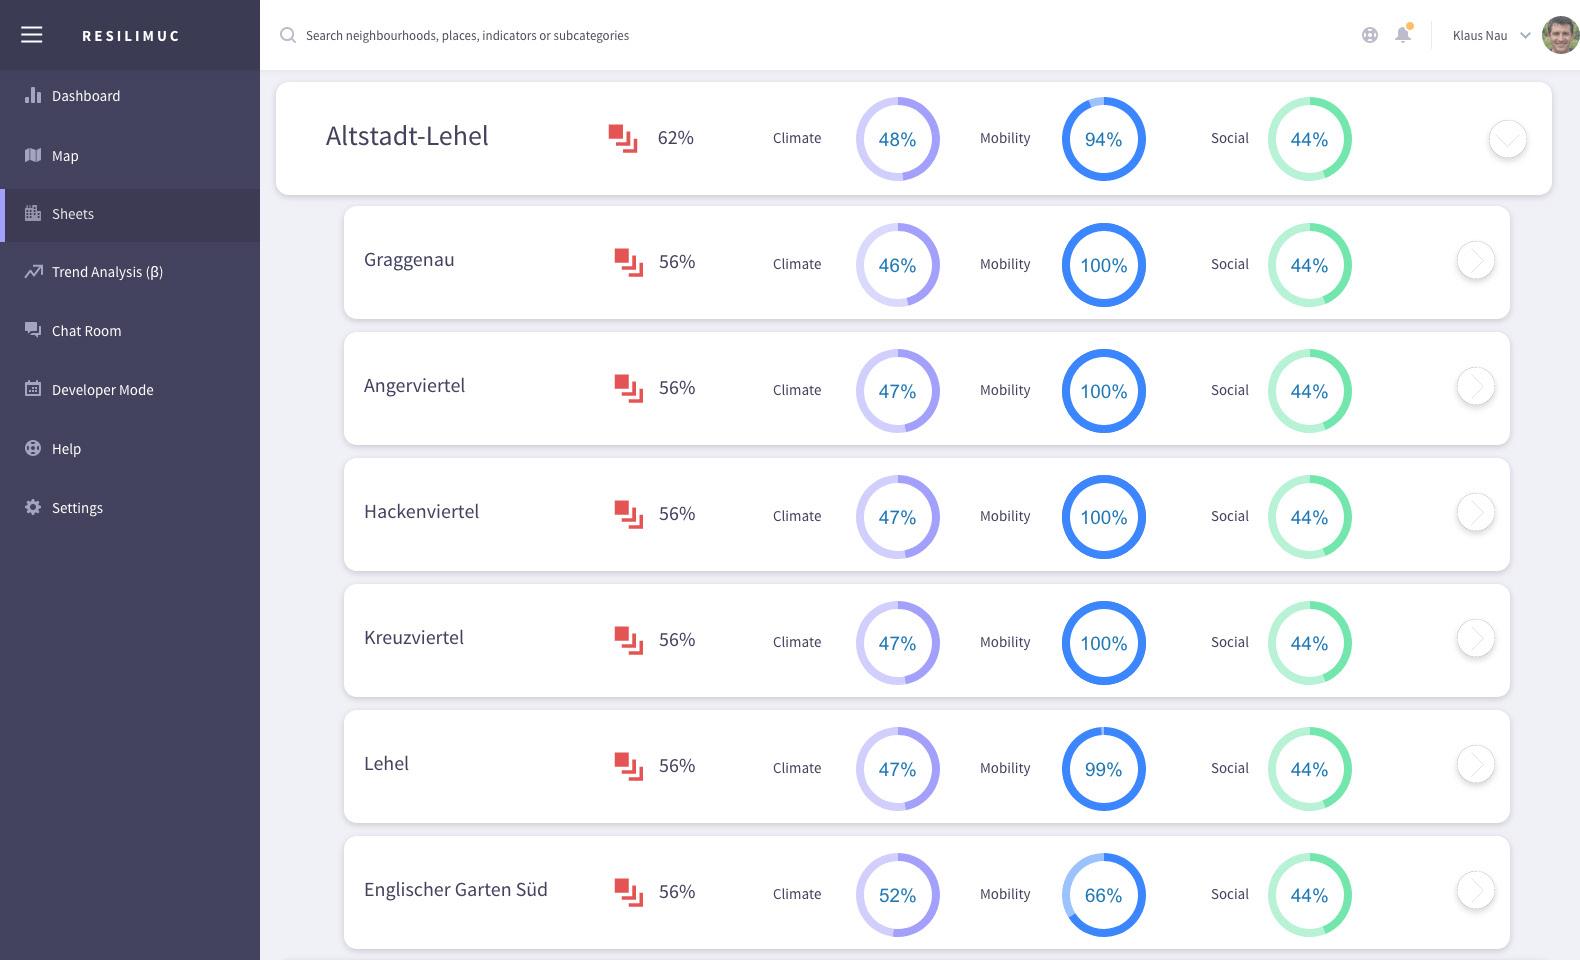
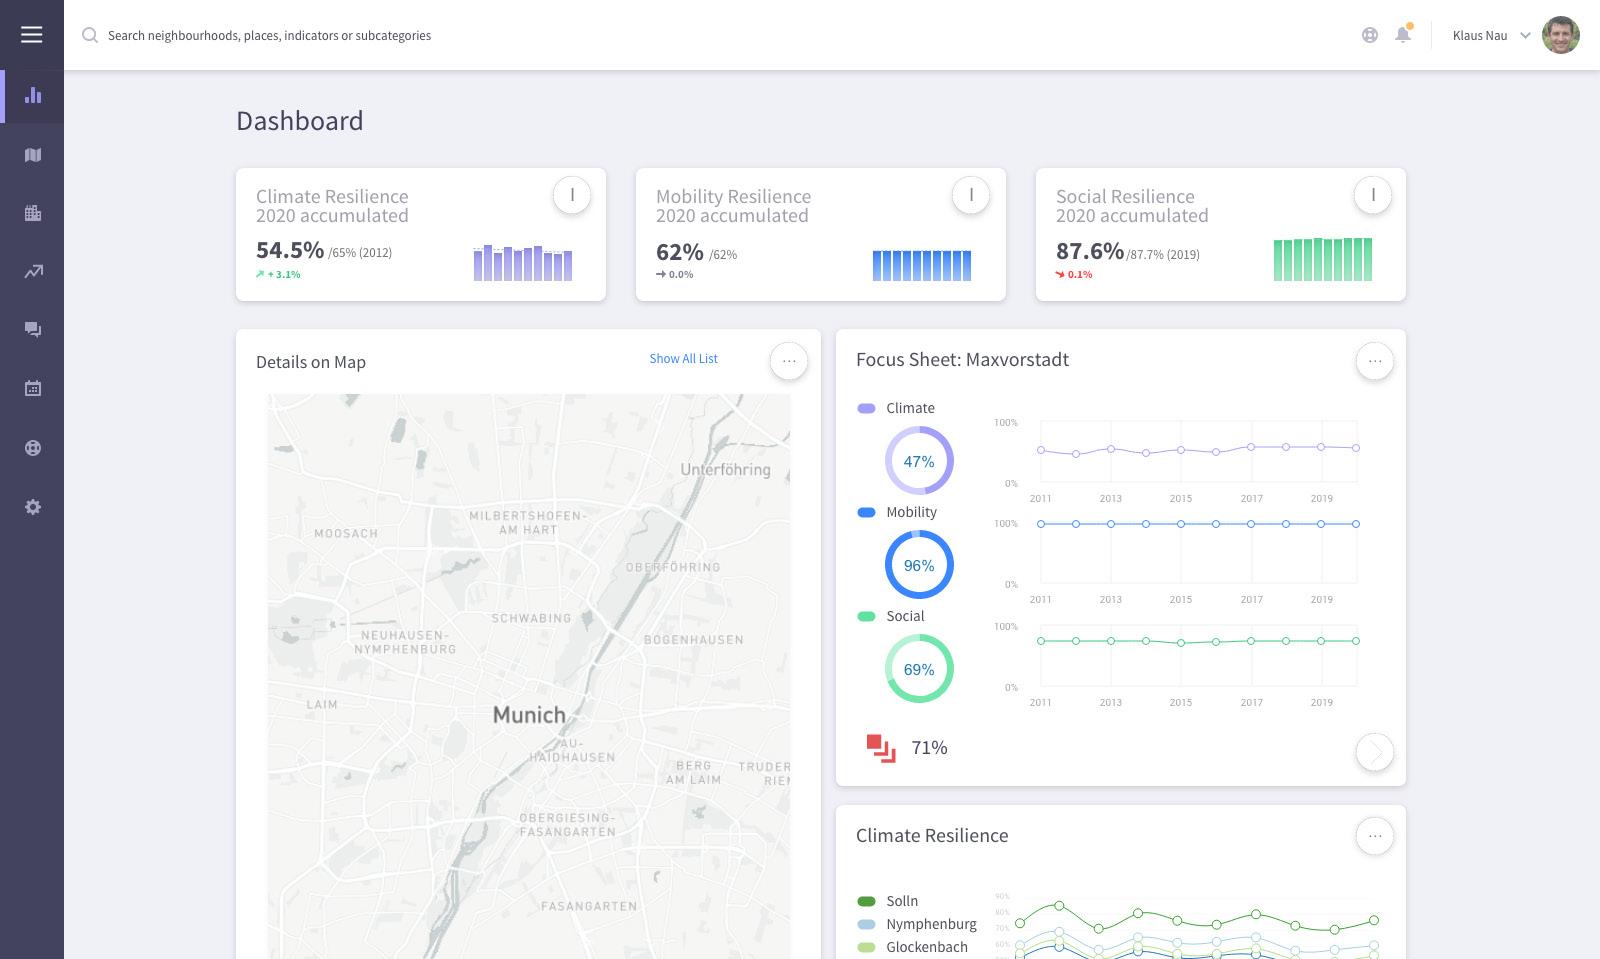
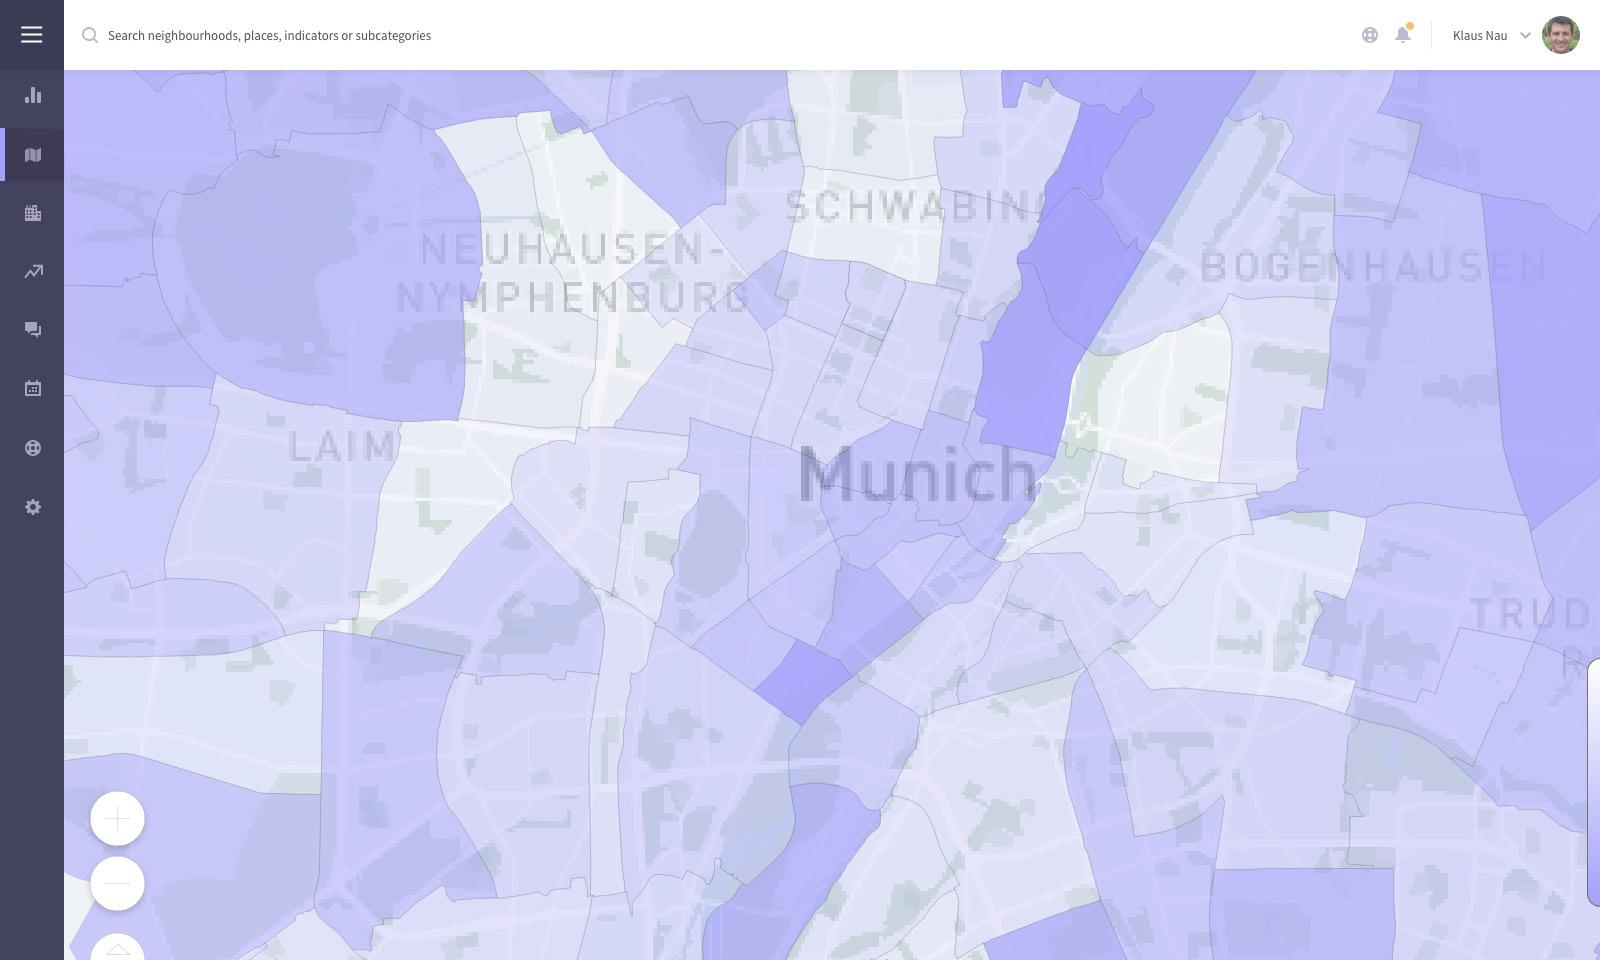
The platform provides three main modes: Dashboard On which key information is documented in a concise way. Map That shows the index scoring of the neighbourhoods and lets the user compare the neighbourhoods on a visual basis. Sheets On which the individual neighbourhood’ scorings are documented and the process for their calculation is described. Furthermore, the concept also envisions to give the user the ability to include their own data that can be included in the scorings, a platform for exchange with other planners as well as a trend analysis.
The platform itself is meant to be open not only towards including new indicators but also towards including other cities for comparing different cities with one another.
The complete data-set for the scorings is available: here.
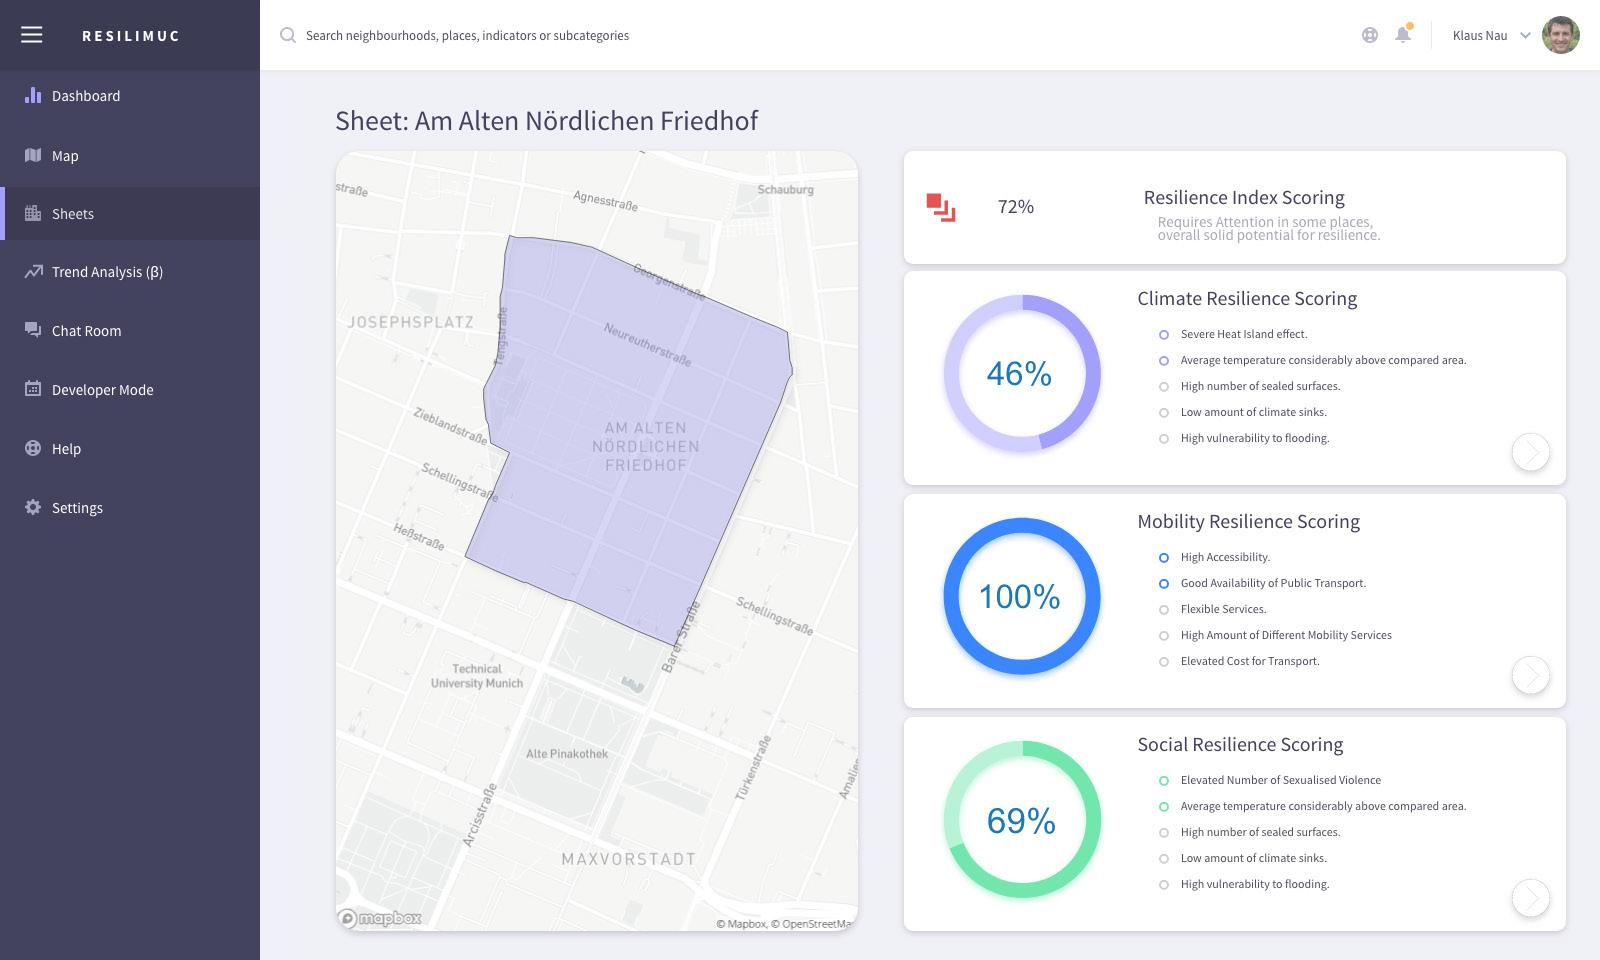
31 Dashboard Sheet List
32 Sheet Example Scoring Process Example
33 Map View Full interactive prototype available by clicking on or scanning this code.
As the Research introduction has shown, it is very difficult to quantify resilience. Many discussions have turned around this problem. As the response of a system is too dependent on many factors it is difficult to predict, the general ability to unspecific Measuringthreats.
The underlying aim is not so much about quantifying resilience itself but rather about communicating shortcomings and vulnerabilities. If the platform helps to start a discussion about why the scoring for specific neighbourhoods is low that is already a confrontation that rises identification with the neighbourhoods. Neutrality of quantitative methods. Another interesting learning has been the discussion of data and quantitative methods. Especially the social indicator bears a high level of controversy. While both the climate and mobility index are more or less straightforward, the use of social data like the crime report Munich require a critical examination of what is being discussed and how the data is being evaluated.
Limitation of “Resilience“.
resilience potential in order to prepare the city for future climate disturbances, however, can help preparing cities to better overcome such difficulties in the future.
Discussion & Outlook
34
This chapter is meant to be a critical examination of the project and a point of discussion for the most important elements I have learned during this semester project.
35
In their book, data feminism, D’Ignazio and Klein (2020) devote one chapter “The Numbers Don’t Speak for Themselves” to the necessity of carefully accessing the context and the gathering of data. For the crime report it is already interesting to question the division of crimes into the different categories. Especially in regard to the crimes against sexual autonomy and the high deviation of inner-city neighbourhoods, a critical examination of the number of unrecorded cases as well as the rate of crime detection are necessary.
The take home message for me is that also quantitative methods require a qualitative assessment and argumentation for their significance and limitations. Outlook. As the two discussion points already suggest, a closer examination of the term “resilience” and the scientific capability to measure it are relevant for creating a reliable index that can support planners to make effective decisions in the urban Thecontext.evaluated data sets themselves are very promising. The climate data for example provides extreme in-depth information that was only used to a very low degree in the technical implementation prototype. Here, a closer examination of the data sets and what information they do contain will be important.
36 15.06.2021Implementation Concept 06.07.2021DigitalPrototyping Identifying DatabasesLimiting Indicators Process Indicators EFFORT Climate Resilience image Data Mobility Flow Social ProcessingStatistic Flow C# Visualisation Flow C#/Unity/PythonGathering/Merging Layout UX Design Color Concept
37Debugging 11.08.2021FinalHand-In UI/UX Optimisation DesignProcessingidentifcaitionDatabase Data UI/UX Data VisualisationData Visualisation worldTIMEdomination C#/Unity/PythonGathering/Merging on Dashboard LayoutC# UX Design UX Fine Tuning EastereggsImplementing
Andersson, E. (2006). Urban landscapes and sustainable cities. In: Ecology and Society, 11(1), 34. ARUP (2014). City Resilience
https://www.emi.fraunhofer.de/en/business-units/security/research/analysis-of-the-EMI,D’Ignazio,culturalDieleman,Accessedhttps://www.arup.com/perspectives/publications/resIndex.earch/section/city-resilience-indexon31.06.2021.H.(2013).Organizationallearningforresilientcities,throughrealizingeco-innovations.InJournalofCleanerProduction(50),171–180.CatherineandLaurenKlein(2020).DataFeminism.Cambridge:MITPress.Ernst-Mach-Institut,Fraunhofer(2021).Caesar.cascade-effects-in-supply-networkssoftwaretool-c.htmlAccessedon31.06.2021.Fu,XinandXinhaoWang(2018).Developinganintegrativeurbanresiliencecapacityindexforplanmaking.InEnvironmentSystemsandDecisions(38),367–378.GlobalFacilityforDisasterReductionandRecovery(2020).CityResilienceProgram.https://www.gfdrr.org/en/crpAccessedon31.06.2021.Holling,C.S.(1973).Resilienceandstabilityofecologicalsystems.InAnnualReviewofEcologyandSystematics(4),1-23.Leichenko,R.(2011).Climatechangeandurbanresilience.In:CurrentOpinioninEnvironmentalSustainability,3(3),164–168.
38References & Ressources
Meerow, Sara, Joshua Newell and Melissa Stults (2016). Defining urban resilience: A review. In Landscape and Urban Planning (147), 38-49. National Institute of Standards and Technology, U.S. Department of Commerce (2016). Development of a First-Generation Community Resilience Assessment https://www.giss.nasa.gov/tools/panoply/Panoply,Overpassresilience-assessment-methodologyhttps://www.nist.gov/programs-projects/development-first-generation-community-Methodology.Accessedon31.06.2021.Turbo:http://overpass-turbo.euAccessedon27.07.2021.NASA,NationalAeronauticsandSpaceAdministration(2021).Accessedon27.07.2021.Pelling,M.(2003).Thevulnerabilityofcities:naturaldisastersandsocialresilience.London:Earthscan.
Contact Caspar AugustSoSe03673815Kleiner20212021
Panoply, NASA, National Aeronautics and Space Administration (2021). https://www.giss.nasa.gov/tools/panoply/
Accessed on 27.07.2021. Statistisches Amt München (s.a.). Bevölkerungsbestand https://www.muenchen.de/rathaus/Stadtinfos/Statistik/Bevoelkeru2001-2020.ng.html
39
Accessed on 31.06.2021. Vito (2019). Climate variables for cities in Europe from 2008 to Accessedhttps://cds.climate.copernicus.eu/cdsapp#!/dataset/sis-urban-2017.climate-cities?tab=overviewon27.07.2021.
Accessed on 27.07.2021. Pelling, M. (2003). The vulnerability of cities: natural disasters and social resilience. London: Pendall,Earthscan.R., K. Foster and M. Cowell (2010). Resilience and regions: building understanding of the metaphor. In Cambridge Journal of Regions, Economy and Society, 3(1), 71–84. Pertegas, Sergi Valera and Joan Guàrdia Olmos (2014). Perceived insecurity and fear of crime in a city with low-crime rates. In Journal of Environmental Psychology (38), 195-205. Polizei München (s.a.). Sicherheitsberichte https://www.muenchen.de/rathaus/Stadtinfos/Statistik/Sipo.html2001-2020.
Accessed on Urban27.07.2021.Habitat (2018). City Resilience Profiling Tool. http://urbanresiliencehub.org/wpcontent/uploads/2018/02/CRPT-Guide.pdf