
1 STEEL STRUCTURESEnvironmental Product Declaration created with One Click LCA PRODUCTENVIRONMENTALDECLARATION IN ACCORDANCE WITH EN 15804+A2 & ISO 14025 / ISO 21930 STEEL STRUCTURES UPB AS


2 STEEL STRUCTURESEnvironmental Product Declaration created with One Click LCA GENERAL INFORMATION MANUFACTURER INFORMATION Manufacturer RK Metāls Address Lauktehnikas street 12, Grobina, Latvia, LV3430 Contact details rkmetals@rkmetals.lv Website https://www.rkmetals.lv/ PRODUCT IDENTIFICATION Product name Steel structures Place(s) productionof Grobiņa, Latvia EPD INFORMATION EPDs of construction products may not be comparable if they do not comply with EN 15804 and if they are not compared in a building context. EPD operatorprogram The Building Information Foundation RTS sr Malminkatu 16 A, 00100 Helsinki, Finland http://cer.rts.fi EPD standards This EPD is in accordance with EN 15804+A2 and ISO 14025 standards. Product category rules The CEN standard EN 15804+A2 serves as the core PCR. In addition, the RTS PCR (English version, 26.08.2020.) is used. EPD author Ritvars Višs, RK Metāls EPD verification Independent verification of this EPD and data, according to ISO 14025: Internal certification External verification Verification date 15/2/2021 EPD verifier Silvia Vilčeková EPD number RTS_99_21 ECO Platform nr. Publishing date 11.3.2021 EPD valid until 15.2.2026

3 STEEL STRUCTURESEnvironmental Product Declaration created with One Click LCA PRODUCT INFORMATION PRODUCT DESCRIPTION Steel structures for buildings, bridges and machines PRODUCT APPLICATION Used as load supporting frames to hold buildings, bridges and machines. TECHNICAL SPECIFICATIONS Rolled steel profiles are used with most efficient production processes and highest possible scrap content. PRODUCT STANDARDS According to ISO 9001, EN 3834 and EN 1090 till EXC 4 PHYSICAL PROPERTIES OF THE PRODUCT Steel can be used in range of S235 S700 Also wear resistant and stainless steel materials can be used. ADDITIONAL TECHNICAL INFORMATION Further information can be found at https://www.rkmetals.lv/. PRODUCT RAW MATERIAL COMPOSITION Material Quantity,mass[%] Usability Origin of the raw materialsRenew able Non renewable Recycled Hollow sections 22 X X Europe Plates 29 X X Europe Profiles 49 X X Europe PRODUCT RAW MATERIAL MAIN COMPOSITION Raw categorymaterial Amount, mass% Material origin Metals 100 Europe Minerals 0 Fossil materials 0 Bio based materials 0 SUBSTANCES, REACH - VERY HIGH CONCERN The product does not contain any REACH SVHC substances in amounts greater than 0,1 % (1000 ppm).
PROCESS
TRANSPORT AND INSTALLATION (A4-A5) Transportation impacts occurred from final products delivery to construction sites (A4) cover fuel direct exhaust emissions, environmental impacts of fuel production, as well as related infrastructure emissions. Scenario A5 is modelled as installation of a typical steel structures in a building. Fossil fuel for building machinery is included.
According to project documentation. Possible variations are shown in flow chart. Packaging materials are not used. Goods are fixed with lanyards on truck.
PRODUCT USE AND MAINTENANCE (B1-B7) This EPD does not cover use phase. Air, soil and water impacts during the use phase have not been studied.
4 STEEL STRUCTURESEnvironmental Product Declaration created with One Click LCA PRODUCT LIFE-CYCLE
At the end of life, in the demolition phase 100% of the waste is assumed to be collected as separate construction waste. The demolition process consumes energy in the form of diesel fuel used by building machines (C1). The dismantled steel is delivered to the nearest scrapping plant (C2). 95% of the end of life product primary and secondary steel is sent to recycling (C3), 5 % is landfilled (C4). Due to the recycling potential of the metal, the end of life product is converted into recycled raw materials (D).
MANUFACTURING
MANUFACTURING AND PACKAGING (A1-A3)
PRODUCT END OF LIFE (C1-C4, D)
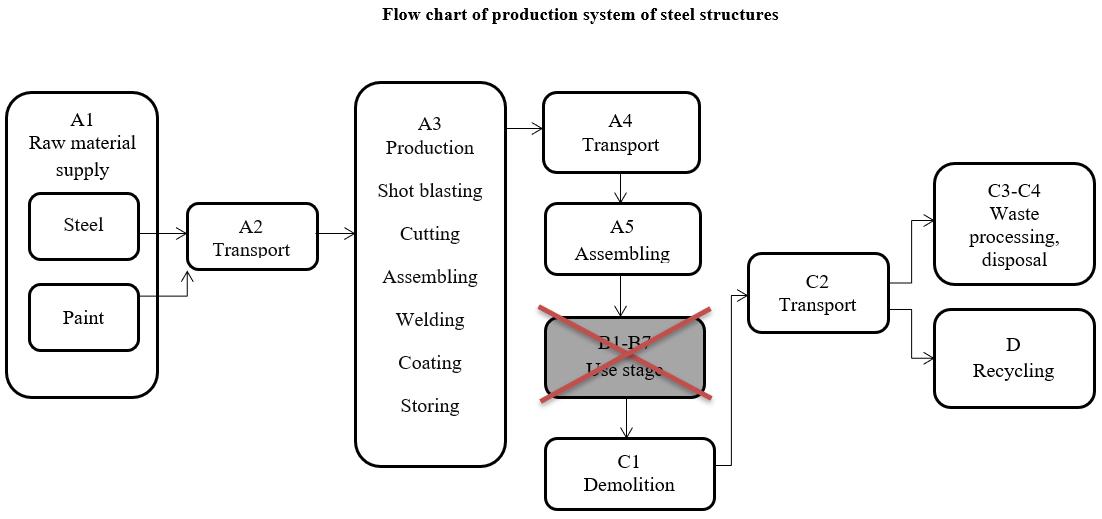
5 STEEL STRUCTURESEnvironmental Product Declaration created with One Click LCA LIFE-CYCLE ASSESSMENT LIFE-CYCLE ASSESSMENT INFORMATION Period for data Manufacturer data for the calendar year 2019 is used. DECLARED AND FUNCTIONAL UNIT Declared unit 1 ton Mass per declared unit 1000 kg BIOGENIC CARBON CONTENT Neither the product itself nor the packaging contains biogenic carbon, so the biogenic carbon content at the factory gate is 0 kg. Biogenic carbon content in product, kg C Biogenic carbon content in packaging, kg C SYSTEM BOUNDARY This EPD covers cradle to gate with options scope with following modules; A1 (Raw material supply), A2 (Transport) and A3 (Manufacturing), A4 (Transport), A5 (Assembly) as well as C1 (Deconstruction), C2 (Transport at end of life), C3 (Waste processing) and C4 (Disposal). In addition, module D benefits and loads beyond the system boundary is included. Productstage Assemblystage Use stage End of life stage Beyond boundariessystemthe A1 A2 A3 A4 A5 B1 B2 B3 B4 B5 B6 B7 C1 C2 C3 C4 D D D x x x x x MND MND MND MND MND MND MND x x x x x x x materialsRaw Transport Manufacturing Transport Assembly Use Maintenance Repair Replacement Refurbishment Operationaluseenergy Operationalusewater r./demol.Deconst Transport processingWaste Disposal Reuse Recovery Recycling Modulesnotdeclared=MND.Modulesnotrelevant=MNR.
Asstages.paint weight in finished steel structures is less than 1% it was not included in calculations Packaging does not include any biogenic carbon as product is only packaged using reusable tie down straps.
CUT-OFF CRITERIA
The study does not exclude any modules or processes which are stated mandatory in the EN 15804:2012+A2:2019 and RTS PCR. The study does not exclude any hazardous materials or substances. The study includes all major raw material and energy consumption. All inputs and outputs of the unit processes which data are available for are included in the calculation. There is no neglected unit process more than 1% of total mass and energy flows. The total neglected input and output flows do also not exceed 5% of energy usage or mass. The life cycle analysis includes all industrial processes from raw material acquisition to production, distribution and end of life
ALLOCATION, ESTIMATES AND ASSUMPTIONS
6
The values for 1 ton of element are calculated by considering the total product weight per annual production. In the factory, several kinds of steel elements are produced; since the production processes of these products are similar, the annual production percentages are taken into consideration for allocation. According to the ratio of the annual production of the declared product to the total annual production at the factory, the annual total raw materials, energy consumption and the generated waste per the declared product are allocated. Subsequently, the product output fixed to 1000 kg and the corresponding amount of product is used in the
For transportation to building sites in Sweden it is assumed that 335 km of the total distance are covered by a lorry and it is assumed that 275 km of the total distance are covered by a ferry. For transportation to building sites in Norway it is assumed that 655 km of the total distance are covered by a lorry and it is assumed that 275 km of the total distance are covered by a ferry.
STEEL STRUCTURESEnvironmental Product Declaration created with One Click LCA For easier modelling and because of lack of accuracy in available modelling resources many constituents under 0,1% of product mass are Theexcluded.production of capital equipment, construction activities, and infrastructure, maintenance and operation of capital equipment, personnel related activities, energy and water use related to company management and sales activities are excluded.
For transportation to building sites in the United Kingdom it is assumed that 710 km of the total distance are covered by a lorry and it is assumed that 1300 km of the total distance are covered by a Transportationferry. does not cause losses as products are packaged properly. Packaging does not include wooden pallets. Bulk density varies depending on product type and thickness. Also, volume capacity utilisation factor is assumed to be 1 for the nested packaged products.
The modules B1 B7 have not been calculated nor included in the LCA calculations as that is not mandatory for this LCA report.
Thiscalculations.LCAstudy is conducted in accordance with all methodological considerations, such as performance, system boundaries, data quality, allocation procedures, and decision rules to evaluate inputs and outputs. All estimations and assumptions are given below: Module A1: Raw material composition is an average value calculated using total annual material consumption for the product by mass within the studied year 2019. Module A4: Transportation from the manufacturing plants to the building site has been calculated using a most likely scenario for the export of the declared unit of one tonne to each of the market countries separately - Sweden, Norway, Denmark, United Kingdom, with fill rate assumed to be 100%.
For transportation to building sites in Denmark it is assumed that 310 km of the total distance are covered by a lorry and it is assumed that 400 km of the total distance are covered by a ferry.
Module C2: It is estimated that there is no mass loss during the use of the product, therefore the end-of-life product is assumed that it has the same weight with the declared product. All of the end of life product is assumed to be sent to the closest facilities such as recycling and landfill. Transportation distance to the closest disposal area is estimated as 50 km and the transportation method is lorry which is the most common.
Module C1: Energy consumption of a demolition process is on the average 12 kWh/t (Erlandsson & Petersson 2015). The source of energy is diesel fuel used by work machines.
Module A2, A4 & C2: Vehicle capacity utilization volume factor is assumed to be 1 which means full load. In reality, it may vary but as role of transportation emission in total results is small, the variety in load is assumed to be negligible. Empty returns are not taken into account as it is assumed that return trip is used by the transportation company to serve the needs of other clients.
Module C4: The remaining 5% of steel are assumed to be send to the Modulelandfill.D:The recycled end-of-life product is assumed to be converted into a raw material after recycling. Module D calculated for primary steel to avoid double counting.
STEEL STRUCTURESEnvironmental Product Declaration created with One Click LCA Module A5: Assembly/Installation is modelled as installation of a typical steel structures in a building. Fossil fuel for building machinery is included. It is assumed that the waste is insignificant during the assembly process. The assembly process is also assumed to be similar across all of the market countries. The energy required for the installation process are taken as the industry average values for the steel structures assembly process.
Module C3: It is assumed that about 95% of steel (World Steel Association, 2020) are recycled. The process losses of the waste treatment plant are assumed to be negligible. It is assumed that the end of life scenario is similar across all of the target market countries.
7
8 STEEL STRUCTURESEnvironmental Product Declaration created with One Click LCA ENVIRONMENTAL IMPACT DATA NOTE : ENVIRONMENTAL IMPACTS - EN 15804+A1, CML / ISO 21930 AND ENVIRONMENTAL IMPACTSTRACI 2.1. / ISO 21930 ARE PRESENTED IN ANNEX CORE ENVIRONMENTAL IMPACT INDICATORS – EN 15804+A2, PEF Impact category Unit A1 A2 A3 A1 A3 A4 SWE- NORA4- A4 DK A4 UK A5 B1 B7 C1 C2 C3 C4 D Climate change total kg CO2e 2,21E3 3,75E1 2E1 2,27E3 3,6E1 6,51E1 3,63E1 9,09E1 2,47E0 MND 3,96E0 4,55E0 2,21E1 2,64E 1 9,32E2 Climate change fossil kg CO2e 2,21E3 3,75E1 2,02E1 2,27E3 3,57E1 6,45E1 3,6E1 9,01E1 2,47E0 MND 3,96E0 4,54E0 2,34E1 2,63E 1 9,39E2 Climate change biogenic kg CO2e 1,06E0 2,72E 2 1,3E 1 9,6E 1 1,61E 1 3,02E 1 1,56E 1 3,77E 1 6,88E 4 MND 1,1E 3 3,3E 3 1,34E0 5,22E 4 6,97E0 Climate change LULUC kg CO2e 1,15E0 1,13E 2 3,7E 3 1,16E0 1,16E 2 2,03E 2 1,2E 2 3,09E 2 2,09E 4 MND 3,34E 4 1,37E 3 2,66E 2 7,82E 5 2,6E 2 Ozone depletion kg CFC11e 1,28E 4 8,81E 6 2,9E 6 1,39E 4 8,32E 6 1,52E 5 8,31E 6 2,07E 5 5,34E 7 MND 8,54E 7 1,07E 6 3,37E 6 1,08E 7 2,5E 5 Acidification mol H+e 1,11E1 1,57E 1 5,04E 2 1,13E1 2,52E 1 3,74E 1 2,98E 1 8,56E 1 2,59E 2 MND 4,14E 2 1,91E 2 2,84E 1 2,5E 3 3,62E0 Eutrophication, aquatic freshwater kg PO4e 1,34E 1 3,05E 4 2,14E 4 1,34E 1 2,79E 4 5,15E 4 2,74E 4 6,71E 4 1E 5 MND 1,6E 5 3,7E 5 1,62E 3 3,18E 6 3,77E 2 Eutrophication, aquatic marine kg Ne 2,15E0 4,74E 2 1,28E 2 2,21E0 7,65E 2 1,13E 1 9,08E 2 2,61E 1 1,14E 2 MND 1,83E 2 5,75E 3 6,27E 2 8,61E 4 7,13E 1 Eutrophication, terrestrial mol Ne 2,46E1 5,24E 1 1,45E 1 2,53E1 8,44E 1 1,25E0 1E0 2,88E0 1,25E 1 MND 2E 1 6,35E 2 7,28E 1 9,48E 3 7,54E0 Photochemical ozone formation kg NMVOCe 1,07E1 1,68E 1 4,32E 2 1,09E1 2,46E 1 3,77E 1 2,85E 1 8,06E 1 3,44E 2 MND 5,51E 2 2,04E 2 1,99E 1 2,75E 3 4,92E0 Abiotic depletion, minerals & metals kg Sbe 3,56E 2 6,39E 4 1,52E 4 3,64E 2 7,42E 4 1,24E 3 8,05E 4 2,15E 3 3,78E 6 MND 6,04E 6 7,75E 5 1,3E 3 2,41E 6 9,32E 4 Abiotic depletion of fossil resources MJ 2,46E4 5,83E2 3,21E2 2,55E4 5,46E2 9,98E2 5,43E2 1,34E3 3,4E1 MND 5,44E1 7,07E1 3,25E2 7,36E0 6,93E3 Water use m3e depr. 1,24E3 2,17E0 3,39E0 1,25E3 1,94E0 3,62E0 1,88E0 4,55E0 6,35E 2 MND 1,02E 1 2,63E 1 4,61E0 3,4E 1 1,33E2 EN 15804+A2 disclaimer for Abiotic depletion and Water use indicators and all optional indicators except Particulate matter and Ionizing radiation, human health: The results of these environmental impact indicators shall be used with care as the uncertainties on these results are high or as there is limited experience with the indicator.Eutrophication aquatic freshwater is reported as kgPO4eq,although the reference given (“EUTREND model, Struijs et al., 2009b, as implemented in ReCiPe”) uses the unit kgPeq.
9 STEEL STRUCTURESEnvironmental Product Declaration created with One Click LCA ADDITIONAL ENVIRONMENTAL IMPACT INDICATORS – EN 15804+A2, PEF Impact category Unit A1 A2 A3 A1-A3 A4 SWE- NORA4- A4-DK A4-UK A5 B1-B7 C1 C2 C3 C4 D Particulate matter Incidence 1,9E 4 3,39E 6 5,16E 7 1,94E 4 2,9E 6 5,53E 6 2,76E 6 6,52E 6 6,85E 7 MND 1,1E 6 4,11E 7 3,57E 6 4,86E 8 6,65E 5 Ionizing radiation, human health kBq U235e 6,36E1 2,55E0 3,15E 1 6,64E1 2,38E0 4,35E0 2,36E0 5,84E0 1,46E 1 MND 2,33E 1 3,09E 1 1,62E0 3,02E 2 1,06E1 Eco toxicity (freshwater) CTUe 9,78E4 4,45E2 1,8E2 9,84E4 4,14E2 7,6E2 4,1E2 1,01E3 2E1 MND 3,19E1 5,4E1 1,38E3 4,65E0 3,07E4 Human toxicity, cancer effects CTUh 1,91E 5 1,14E 8 7,19E 9 1,92E 5 1,18E 8 2,07E 8 1,23E 8 3,17E 8 7,15E 10 MND 1,14E 9 1,38E 9 3,4E 8 1,1E 10 2,05E 7 Human toxicity, non cancer effects CTUh 1,69E 4 5,28E 7 2,19E 7 1,7E 4 4,9E 7 8,99E 7 4,85E 7 1,2E 6 1,76E 8 MND 2,82E 8 6,4E 8 1,62E 6 3,39E 9 1,59E 4 Land use related impacts/soil quality 5,22E3 8,8E2 1,42E1 6,11E3 7,17E2 1,4E3 6,65E2 1,53E3 8,73E 1 MND 1,4E0 1,07E2 8,1E1 1,25E1 1,67E3 EN 15804+A2 disclaimer for Ionizing radiation, human health. This impact category deals mainly with the eventual impact of low dose ionizing radiation on human health of the nuclear fuel cycle. It does not consider effects due to possible nuclear accidents, occupational exposure nor due to radioactive waste disposal in underground facilities. Potential ionizing radiation from the soil, from radon and from some construction materials is also not measured by this indicator USE OF NATURAL RESOURCES Impact category Unit A1 A2 A3 A1-A3 SWEA4 NORA4 A4-DK A4-UK A5 B1-B7 C1 C2 C3 C4 D Renewable PER used as energy MJ 2,48E3 7,33E0 9,54E2 3,45E3 6,56E0 1,23E1 6,39E0 1,55E1 1,84E 1 MND 2,94E 1 8,9E 1 5,1E1 5,95E 2 9,2E1 Renewable PER used as materials MJ 0E0 0E0 0E0 0E0 0E0 0E0 0E0 0E0 0E0 MND 0E0 0E0 0E0 0E0 0E0 Total use of renewable PER MJ 2,48E3 7,33E0 9,54E2 3,45E3 6,56E0 1,23E1 6,39E0 1,55E1 1,84E 1 MND 2,94E 1 8,9E 1 5,1E1 5,95E 2 9,2E1 Non renew. PER used as energy MJ 2,46E4 5,83E2 3,21E2 2,55E4 5,46E2 9,98E2 5,43E2 1,34E3 3,4E1 MND 5,44E1 7,07E1 3,25E2 7,36E0 6,93E3 Non renew. PER used as materials MJ 0E0 0E0 0E0 0E0 0E0 0E0 0E0 0E0 0E0 MND 0E0 0E0 0E0 0E0 0E0 Total use of non renewable PER MJ 2,46E4 5,83E2 3,21E2 2,55E4 5,46E2 9,98E2 5,43E2 1,34E3 3,4E1 MND 5,44E1 7,07E1 3,25E2 7,36E0 6,93E3 Use of secondary materials kg 4,04E2 0E0 0E0 4,04E2 0E0 0E0 0E0 0E0 0E0 MND 0E0 0E0 0E0 0E0 4,39E2 Use of renewable secondary fuels MJ 0E0 0E0 0E0 0E0 0E0 0E0 0E0 0E0 0E0 MND 0E0 0E0 0E0 0E0 0E0 Use of non renew. secondary fuels MJ 0E0 0E0 0E0 0E0 0E0 0E0 0E0 0E0 0E0 MND 0E0 0E0 0E0 0E0 0E0 Use of net fresh water m3 1,63E1 1,21E 1 8,46E 2 1,65E1 1,07E 1 2,02E 1 1,04E 1 2,51E 1 3,01E 3 MND 4,81E 3 1,47E 2 1,33E 1 8,05E 3 6,23E0 PERabbreviationstandsforprimaryenergyresources
10 STEEL STRUCTURESEnvironmental Product Declaration created with One Click LCA END OF LIFE – WASTE Impact category Unit A1 A2 A3 A1-A3 A4 SWE- NORA4- A4-DK A4-UK A5 B1-B7 C1 C2 C3 C4 D Hazardous waste Kg 7,8E2 5,66E 1 3,93E 1 7,81E2 5,55E 1 9,95E 1 5,64E 1 1,42E0 3,66E 2 MND 5,86E 2 6,87E 2 0E0 6,87E 3 1,13E2 Non hazardous waste Kg 6,87E3 6,26E1 1,46E1 6,95E3 5,23E1 1,01E2 4,91E1 1,14E2 3,91E 1 MND 6,26E 1 7,6E0 0E0 5E1 1,27E3 Radioactive waste Kg 5,89E 2 4E 3 4,11E 4 6,33E 2 3,75E 3 6,86E 3 3,74E 3 9,26E 3 2,38E 4 MND 3,81E 4 4,85E 4 0E0 4,87E 5 5,08E 3 END OF LIFE – OUTPUT FLOWS Impact category Unit A1 A2 A3 A1 A3 A4 SWE- NORA4- A4 DK A4 UK A5 B1 B7 C1 C2 C3 C4 D Components for reuse Kg 0E0 0E0 0E0 0E0 0E0 0E0 0E0 0E0 MND MND 0E0 0E0 0E0 0E0 0E0 Materials for recycling Kg 0E0 0E0 1E2 1E2 0E0 0E0 0E0 0E0 MND MND 0E0 0E0 9,5E2 0E0 0E0 Materials for energy recovery Kg 0E0 0E0 0E0 0E0 0E0 0E0 0E0 0E0 MND MND 0E0 0E0 0E0 0E0 0E0 Exported energy MJ 0E0 0E0 0E0 0E0 0E0 0E0 0E0 0E0 MND MND 0E0 0E0 0E0 0E0 0E0 KEY INFORMATION TABLE (RTS) – KEY INFORMATION PER KG OF PRODUCT Impact category Unit A1 A2 A3 A1 A3 A4 SWE- NORA4- A4 DK A4 UK A5 B1 B7 C1 C2 C3 C4 D Climate change total kg CO2e 2,21E0 3,75E 2 2E 2 2,27E0 3,59E 2 6,49E 2 3,61E 2 9,05E 2 2,47E 3 MND 3,96E 3 4,55E 3 2,21E 2 2,64E 4 9,32E 1 Abiotic depletion, minerals & metals kg Sbe 3,56E 5 6,39E 7 1,52E 7 3,64E 5 7,42E 7 1,24E 6 8,05E 7 2,15E 6 3,78E 9 MND 6,04E 9 7,75E 8 1,3E 6 2,41E 9 9,32E 7 Abiotic depletion of fossil resources MJ 2,46E1 5,83E 1 3,21E 1 2,55E1 5,46E 1 9,98E 1 5,43E 1 1,34E0 3,4E 2 MND 5,44E 2 7,07E 2 3,25E 1 7,36E 3 6,93E0 Water use m3e depr. 1,24E0 2,17E 3 3,39E 3 1,25E0 1,94E 3 3,62E 3 1,88E 3 4,55E 3 6,35E 5 MND 1,02E 4 2,63E 4 4,61E 3 3,4E 4 1,33E 1 Use of secondary materials kg 4,04E 1 0E0 0E0 4,04E 1 0E0 0E0 0E0 0E0 0E0 MND 0E0 0E0 0E0 0E0 4,39E 1 Biogenic carbon content in product kg C N/A N/A 0E0 0E0 N/A N/A N/A N/A N/A N/A N/A N/A N/A N/A N/A Biogenic carbon content in packaging kg C N/A N/A 0E0 0E0 N/A N/A N/A N/A N/A N/A N/A N/A N/A N/A N/A
11 STEEL STRUCTURESEnvironmental Product Declaration created with One Click LCA SCENARIO DOCUMENTATION Manufacturing energy scenario documentation Scenario parameter Value Electricity data source and quality Electricity production, hydro, run of river (Reference product: electricity, high voltage) Ecoinvent v3.6, Latvia, year: 2020 Electricity CO2e / kWh 0.004 District heating data source and quality Heat and power co generation, natural gas, combined cycle power plant, 400mw electrical (Reference product: heat, district or industrial, natural gas), Ecoinvent v3.6, Latvia, year: 2020 District heating CO2e / kWh 0.0964 End of life scenario documentation Scenario parameter Value Collection process kg collected separately 1000 Collection process kg collected with mixed waste 0 Recovery process kg for re use 0 Recovery process kg for recycling 950 Recovery process kg for energy recovery 0 Disposal (total) – kg for final deposition 50 Scenario assumptions e.g. transportation End of life product is transported 50 km with an average lorry. Transport scenario documentation Scenario parameter, Sweden Value A4 Truck >32 metric ton Euro 5, kgCO2e / tonkm 0.0909 A4 Ferry, kgCO2e / tonkm 0.0203 A4 average transport distance, Truck, km 335 A4 average transport distance, Ferry, km 275 Scenario parameter, United Kingdom Value A4 Truck >32 metric ton Euro 5, kgCO2e / tonkm 0.0909 A4 Ferry, kgCO2e / tonkm 0.0203 A4 average transport distance, Truck, km 710 A4 average transport distance, Ferry, km 1300 Scenario parameter, Denmark Value A4 Truck >32 metric ton Euro 5, kgCO2e / tonkm 0.0909 A4 Ferry, kgCO2e / tonkm 0.0203 A4 average transport distance, Truck, km 310 A4 average transport distance, Ferry, km 400 Scenario parameter, Norway Value A4 Truck >32 metric ton Euro 5, kgCO2e / tonkm 0.0909 A4 Ferry, kgCO2e / tonkm 0.0203 A4 average transport distance, Truck, km 655 A4 average transport distance, Ferry, km 275
12 STEEL STRUCTURESEnvironmental Product Declaration created with One Click LCA BIBLIOGRAPHY ISO 14025:2010 Environmental labels and declarations Type III environmental declarations. Principles and procedures. ISO 14040:2006 Environmental management. Life cycle assessment. Principles and frameworks. ISO 14044:2006 Environmental management. Life cycle assessment. Requirements and guidelines. Ecoinvent database v3.6 and One Click LCA database EN 15804:2012+A2:2019 Sustainability in construction works Environmental product declarations – Core rules for the product category of construction products. RTS PCR EN 15804:2019 RTS PCR in line with EN 15804+A2. Published by the Building Information Foundation RTS 1.6.2020. World Steel Association, 2020. Metal waste processing. Erlandsson & Petersson 2015. Energy use in demolition and processing of the steel used for crane work. ABOUT THE MANUFACTURER
activities
EPD author Ritvars Višs, RK
RK Metāls group is one of the largest manufacturers of steel building structures and products of machinery solutions in the Baltics. The main areas of include steel structures, steel machinery project and European in stainless steel and aluminium the high quality standards maintained at RK Metāls. and Environment Management system of the company is certified according to the of the international standards 9001 and ISO 14001. managed according to the of the international standard ISO 45001. Metāls Metāls,
processing confirm
HSE processes are
logistics.
requirements
design,
development, production, installation
Quality
ISO
EPD AUTHOR AND CONTRIBUTORS Manufacturer RK
Lauktehnikas street 12, Grobina, Latvia, LV3430 EPD verifier Silvia Vilčeková, Silcert, s.r.o. EPD operatorprogram The Building Information Foundation RTS Background data This EPD is based on Ecoinvent 3.6 (cut off) and One Click LCA databases LCA software The LCA and EPD have been created using One Click LCA Pre Verified EPD Generator for Primary Steel and Aluminium and all Metal Based Products
solutions,
requirements
certificates
13 STEEL STRUCTURESEnvironmental Product Declaration created with One Click LCA ANNEX : ENVIRONMENTAL IMPACTS – EN 15804+A1, CML / ISO 21930 Impact category Unit A1 A2 A3 A1-A3 SWEA4- NORA4- DKA4- UKA4- A5 B7B1- C1 C2 C3 C4 D Global warming potential kg CO2e 2,13E3 3,71E1 1,97E1 2,19E3 3,6E1 6,51E1 3,63E1 9,09E1 2,45E0 MND 3,93E0 4,5E0 2,31E1 2,58E 1 8,93E2 Depletion of stratospheric ozone kg CFC11e 1,15E 4 7E 6 2,21E 6 1,24E 4 6,62E 6 1,21E 5 6,62E 6 1,65E 5 4,23E 7 MND 6,76E 7 8,49E 7 2,86E 6 8,59E 8 2,21E 5 Acidification kg SO2e 8,74E0 7,62E 2 3,39E 2 8,85E0 1,58E 1 2,17E 1 1,96E 1 5,83E 1 3,65E 3 MND 5,84E 3 9,25E 3 1,77E 1 1,04E 3 2,84E0 Eutrophication kg PO4 3e 5,78E0 1,54E 2 1,09E 2 5,81E0 2,66E 2 3,85E 2 3,2E 2 9,3E 2 6,43E 4 MND 1,03E 3 1,87E 3 7,21E 2 2,02E 4 1,57E0 Photochemical ozone formation kg C2H4e 1,23E0 4,83E 3 2,19E 3 1,24E0 6,57E 3 1,03E 2 7,48E 3 2,08E 2 3,76E 4 MND 6,01E 4 5,86E 4 8,28E 3 7,64E 5 7,35E 1 Abiotic depletion of non fossil res. kg Sbe 3,56E 2 6,39E 4 1,52E 4 3,64E 2 7,42E 4 1,24E 3 8,05E 4 2,15E 3 3,78E 6 MND 6,04E 6 7,75E 5 1,3E 3 2,41E 6 9,32E 4 Abiotic depletion of fossil resources MJ 2,46E4 5,83E2 3,21E2 2,55E4 5,46E2 9,98E2 5,43E2 1,34E3 3,4E1 MND 5,44E1 7,07E1 3,25E2 7,36E0 6,93E3 ANNEX : ENVIRONMENTAL IMPACTS - TRACI 2.1. / ISO 21930 Impact category Unit A1 A2 A3 A1-A3 A4 SWE- NORA4- A4-DK A4-UK A5 B1-B7 C1 C2 C3 C4 D Global warming potential kg CO2e 2,09E3 3,71E1 1,97E1 2,15E3 3,56E1 6,44E1 3,59E1 8,98E1 2,44E0 MND 3,91E0 4,5E0 2,3E1 2,57E 1 8,66E2 Ozone depletion kg CFC11e 1,55E 4 9,33E 6 3,04E 6 1,68E 4 8,81E 6 1,61E 5 8,81E 6 2,19E 5 5,64E 7 MND 9,02E 7 1,13E 6 3,74E 6 1,15E 7 3,2E 5 Acidification kg SO2e 9,28E0 1,37E 1 4,34E 2 9,46E0 2,19E 1 3,25E 1 2,6E 1 7,45E 1 2,37E 2 MND 3,79E 2 1,66E 2 2,39E 1 2,22E 3 3,02E0 Eutrophication kg Ne 1,43E0 1,93E 2 3,81E 3 1,45E0 2,18E 2 3,67E 2 2,34E 2 6,21E 2 2,09E 3 MND 3,34E 3 2,34E 3 2,34E 2 2,65E 4 4,52E 1 Photochemical Smog Formation kg O3e 1,29E2 3,01E0 8,11E 1 1,33E2 4,86E0 7,19E0 5,77E0 1,66E1 7,27E 1 MND 1,16E0 3,65E 1 3,95E0 5,47E 2 4,08E1 Depletion of non renewable energy MJ 1,38E3 8,35E1 5,03E1 1,51E3 7,84E1 1,43E2 7,81E1 1,94E2 5,03E0 MND 8,05E0 1,01E1 3,36E1 1,07E0 1,1E2