
PRECAST CONCRETE FILIGREE SLABSEnvironmental Product Declaration created with One Click LCA PRODUCTENVIRONMENTALDECLARATION IN ACCORDANCE WITH EN 15804+A2 & ISO 14025 / ISO 21930 PRECASTFILIGREECONCRETESLABS UPB AS


2 PRECAST CONCRETE FILIGREE SLABSEnvironmental Product Declaration created with One Click LCA GENERAL INFORMATION MANUFACTURER INFORMATION Manufacturer Dzelzsbetons MB (DzMB) Address Cukura street 34, Liepaja, Latvia, LV 3414 Contact details mbbetons@mbbetons.lv Website https://www.mbbetons.lv/en PRODUCT IDENTIFICATION Product name Precast concrete filigree slabs Place(s) productionof Latvia, Liepaja EPD INFORMATION EPDs of construction products may not be comparable if they do not comply with EN 15804 and if they are not compared in a building context. EPD operatorprogram The Building Information Foundation RTS sr Malminkatu 16 A, 00100 Helsinki, Finland http://cer.rts.fi EPD standards This EPD is in accordance with EN 15804+A2 and ISO 14025 standards. Product category rules CEN standard 15804+A2 serves as the core PCR, RTS PCR (Finnish version, 1.6.2020) EPD author AS UPB, Dzintaru street 17, Liepaja, Latvia EPD verification Independent verification of this EPD and data, according to ISO 14025: Internal certification External verification Verification date 24.2.2021 EPD verifier Silvia Vilčeková, Silcert, s.r.o. EPD number RTS_93_21 ECO Platform nr. Publishing date 11.3.2021 EPD valid until 24.2.2026
The filigree slabs are widely used in residential and non residential buildings for the construction of floors and roofs. The increased building speed and minimised health and safety risks at the building site are just a few of the benefits of using precast concrete products when compared to in situ construction methods. SPECIFICATIONS
equipment
requirements.
TECHNICAL
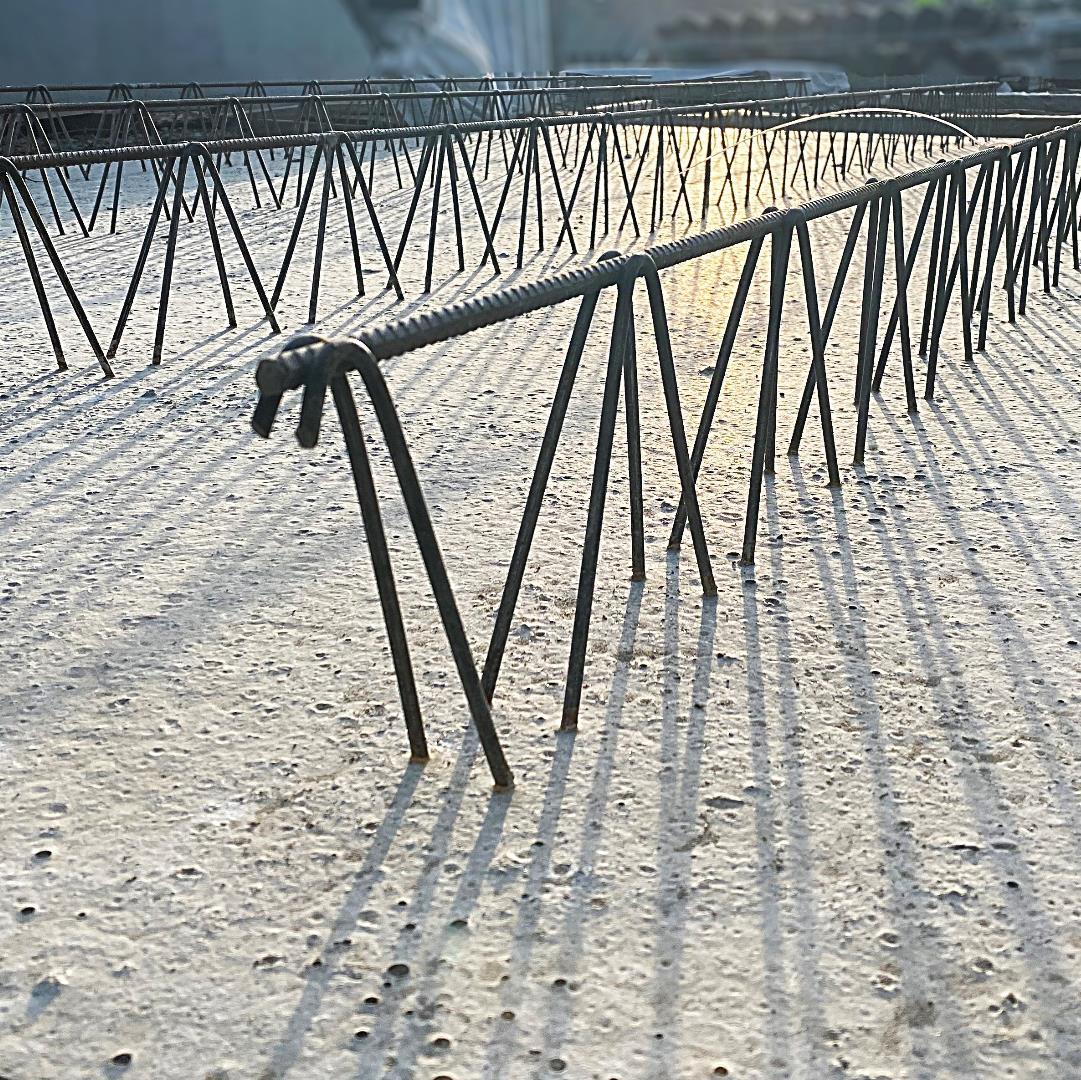
3 PRECAST CONCRETE FILIGREE SLABSEnvironmental Product Declaration created with One Click LCA PRODUCT INFORMATION PRODUCT DESCRIPTION Precast filigree slab is a plate shaped element, composed of a layer of concrete and rebar. PRODUCT APPLICATION
TheC30/37.diameter
raw materials, inspection of
PRODUCT STANDARDS Product is produced in accordance with EN 206, EN 13747, EN 13369 standards. The quality of the products is ensured by taking regular quality control measures including, but not limited to the testing of the manufacturing and thorough inspection of the final product. project The product
For precast filigree slabs, concrete with various different strength classes can be used, but the minimum concrete strength class is of steel reinforcement used in precast filigree slab elements normally varies between 8 and 30 mm. However, it is not limited to these sizes as for certain projects the required adjustments can be made.
PHYSICAL PROPERTIES OF THE PRODUCT Physical properties of the product are dependent on the exact
is available in various sizes and thicknesses. ADDITIONAL TECHNICAL INFORMATION Further information can be found at https://www.mbbetons.lv/en. PRODUCT RAW MATERIAL COMPOSITION Material Quantity,mass[%] Usability Origin of the materialsrawRenewable renewableNon Recycled Sand 33.0 X EU Gravel 40.4 X EU powderLimestone 0.8 X EU Cement 13.7 X EU Fly ash 0.4 X X EU Water 7.4 X EU Reinforcement 4.2 X X Non EU Other 0.1 X EU
The product does not contain any REACH SVHC substances in amounts greater than 0,1 % (1000 ppm).
PRODUCT USE AND MAINTENANCE (B1-B7)
4 PRECAST CONCRETE FILIGREE SLABSEnvironmental Product Declaration created with One Click LCA PRODUCT RAW MATERIAL MAIN COMPOSITION Raw material category Amount, wt% Material origin Metals 4.2 EU & non EU Minerals 88.3 EU Water 7.4 EU Fossil materials 0 N/A Bio based materials 0 N/A SUBSTANCES, REACH - VERY HIGH CONCERN
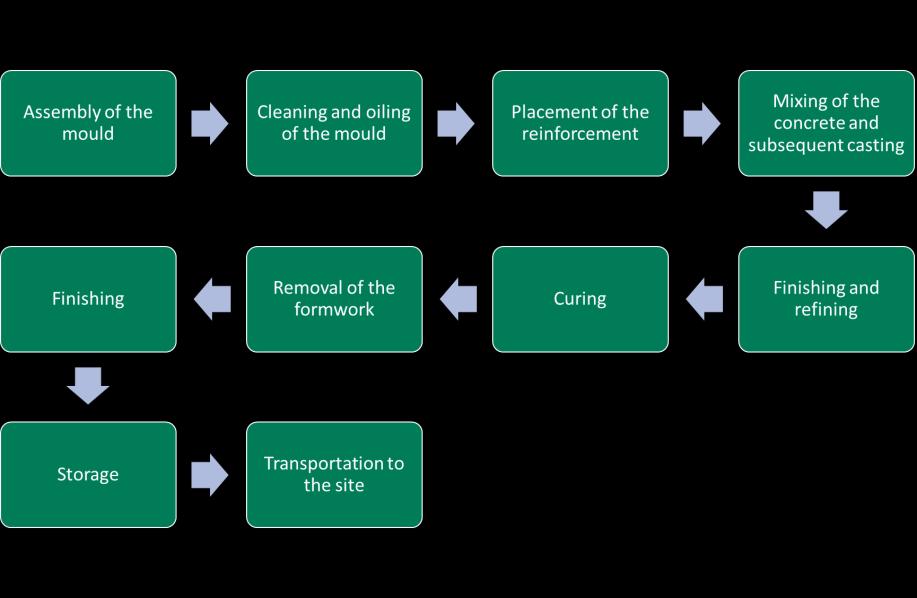
The prefabricated filigree concrete slab manufacturing begins with the preparation of the mould. This includes assembly of the mould depending on the element dimensions, cleaning of the mould and application of the form oil. The reinforcement and steel details are then put in place according to the technical element drawing. Wet concrete is then poured into the mould and vibrated into place, and surface finished. After casting, the slab is covered and cured. After curing the slab is then demoulded and moved out of the factory. Eventually, it is transported to the construction site.
PRODUCT END OF LIFE (C1-C4, D) At the end of life, in the demolition phase, 100% of the waste is assumed to be collected as separate construction waste (C1). All of the end-of-life product is assumed to be sent to the closest facilities 100%(C2). of steel and 92% concrete is recycled (C3) and the remaining is sent to a local landfill for disposal (C4). Due to the recycling potential of reinforcement steel and concrete, the end of life product is converted into recycled raw materials (D).
PRODUCT LIFE-CYCLE MANUFACTURING AND PACKAGING (A1-A3)
TRANSPORT AND INSTALLATION (A4-A5)
Transportation impacts occurred from final products delivery to construction sites (A4) cover fuel direct exhaust emissions, environmental impacts of fuel production, as well as related infrastructure emissions. Scenario A5 is modelled as installation of a typical concrete product in a building. Fossil fuel for building machinery and auxiliary materials are included.
This EPD does not cover use phase. Air, soil and water impacts during the use phase have not been studied.
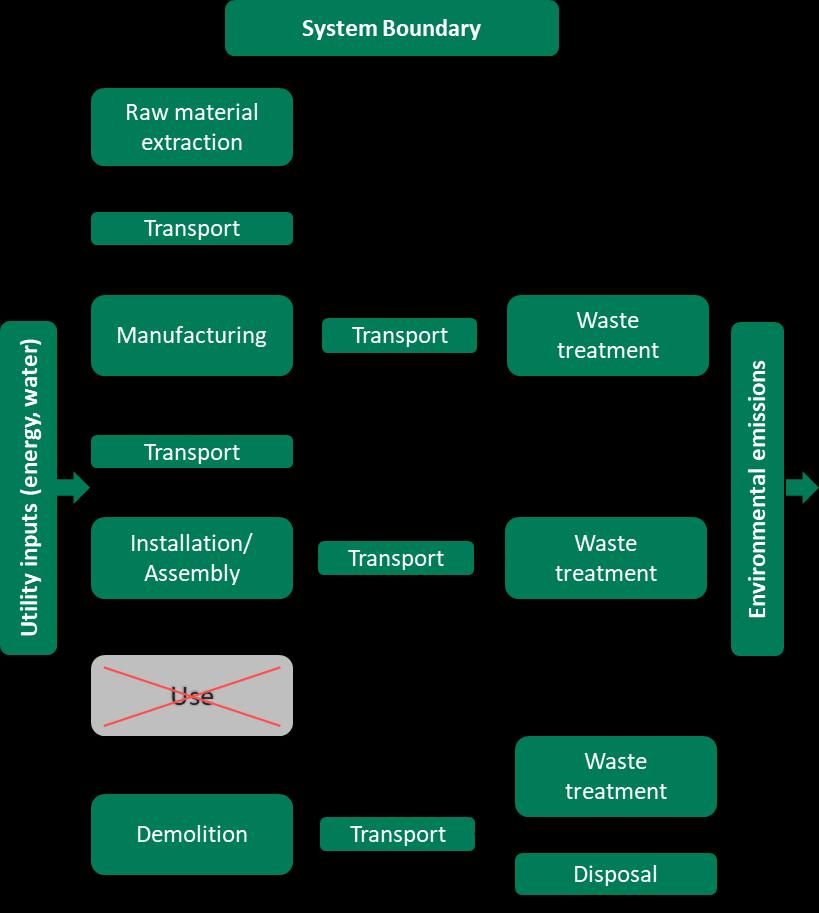
5 PRECAST CONCRETE FILIGREE SLABSEnvironmental Product Declaration created with One Click LCA MANUFACTURING PROCESS LIFE-CYCLE ASSESSMENT LIFE-CYCLE ASSESSMENT INFORMATION Period for data Manufacturer data for the calendar year 2019 is used. DECLARED AND FUNCTIONAL UNIT Declared unit 1 tonne Mass per declared unit 1000 kg BIOGENIC CARBON CONTENT Neither the product itself nor the packaging contains biogenic carbon, so the biogenic carbon content at the factory gate is 0 kg. Biogenic carbon content in product, kg C Biogenic carbon content in packaging, kg C SYSTEM BOUNDARY This EPD covers cradle to gate with modules C1 C4 and module D; A1 (Raw material supply), A2 (Transport) and A3 (Manufacturing), A4 (Transport), A5 (Installation) as well as C1 (Deconstruction), C2 (Transport at end of life), C3 (Waste processing) and C4 (Disposal). In addition, module D - benefits and loads beyond the system boundary is included. Product stage Assemblystage Use stage End of life stage Beyond boundariessystemthe A1 A2 A3 A4 A5 B1 B2 B3 B4 B5 B6 B7 C1 C2 C3 C4 D D D x x x x x MND MND MND MND MND MND MND x x x x MNR x x materialsRaw Transport Manufacturing Transport Assembly Use Maintenance Repair Replacement Refurbishment useenergyOperational usewaterOperational r./demol.Deconst Transport processingWaste Disposal Reuse Recovery Recycling Modulesnotdeclared=MND.Modulesnotrelevant=MNR.
Packagingstages.
does not include any biogenic carbon as product is only packaged using reusable tie down straps. The production of capital equipment, construction activities, and infrastructure, maintenance and operation of capital equipment, personnel related activities, energy, and water use related to company management and sales activities are excluded. The modules B1 B7 have not been calculated nor included in the LCA calculations as that is not mandatory for this LCA report.
The study does not exclude any modules or processes which are stated mandatory in the EN 15804:2012+A2:2019 and RTS PCR. The study does not exclude any hazardous materials or substances.
The study includes all major raw material and energy consumption. All inputs and outputs of the unit processes which data are available for are included in the calculation. There is no neglected unit process more than 1% of total mass and energy flows. The total neglected input and output flows do also not exceed 5% of energy usage or mass. The life cycle analysis includes all industrial processes from raw material acquisition to production, distribution and end-of-life
6
PRECAST CONCRETE FILIGREE SLABSEnvironmental Product Declaration created with One Click LCA
ALLOCATION, ESTIMATES AND ASSUMPTIONS
CUT-OFF CRITERIA
The allocation is made in accordance with the provisions of EN 15804. Allocation is based on the annual production rate. Heat, electricity and other energy use in production, are calculated as a weighted average per produced tonne of all products using yearly production data and rate for 2019. Carbonation is not taken into account in the calculations. Carbonation is a natural process occurring when carbon dioxide is emitted during cement production is rebound to the concrete during the use and
Module A4: Transportation from the manufacturing plants to the building site has been calculated using a most likely scenario for the export of the declared unit of one tonne to each of the market countries separately - Sweden, Norway, Denmark, United Kingdom.
The average distance of transportation from the production plant to building sites in Sweden, Norway, Denmark and UK and the fill rate to be 100%: For transportation to building sites in Sweden it is assumed that 335 km of the total distance are covered by a lorry and it is assumed that 275 km of the total distance are covered by a ferry.
PRECAST CONCRETE FILIGREE SLABSEnvironmental Product Declaration created with One Click LCA end of life stages of a building. As the raw material use for each of the products produced in the factory is recorded to a high standard of accuracy and precision, the raw material data for each of the products produced is processed. From the data, the most likely product size, thickness and reinforcement amount is chosen and thus it is assumed to be the most representative product of the annually produced products of the same kind. Since the production and transportation processes are similar for all of the products produced in the factory, the energy consumption is allocated according to the annual production of the declared unit to the total annual production at the factory. The data on generated waste is also recorded separately for each of the products as accurately as possible. Thus, the generated waste is allocated per declared unit. The output is fixed to 1000 kg and the corresponding amount of product is used in calculations.
For transportation to building sites in Norway it is assumed that 655 km of the total distance are covered by a lorry and it is assumed that 275 km of the total distance are covered by a ferry. For transportation to building sites in Denmark it is assumed that 310 km of the total distance are covered by a lorry and it is assumed that 400 km of the total distance are covered by a ferry. For transportation to building sites in the United Kingdom it is assumed that 710 km of the total distance are covered by a lorry and it is assumed that 1300 km of the total distance are covered by a Transportationferry. does not cause losses as products are packaged properly. Packaging does not include wooden pallets. Bulk density varies depending on product type and thickness. Also, volume capacity utilisation factor is assumed to be 1 for the nested packaged Moduleproducts.A5: Assembly/Installation is modelled as installation of a typical concrete product in a building. Fossil fuel for building machinery and auxiliary materials are included. It is assumed that the waste is insignificant during the assembly process. The assembly process is also assumed to be similar across
Module A1: Raw material composition is an average value calculated using total annual material consumption for the product by mass within the studied year 2019.
7
This LCA study is conducted in accordance with all methodological considerations, such as performance, system boundaries, data quality, allocation procedures, and decision rules to evaluate inputs and outputs. All estimations and assumptions are given below:
PRECAST CONCRETE FILIGREE SLABSEnvironmental Product Declaration created with One Click LCA all of the market countries. The energy required for the installation process as well as the auxiliary materials are taken as the industry average values for the precast element assembly process.
Module C2: It is estimated that there is no mass loss during the use of the product, therefore the end of life product is assumed that it has the same weight with the declared product. All of the end of life product is assumed to be sent to the closest facilities such as recycling and landfill. Transportation distance to the closest disposal area is estimated as 50 km and the transportation method is lorry which is the most common.
Module C4: The remaining 8% of concrete are assumed to be sent to the Modulelandfill.D:The recycled end of life product is assumed to be converted into a raw material after recycling.
Module C3: It is assumed that 92% of the concrete waste and 100% of the steel waste is recycled. This assumption is based on information from a study by T. Ideon and M. Osjamets (2010) The process losses of the waste treatment plant are assumed to be negligible. It is assumed that the end of life scenario is similar across all of the target market countries.
Module A2, A4 & C2: Vehicle capacity utilization volume factor is assumed to be 1 which means full load. In reality, it may vary but as the role of transportation emission in total results is small, the variation in load is assumed to be negligible. Empty returns are not taken into account as it is assumed that a return trip is used by the transportation company to serve the needs of other clients.
8
Module C1: Energy consumption of a demolition process is on the average 10 kWh/m2 (Bozdağ, Ö & Seçer, M. 2007). Basing on a Level(s) project, an average mass of a reinforced concrete building is about 1000 kg/m2. Therefore, energy consumption demolition is 10 kWh/1000 kg = 0,01 kWh/kg. The source of energy is diesel fuel used by work machines.
9 PRECAST CONCRETE FILIGREE SLABSEnvironmental Product Declaration created with One Click LCA ENVIRONMENTAL IMPACT DATA NOTE : ENVIRONMENTAL IMPACTS - EN 15804+A1, CML / ISO 21930 AND ENVIRONMENTAL IMPACTS –TRACI 2.1./ ISO 21930 ARE PRESENTED IN ANNEX. CORE ENVIRONMENTAL IMPACT INDICATORS – EN 15804+A2, PEF Impact category Unit A1 A2 A3 A1-A3 A4 SWE- NORA4- A4-DK A4-UK A5 B1-B7 C1 C2 C3 C4 D Climate change total kg CO2e 1,47E2 9,8E0 3,4E0 1,6E2 3,6E1 6,51E1 3,63E1 9,09E1 1,46E1 MND 3,28E0 6,35E0 4,65E0 4,01E 1 8,31E0 Climate change fossil kg CO2e 1,45E2 9,72E0 3,4E0 1,58E2 3,57E1 6,45E1 3,6E1 9,01E1 1,41E1 MND 3,27E0 6,32E0 4,52E0 3,98E 1 8,27E0 Climate change biogenic kg CO2e 1,85E0 7,27E 2 5,62E 3 1,93E0 1,61E 1 3,02E 1 1,56E 1 3,77E 1 4,68E 1 MND 5,54E 3 3,76E 2 1,3E 1 2,53E 3 2,41E 2 Climate change LULUC kg CO2e 1,01E 1 4E 3 1,6E 4 1,06E 1 1,16E 2 2,03E 2 1,2E 2 3,09E 2 5,34E 3 MND 2,79E 4 2,25E 3 1,47E 3 1,2E 4 9,42E 3 Ozone depletion kg CFC11e 5,15E 6 2,11E 6 5,22E 7 7,78E 6 8,32E 6 1,52E 5 8,31E 6 2,07E 5 1,48E 6 MND 7,12E 7 1,46E 6 9,1E 7 1,67E 7 6,87E 7 Acidification mol H+e 4,32E 1 5,47E 2 5,63E 3 4,93E 1 2,52E 1 3,74E 1 2,98E 1 8,56E 1 8E 2 MND 3,45E 2 2,62E 2 4,94E 2 3,85E 3 5,14E 2 Eutrophication, aquatic freshwater kg PO4e 4E 3 9,95E 5 7,62E 6 4,1E 3 2,79E 4 5,15E 4 2,74E 4 6,71E 4 2,11E 4 MND 1,33E 5 5,5E 5 8,58E 5 4,9E 6 5,07E 4 Eutrophication, aquatic marine kg Ne 1,05E 1 1,92E 2 2,01E 3 1,26E 1 7,65E 2 1,13E 1 9,08E 2 2,61E 1 2,86E 2 MND 1,52E 2 7,77E 3 1,91E 2 1,33E 3 1,08E 2 Eutrophication, terrestrial mol Ne 1,18E0 2,11E 1 2,16E 2 1,41E0 8,44E 1 1,25E0 1E0 2,88E0 3,18E 1 MND 1,67E 1 8,59E 2 2,11E 1 1,46E 2 1,4E 1 Photochemical ozone formation kg NMVOCe 3,44E 1 6,1E 2 6,53E 3 4,11E 1 2,46E 1 3,77E 1 2,85E 1 8,06E 1 8,64E 2 MND 4,59E 2 2,7E 2 5,79E 2 4,24E 3 3,86E 2 Abiotic depletion, minerals & metals kg Sbe 1,17E 3 2,06E 4 3,68E 6 1,38E 3 7,42E 4 1,24E 3 8,05E 4 2,15E 3 6,9E 4 MND 5,03E 6 1,59E 4 6,28E 5 3,71E 6 8,05E 4 Abiotic depletion of fossil resources MJ 9,27E2 1,44E2 5,68E1 1,13E3 5,46E2 9,98E2 5,43E2 1,34E3 1,24E2 MND 4,54E1 9,72E1 6,29E1 1,13E1 1,12E2 Water use m3e depr. 2,5E1 5,97E 1 2,14E 1 2,58E1 1,94E0 3,62E0 1,88E0 4,55E0 1,48E0 MND 8,46E 2 3,45E 1 2,94E 1 5,24E 1 1,32E1 EN 15804+A2 disclaimer for Abiotic depletion and Water use indicators and all optional indicators except Particulate matter and Ionizing radiation, human health: The results of these environmental impact indicators shall be used with care as the uncertainties on these results are high or as there is limited experience with the indicator. Eutrophication aquatic freshwater is reported as kgPO4eq,although the reference given (“EUTREND model, Struijs et al., 2009b, as implemented in ReCiPe”) uses the unit kgPeq.
10 PRECAST CONCRETE FILIGREE SLABSEnvironmental Product Declaration created with One Click LCA ADDITIONAL ENVIRONMENTAL IMPACT INDICATORS – EN 15804+A2, PEF Impact category Unit A1 A2 A3 A1-A3 A4 SWE- NORA4- A4-DK A4-UK A5 B1-B7 C1 C2 C3 C4 D Particulate matter Incidence 6,25E 6 7,85E 7 1,38E 7 7,17E 6 2,9E 6 5,53E 6 2,76E 6 6,52E 6 1,5E 6 MND 9,14E 7 4,92E 7 4,63E 6 7,48E 8 6,26E 7 Ionizing radiation, human health kBq U235e 4,91E0 6,2E 1 3,59E 2 5,56E0 2,38E0 4,35E0 2,36E0 5,84E0 4,82E 1 MND 1,94E 1 4,25E 1 2,79E 1 4,65E 2 6,52E 1 Eco toxicity (freshwater) CTUe 1,77E3 1,21E2 7,45E0 1,9E3 4,14E2 7,6E2 4,1E2 1,01E3 2,19E2 MND 2,66E1 7,59E1 8,95E1 7,16E0 1,6E2 Human toxicity, cancer effects CTUh 4,53E 7 4,38E 9 4,24E 10 4,58E 7 1,18E 8 2,07E 8 1,23E 8 3,17E 8 4,31E 9 MND 9,53E 10 2,15E 9 2,52E 9 1,69E 10 6,72E 9 Human toxicity, non cancer effects CTUh 1,4E 5 1,37E 7 8,27E 9 1,42E 5 4,9E 7 8,99E 7 4,85E 7 1,2E 6 1,23E 7 MND 2,35E 8 8,71E 8 9,67E 8 5,23E 9 1,52E 8 Land use related impacts/soil quality 1,71E2 1,26E2 6,66E 1 2,97E2 7,17E2 1,4E3 6,65E2 1,53E3 1,18E2 MND 1,16E0 1,08E2 4,83E0 1,93E1 7,4E1 EN 15804+A2 disclaimer for Ionizing radiation, human health. This impact category deals mainly with the eventual impact of low dose ionizing radiation on human health of the nuclear fuel cycle. It does not consider effects due to possible nuclear accidents, occupational exposure nor due to radioactive waste disposal in underground facilities. Potential ionizing radiation from the soil, from radon and from some construction materials is also not measured by this indicator USE OF NATURAL RESOURCES Impact category Unit A1 A2 A3 A1 A3 A4 SWE- NORA4- A4 DK A4 UK A5 B1 B7 C1 C2 C3 C4 D Renewable PER used as energy MJ 1,22E2 2,44E0 4,97E1 1,74E2 6,56E0 1,23E1 6,39E0 1,55E1 7,99E0 MND 2,45E 1 1,38E0 2,52E0 9,17E 2 8,81E0 Renewable PER used as materials MJ 0E0 0E0 0E0 0E0 0E0 0E0 0E0 0E0 0E0 MND 0E0 0E0 0E0 0E0 0E0 Total use of renewable PER MJ 1,22E2 2,44E0 4,97E1 1,74E2 6,56E0 1,23E1 6,39E0 1,55E1 7,99E0 MND 2,45E 1 1,38E0 2,52E0 9,17E 2 8,81E0 Non renew. PER used as energy MJ 9,27E2 1,44E2 5,68E1 1,13E3 5,46E2 9,98E2 5,43E2 1,34E3 1,24E2 MND 4,54E1 9,72E1 6,29E1 1,13E1 1,12E2 Non renew. PER used as materials MJ 0E0 0E0 0E0 0E0 0E0 0E0 0E0 0E0 0E0 MND 0E0 0E0 0E0 0E0 0E0 Total use of non renewable PER MJ 9,27E2 1,44E2 5,68E1 1,13E3 5,46E2 9,98E2 5,43E2 1,34E3 1,24E2 MND 4,54E1 9,72E1 6,29E1 1,13E1 1,12E2 Use of secondary materials kg 3,81E1 0E0 0E0 3,81E1 0E0 0E0 0E0 0E0 0E0 MND 0E0 0E0 0E0 0E0 4,66E 1 Use of renewable secondary fuels MJ 0E0 0E0 0E0 0E0 0E0 0E0 0E0 0E0 0E0 MND 0E0 0E0 0E0 0E0 0E0 Use of non renew. secondary fuels MJ 0E0 0E0 0E0 0E0 0E0 0E0 0E0 0E0 0E0 MND 0E0 0E0 0E0 0E0 0E0 Use of net fresh water m3 1,7E0 2,85E 2 2,79E 2 1,75E0 1,07E 1 2,02E 1 1,04E 1 2,51E 1 2,11E 1 MND 4,01E 3 1,84E 2 1,01E 2 1,24E 2 1,05E0 ERabbreviationstandsforprimaryenergyresources
11 PRECAST CONCRETE FILIGREE SLABSEnvironmental Product Declaration created with One Click LCA END OF LIFE – WASTE Impact category Unit A1 A2 A3 A1-A3 A4 SWE- NORA4- A4-DK A4-UK A5 B1 - B7 C1 C2 C3 C4 D Hazardous waste Kg 1,12E1 2,16E 1 2,84E 2 1,15E1 5,55E 1 9,95E 1 5,64E 1 1,42E0 3,25E 1 MND 4,88E 2 1,01E 1 0E0 1,06E 2 6,64E 1 Non hazardous waste Kg 1,67E2 1,07E1 4,58E 1 1,79E2 5,23E1 1,01E2 4,91E1 1,14E2 9,87E0 MND 5,22E 1 8,41E0 0E0 7,7E1 2,36E1 Radioactive waste Kg 3,42E 3 9,63E 4 5,55E 5 4,44E 3 3,75E 3 6,86E 3 3,74E 3 9,26E 3 6,86E 4 MND 3,18E 4 6,65E 4 0E0 7,5E 5 4,75E 4 END OF LIFE – OUTPUT FLOWS Impact category Unit A1 A2 A3 A1-A3 A4 SWE- NORA4- A4-DK A4-UK A5 B1- B7 C1 C2 C3 C4 D Components for reuse Kg 0E0 0E0 0E0 0E0 0E0 0E0 0E0 0E0 0E0 MND 0E0 0E0 0E0 0E0 0E0 Materials for recycling Kg 0E0 0E0 1,8E1 1,8E1 0E0 0E0 0E0 0E0 0E0 MND 0E0 0E0 9,23E2 0E0 0E0 Materials for energy recovery Kg 0E0 0E0 0E0 0E0 0E0 0E0 0E0 0E0 0E0 MND 0E0 0E0 0E0 0E0 0E0 Exported energy MJ 0E0 0E0 0E0 0E0 0E0 0E0 0E0 0E0 0E0 MND 0E0 0E0 0E0 0E0 0E0 KEY INFORMATION TABLE (RTS) – KEY INFORMATION PER KG OF PRODUCT Impact category Unit A1 A2 A3 A1-A3 A4 SWE- NORA4- A4-DK A4-UK A5 B1-B7 C1 C2 C3 C4 D Climate change total kg CO2e 1,47E 1 9,8E 3 3,4E 3 1,6E 1 3,59E 2 6,49E 2 3,61E 2 9,05E 2 1,46E 2 MND 3,28E 3 6,35E 3 4,65E 3 4,01E 4 8,31E 3 Abiotic depletion, minerals & metals kg Sbe 1,17E 6 2,06E 7 3,68E 9 1,38E 6 7,42E 7 1,24E 6 8,05E 7 2,15E 6 6,9E 7 MND 5,03E 9 1,59E 7 6,28E 8 3,71E 9 8,05E 7 Abiotic depletion of fossil resources MJ 9,27E 1 1,44E 1 5,68E 2 1,13E0 5,46E 1 9,98E 1 5,43E 1 1,34E0 1,24E 1 MND 4,54E 2 9,72E 2 6,29E 2 1,13E 2 1,12E 1 Water use m3e depr. 2,5E 2 5,97E 4 2,14E 4 2,58E 2 1,94E 3 3,62E 3 1,88E 3 4,55E 3 1,48E 3 MND 8,46E 5 3,45E 4 2,94E 4 5,24E 4 1,32E 2 Use of secondary materials kg 3,81E 2 0E0 0E0 3,81E 2 0E0 0E0 0E0 0E0 0E0 MND 0E0 0E0 0E0 0E0 4,66E 4 Biogenic carbon content in product kg C N/A N/A 0E0 0E0 N/A N/A N/A N/A N/A N/A N/A N/A N/A N/A N/A Biogenic carbon content in packaging kg C N/A N/A 0E0 0E0 N/A N/A N/A N/A N/A N/A N/A N/A N/A N/A N/A
12 PRECAST CONCRETE FILIGREE SLABSEnvironmental Product Declaration created with One Click LCA SCENARIO DOCUMENTATION Manufacturing energy scenario documentation Scenario parameter Value Electricity data source and quality (DzMB) Electricity production, hydro, run of river (Reference product: electricity, high voltage) Ecoinvent v3.6, Latvia, year: 2020 Electricity CO2e / kWh 0.004 District heating data source and quality (DzMB) Heat and power co generation, natural gas, combined cycle power plant, 400mw electrical (Reference product: heat, district or industrial, natural gas), Ecoinvent v3.6, Latvia, year: 2020 District heating CO2e / kWh 0.0964 Transport scenario documentation Scenario parameter, Sweden Value A4 Truck >32 metric ton Euro 5, kgCO2e / tonkm 0.0909 A4 Ferry, kgCO2e / tonkm 0.0203 A4 average transport distance, Truck, km, Sweden 335 A4 average transport distance, Ferry, km, Sweden 275 Scenario parameter, Uited Kingdom Value A4 Truck >32 metric ton Euro 5, kgCO2e / tonkm 0.0909 A4 Ferry, kgCO2e / tonkm 0.0203 A4 average transport distance, Truck, km, UK 710 A4 average transport distance, Ferry, km, UK 1300 Scenario parameter, Denmark Value A4 Truck >32 metric ton Euro 5, kgCO2e / tonkm 0.0909 A4 Ferry, kgCO2e / tonkm 0.0203 A4 average transport distance, Truck, km, Denmark 310 A4 average transport distance, Ferry, km, Denmark 400 Scenario parameter, Norway Value A4 Truck >32 metric ton Euro 5, kgCO2e / tonkm 0.0909 A4 Ferry, kgCO2e / tonkm 0.0203 A4 average transport distance, Truck, km, Norway 655 A4 average transport distance, Ferry, km, Norway 275
13 PRECAST CONCRETE FILIGREE SLABSEnvironmental Product Declaration created with One Click LCA End of life scenario documentation Scenario parameter Value Collection process kg collected separately 1000 Collection process kg collected with mixed waste 0 Recovery process kg for re use 0 Recovery process kg for recycling 923 Recovery process kg for energy recovery 0 Disposal (total) kg for final deposition 77 Scenario assumptions e.g. transportation End of life product is transported 50 km with an average lorry. BIBLIOGRAPHY ISO 14025:2010 Environmental labels and declarations Type III environmental declarations. Principles and procedures. ISO 14040:2006 Environmental management. Life cycle assessment. Principles and frameworks. ISO 14044:2006 Environmental management. Life cycle assessment. Requirements and guidelines. Ecoinvent database v3.6 and One Click LCA database EN 15804:2012+A2:2019 Sustainability in construction works Environmental product declarations – Core rules for the product category of construction products. RTS PCR EN 15804:2019 RTS PCR in line with EN 15804+A2. Published by the Building Information Foundation RTS 1.6.2020. Bozdağ, Ö. & Seçer, M. (2007). Energy consumption of demolition process is on the average Ideon, T. & Osjamets, M. (2010). Ehitus ja lammutusjäätmete sortimisuuring (Construction and demolition waste sorting and recycling)
Quality and Environment Management system of the company is certified according to the requirements of the international standards ISO 9001 and ISO 14001. HSE processes are managed according to the requirements of the international standard ISO 45001
14 PRECAST CONCRETE FILIGREE SLABSEnvironmental Product Declaration created with One Click LCA ABOUT THE MANUFACTURER
EPD AUTHOR AND CONTRIBUTORS Manufacturer Dzelzsbetons MB (DzMB) EPD author AS UPB, Dzintaru street 17, Liepaja, Latvia EPD verifier Silvia Vilčeková, Silcert, s.r.o. EPD operatorprogram The Building Information Foundation RTS Background data This EPD is based on Ecoinvent 3.6 (cut off) and One Click LCA databases. LCA software The LCA and EPD have been created using One Click LCA Pre Verified EPD Generator for Cementitious Products
Prefabricated concrete production units of MB Betons group are based in Liepaja and Daugavpils. MB Betons group offers a full nomenclature of precast concrete and concrete in compliance with all European standards for the construction of buildings and infrastructure. MB Betons group is characterized by quality, flexibility and experience, as well as a high level of service and wide range of products. Advantages of prefabricated concrete include high strength, fire resistance, low costs and longevity and significantly reduced health and safety risks at the construction site. Furthermore, precast concrete can be easily used for the production of products of various shapes and configurations.
15 PRECAST CONCRETE FILIGREE SLABSEnvironmental Product Declaration created with One Click LCA ANNEX : ENVIRONMENTAL IMPACTS – EN 15804+A1, CML / ISO 21930 Impact category Unit A1 A2 A3 A1 A3 SWEA4 NORA4 DKA4 UKA4 A5 B7B1 C1 C2 C3 C4 D Global warming potential kg CO2e 1,45E2 9,72E0 3,4E0 1,58E2 3,57E1 6,45E1 3,6E1 9,01E1 1,41E1 MND 3,27E0 6,32E0 4,52E0 3,98E 1 8,07E0 Depletion of stratospheric ozone kg CFC11e 4,62E 6 1,68E 6 3,92E 7 6,7E 6 6,62E 6 1,21E 5 6,62E 6 1,65E 5 1,18E 6 MND 5,63E 7 1,16E 6 7,29E 7 1,32E 7 6,26E 7 Acidification kg SO2e 3,21E 1 3,18E 2 3E 3 3,56E 1 1,58E 1 2,17E 1 1,96E 1 5,83E 1 3,35E 2 MND 4,87E 3 1,3E 2 1,3E 2 1,6E 3 3,23E 2 Eutrophication kg PO4 3e 1,49E 1 7,64E 3 6,25E 4 1,58E 1 2,66E 2 3,85E 2 3,2E 2 9,3E 2 1,05E 2 MND 8,57E 4 2,7E 3 4,1E 3 3,1E 4 1,74E 2 Photochemical ozone formation kg C2H4e 2,29E 2 1,5E 3 2,61E 4 2,46E 2 6,57E 3 1,03E 2 7,48E 3 2,08E 2 1,82E 3 MND 5,01E 4 8,39E 4 9,02E 4 1,18E 4 3,17E 3 Abiotic depletion of non fossil res. kg Sbe 1,17E 3 2,06E 4 3,68E 6 1,38E 3 7,42E 4 1,24E 3 8,05E 4 2,15E 3 6,9E 4 MND 5,03E 6 1,59E 4 6,28E 5 3,71E 6 8,05E 4 Abiotic depletion of fossil resources MJ 9,27E2 1,44E2 5,68E1 1,13E3 5,46E2 9,98E2 5,43E2 1,34E3 1,24E2 MND 4,54E1 9,72E1 6,29E1 1,13E1 1,12E2 ANNEX : ENVIRONMENTAL IMPACTS - TRACI 2.1. / ISO 21930 Impact category Unit A1 A2 A3 A1-A3 A4 SWE- NORA4- A4-DK A4-UK A5 B1-B7 C1 C2 C3 C4 D Global warming potential kg CO2e 1,45E2 9,7E0 3,41E0 1,58E2 3,56E1 6,44E1 3,59E1 8,98E1 1,41E1 MND 3,26E0 6,3E0 4,5E0 3,96E 1 8E0 Ozone depletion kg CFC11e 6,15E 6 2,24E 6 5,43E 7 8,94E 6 8,81E 6 1,61E 5 8,81E 6 2,19E 5 1,58E 6 MND 7,51E 7 1,55E 6 9,69E 7 1,76E 7 8,31E 7 Acidification kg SO2e 3,67E 1 4,86E 2 5,06E 3 4,2E 1 2,19E 1 3,25E 1 2,6E 1 7,45E 1 7,19E 2 MND 3,16E 2 2,28E 2 4,44E 2 3,41E 3 4,34E 2 Eutrophication kg Ne 5,16E 2 5,74E 3 4,32E 4 5,78E 2 2,18E 2 3,67E 2 2,34E 2 6,21E 2 6,82E 3 MND 2,79E 3 3,22E 3 4,02E 3 4,09E 4 5,84E 3 Photochemical Smog Formation kg O3e 6,26E0 1,22E0 1,25E 1 7,61E0 4,86E0 7,19E0 5,77E0 1,66E1 1,82E0 MND 9,69E 1 4,92E 1 1,21E0 8,43E 2 6,66E 1 Depletion of non renewable energy MJ 6,84E1 2,01E1 9,29E0 9,78E1 7,84E1 1,43E2 7,81E1 1,94E2 1,48E1 MND 6,71E0 1,39E1 8,66E0 1,64E0 8,02E0 MND abbreviationstandsformodulenotdeclared