
6 minute read
1.1 Pasir Gudang – An Overview


1.0 INTRODUCTION
In March 2019, Pasir Gudang became national headline and captured the country’s attention after thousands of people, most of them schoolchildren, were reported to have experienced severe breathing difficulties, fainting, vomiting, dizziness and muscular cramps in the hands and legs after smelling an acrid and burning odour, presumably from toxic gases/vapours. Many of the victims were sent to hospitals for emergency medical treatment, and a few of them were admitted into the hospital for further observation and treatment. Soon after the tragedy, an illegal chemical waste dumping was discovered at a nearby river, Sungai Kim Kim, which was immediately assumed by the authorities to be the source of the toxic gases/ vapours affecting the schoolchildren. A major clean-up of the river was ordered by JAS in order to stop any further emission of toxic gases from the chemical wastes.
However, just a few months later in June 2019, more schoolchildren were reported to experience similar symptoms in a larger number of schools in the area. This time no chemical dumping was detected at Sungai Kim Kim because it had been cleaned after the first incident. The second incident cast some doubts on whether the source of the toxic gases was the Sungai Kim Kim’s chemical waste or whether there was another source that had evaded detection.
Although the number of cases was not as high as the Sungai Kim Kim incident, it was enough to cause alarm among the Malaysian public when it became national headline news. It precipitated calls by many quarters on the government to end the tragedy in Pasir Gudang by finding and prosecuting the culprits and to take steps to prevent it from happening again.
1.1
1.1.1 PASIR GUDANG – AN OVERVIEW
Land Use of Pasir Gudang
Pasir Gudang, Johor is home to one of the largest and earliest ports in the country. Many factors such as the existing infrastructure support, deep water and abundance of soil for land reclamation made the area the natural place for building a port. The thriving maritime industry in Pasir Gudang was the main catalyst driving the development of the industrial area and the new township. It was first established in 1973 with the initial opening of 110 hectares of industrial area (National Archives of Malaysia, 2019). Information from Pasir Gudang City Council (MBPG) shows that currently there are 801 mixed (light, medium and heavy industries) industrial factories in the municipal area. The distribution of land use in Pasir Gudang is shown in Figure 1. The figure shows that the land use for industry takes up the largest portion of Pasir Gudang land area (38% or 1,775 hectares).
31%
Housing
14%
Open and recreational area
10%
Institution and public facilities
6%
Business
38%
Industry
Figure 1 Area of Land Use in Pasir Gudang (hectare) (Source: Pasir Gudang City Council, 2019)
Figure 2 Structural Plan of Pasir Gudang (Source: Pasir Gudang City Council, 2019)
Furthermore, as seen in Figure 3, the proximity of housing areas, public institutions and facilities, which include schools, to the industrial area is one of the main contributory factors that led to the Sungai Kim Kim and Taman Mawar toxic gas poisoning incidents. The vicinity of almost 2,005 industrial factories to a highly populated residential area in Pasir Gudang has been a ticking time bomb for a major industrial disaster from accidental release of toxic or flammable chemicals to the neighbouring residential areas for a long time. Almost half a million residents live just next door to various heavy industries, including 254 chemical plants. Currently, as shown in Table 1, the buffer zone for heavy industry is only 500m, which was reduced from 1500m in the early 1990’s.
Table 1 Current Buffer Zone for Various Types of Industry
Types of industry
Small Intermediate Heavy Buffer zone (metre)
50 250 500
(Source: Guidelines for Siting and Zoning of Industry and Residential Areas 2012 Jabatan Alam Sekitar)
1.1.2 River Systems and Stormwater Drainage in Pasir Gudang
Pasir Gudang is bounded by Sungai Kim Kim to the east, Sungai Masai to the west, and by Selat Tebrau to the south, as shown in Figure 3. The Sungai Kim Kim and Sungai Masai river systems are just south of the Sungai Johor river basin, located to the west of Sungai Johor estuary. All rain and surface water that flow within them find their way to Sungai Kim Kim or Sungai Masai. The two river basins are very much smaller than either the basins of Sungai Johor or Sungai Tebrau. Figure 4 is a Google Earth map showing the location of Pasir Gudang, an intensively developed industrial estate, wedged between Sungai Kim Kim and Sungai Masai river systems.
Figure 5 shows the detailed layout of the smaller river basins within Pasir Gudang. There are many other smaller river basin systems in between Sungai Kim Kim and Sungai Johor. Sungai Tukang Batu, whose water quality is Class 5 or highly polluted, is at the extreme south of the area and drains into the Straits of Johor at Pelabuhan Pasir Gudang.
Figure 3 River Basins Within the District of Johor Bahru (Source: Jabatan Pengairan dan Saliran)

Figure 4 Pasir Gudang Industrial Area (Source: Google Earth map)
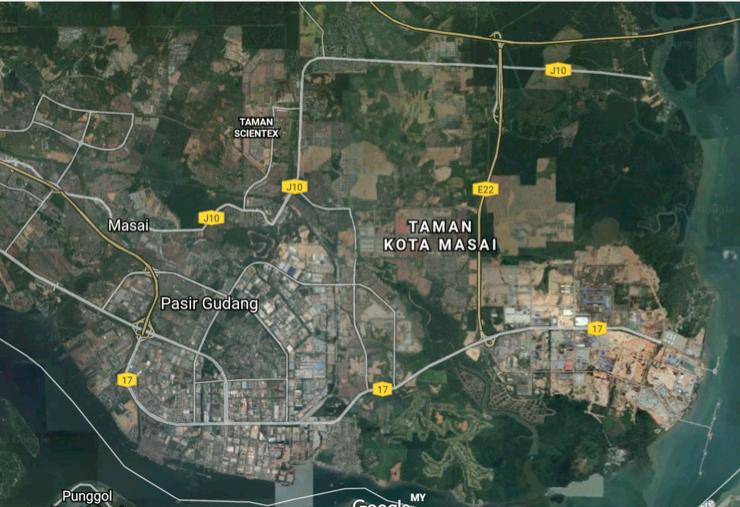
Figure 5 Detail of River Systems of Pasir Gudang (Source: Jabatan Pengairan dan Saliran)

1.1.3 Existing Regulatory Framework for Environmental Pollution
Acceptable Conditions for Pollutants in EQA 1974
In Malaysia, the definition of ‘pollution’ under the Environmental Quality Act (EQA) 1974 was amended in 2012 into a more quantifiable condition based on acceptable conditions of emission, discharge or deposit of environmentally hazardous substances, pollutants or wastes, rather than the previous descriptive condition based on alteration on the environment caused by environmentally hazardous substances, pollutants or wastes.
The EQA 1974 amendment in 2012 would strengthen JAS’ enforcement division in prosecuting individuals/ companies that cause the “pollution” as defined under EQA 1974. For example, the acceptable condition for mercury emission for the chemical and petrochemical industries in the gazetted Environmental Quality (Clean Air) Regulations 2014 based on the provisions of Sections 21 and 51, is 0.05 mg Nm-3 that must be monitored periodically. This means that any mercury emission that exceeds 0.05 mg Nm-3 is considered as ‘pollution’ under the EQA 1974. However, the main drawback is not all chemicals have their acceptable conditions quantified and gazetted.
Environmentally Hazardous Substances (EHS) in EQA 1974
Under the EQA 1974, EHS is defined as any substances that could cause pollution. Since this definition of EHS in the EQA 1974 is broad and vague, the coverage of substances that could cause pollution is very subjective. The definition of EHS should be amended by incorporating the characteristics of substances, regardless of whether they could cause pollution.
In early January 2019, JAS informed stakeholders of its intention to amend the EQA 1974 such that the definition of EHS is tied to a list of chemicals in Multi-lateral Environment Agreement (MEAs) on chemicals such as the Rotterdam Convention, Stockholm Convention and Minamata Convention. This amendment is intended to establish the legal frameworks in Malaysia to ratify the MEAs. The initiative is good, but then it has narrowed down the scope of EHS as preventive measures in EQA 1974.


