Market Report
2023 FIRST QUARTER
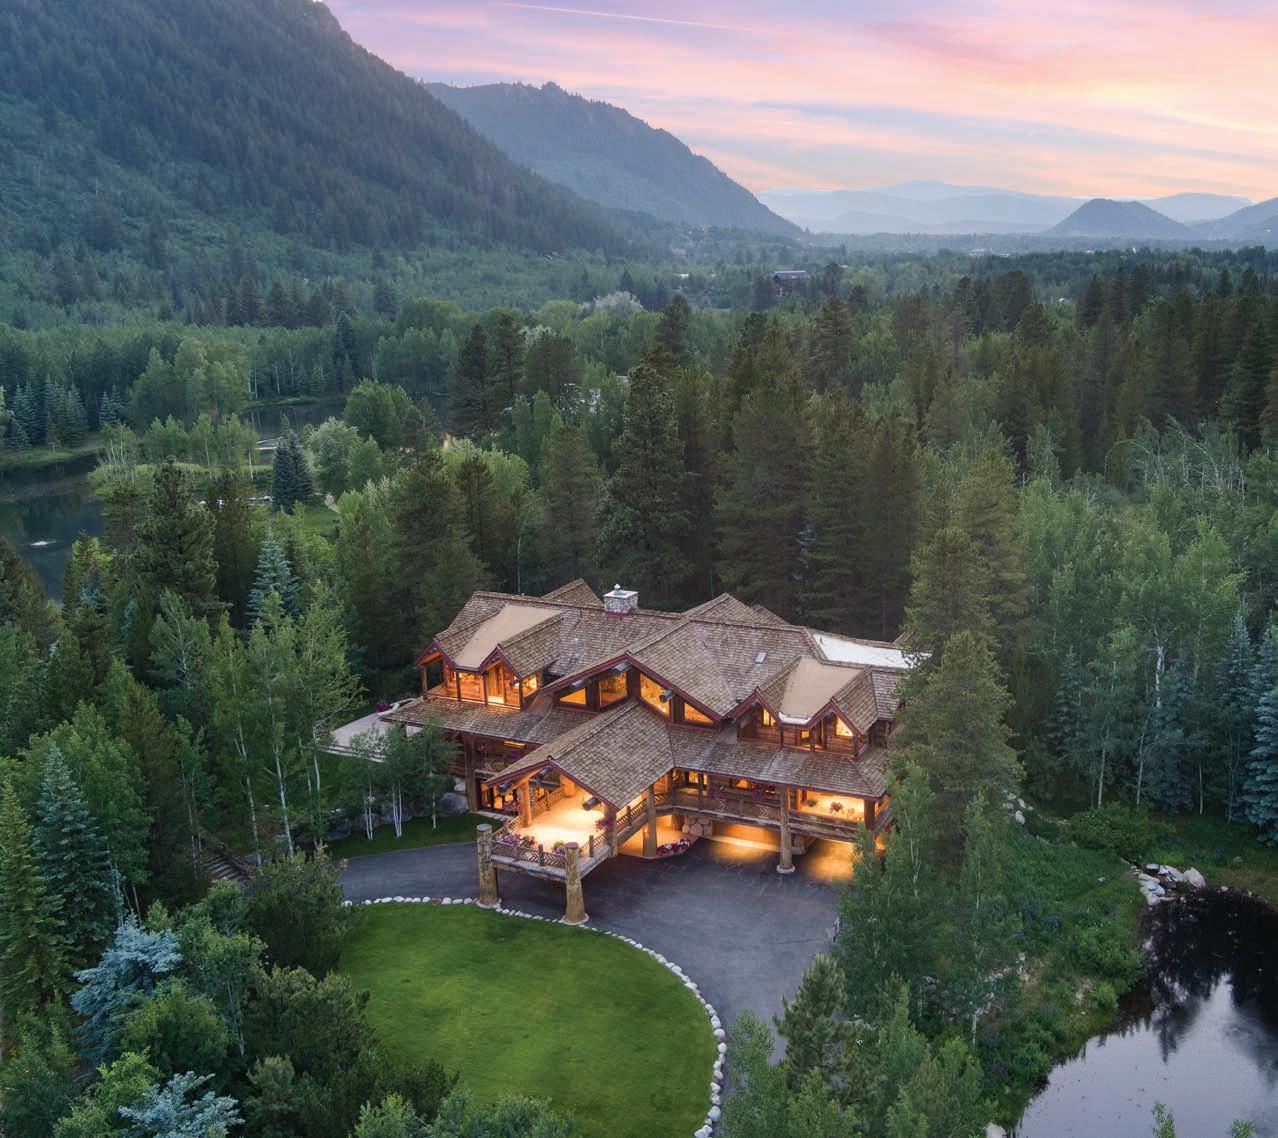
Today’s Real Estate in the Roaring Fork Valley
Welcome to the Aspen Snowmass Sotheby’s International Realty 2023 First Quarter Market Report! Aspen Snowmass Sotheby’s International Realty is the leading (and largest) real estate firm in the Roaring Fork Valley. Our mission is to be the company in the Roaring Fork Valley and surrounding areas where real estate clients want to do business and real estate professionals want to work.
It’s been an interesting year so far. We enjoyed an amazing (and extended) ski season at the five ski areas located between Aspen and Glenwood Springs, coupled with a few very evident shifts in the local real estate market. On the surface, it appears the local economy and real estate market remain quite strong. However, taking a deeper dive into the data, it’s clear the pace of real estate transactions has slowed in many areas so far this year. Prices continue to rise or hold steady depending on the location. Listing inventory has doubled in the Aspen Snowmass region compared to last year, but overall, property listings are still well below historic norms.
There continues to be impressive strength at the very upper end of the local real estate market, and off-market transactions are at the forefront for opportunistic sellers and buyers. As the local leader in luxury rental listings, we are also continuing to see strong demand for prime rental properties. Thus far, all signs are pointing toward a strong summer ahead. We hope you enjoy our latest report!
Andrew Ernemann, President
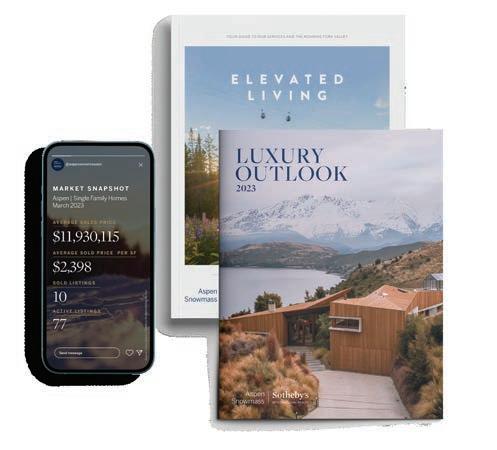
Interested in learning more about housing market trends?
At Aspen Snowmass Sotheby’s International Realty, we take a client-first approach, publishing a variety of publications to reveal what’s happening in every sector of the real estate markets, at both a local and global scale.
Visit our website or get in touch today. AspenSnowmassSIR.com | 970.925.6060
| Q1 Market Update 2023 1
CONTENTS 01 | President’s Message 03 | Local Market Dominance 04 | The Luxury Market NEIGHBORHOOD DATA 05 | Aspen 06 | Shared Ownership 07 | Snowmass Village 08 | Woody Creek 09 | Old Snowmass 10 | Basalt 11 | Carbondale 12 | Glenwood Springs 13 | New Castle 15 | Silt 15 | Rifle
Local Market Dominance
We’ve been the local market leader for forty-one consecutive quarters. Our top-performing agents continuously help more clients reach their real estate goals than any other company in the Roaring Fork Valley.
| Q1 Market Update 2023 3
Top 10 Companies Aspen Snowmass Sotheby’s International Realty Sides # 1 2 3 Market Share $399,245,343 181.5 4 5 6 7 8 9 10 $ Volume $190,354,667 $147,823,070 $147,226,654 $95,029,806 $69,139,542 $46,000,000 $45,767,000 $19,450,000 $18,276,480 $222,297,029 13.59% 10.55% 10.51% 6.78% 4.94% 3.28% 3.27% 1.39% 1.3% 15.88% 28.51% Compass Colorado Coldwell Banker Mason Morse Compass Colorado Douglas Elliman Real Estate Slifer Smith & Frampton Engel & Volkers Whitman Fine Properties Christie's International Real Estate Lorrie B Aspen, Inc. Integrated Mountain Properties All Others 82.5 48 32.5 50 40.5 3 15.5 2 25 419.5 28.51% Aspen Snowmass Sotheby’s International Realty All Others 15.88% 13.59% 10.51% 10.55% Coldwell Banker Mason Morse Douglas Elliman Real Estate Slifer Smith & Frampton 6.78%
The Luxury Market
CLOSINGS OVER $5 MILLION
VILLAGE

Q1 Market Update 2023 | 4
IN ASPEN & SNOWMASS
All closings from January 1 through March 31, 2023. Information is deemed to be reliable, but is not guaranteed. Source: The Aspen Glenwood MLS 27.09% 16.97% Aspen Snowmass Sotheby’s International Realty Coldwell Banker Mason Morse Slifer Smith & Frampton Whitman Fine Properties 9.16% 15.7% Douglas Elliman Real Estate 11.23% Compass Colorado 6.42% Top 10 Companies Aspen Snowmass Sotheby’s International Realty Sides # 1 2 3 Market Share $194,208,000 14 4 5 6 7 8 9 Coldwell Banker Mason Morse Douglas Elliman Real Estate Compass Colorado Slifer Smith & Frampton Whitman Fine Properties Christie's International Real Estate Engel & Volkers Lorrie B Aspen, Inc. Gilliam Properties of Aspen 10 $ Volume $121,631,154 $112,525,154 $80,480,000 $65,700,000 $46,000,000 $35,225,000 $34,743,000 $18,500,000 $7,850,000 16.97% 15.7% 11.23% 9.16% 6.42% 4.91% 4.85% 2.58% 1.1% 9 8 6 7 3 5 4 1 1 27.09%

| Q1 Market Update 2023 5
YearOverYearQ12022Q12023%Change Average Sold Price $4,475,972$4,332,364 -3% Average Sold Price per Sq. Ft. $2,735 $2,704 -1% Average Days on Market 88 133 51% % Sold Price to Original List 98% 94% -4% Lowest Sold Price $265,000 $830,000 213% Highest Sold Price $20,000,000$22,000,000 10% Number of Properties Sold 36 22 -39% Total Dollar Volume Sold $161,135,000$95,312,000 -41% YearOverYearQ12022Q12023%Change Average Sold Price $18,309,167$12,968,377 -29% Average Sold Price per Sq. Ft. $3,258 $2,886 -11% Average Days on Market 148 205 39% % Sold Price to Original List 96% 92% -4% Lowest Sold Price $3,600,000 $1,175,000 -67% Highest Sold Price $50,000,000$35,000,000 -30% Number of Properties Sold 18 19 6% Total Dollar Volume Sold $329,565,000$246,399,154 -25% SINGLE FAMILY HOMES
TOWNHOMES & DUPLEXES Number of Active Listings as of April 1, 2023 Total Dollar Volume Sold Aspen Snowmass Sotheby’s International Realty Dollar Volume Participation Highest Sale of 2023 130 +$727 M $35M 2022 VS. 2023 FIRST QUARTER, JANUARY – MARCH 32.85 %
Aspen
CONDOMINIUMS,
Q1 Market Update 2023 | 6 YearOverYearQ12022Q12023%Change Average Sold Price $523,583 $392,299 -25% Average Sold Price per Sq. Ft. $238 $212 -11% Average Days on Market 182 269 48% % Sold Price to Original List 95% 92% -3% Lowest Sold Price $34,500 $19,000 -45% Highest Sold Price $1,340,000$2,250,000 68% Number of Properties Sold 38 38 0% Total Dollar Volume Sold $19,896,150$14,907,365 -25% YearOverYearQ12022Q12023%Change Average Sold Price $362,944 $402,778 11% Average Sold Price per Sq. Ft. $176 $201 14% Average Days on Market 256 167 -35% % Sold Price to Original List 97% 94% -3% Lowest Sold Price $165,000 $210,000 27% Highest Sold Price $540,000 $600,000 11% Number of Properties Sold 27 9 -67% Total Dollar Volume Sold $9,799,500$3,625,000 -63% 2022 VS. 2023 FIRST QUARTER, JANUARY 2022 VS. 2023 FIRST QUARTER, JANUARY
Snowmass
Ownership SHARED OWNERSHIP SHARED OWNERSHIP Number of Active Listings as of April 1, 2023 Number of Active Listings as of April 1, 2023 Aspen Snowmass Sotheby’s International Realty Dollar Volume Participation Aspen Snowmass Sotheby’s International Realty Dollar Volume Participation 106 22 65.79 % 39.17 %
Aspen Shared Ownership
Village Shared
Snowmass Village
| Q1 Market Update 2023 7
2022 VS. 2023 FIRST QUARTER, JANUARY – MARCH YearOverYearQ12022Q12023%Change Average Sold Price $2,157,367 $2,827,100 31% Average Sold Price per Sq. Ft. $1,399 $1,573 12% Average Days on Market 68 266 291% % Sold Price to Original List 101% 96% -5% Lowest Sold Price $145,000 $450,000 210% Highest Sold Price $6,600,000 $8,789,377 33% Number of Properties Sold 27 20 -26% Total Dollar Volume Sold $58,248,900$56,542,000 -3% YearOverYearQ12022Q12023%Change Average Sold Price $7,837,333 $5,352,143 -32% Average Sold Price per Sq. Ft. $1,604 $1,518 -5% Average Days on Market 169 159 -6% % Sold Price to Original List 95% 92% -3% Lowest Sold Price $4,400,000$2,290,000 -48% Highest Sold Price $14,625,000$10,750,000 -26% Number of Properties Sold 9 7 -22% Total Dollar Volume Sold $70,536,000$37,465,000 -47% SINGLE FAMILY HOMES CONDOMINIUMS, TOWNHOMES & DUPLEXES Number of Active Listings as of April 1, 2023 Average Days on Market for Single Family Homes Aspen Snowmass Sotheby’s International Realty Dollar Volume Participation Local Firm by Transactions and Sales Volume 161 159 #1 36.86 %
YearOverYearQ12022Q12023%Change Average Sold Price $0$3,338,333 Average Sold Price per Sq. Ft. $0 $1,202 Average Days on Market 0 101 % Sold Price to Original List 0% 97% Lowest Sold Price $0 $660,000 Highest Sold Price $0$8,600,000 Number of Properties Sold 0 3 Total Dollar Volume Sold $0$10,015,000 SINGLE FAMILY HOMES Woody Creek 2022 VS. 2023 FIRST QUARTER, JANUARY – MARCH 8 Number of Active Listings as of April 1, 2023 Increase in Sales Since Q4 2022 4 +50%
YearOverYearQ12022Q12023%Change Average Sold Price $8,096,429 $3,241,357 -60% Average Sold Price per Sq. Ft. $1,032 $979 -5% Average Days on Market 290 99 -66% % Sold Price to Original List 93% 94% 1% Lowest Sold Price $650,000$1,800,000 177% Highest Sold Price $41,000,000 $5,074,070 -88% Number of Properties Sold 7 3 -57% Total Dollar Volume Sold $56,675,000 $9,724,070 -83% SINGLE FAMILY HOMES
2022 VS. 2023 FIRST QUARTER, JANUARY – MARCH Number of Active Listings as of April 1, 2023 Average Price Per Square Foot 9 $979
Old Snowmass
Q1 Market Update 2023 | 10
YearOverYearQ12022Q12023%Change Average Sold Price $1,185,550 $1,106,050 -7% Average Sold Price per Sq. Ft. $738 $803 9% Average Days on Market 235 74 -69% % Sold Price to Original List 101% 97% -4% Lowest Sold Price $563,000 $685,000 22% Highest Sold Price $1,725,000$2,225,000 29% Number of Properties Sold 20 10 -50% Total Dollar Volume Sold $23,711,000$11,060,500 -53% YearOverYearQ12022Q12023%Change Average Sold Price $1,491,033 $2,170,250 46% Average Sold Price per Sq. Ft. $558 $792 42% Average Days on Market 132 134 2% % Sold Price to Original List 99% 97% -2% Lowest Sold Price $860,000$1,025,000 19% Highest Sold Price $2,459,000$4,000,000 63% Number of Properties Sold 15 12 -20% Total Dollar Volume Sold $22,365,500$26,043,000 16% SINGLE FAMILY HOMES
TOWNHOMES & DUPLEXES 2022 VS. 2023 FIRST QUARTER, JANUARY – MARCH Number of Active Listings as of April 1, 2023 Highest Sale of 2023 Aspen Snowmass Sotheby’s International Realty Dollar Volume Participation Decrease in Number of Sold Properties (Q1 2022 vs. Q1 2023) 59 $4M 32.95 % -37 %
Basalt
CONDOMINIUMS,

| Q1 Market Update 2023 11 Carbondale
VS. 2023 FIRST QUARTER, JANUARY – MARCH YearOverYearQ12022Q12023%Change Average Sold Price $971,418 $983,841 1% Average Sold Price per Sq. Ft. $459 $520 13% Average Days on Market 281 104 -63% % Sold Price to Original List 100% 97% -3% Lowest Sold Price $632,000 $278,000 -56% Highest Sold Price $1,505,000$1,900,500 26% Number of Properties Sold 8 10 25% Total Dollar Volume Sold $7,771,348$9,838,410 27% YearOverYearQ12022Q12023%Change Average Sold Price $1,763,000 $2,165,233 23% Average Sold Price per Sq. Ft. $575 $663 15% Average Days on Market 151 150 -1% % Sold Price to Original List 98% 96% -2% Lowest Sold Price $600,000 $960,000 60% Highest Sold Price $3,550,000$5,250,000 48% Number of Properties Sold 10 15 50% Total Dollar Volume Sold $17,630,000$32,478,500 84% SINGLE FAMILY HOMES
TOWNHOMES & DUPLEXES Number of Active Listings as of April 1, 2023 Aspen Snowmass Sotheby’s International Realty Dollar Volume Participation Increase in Number of Sold Properties Since Q4 2022 Average Sold Price per Square Foot for Single Family Homes 55 23.74 % +39 % +15 %
2022
CONDOMINIUMS,

Q1 Market Update 2023 | 12 Number of Active Listings as of April 1, 2023 63 Glenwood Springs YearOverYearQ12022Q12023%Change Average Sold Price $516,500 $526,928 2% Average Sold Price per Sq. Ft. $336 $445 32% Average Days on Market 158 76 -52% % Sold Price to Original List 99% 99% 0% Lowest Sold Price $135,000 $195,000 44% Highest Sold Price $749,000 $900,000 20% Number of Properties Sold 22 14 -36% Total Dollar Volume Sold $11,363,000 $7,376,999 -35% YearOverYearQ12022Q12023%Change Average Sold price $886,810 $985,229 11% Average Sold Price per Sq. Ft. $399 $432 8% Average Days on Market 100 115 15% % Sold Price to Original List 99% 94% -5% Lowest Sold Price $440,000 $395,000 -10% Highest Sold Price $2,300,000$3,350,000 46% Number of Properties Sold 33 20 -39% Total Dollar Volume Sold $29,264,734$19,704,584 -33% SINGLE FAMILY HOMES CONDOMINIUMS, TOWNHOMES & DUPLEXES 2022 VS. 2023 FIRST QUARTER, JANUARY – MARCH Total Dollar Volume Sold Local Real Estate Firm by Sales Volume Highest Sale Since 2021 #2 $3,350,000 +$27 M
New Castle
2022 VS. 2023
JANUARY – MARCH
| Q1 Market Update 2023 13
QUARTER,
YearOverYearQ12022Q12023%Change Average Sold Price $354,699 $480,055 35% Average Sold Price per Sq. Ft. $314 $289 -8% Average Days on Market 47 194 313% % Sold Price to Original List 99% 99% 0% Lowest Sold Price $255,000 $365,000 43% Highest Sold Price $429,000 $665,000 55% Number of Properties Sold 8 11 38% Total Dollar Volume Sold $2,837,590$5,280,600 86% YearOverYearQ12022Q12023%Change Average Sold Price $571,875 $605,329 6% Average Sold Price per Sq. Ft. $311 $303 -3% Average Days on Market 77 99 29% % Sold Price to Original List 100% 98% -2% Lowest Sold Price $380,000 $320,000 -16% Highest Sold Price $775,000$1,190,000 54% Number of Properties Sold 12 12 0% Total Dollar Volume Sold $6,862,500$7,263,950 6% SINGLE FAMILY HOMES
TOWNHOMES & DUPLEXES Number of Active Listings as of April 1, 2023 Increase in Average Sales Price for Condominiums, Townhomes & Duplexes 29 +35
Highest Sale Since 2021
FIRST
CONDOMINIUMS,
%
$27,544,100
Q1 Market Update 2023 | 14 #1 20+ 190+ 29 210 Exclusive luxury vacation rentals, more than any other local agency Brokerage in rentals and sales Years as market leader Expert broker associates, the largest local network Expert luxury rental specialists Unrivaled results, everytime.
Silt
2022 VS. 2023 FIRST QUARTER, JANUARY – MARCH
| Q1 Market Update 2023 15
YearOverYearQ12022Q12023%Change Average Sold Price $363,500 $382,500 5% Average Sold Price per Sq. Ft. $258 $310 20% Average Days on Market 50 14 -72% % Sold Price to Original List 96% 101% 5% Lowest Sold Price $345,000 $382,500 11% Highest Sold Price $382,000 $382,500 0% Number of Properties Sold 2 1 -50% Total Dollar Volume Sold $727,000 $382,500 -47% YearOverYearQ12022Q12023%Change Average Sold Price $515,474 $537,050 4% Average Sold Price per Sq. Ft. $251 $267 6% Average Days on Market 110 90 -18% % Sold Price to Original List 98% 95% -3% Lowest Sold Price $305,000 $300,000 -2% Highest Sold Price $780,000$1,076,000 38% Number of Properties Sold 19 18 -5% Total Dollar Volume Sold $9,794,000$9,666,900 -1% SINGLE FAMILY HOMES
& DUPLEXES Number of Active Listings as of April 1, 2023 Total Dollar Volume Sold Average Days on Market for Condominiums, Townhomes & Duplexes 21 +$10M -72
CONDOMINIUMS, TOWNHOMES
%

Q1 Market Update 2023 | 16 Rifle
YearOverYearQ12022Q12023%Change Average Sold Price $262,794 $316,000 20% Average Sold Price per Sq. Ft. $209 $237 13% Average Days on Market 158 50 -68% % Sold Price to Original List 100% 99% -1% Lowest Sold Price $150,000 $155,000 3% Highest Sold Price $349,250 $365,000 5% Number of Properties Sold 17 8 -53% Total Dollar Volume Sold $4,467,500$2,528,000 -43% YearOverYearQ12022Q12023%Change Average Sold Price $463,520 $483,619 4% Average Sold Price per Sq. Ft. $254 $252 -1% Average Days on Market 100 81 -19% % Sold Price to Original List 99% 96% -3% Lowest Sold Price $270,000 $174,000 -36% Highest Sold Price $1,500,000 $935,000 -38% Number of Properties Sold 42 21 -50% Total Dollar Volume Sold $19,467,830$10,156,000 -48% SINGLE FAMILY HOMES
TOWNHOMES & DUPLEXES Change in Average Selling Price (Q1 2022 VS Q1 2023) In Total Sales Volume 34 +$29
2022 VS. 2023 FIRST QUARTER, JANUARY – MARCH
CONDOMINIUMS,
HYMAN MALL (FLAGSHIP OFFICE)
415 E. Hyman Avenue Aspen, CO 81611
970.925.6060
SPRING STREET 300 S. Spring Street Aspen, CO 81611
970.925.6060
EAST DURANT
730 East Durant Avenue Aspen, CO 81611
970.925.1100
PUPPY SMITH
300 Puppy Smith, Suite 211A Aspen, CO 81611
970.925.6060
BASE VILLAGE 110 Carriage Way, Building A, Suite 3102, Snowmass Village, CO 81615

970.923.2006
SNOWMASS VILLAGE MALL
50 Snowmass Village Mall Snowmass Village, CO 81615
970.923.2006
BASALT
201 Midland Avenue, P.O. Box 650 Basalt, CO 81621
970.927.8080
WILLITS
780 East Valley Road Basalt, CO 81621
970.927.8080
CARBONDALE RIVER VALLEY RANCH
333 River Valley Ranch Drive Carbondale, CO 81623
970.963.0400
THE MEADOWS
150 West Meadows Drive Glenwood Springs, CO 81601
970.366.3511
AspenSnowmassSIR.com

