Market Report
2023 SECOND QUARTER, JANUARY – JUNE

Today’s Real Estate in the Roaring Fork Valley
Thanks for reading the Aspen Snowmass Sotheby’s International Realty 2023 Second Quarter Market Report!
Aspen Snowmass Sotheby’s International Realty is the market leader in the Roaring Fork Valley and has maintained this status for well over a decade. We pride ourselves on providing our clients with the most in–depth and globally connected listing platform, an extensive and exclusive listing portfolio for buyers wanting to look below the surface, and the premier local platform for rental listings. Simply put, we are the local real estate authority.
In this comprehensive report, you can locate the latest local real estate statistics covering each of the primary communities and property types in the Roaring Fork Valley and beyond.
With summer in full swing, it’s a good time to take stock of how 2023 has shaped the Roaring Fork Valley real estate markets. The numbers speak for themselves, and generally the local market is experiencing three
formative factors. Primarily, the continued increases in listing inventory are welcome news for buyers who’ve had few options over the past few years. Secondly, markets have experienced a slower pace in sales in comparison to the past few years–keep in mind the “COVID boom” in the real estate market set several records across the Roaring Fork Valley, so a slower pace of sales activity is inevitable and to be expected. Third, average sales prices have continued to rise in almost every neighborhood. Despite the noted increase in listings (supply) and tapered sales (demand), it’s important to note the enthusiasm to own property and live in the greater Roaring Fork Valley area continues to be strong, and that dynamic has supported an unprecedented run of rising prices.
Thanks again for reading our report, we know you’ll find useful insight in the following pages!
Andrew Ernemann, President
| Q2 Market Update 2023 1

CONTENTS 1 | President’s Message 3 | Local Market Dominance 4 | The Luxury Market NEIGHBORHOOD DATA 5 | Aspen 6 | Shared Ownership 7 | Snowmass Village 8 | Woody Creek 9 | Old Snowmass 10 | Basalt 11 | Carbondale 12 | Glenwood Springs 13 | New Castle 15 | Silt 16 | Rifle 18 | Residential Land Report
Local Market Dominance


| Q2 Market Update 2023 3
All closings from January 1 through June 30, 2023. Information
reliable,
is not guaranteed.
is deemed to be
but
Source: The Aspen Glenwood MLS
Top 10 Companies Aspen Snowmass Sotheby’s International Realty Sides # Market Share $972,673,761 422.5 $ Volume $441,386,154 $422,469,920 $410,575,786 $403,739,072 $157,527,564 $133,268,592 $70,400,000 $49,800,000 $49,800,000 $718,558,708 11.52% 11.03% 10.72% 10.54% 4.11% 3.48% 1.84% 1.3% 1.3% 18.77% 25.39% Compass Colorado Douglas Elliman Real Estate Compass Colorado Slifer Smith & Frampton Coldwell Banker Mason Morse Engel & Volkers Christie's International Real Estate AG Aspen M4 Ranch Group, LLC Whitman Fine Properties All Others 76 118.5 192 215.5 98.5 42 2.5 2 4 1112.5 Aspen Snowmass Sotheby’s International Realty Douglas Elliman Real Estate Slifer Smith & Frampton Coldwell Banker Mason Morse 1 2 3 4 5 6 7 8 9 10
We’ve been the local market leader for more than twenty years.
The Luxury Market
Closings Over $5 Million in Aspen & Snowmass Village

Q2 Market Update 2023 | 4
All closings from January 1 through June 30, 2023. Information is deemed to be reliable, but is not guaranteed.
Source: The Aspen Glenwood MLS
Colorado
Aspen Snowmass Sotheby’s International Realty Compass
Frampton
Slifer Smith &
Douglas Elliman Real Estate
Top 10 Companies Aspen Snowmass Sotheby’s International Realty Sides # Market Share $430,783,000 30
Elliman Real Estate
Colorado
Banker Mason Morse
Smith & Frampton AG Aspen Christie's International Real Estate Engel & Volkers
Fine Properties
eld & Bright All Others $ Volume $330,575,154 $261,367,000 $200,501,154 $182,250,000 $68,000,000 $54,770,000 $47,243,000 $46,000,000 $31,500,000 $64,300,000 19.25% 15.22% 11.68% 10.61% 3.96% 3.19% 2.75% 2.68% 1.83% 3.74% 20 15 15 14 2 7 5 3 3 6 25.09% 25.09% 1 2 3 4 5 6 7 8 9 10
Coldwell Banker Mason Morse
Douglas
Compass
Coldwell
Slifer
Whitman
Setter
2022 VS. 2023 SECOND
CONDOMINIUMS, TOWNHOMES & DUPLEXES
| Q2 Market Update 2023 5
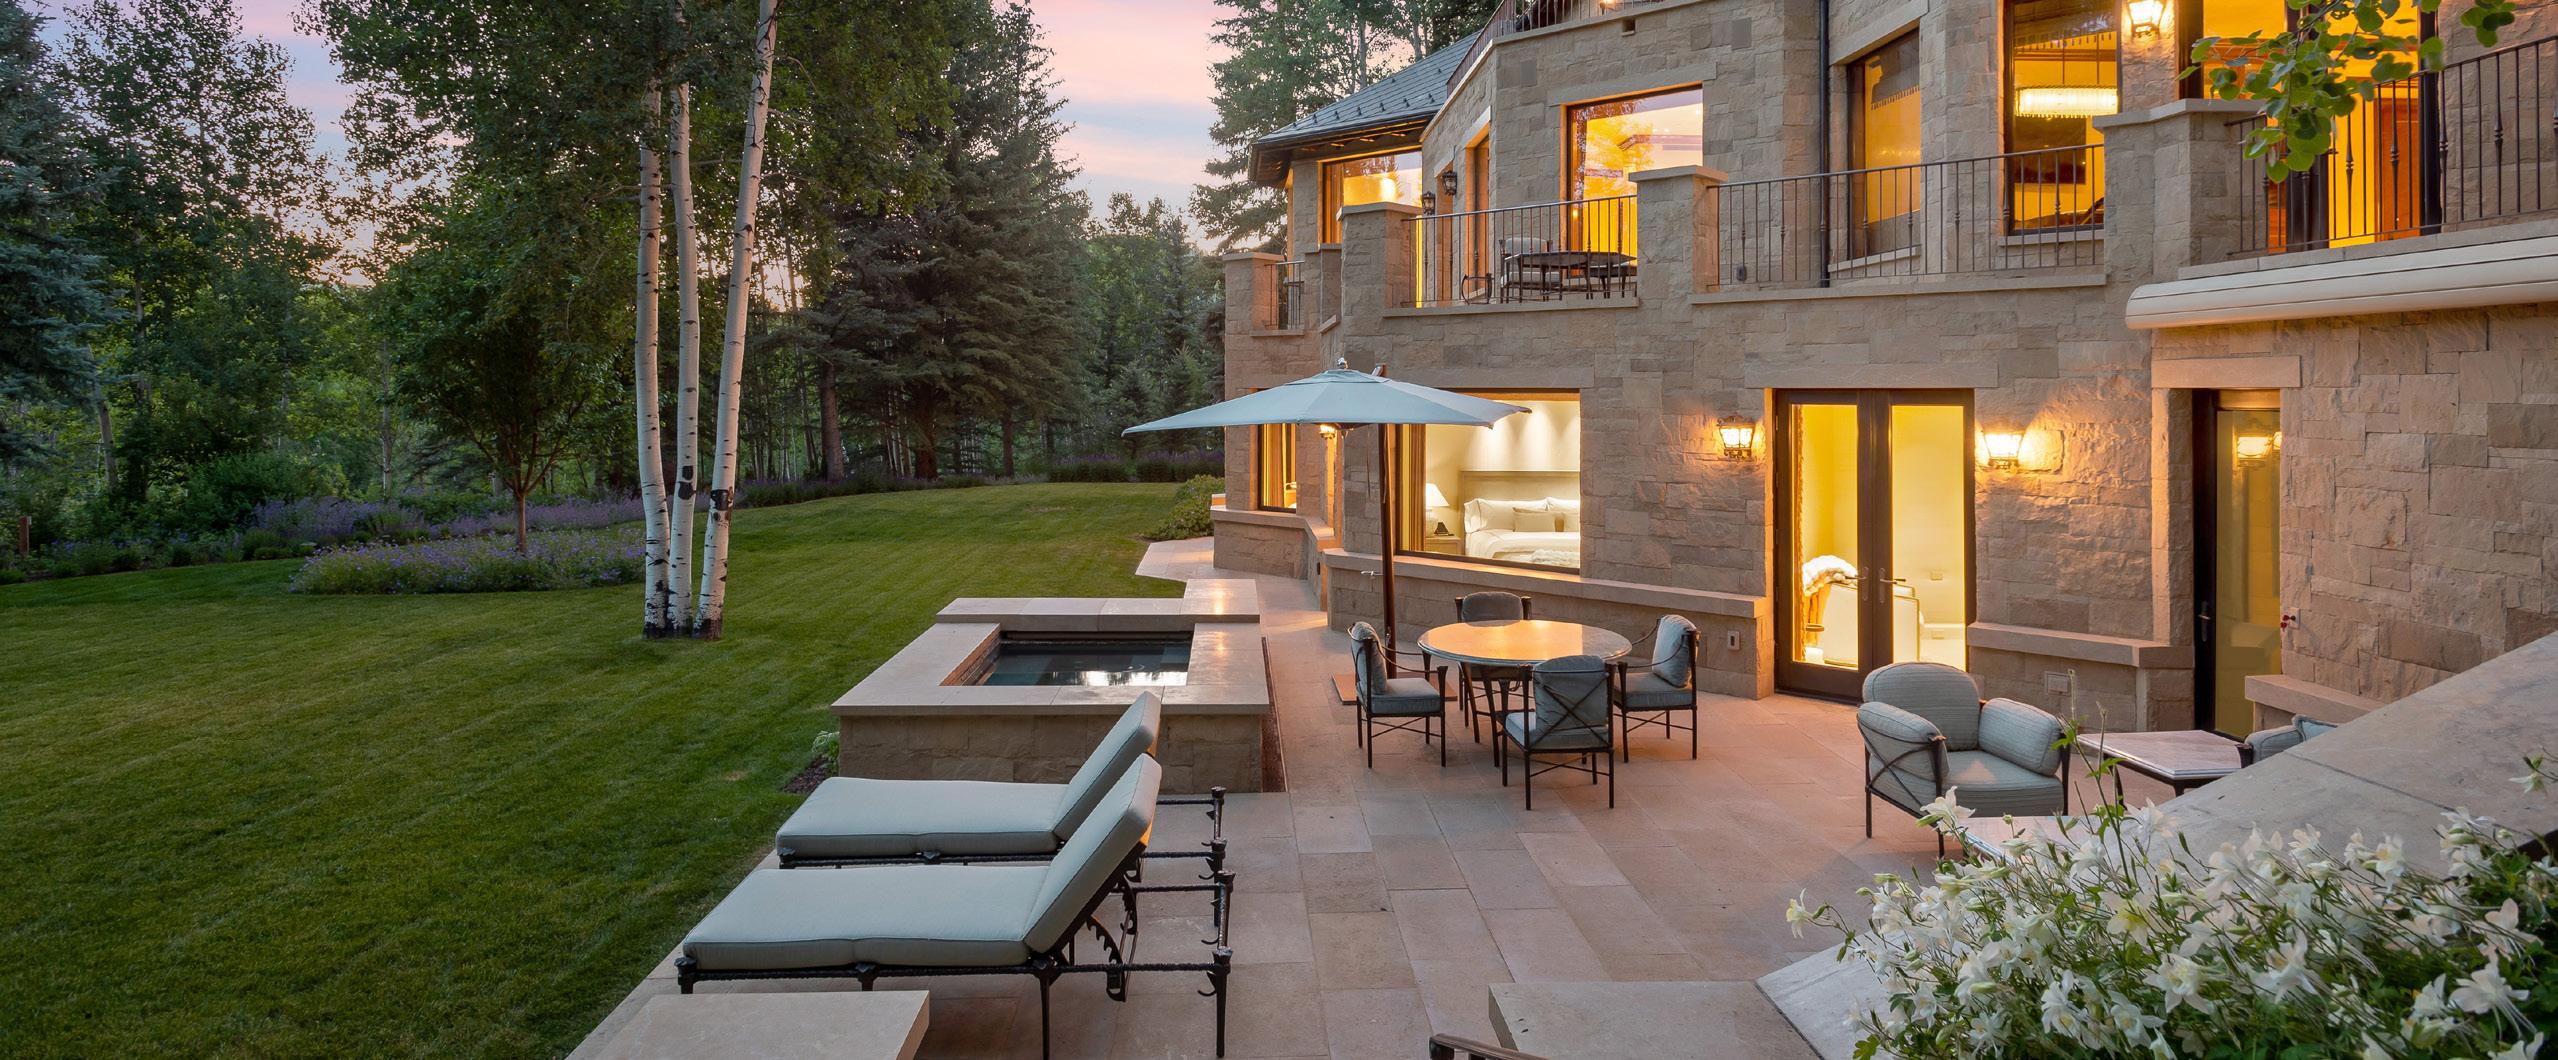
Aspen
QUARTER,
Year Over Year Q2 2022 Q2 2023 % Change Average Sold Price $4,651,758 $4,463,079 –4% Average Sold Price per Sq. Ft. $2,817 $2,848 1% Average Days on Market 88 131 49% % Sold Price to Original List Price 98% 95% –3% Lowest Sold Price $265,000 $830,000 213% Highest Sold Price $20,000,000 $22,000,000 10% Number of Properties Sold 66 38 –42% Total Dollar Volume Sold $307,015,999 $169,597,000 –45% Year Over Year Q2 2022 Q2 2023 % Change Average Sold Price $19,708,022 $16,588,491 –16% Average Sold Price per Sq. Ft. $3,176 $3,453 9% Average Days on Market 187 165 –12% % Sold Price to Original List Price 97% 93% –4% Lowest Sold Price $1,300,000 $3,459,000 166% Highest Sold Price $60,000,000 $65,000,000 8% Number of Properties Sold 42 37 –12% Total Dollar Volume Sold $827,736,909 $613,774,154 –26% SINGLE FAMILY HOMES
JANUARY – JUNE
Active Listings as of July 1, 2023 Aspen Snowmass Sotheby’s International Realty Total $ Volume Sold Total Sides Aspen Snowmass Sotheby’s International Realty Represented Highest Sale of 2023 160 $ 441 M $65M 133
Q2 Market Update 2023 | 6 Year Over Year Q2 2022 Q2 2023 % Change Average Sold Price $530,006 $401,710 –24% Average Sold Price per Sq. Ft. $215 $200 –7% Average Days on Market 168 224 33% % Sold Price to Original List Price 94% 91% –3% Lowest Sold Price $14,000 $10,000 –29% Highest Sold Price $2,638,000 $2,800,000 6% Number of Properties Sold 84 66 –21% Total Dollar Volume Sold $44,520,472 $26,512,865 –40% Year Over Year Q2 2022 Q2 2023 % Change Average Sold Price $373,728 $389,139 4% Average Sold Price per Sq. Ft. $294 $202 –31% Average Days on Market 249 162 –35% % Sold Price to Original List Price 96% 93% –3% Lowest Sold Price $165,000 $210,000 27% Highest Sold Price $635,000 $600,000 –6% Number of Properties Sold 46 18 –61% Total Dollar Volume Sold $17,191,500 $7,004,500 –59% 2022 VS. 2023 SECOND QUARTER, JANUARY – JUNE 2022 VS. 2023 SECOND QUARTER, JANUARY – JUNE
SHARED OWNERSHIP SHARED OWNERSHIP Active Listings as of July 1, 2023 Active Listings as of July 1, 2023 We Represented More Than Half of Aspen Fractional Transactions Aspen Snowmass Sotheby’s International Realty Total $ Volume Market Share 110 23 56 % 43%
Aspen Shared Ownership Snowmass Village Shared Ownership
| Q2 Market Update 2023 7
2023 SECOND QUARTER, JANUARY – JUNE Year Over Year Q2 2022 Q2 2023 % Change Average Sold Price $2,027,805 $2,278,184 12% Average Sold Price per Sq. Ft. $1,495 $1,620 8% Average Days on Market 92 543 490% % Sold Price to Original List Price 99% 98% –1% Lowest Sold Price $145,000 $450,000 210% Highest Sold Price $6,600,000 $8,789,377 33% Number of Properties Sold 62 98 58% Total Dollar Volume Sold $125,723,900 $223,262,000 78% Year Over Year Q2 2022 Q2 2023 % Change Average Sold Price $7,101,745 $7,360,625 4% Average Sold Price per Sq. Ft. $1,587 $1,691 7% Average Days on Market 189 149 –21% % Sold Price to Original List Price 96% 92% –4% Lowest Sold Price $2,925,000 $2,290,000 –22% Highest Sold Price $18,250,000 $17,812,500 –2% Number of Properties Sold 27 12 –56% Total Dollar Volume Sold $191,747,114 $88,327,500 –54% SINGLE FAMILY HOMES
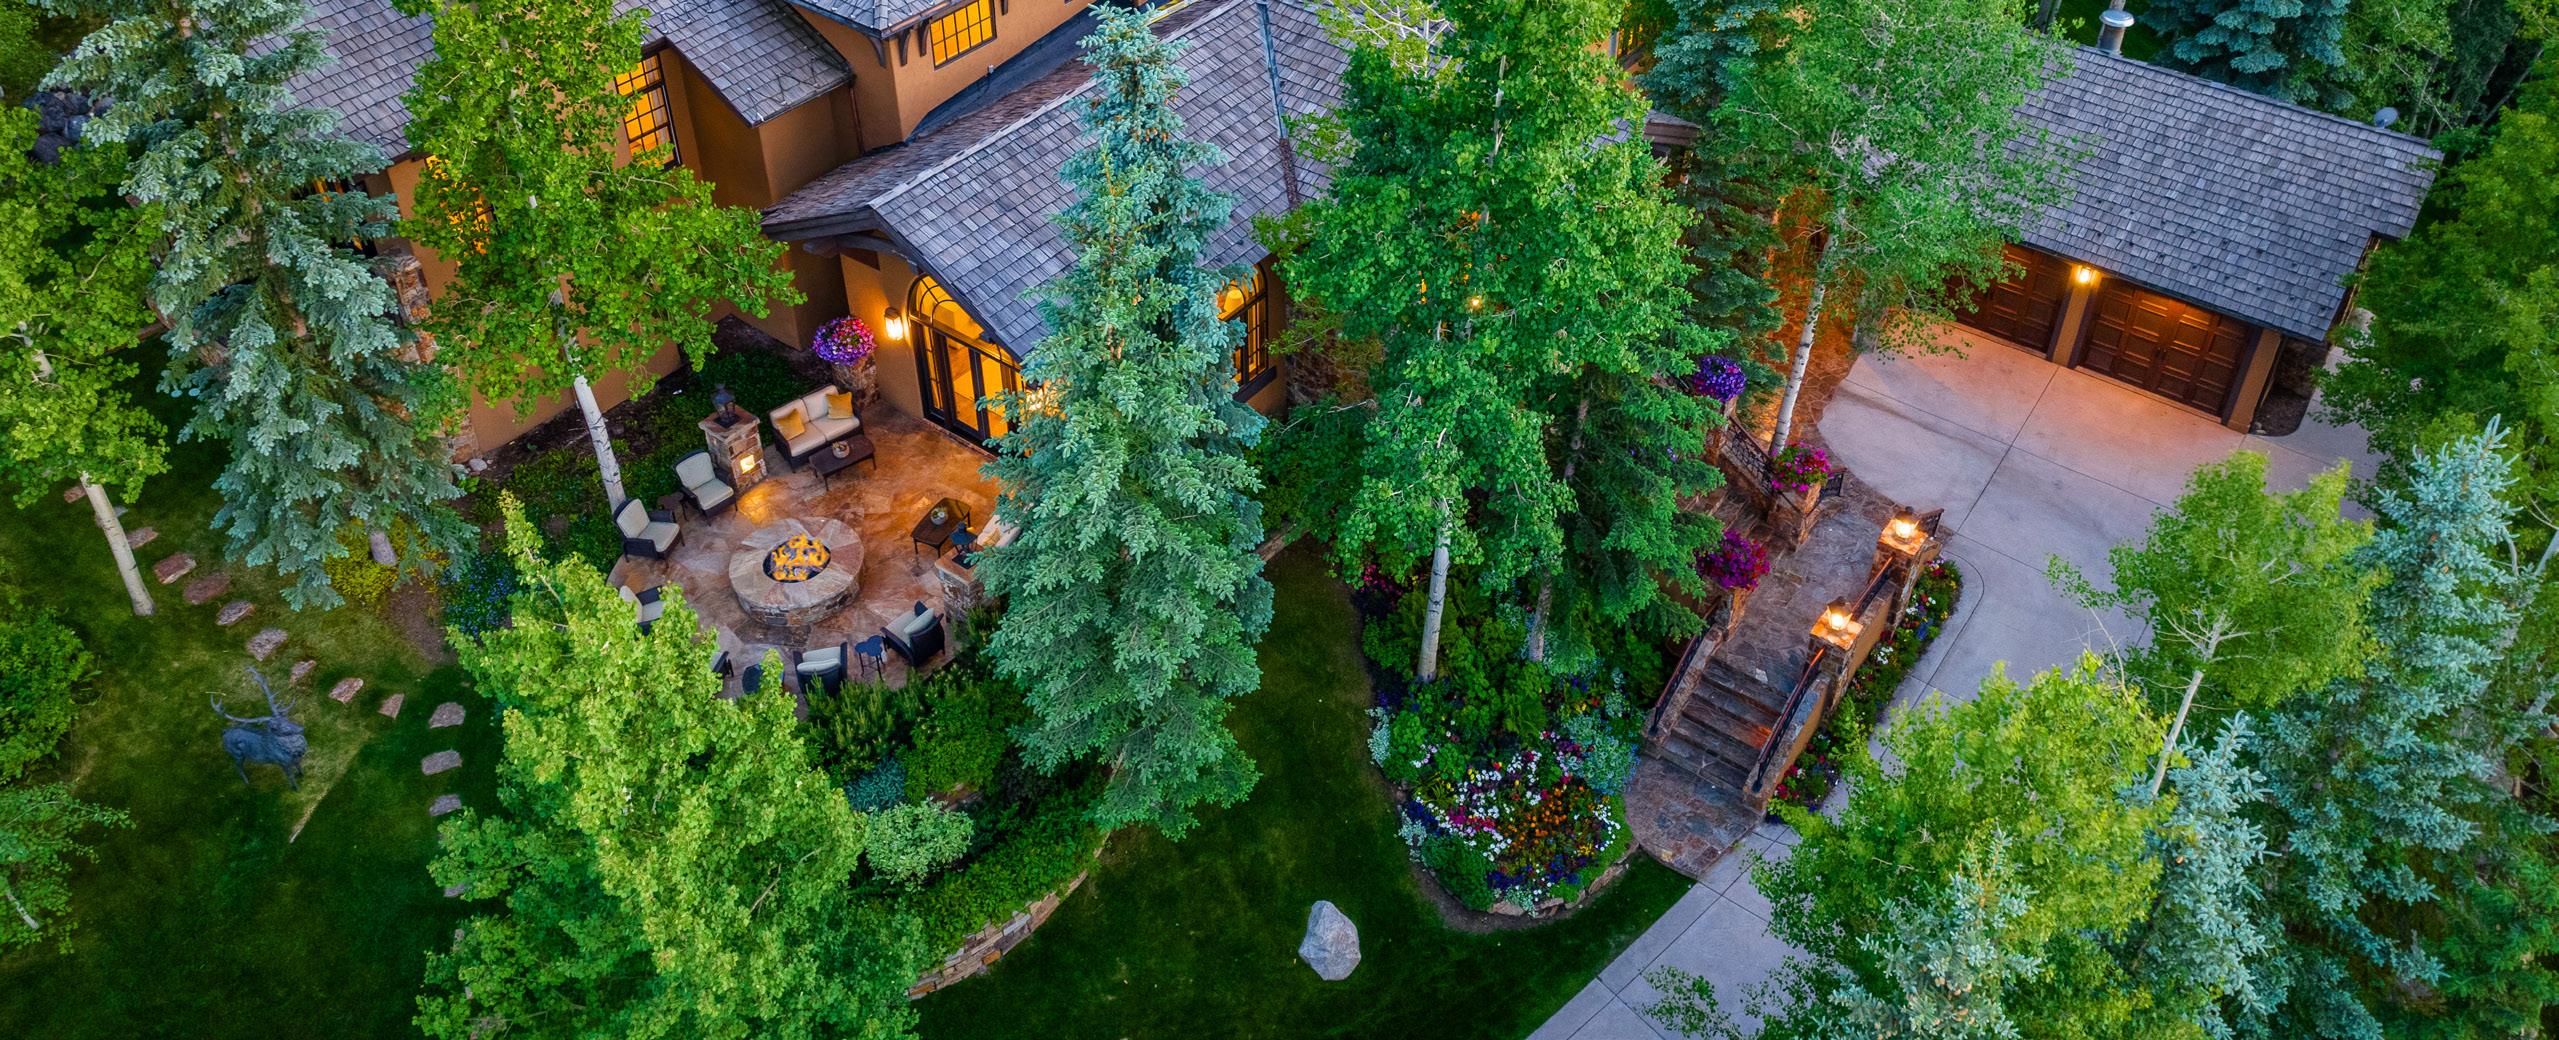
Snowmass Village 2022 VS.
& DUPLEXES Active Listings as of July 1, 2023 Weeks on Average to Sell a Single Family Home Aspen Snowmass Sotheby’s International Realty Total $ Volume Market Share Total Sold Properties in 2023 144 12 110 30%
CONDOMINIUMS, TOWNHOMES
Woody Creek

2022
SECOND QUARTER,
Year Over Year Q2 2022 Q2 2023 % Change Average Sold Price $585,000 $3,338,333 471% Average Sold Price per Sq. Ft. $571 $1,202 111% Average Days on Market 75 101 35% % Sold Price to Original List Price 90% 97% 8% Lowest Sold Price $585,000 $660,000 13% Highest Sold Price $585,000 $8,600,000 1370% Number of Properties Sold 1 3 200% Total Dollar Volume Sold $585,000 $10,015,000 1612% SINGLE FAMILY HOMES 13 86% Active Listings as of July 1, 2023 Aspen Snowmass Sotheby’s International Realty Total $ Volume Market Share
VS. 2023
JANUARY – JUNE
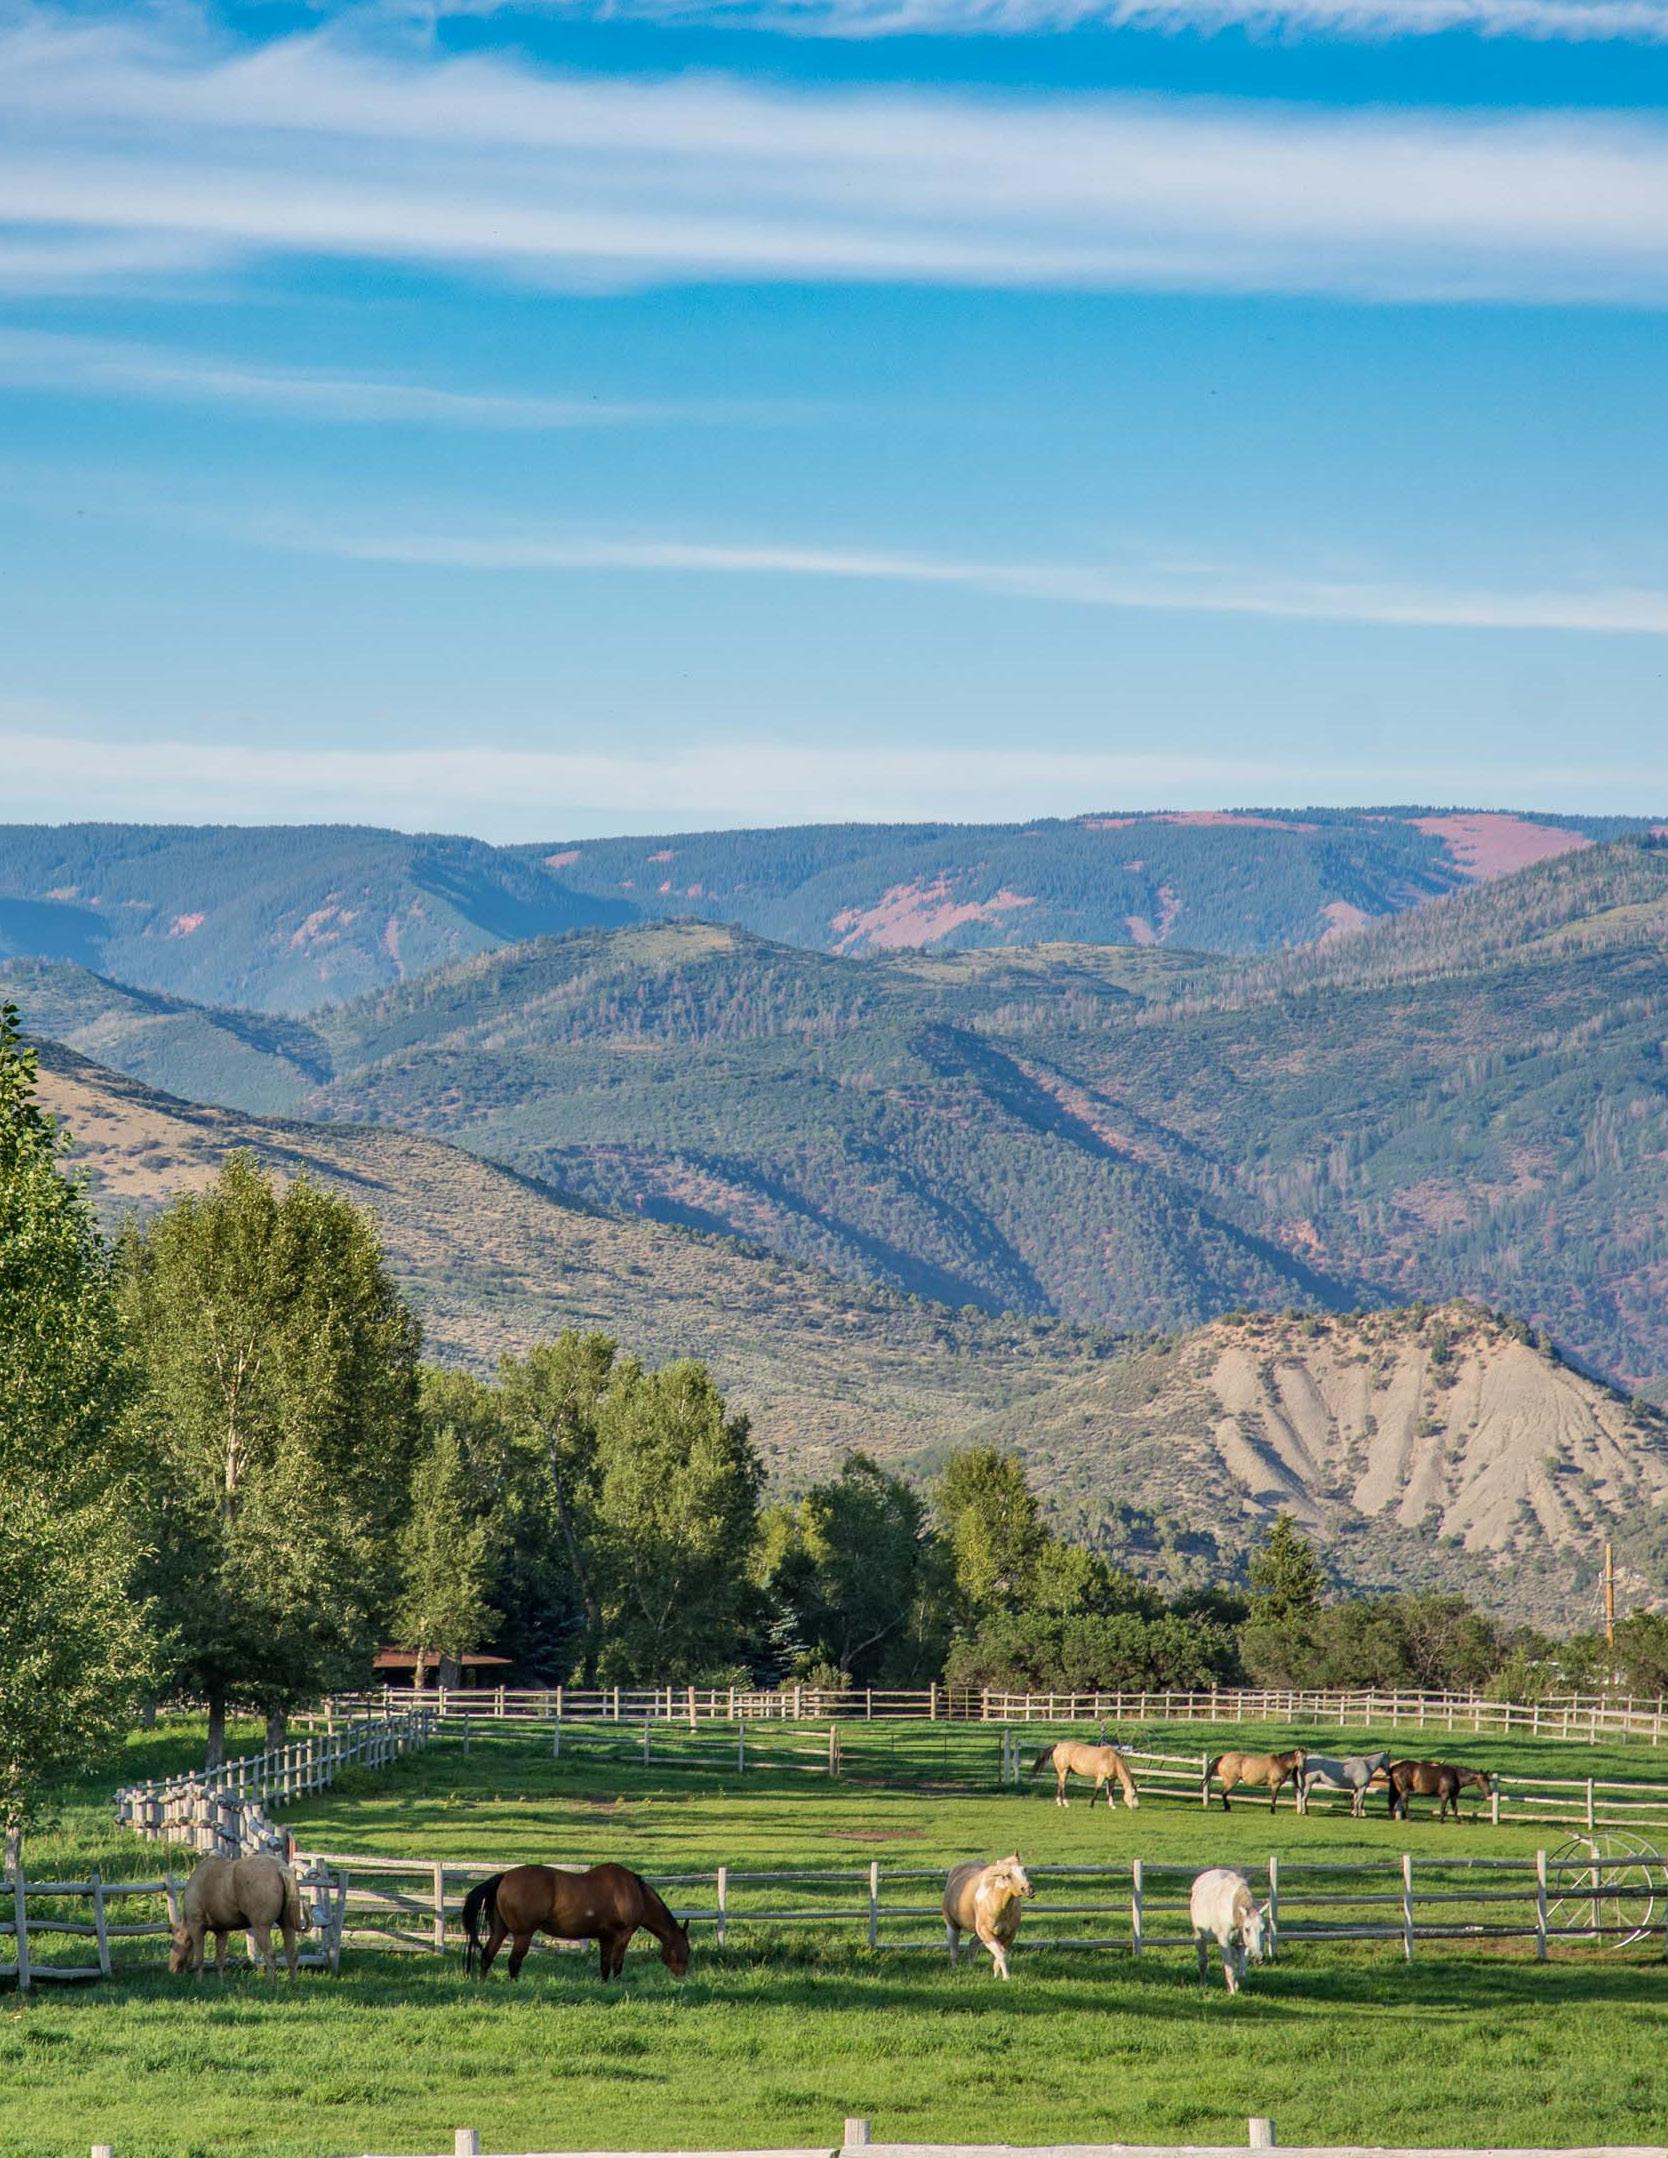
Old Snowmass
2022 VS. 2023 SECOND QUARTER, JANUARY – JUNE
Year Over Year Q2 2022 Q2 2023 % Change Average Sold Price $6,288,462 $4,478,009 –29% Average Sold Price per Sq. Ft. $1,134 $1,541 36% Average Days on Market 236 113 –52% % Sold Price to Original List Price 94% 90% –4% Lowest Sold Price $395,000 $1,800,000 356% Highest Sold Price $41,000,000 $8,300,000 –80% Number of Properties Sold 13 8 –38% Total Dollar Volume Sold $81,750,000 $35,824,070 –56% SINGLE FAMILY HOMES Active Listings as of July 1, 2023 Increase in Average Price Per Square Foot (Q2 2022 vs Q2 2023) 11 $407
2022 VS. 2023 SECOND QUARTER, JANUARY – JUNE
CONDOMINIUMS, TOWNHOMES & DUPLEXES
Q2 Market Update 2023 | 10
Basalt
Year Over Year Q2 2022 Q2 2023 % Change Average Sold Price $1,093,430 $1,287,536 18% Average Sold Price per Sq. Ft. $719 $839 17% Average Days on Market 143 173 21% % Sold Price to Original List Price 101% 98% –3% Lowest Sold Price $340,000 $220,000 –35% Highest Sold Price $2,760,000 $2,860,000 4% Number of Properties Sold 50 37 –26% Total Dollar Volume Sold $54,671,500 $47,638,850 –13% Year Over Year Q2 2022 Q2 2023 % Change Average Sold Price $1,500,565 $2,435,673 62% Average Sold Price per Sq. Ft. $587 $860 47% Average Days on Market 112 132 18% % Sold Price to Original List Price 101% 96% –5% Lowest Sold Price $290,000 $1,025,000 253% Highest Sold Price $4,400,000 $6,000,000 36% Number of Properties Sold 23 26 13% Total Dollar Volume Sold $34,513,000 $63,327,500 83%
FAMILY HOMES
SINGLE
Active Listings as of July 1, 2023 Increase in Average Single Family Home Price per Square Foot (Q2 2022 vs. Q2 2023) Aspen Snowmass Sotheby’s International Realty Total $ Volume Market Share Highest Agricultural Sale in Basalt in 2023 76 47% 33 % $15.5M Please note: Deed-restricted housing units have been excluded from statistics in this report.
2022 VS. 2023 SECOND QUARTER, JANUARY – JUNE
CONDOMINIUMS, TOWNHOMES & DUPLEXES

| Q2 Market Update 2023 11 Carbondale
Year Over Year Q2 2022 Q2 2023 % Change Average Sold Price $913,046 $1,082,621 19% Average Sold Price per Sq. Ft. $487 $555 14% Average Days on Market 275 99 –64% % Sold Price to Original List Price 99% 96% –3% Lowest Sold Price $335,000 $278,000 –17% Highest Sold Price $1,585,000 $2,365,000 49% Number of Properties Sold 24 26 8% Total Dollar Volume Sold $21,913,109 $28,148,158 28% Year Over Year Q2 2022 Q2 2023 % Change Average Sold Price $1,993,915 $2,259,099 13% Average Sold Price per Sq. Ft. $626 $638 2% Average Days on Market 158 160 1% % Sold Price to Original List Price 98% 98% 0% Lowest Sold Price $600,000 $890,000 48% Highest Sold Price $3,550,000 $7,650,000 115% Number of Properties Sold 31 47 52% Total Dollar Volume Sold $61,811,366 $106,177,665 72% SINGLE FAMILY HOMES
Active Listings as of July 1, 2023 Aspen Snowmass Sotheby’s International Realty Total $ Volume Market Share Number of Single Family Homes Sold (Q2 2022 vs. Q2 2023) Average Sold Price of Single Family Homes (Q2 2022 vs. Q2 2023) 58 30% 52% 13%
Glenwood Springs
Q2 Market Update 2023 | 12
SECOND QUARTER,
Active Listings as of July 1, 2023 60 Year Over Year Q2 2022 Q2 2023 % Change Average Sold Price $503,569 $501,231 –0.46% Average Sold Price per Sq. Ft. $351 $435 24% Average Days on Market 116 76 –34% % Sold Price to Original List Price 100% 98% –2% Lowest Sold Price $130,000 $195,000 50% Highest Sold Price $879,000 $900,000 2% Number of Properties Sold 45 26 –42% Total Dollar Volume Sold $22,660,620 $13,031,999 –42% Year Over Year Q2 2022 Q2 2023 % Change Average Sold price $917,088 $969,306 6% Average Sold Price per Sq. Ft. $396 $430 9% Average Days on Market 90 91 1% % Sold Price to Original List Price 99% 97% –2% Lowest Sold Price $365,000 $395,000 8% Highest Sold Price $2,300,000 $3,350,000 46% Number of Properties Sold 82 60 –27% Total Dollar Volume Sold $75,201,254 $58,158,352 –23%
FAMILY HOMES
TOWNHOMES & DUPLEXES Highest Priced Sale in 2023 Total $ Volume Sold 2023 New Agents Joined Our Meadows Office Team in 2023 $158.6M 3 $3,350,000
2022 VS. 2023
JANUARY – JUNE
SINGLE
CONDOMINIUMS,
New Castle
2022 VS. 2023 SECOND QUARTER, JANUARY – JUNE

| Q2 Market Update 2023 13
Year Over Year Q2 2022 Q2 2023 % Change Average Sold Price $380,607 $463,248 22% Average Sold Price per Sq. Ft. $290 $299 3% Average Days on Market 42 168 300% % Sold Price to Original List Price 102% 99% –3% Lowest Sold Price $255,000 $293,000 15% Highest Sold Price $692,000 $717,358 4% Number of Properties Sold 29 22 –24% Total Dollar Volume Sold $11,037,590 $10,191,458 –8% Year Over Year Q2 2022 Q2 2023 % Change Average Sold Price $659,148 $649,208 –2% Average Sold Price per Sq. Ft. $315 $323 3% Average Days on Market 84 83 –1% % Sold Price to Original List Price 100% 99% –1% Lowest Sold Price $380,000 $245,000 –36% Highest Sold Price $1,100,000 $1,250,000 14% Number of Properties Sold 37 31 –16% Total Dollar Volume Sold $24,388,470 $20,125,450 –17% SINGLE FAMILY HOMES
& DUPLEXES Active Listings as of July 1, 2023 Increase in Average Sold Price for Condominiums, Townhomes & Duplexes (Q2 2022 vs Q2 2023) Increase in Average Price Per Square Foot (Q2 2022 vs Q2 2023) 32 22% 3% Total $ Volume Sold 2023 $67.6M
CONDOMINIUMS, TOWNHOMES
Q2 Market Update 2023 | 14 #1 20+ 190+ 18 200+ Exclusive luxury vacation rentals, more than any other local agency Brokerage in rentals and sales Years as market leader Expert broker associates, the largest local network Expert luxury rental specialists Unrivaled results, everytime.
Silt
2022 VS. 2023 SECOND QUARTER, JANUARY – JUNE
CONDOMINIUMS, TOWNHOMES & DUPLEXES
| Q2 Market Update 2023 15
Year Over Year Q2 2022 Q2 2023 % Change Average Sold Price $361,875 $414,300 14% Average Sold Price per Sq. Ft. $239 $230 –4% Average Days on Market 50 51 2% % Sold Price to Original List Price 99% 99% 0% Lowest Sold Price $180,000 $377,000 109% Highest Sold Price $439,000 $500,000 14% Number of Properties Sold 8 5 –38% Total Dollar Volume Sold $2,895,000 $2,071,500 –28% Year Over Year Q2 2022 Q2 2023 % Change Average Sold Price $529,305 $542,592 3% Average Sold Price per Sq. Ft. $287 $285 –1% Average Days on Market 87 83 –5% % Sold Price to Original List Price 99% 97% –2% Lowest Sold Price $305,000 $200,000 –34% Highest Sold Price $934,500 $1,076,000 15% Number of Properties Sold 44 36 –18% Total Dollar Volume Sold $23,289,433 $19,533,300 –16% SINGLE FAMILY HOMES
Active Listings as of July 1, 2023 Total $ Volume Sold 2023 Increase in Average Sold Price for Condominiums, Townhomes & Duplexes (Q2 2022 vs Q2 2023) of 2023 Residential Sales Are Single Family Homes 26 $49.9M 14% 88%
2022 VS. 2023 SECOND QUARTER, JANUARY – JUNE
CONDOMINIUMS, TOWNHOMES & DUPLEXES

Q2 Market Update 2023 | 16 Rifle
Year Over Year Q2 2022 Q2 2023 % Change Average Sold Price $276,558 $298,062 8% Average Sold Price per Sq. Ft. $219 $236 8% Average Days on Market 118 59 –50% % Sold Price to Original List Price 100% 99% –1% Lowest Sold Price $150,000 $155,500 4% Highest Sold Price $351,000 $370,000 5% Number of Properties Sold 26 16 –38% Total Dollar Volume Sold $7,190,500 $4,769,000 –34% Year Over Year Q2 2022 Q2 2023 % Change Average Sold Price $479,655 $494,313 3% Average Sold Price per Sq. Ft. $264 $275 4% Average Days on Market 84 69 –18% % Sold Price to Original List Price 99% 98% –1% Lowest Sold Price $255,000 $150,000 –41% Highest Sold Price $1,500,000 $998,888 –33% Number of Properties Sold 83 51 –39% Total Dollar Volume Sold $39,811,355 $25,209,988 –37% SINGLE FAMILY HOMES
Active Listings as of July 1, 2023 53 Total $ Volume Sold 2023 Decrease in Average Days on Market for Condominiums, Townhomes & Duplexes (Q2 2022 vs Q2 2023) $68.3M 50% On Average, Single Family Homes are Selling 15 Days Faster (Q2 2022 Vs. Q2 2023) 15
Interested in learning more about housing market trends?

Residential Land Report
Q2 Market Update 2023 | 18
2022 VS. 2023 SECOND QUARTER, JANUARY – JUNE 2023 | 18 Year Over Year Q2 2022 Q2 2023 % Change Average Sold Price $5,800,000 No Sales Average Days on Market 40 No Sales Number of Properties Sold 1 No Sales Total Dollar Volume Sold $5,800,000 No Sales WOODY CREEK Average Current List Price $4,250,000 Year Over Year Q2 2022 Q2 2023 % Change Average Sold Price No Sales No Sales Average Days on Market No Sales No Sales Number of Properties Sold No Sales No Sales Total Dollar Volume Sold No Sales No Sales OLD SNOWMASS Average Current List Price $2,810,000 Year Over Year Q2 2022 Q2 2023 % Change Average Sold Price $5,750,000 No Sales Average Days on Market 380 No Sales Number of Properties Sold 1 No Sales Total Dollar Volume Sold $5,750,000 No Sales SNOWMASS VILLAGE Average Current List Price $5,897,000 Year Over Year Q2 2022 Q2 2023 % Change Average Sold Price $11,787,143 $9,708,333 –18% Average Days on Market 337 239 –29% Number of Properties Sold 7 3 –57% Total Dollar Volume Sold $82,510,000 $29,125,000 –65% ASPEN Average Current List Price End of Quarter Active Inventory End of Quarter Active Inventory End of Quarter Active Inventory End of Quarter Active Inventory $12,485,000 17 2 1 4
$1,170,353 $1,695,809 $2,737,885
| Q2 Market Update 2023 19 Year Over Year Q2 2022 Q2 2023 % Change Average Sold Price $470,607 $528,708 12% Average Days on Market 141 197 40% Number of Properties Sold 28 16 –43% Total Dollar Volume Sold $13,177,000 $8,459,325 –36% CARBONDALE Year Over Year Q2 2022 Q2 2023 % Change Average Sold Price $265,553 $316,885 19% Average Days on Market 176 107 –39% Number of Properties Sold 48 13 –73% Total Dollar Volume Sold $12,746,550 $4,119,500 –68% GLENWOOD SPRINGS
LAND
2022
2023 SECOND QUARTER, JANUARY – JUNE Year Over Year Q2 2022 Q2 2023 % Change Average Sold Price $548,583 $490,800 –11% Average Days on Market 108 270 150% Number of Properties Sold 12 5 –58% Total Dollar Volume Sold $6,583,000 $2,454,000 –63% BASALT Year Over Year Q2 2022 Q2 2023 % Change Average Sold Price $1,013,500 $640,235 –37% Average Days on Market 147 153 4% Number of Properties Sold 10 17 70% Total Dollar Volume Sold $10,135,000 $10,884,000 7% MISSOURI HEIGHTS Average Current List Price Average Current List Price Average Current List Price Average Current List Price $1,108,714
End of Quarter Active Inventory End of Quarter Active Inventory End of Quarter Active Inventory End of Quarter Active Inventory 16 46 21 39
RESIDENTIAL
REPORT
VS.
RESIDENTIAL LAND REPORT 2022 VS. 2023 SECOND QUARTER,
Q2 Market Update 2023 | 20 Year Over Year Q2 2022 Q2 2023 % Change Average Sold Price $116,417 $108,375 –7% Average Days on Market 108 86 –20% Number of Properties Sold 34 4 –88% Total Dollar Volume Sold $3,958,170 $433,500 –89% SILT Year Over Year Q2 2022 Q2 2023 % Change Average Sold Price $82,380 $63,167 –23% Average Days on Market 57 234 311% Number of Properties Sold 5 3 –40% Total Dollar Volume Sold $411,900 $189,500 –54% PARACHUTE/BATTLEMENT MESA Year Over Year Q2 2022 Q2 2023 % Change Average Sold Price $175,186 $213,228 22% Average Days on Market 139 263 89% Number of Properties Sold 43 9 –79% Total Dollar Volume Sold $7,533,000 $1,919,050 –75% NEW CASTLE
– JUNE Year Over Year Q2 2022 Q2 2023 % Change Average Sold Price $192,773 $149,500 –22% Average Days on Market 179 186 4% Number of Properties Sold 22 4 –82% Total Dollar Volume Sold $4,241,000 $598,000 –86% RIFLE Average Current List Price Average Current List Price Average Current List Price Average Current List Price $507,632 $192,110
End of Quarter Active Inventory End of Quarter Active Inventory End of Quarter Active Inventory End of Quarter Active Inventory 40 20 31 15
JANUARY
$491,726 $129,073
Stop by any of our offices in the Roaring Fork Valley. AspenSnowmassSIR.com | 970.925.6060 HYMAN MALL (FLAGSHIP OFFICE) 415 E. Hyman Avenue Aspen, CO 81611 970.925.6060 SPRING STREET 300 S. Spring Street Aspen, CO 81611 970.925.6060 EAST DURANT 730 East Durant Avenue Aspen, CO 81611 970.925.1100 PUPPY SMITH 300 Puppy Smith, Suite 211A Aspen, CO 81611 970.925.6060 BASE VILLAGE 110 Carriage Way, Unit 3102 Snowmass Village, CO 81615 970.923.2006 SNOWMASS VILLAGE MALL 50 Snowmass Village Mall Snowmass Village, CO 81615 970.923.2006 BASALT 201 Midland Avenue Basalt, CO 81621 970.927.8080 WILLITS 780 East Valley Road Basalt, CO 81621 970.927.8080 CARBONDALE 333 River Valley Ranch Drive Carbondale, CO 81623 970.963.0400 THE MEADOWS 150 West Meadows Drive Glenwood Springs, CO 81601 970.366.3511


