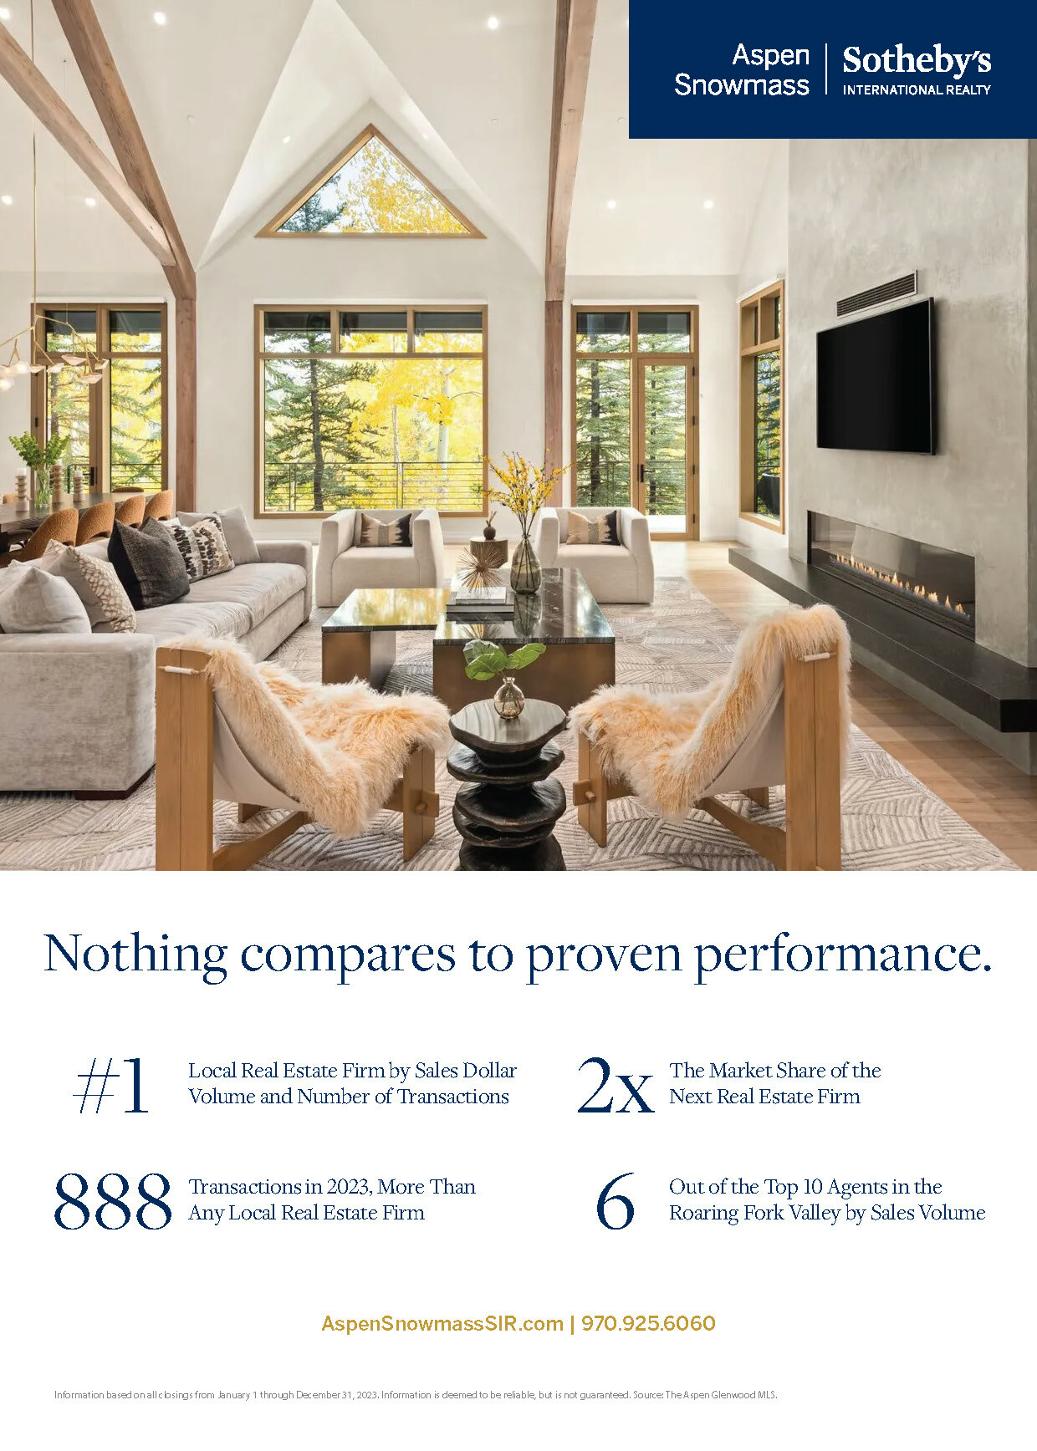
LocalMarket Dominance
We?vebeenthelocalmarket leaderformorethantwentyyears.
10 9 8 7 6 5 4 3 2 3 | Q1MarketUpdate2024
All closings from January 1through April 1,2024 Information is deemed to be reliable,but is not guaranteed Source: The Aspen Glenwood MLS
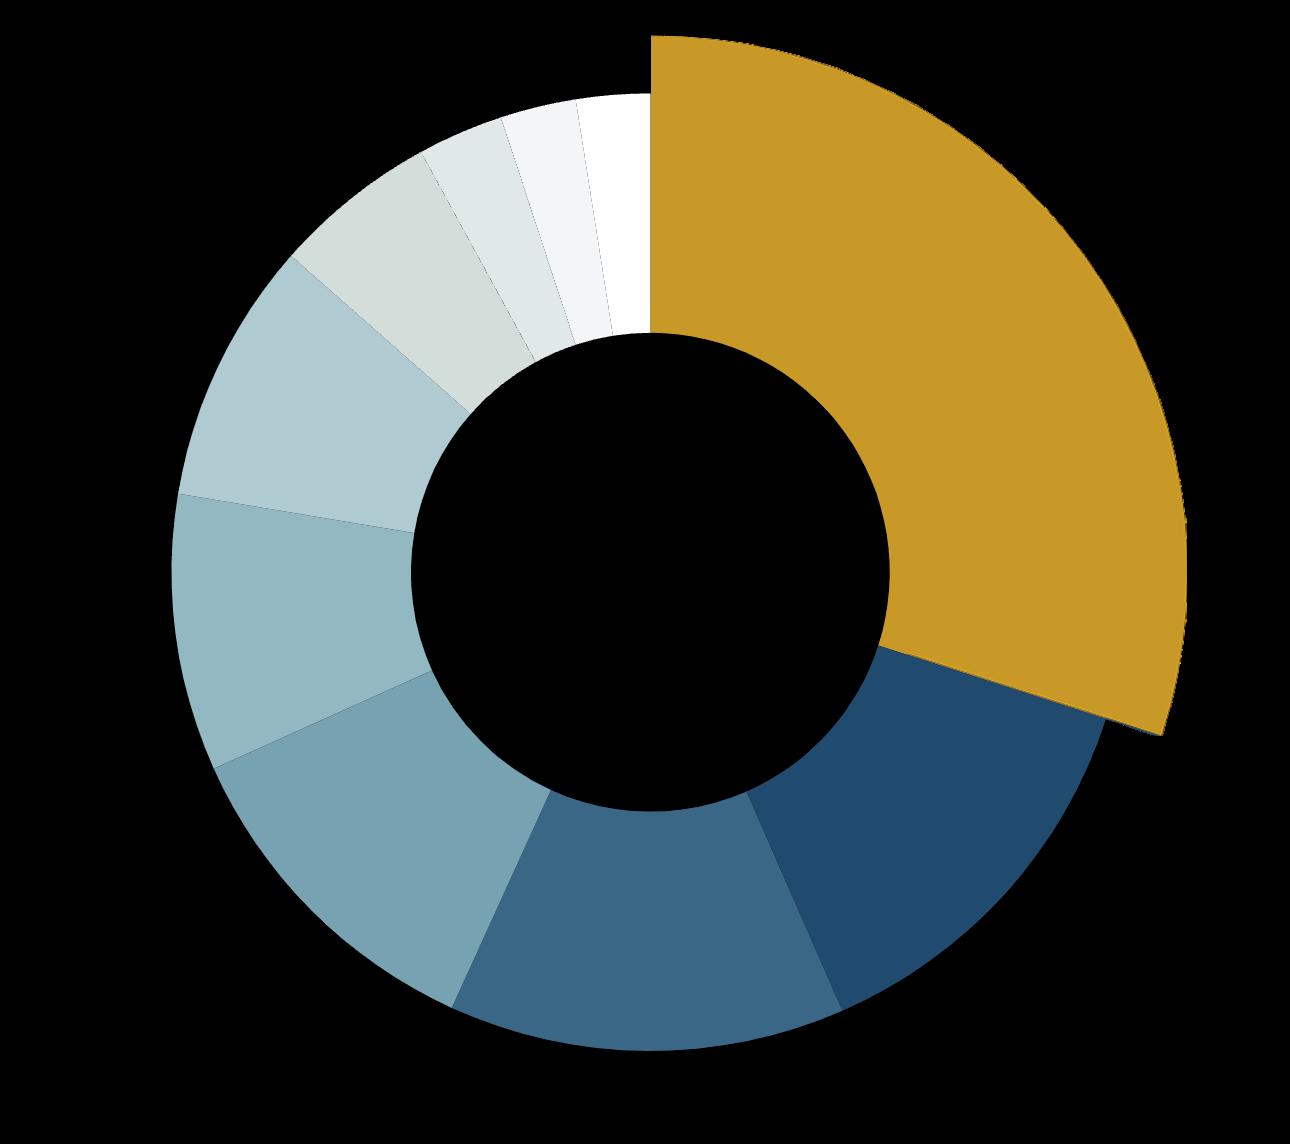
Top 10 Companies Sides $ Volume Market Share Aspen Snowmass Sotheby's International Realty 153 $442,977,072 23 06% Christie's International Real Estate 375 $199,163,417 10 37% Compass Colorado 41 $197,760,000 10 30% Coldwell Banker Mason Morse 81 $169,327,000 8 82% Douglas Elliman Real Estate 38 5 $138,243,500 720% Engel & Volkers 50 $131,194,164 6 83% Hall and Hall Partners 2 $82,150,000 4 28% Eagle Land Brokerage 3 $42,780,000 2 23% Slifer Smith & Frampton 36 $37,805,922 197% The Agency Aspen 1 $36,975,000 192% All Others 497 $442,489,579 23 02% 1 1 2 4 5
Aspen Snowmass Sotheby's International Realty
Christie's International Real Estate
Coldwell Banker
Compass Colorado
Mason Morse
3
Douglas Elliman Real Estate
10 9 8 7 6 5 4 3 2 1 Q1Market Update2024 | 4
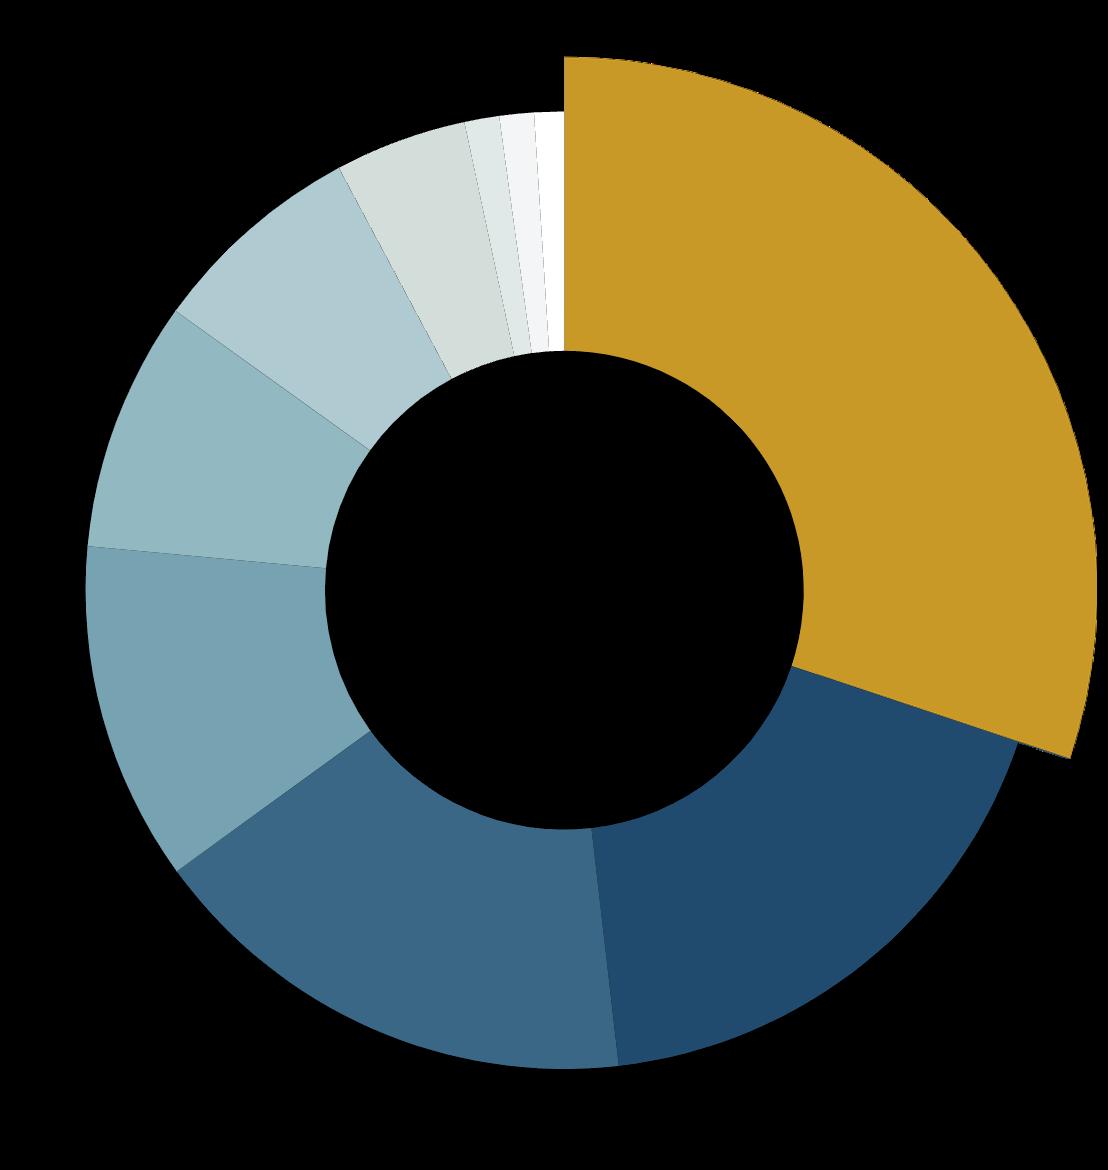
All closings from January 1through April 1, 2024 Information is deemed to be reliable,but is not guaranteed Source: The Aspen Glenwood MLS Top 10 Companies Sides $ Volume Market Share Aspen Snowmass Sotheby's International Realty - 18 $250,200,000 29 23% Compass Colorado 13 5 $149,890,000 1751% Christie's International Real Estate 11 $139,650,000 16 32% Coldwell Banker Mason Morse 8 5 $95,075,000 1111% Douglas Elliman Real Estate 6 $70,150,000 8 20% Engel & Volkers 5 $60,400,000 706% The Agency Aspen 1 $36,975,000 4 32% AGAspen 1 $9,750,000 114% Whitman Fine Properties 1 $9,700,000 113% Slifer Smith & Frampton 1 $8,400,000 0 98% All Others 4 $25,750,000 3 00% 1 2 3 Aspen Snowmass Sotheby's International Realty
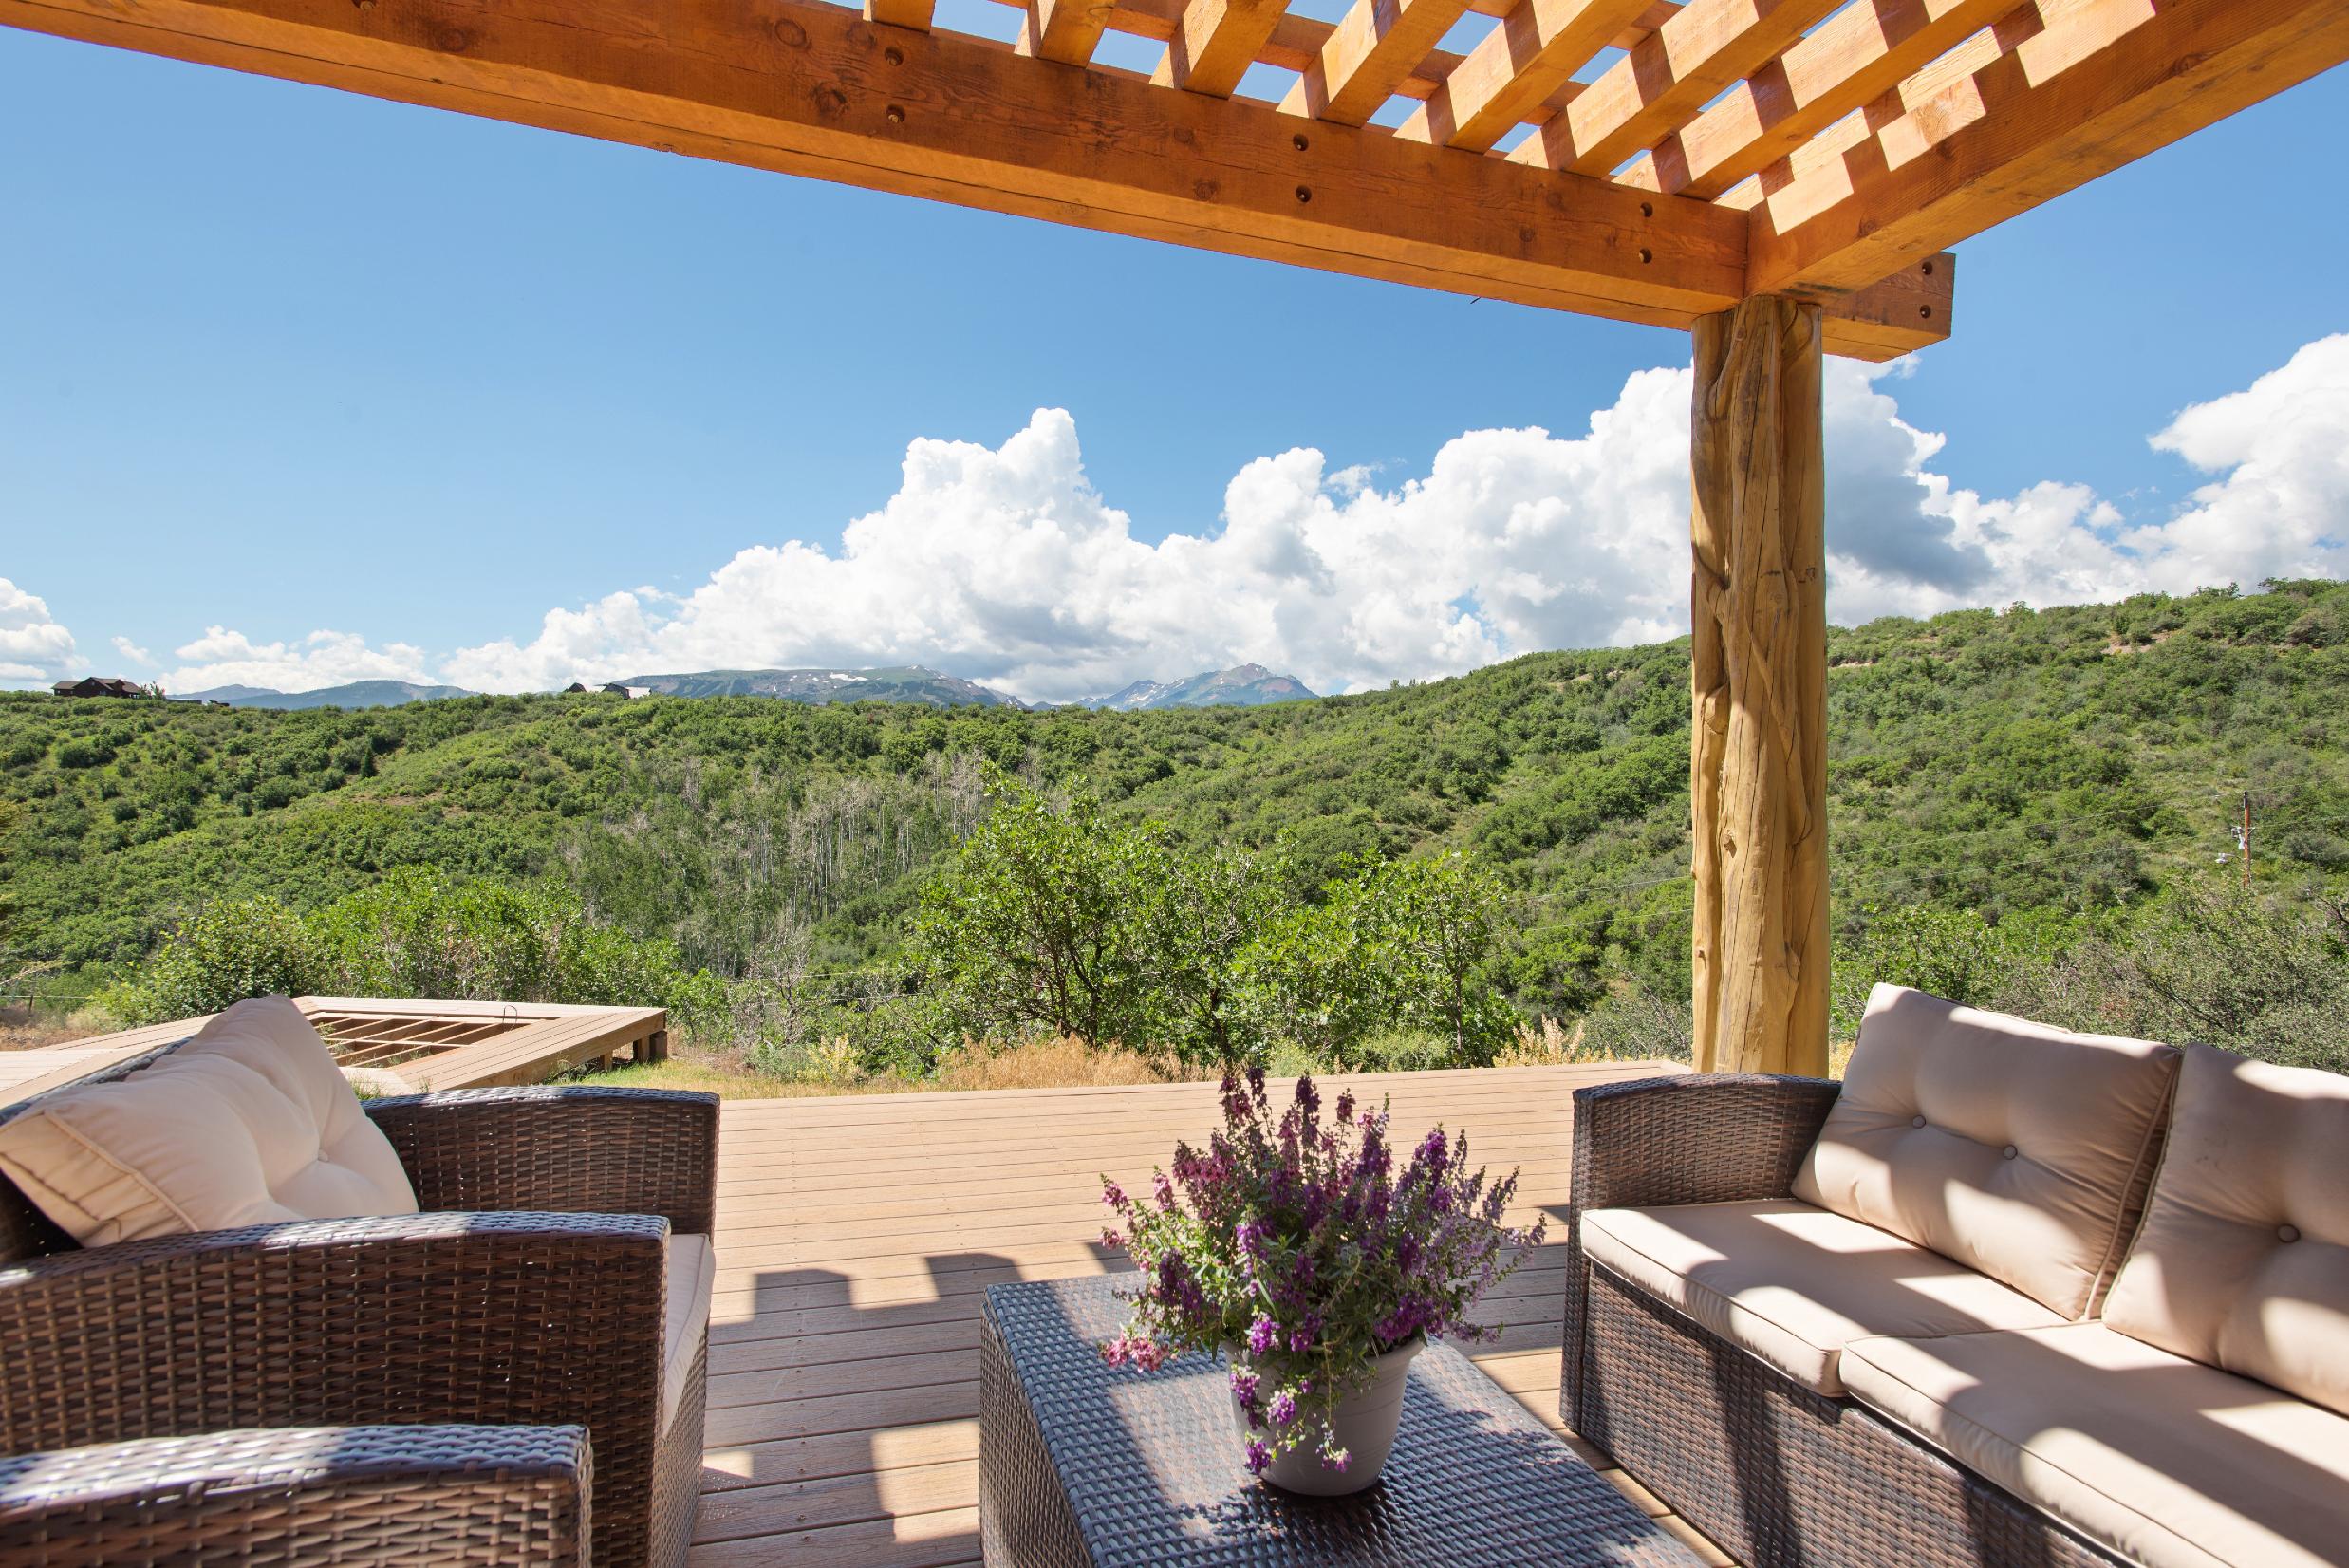
ClosingsOver$5MillioninAspen&SnowmassVillage TheLuxuryMarket
4 5 Christie's International Real Estate
Compass
Colorado
Coldwell Banker Mason Morse
Douglas Elliman Real Estate
Year Over Year Q1 2023 Q1 2024 % Change Average Sold Price $4,332,364 $4,643,004 7% Average Sold Price per Sq Ft $2,704 $3,124 16% Average Days on Market 133 138 4% % Sold Price to Original List Price 94% 96% 2% Lowest Sold Price $830,000 $1,050,000 27% Highest Sold Price $22,000,000 $14,000,000 -36% Number of Properties Sold 22 32 45% Total Dollar Volume Sold $95,312,000 $148,576,125 56% Year Over Year Q1 2023 Q1 2024 % Change Average Sold Price $12,968,377 $15,681,333 21% Average Sold Price per Sq Ft $2,886 $3,389 17% Average Days on Market 205 264 29% % Sold Price to Original List Price 92% 91% -1% Lowest Sold Price $1,175,000 $4,000,000 240% Highest Sold Price $35,000,000 $36,975,000 6% Number of Properties Sold 19 15 -21% Total Dollar Volume Sold $246,399,154 $235,220,000 -5% SINGLE FAMILY HOMES CONDOMINIUMS, TOWNHOMES & DUPLEXES 5 | Q1MarketUpdate2024 Aspen 2023 VS 2024 FIRST QUARTER, JANUARY? MARCH Active Residential Listings as of April 1,2024 175 Total $ Volume Sold by Aspen Snowmass Sotheby's International Realty in Q12024 $266M Aspen Snowmass Sotheby's International Realty $ Volume Participation 26.03% Highest Sale of 2024 $48M
Year Over Year Q1 2023 Q1 2024 % Change Average Sold Price $392,299 $298,457 -24% Average Sold Price per Sq Ft $212 $161 -24% Average Days on Market 269 195 -28% % Sold Price to Original List Price 92% 90% -2% Lowest Sold Price $19,000 $20,000 5% Highest Sold Price $2,250,000 $2,350,000 4% Number of Properties Sold 38 23 -39% Total Dollar Volume Sold $14,907,365 $6,864,500 -54% Year Over Year Q1 2023 Q1 2024 % Change Average Sold Price $402,778 $429,286 7% Average Sold Price per Sq Ft $201 $206 3% Average Days on Market 167 170 2% % Sold Price to Original List Price 94% 93% -1% Lowest Sold Price $210,000 $290,000 38% Highest Sold Price $600,000 $605,000 1% Number of Properties Sold 9 7 -22% Total Dollar Volume Sold $3,625,000 $3,005,000 -17% 2023 VS 2024 FIRST QUARTER, JANUARY ? MARCH 2023 VS 2024 FIRST QUARTER, JANUARY ? MARCH Aspen SharedOwnership SnowmassVillage SharedOwnership SHARED OWNERSHIP SHARED OWNERSHIP Q1Market Update2024 | 6 Active Listings as of April 1,2024 Aspen Snowmass Sotheby?s International Realty Total Sides Market Share 132 41.30% Active Listings as of April 1,2024 Aspen SnowmassSotheby?s International Realty Total $ Volume Market Share 17 39.27%

Aspen Snowmass Sotheby?s International Realty Total $ Volume Market Share SnowmassVillage 2023 VS 2024 FIRST QUARTER,JANUARY? MARCH Year Over Year Q1 2023 Q1 2024 % Change Average Sold Price $2,827,100 $2,450,903 -13% Average Sold Price per Sq Ft $1,573 $1,746 11% Average Days on Market 266 89 -67% % Sold Price to Original List Price 96% 96% 0% Lowest Sold Price $450,000 $200,000 -56% Highest Sold Price $8,789,377 $9,500,000 8% Number of Properties Sold 20 34 70% Total Dollar Volume Sold $56,542,000 $83,330,700 47% Year Over Year Q1 2023 Q1 2024 % Change Average Sold Price $5,352,143 $7,150,000 34% Average Sold Price per Sq Ft $1,518 $1,736 14% Average Days on Market 159 96 -40% % Sold Price to Original List Price 92% 94% 2% Lowest Sold Price $2,290,000 $4,900,000 114% Highest Sold Price $10,750,000 $12,900,000 20% Number of Properties Sold 7 8 14% Total Dollar Volume Sold $37,465,000 $57,200,000 53% SINGLE FAMILY HOMES CONDOMINIUMS, TOWNHOMES & DUPLEXES 7 | Q1MarketUpdate2024 Active Listings as of April 1,2024 138 $72M Lowest Sale in 2024 $200K Highest Sale in 2024 $12.9M
WoodyCreek 2023 VS.2024 FIRST QUARTER, JANUARY? MARCH Year Over Year Q1 2023 Q1 2024 % Change Average Sold Price $3,338,333 $14,350,000 330% Average Sold Price per Sq Ft $1,202 $1,407 17% Average Days on Market 101 280 177% % Sold Price to Original List Price 97% 85% -12% Lowest Sold Price $660,000 $14,350,000 2074% Highest Sold Price $8,600,000 $14,350,000 67% Number of Properties Sold 3 1 -67% Total Dollar Volume Sold $10,015,000 $14,350,000 43% SINGLE FAMILY HOMES 7 44.90% Active Listings as of April 1,2024 Aspen Snowmass Sotheby?s International Realty Total $ Volume Market Share Q1Market Update2024 | 8
| Q1Market Update2024 Year Over Year Q1 2023 Q1 2024 % Change Average Sold Price $3,241,357 $2,525,000 -22% Average Sold Price per Sq Ft $979 $826 -16% Average Days on Market 99 242 144% % Sold Price to Original List Price 94% 74% -21% Lowest Sold Price $1,800,000 $2,525,000 40% Highest Sold Price $5,074,070 $2,525,000 -50% Number of Properties Sold 3 1 -67% Total Dollar Volume Sold $9,724,070 $2,525,000 -74% SINGLE FAMILY HOMES Active Listings as of April 1,2024 9 9 | Q1MarketUpdate2024 OldSnowmass 2023 VS 2024 FIRST QUARTER,JANUARY? MARCH
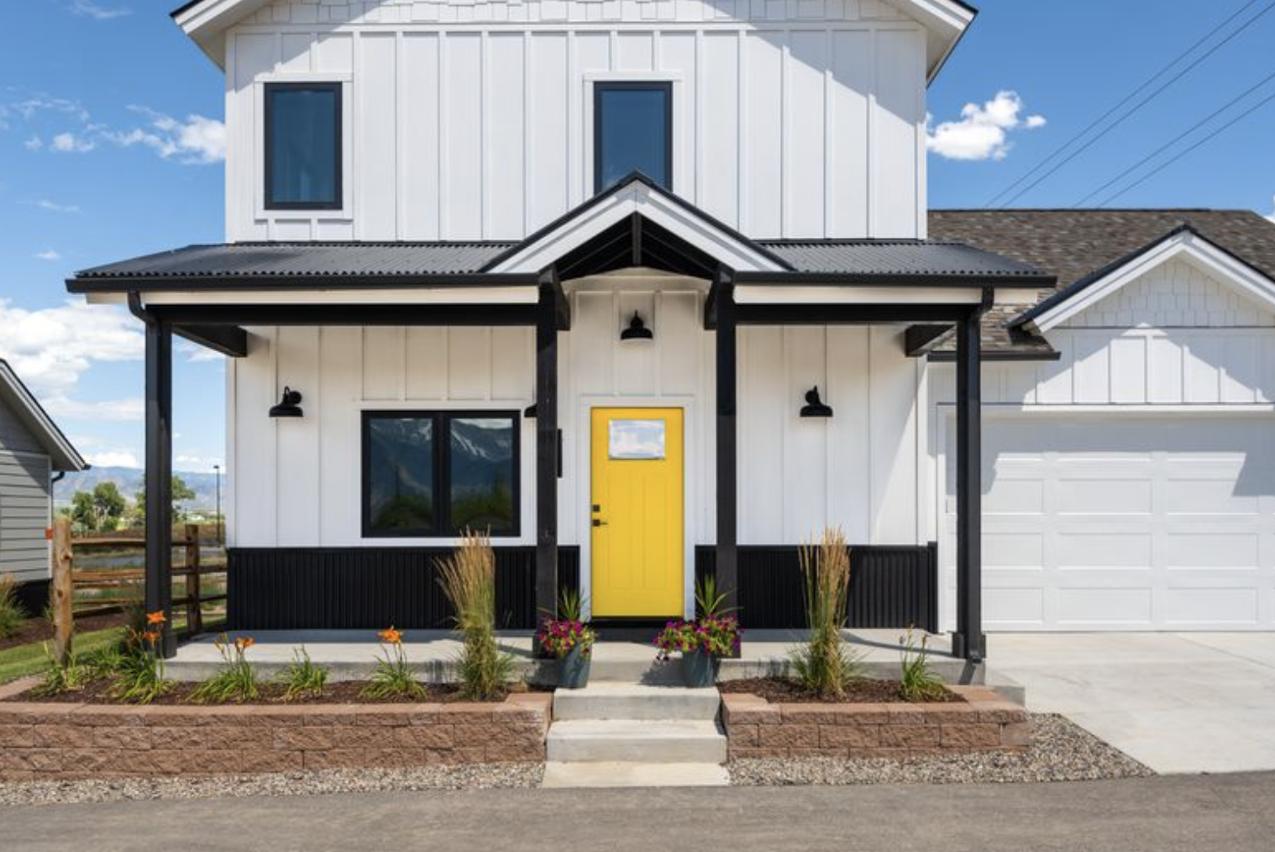
Basalt 2023 VS 2024 FIRST QUARTER, JANUARY? MARCH Year Over Year Q1 2023 Q1 2024 % Change Average Sold Price $1,106,050 $1,319,500 19% Average Sold Price per Sq Ft $803 $809 1% Average Days on Market 74 181 145% % Sold Price to Original List Price 97% 98% 1% Lowest Sold Price $685,000 $685,000 0% Highest Sold Price $2,225,000 $1,995,000 -10% Number of Properties Sold 10 12 20% Total Dollar Volume Sold $11,060,500 $15,834,000 43% Year Over Year Q1 2023 Q1 2024 % Change Average Sold Price $2,170,250 $5,515,833 154% Average Sold Price per Sq Ft $792 $1,967 148% Average Days on Market 134 130 -3% % Sold Price to Original List Price 97% 98% 1% Lowest Sold Price $1,025,000 $1,600,000 56% Highest Sold Price $4,000,000 $15,000,000 275% Number of Properties Sold 12 6 -50% Total Dollar Volume Sold $26,043,000 $33,095,000 27% SINGLE FAMILY HOMES CONDOMINIUMS, TOWNHOMES & DUPLEXES Q1Market Update2024 | 10 Please note: Deed-restricted housing units have been excluded from statistics in this report Highest Sale in 2024 $15M Lowest Sale in 2024 $684K Aspen Snowmass Sotheby?s International Realty Total Sides Market Share 29.81% Active Listings as of April 1,2024 78

Year Over Year Q1 2023 Q1 2024 % Change Average Sold Price $983,841 $1,277,667 30% Average Sold Price per Sq Ft $520 $574 10% Average Days on Market 104 272 162% % Sold Price to Original List Price 97% 94% -3% Lowest Sold Price $278,000 $700,000 152% Highest Sold Price $1,900,500 $2,100,000 10% Number of Properties Sold 10 6 -40% Total Dollar Volume Sold $9,838,410 $7,666,000 -22% Year Over Year Q1 2023 Q1 2024 % Change Average Sold Price $2,165,233 $2,386,520 10% Average Sold Price per Sq Ft $663 $734 11% Average Days on Market 150 147 -2% % Sold Price to Original List Price 96% 97% 1% Lowest Sold Price $960,000 $895,000 -7% Highest Sold Price $5,250,000 $3,850,000 -27% Number of Properties Sold 15 18 20% Total Dollar Volume Sold $32,478,500 $42,957,365 32% SINGLE FAMILY HOMES CONDOMINIUMS, TOWNHOMES & DUPLEXES 11 | Q1MarketUpdate2024 Carbondale 2023 VS 2024 FIRST QUARTER,JANUARY? MARCH Active Listings as of April 1,2024 62 Aspen Snowmass Sotheby?s International Realty Total $ Volume Market Share 30.21% Highest Sale in 2024 $3.85M Lowest Sale in 2024 $285K
Q1Market Update2024 | 12 GlenwoodSprings
Year Over Year Q1 2023 Q1 2024 % Change Average Sold Price $526,928 $528,122 0% Average Sold Price per Sq Ft $445 $448 1% Average Days on Market 76 85 12% % Sold Price to Original List Price 99% 99% 0% Lowest Sold Price $195,000 $225,000 15% Highest Sold Price $900,000 $839,000 -7% Number of Properties Sold 14 11 -21% Total Dollar Volume Sold $7,376,999 $5,809,340 -21% Year Over Year Q1 2023 Q1 2024 % Change Average Sold price $985,229 $1,020,411 4% Average Sold Price per Sq Ft $432 $403 -7% Average Days on Market 115 125 9% % Sold Price to Original List Price 94% 97% 3% Lowest Sold Price $395,000 $567,000 44% Highest Sold Price $3,350,000 $2,075,000 -38% Number of Properties Sold 20 18 -10% Total Dollar Volume Sold $19,704,584 $18,367,405 -7% SINGLE FAMILY HOMES CONDOMINIUMS, TOWNHOMES & DUPLEXES Active Listings as of April 1,2024 52 Total Residential Sales Over $1M 8 Highest Sale in 2024 $2.8M Lowest Sale in 2024 $230K
2023 VS 2024 FIRST QUARTER, JANUARY? MARCH
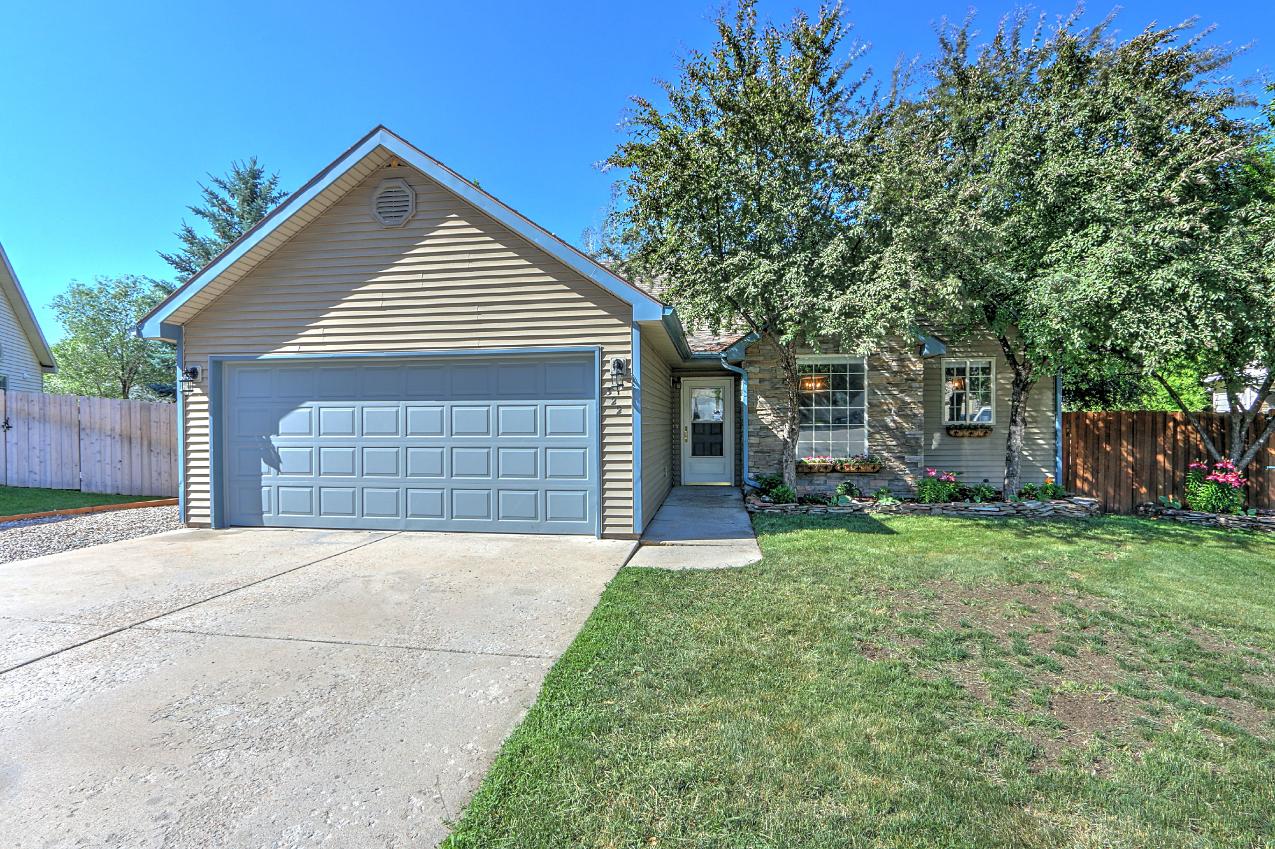
Highest Sale in 2024 Year Over Year Q1 2023 Q1 2024 % Change Average Sold Price $480,055 $471,888 -2% Average Sold Price per Sq Ft $289 $314 9% Average Days on Market 194 89 -54% % Sold Price to Original List Price 99% 99% 0% Lowest Sold Price $365,000 $260,000 -29% Highest Sold Price $665,000 $705,257 6% Number of Properties Sold 11 9 -18% Total Dollar Volume Sold $5,280,600 $4,246,994 -20% Year Over Year Q1 2023 Q1 2024 % Change Average Sold Price $605,329 $635,690 5% Average Sold Price per Sq Ft $303 $356 17% Average Days on Market 99 122 23% % Sold Price to Original List Price 98% 99% 1% Lowest Sold Price $320,000 $510,000 59% Highest Sold Price $1,190,000 $825,000 -31% Number of Properties Sold 12 10 -17% Total Dollar Volume Sold $7,263,950 $6,356,895 -12% SINGLE FAMILY HOMES CONDOMINIUMS, TOWNHOMES & DUPLEXES 13 | Q1Market Update2024 NewCastle Lowest Sale in 2024 $120K Active Listings as of April 1,2024 26 $825K 2023 VS 2024 FIRST QUARTER,JANUARY? MARCH
Q1Market Update2024 | 14

Silt 2023 VS 2024 FIRST QUARTER, JANUARY? MARCH Year Over Year Q1 2023 Q1 2024 % Change Average Sold Price $382,500 No Sales Average Sold Price per Sq Ft $310 No Sales Average Days on Market 14 No Sales % Sold Price to Original List Price 101% No Sales Lowest Sold Price $382,500 No Sales Highest Sold Price $382,500 No Sales Number of Properties Sold 1 No Sales Total Dollar Volume Sold $382,500 No Sales Year Over Year Q1 2023 Q1 2024 % Change Average Sold Price $537,050 $622,357 16% Average Sold Price per Sq Ft $267 $377 41% Average Days on Market 90 79 -12% % Sold Price to Original List Price 95% 97% 2% Lowest Sold Price $300,000 $250,000 -17% Highest Sold Price $1,076,000 $1,560,000 45% Number of Properties Sold 18 14 -22% Total Dollar Volume Sold $9,666,900 $8,713,000 -10% SINGLE FAMILY HOMES CONDOMINIUMS, TOWNHOMES & DUPLEXES 15 | Q1MarketUpdate2024 Active Listings as of April 1,2024 30 Highest Sale in 2024 Lowest Sale in 2024 $229K $1.5M
Rifle Year Over Year Q1 2023 Q1 2024 % Change Average Sold Price $316,000 $301,667 -5% Average Sold Price per Sq Ft $237 $239 1% Average Days on Market 50 73 46% % Sold Price to Original List Price 99% 96% -3% Lowest Sold Price $155,000 $235,000 52% Highest Sold Price $365,000 $395,000 8% Number of Properties Sold 8 9 13% Total Dollar Volume Sold $2,528,000 $2,715,000 7% Year Over Year Q1 2023 Q1 2024 % Change Average Sold Price $483,619 $466,750 -3% Average Sold Price per Sq Ft $252 $281 12% Average Days on Market 81 102 26% % Sold Price to Original List Price 96% 96% 0% Lowest Sold Price $174,000 $300,000 72% Highest Sold Price $935,000 $900,000 -4% Number of Properties Sold 21 20 -5% Total Dollar Volume Sold $10,156,000 $9,335,000 -8% SINGLE FAMILY HOMES CONDOMINIUMS, TOWNHOMES & DUPLEXES Q1Market Update2024 | 16 2023 VS 2024 FIRST QUARTER, JANUARY? MARCH Active Listings as of April 1,2024 37 Highest Sale in 2024 Lowest Sale in 2024 $130K $900K

Interestedinlearningmore abouthousingmarket trends?
At Aspen Snowmass Sotheby?s International Realty,we takea client?first approach,publishing a variety of publications to reveal what?s happening in every sector of thereal estate markets,at both alocal and global scale.
Visit our website or get in touch today.
AspenSnowmassSIRcom | 970 925 6060
17 | Q1MarketUpdate2024
Q2Market Update2024 | ResidentialLandReport 2023 VS 2024 FIRST QUARTER, JANUARY? MARCH Q1Market Update2024 |18 Year Over Year Q1 2023 Q1 2024 % Change Average Sold Price No Sales No Sales Average Days on Market No Sales No Sales Number of Properties Sold No Sales No Sales Total Dollar Volume Sold No Sales No Sales WOODY CREEK Year Over Year Q1 2023 Q1 2024 % Change Average Sold Price No Sales No Sales Average Days on Market No Sales No Sales Number of Properties Sold No Sales No Sales Total Dollar Volume Sold No Sales No Sales OLD SNOWMASS Year Over Year Q1 2023 Q1 2024 % Change Average Sold Price No Sales No Sales Average Days on Market No Sales No Sales Number of Properties Sold No Sales No Sales Total Dollar Volume Sold No Sales No Sales SNOWMASS VILLAGE Year Over Year Q1 2023 Q1 2024 % Change Average Sold Price $6,000,000 $10,425,000 74% Average Days on Market 523 353 -33% Number of Properties Sold 1 4 300% Total Dollar Volume Sold $6,000,000 $41,700,000 595% ASPEN Average Current List Price $10,172,167 End of Quarter Active Inventory 21 Average Current List Price $2,399,000 End of Quarter Active Inventory 2 Average Current List Price $8,148,333 End of Quarter Active Inventory 3 Average Current List Price $3,202,857 End of Quarter Active Inventory 7
Year Over Year Q1 2023 Q1 2024 % Change Average Sold Price $316,167 $445,000 41% Average Days on Market 112 283 153% Number of Properties Sold 3 5 67% Total Dollar Volume Sold $948,500 $2,225,000 135% CARBONDALE Year Over Year Q1 2023 Q1 2024 % Change Average Sold Price $288,417 $368,250 28% Average Days on Market 54 255 372% Number of Properties Sold 6 4 -33% Total Dollar Volume Sold $1,730,500 $1,473,000 -15% GLENWOOD SPRINGS RESIDENTIAL LAND REPORT 2023 VS.2024 FIRST QUARTER,JANUARY? MARCH Year Over Year Q1 2023 Q1 2024 % Change Average Sold Price $490,000 $376,000 -23% Average Days on Market 203 168 -17% Number of Properties Sold 1 5 400% Total Dollar Volume Sold $490,000 $1,880,000 284% BASALT Year Over Year Q1 2023 Q1 2024 % Change Average Sold Price No Sales No Sales Average Days on Market No Sales No Sales Number of Properties Sold No Sales No Sales Total Dollar Volume Sold No Sales No Sales MISSOURI HEIGHTS 19 | Q1MarketUpdate2024 Average Current List Price $1,052,000 End of Quarter Active Inventory 14 Average Current List Price $838,087 End of Quarter Active Inventory 31 Average Current List Price $2,444,077 End of Quarter Active Inventory 13 Average Current List Price $1,288,643 End of Quarter Active Inventory 28
Year Over Year Q1 2023 Q1 2024 % Change Average Sold Price $95,833 $93,500 -2% Average Days on Market 109 61 -44% Number of Properties Sold 3 3 0% Total Dollar Volume Sold $287,500 $280,500 -2% SILT Year Over Year Q1 2023 Q1 2024 % Change Average Sold Price $79,000 $81,300 3% Average Days on Market 303 54 -82% Number of Properties Sold 1 5 400% Total Dollar Volume Sold $79,000 $406,500 415% PARACHUTE/ BATTLEMENT MESA Year Over Year Q1 2023 Q1 2024 % Change Average Sold Price $151,017 $128,000 -15% Average Days on Market 243 186 -23% Number of Properties Sold 3 6 100% Total Dollar Volume Sold $453,050 $768,000 70% NEW CASTLE RESIDENTIAL LAND REPORT 2023 VS.2024 FIRST QUARTER,JANUARY? MARCH Q1Market Update2024 | 20 Year Over Year Q1 2023 Q1 2024 % Change Average Sold Price No Sales $162,833 Average Days on Market No Sales 92 Number of Properties Sold No Sales 6 Total Dollar Volume Sold No Sales $977,000 RIFLE Average Current List Price $819,445 End of Quarter Active Inventory 30 Average Current List Price $525,000 End of Quarter Active Inventory 1 Average Current List Price $392,180 End of Quarter Active Inventory 34 Average Current List Price $352,763 End of Quarter Active Inventory 19

AspenSnowmassSIR com | 970 925 6060 HYMAN MALL (FLAGSHIP OFFICE) 415 E Hyman Avenue Aspen, CO 81611 970 925 6060 SPRING STREET 300 S Spring Street Aspen, CO 81611 970 925 6060 EAST DURANT 730 East Durant Avenue Aspen, CO 81611 970 925 1100 SNOWMASS VILLAGE MALL 50 Snowmass Village Mall Snowmass Village,CO 81615 970 923 2006 BASALT 201Midland Avenue Basalt, CO81621 970 9278080 WILLITS 780 East Valley Road Basalt, CO81621 970 9278080 CARBONDALE 333 River Valley Ranch Drive Carbondale,CO 81623 970 963 0400 GLENWOOD SPRINGS 150 West Meadows Drive Glenwood Springs, CO 81601 970.366.3511 Stop by any of our
Fork
offices in the Roaring
Valley today.