
Natalie Barrett David Bray, PhD Mary Versa Clemens-Sewall Kiran Jivnani Anthony Scriffignano, PhD DETECTING DISRUPTION IN CLOSED SYSTEMS: A Unique Data Partnership For Human Benefit Atlantic Council GEOTECH CENTER

Natalie Barrett
David Bray, PhD
Mary Versa Clemens-Sewall Kiran Jivnani Anthony Scriffignano, PhD
ISBN: 978-1-61977-245-8
Cover image: by Pawel Czerwinski, for Unsplash
The microscope and telescope unlocked new dimensions for discovery and enabled humanity to explore hidden eco systems, formulate new solutions to problems, and advance societies. Analysis of data, particularly when enabled by today’s computational techniques and advanced comput ers, similarly reveals hidden dimensions of our world and provides novel insight into complex patterns such as the interactions among people, infrastructure, and social sys tems. Such discoveries, when harnessed by policymakers, have the potential to positively impact our world.
This report provides an example of such groundbreaking insight derived from analysis of Dun & Bradstreet’s com mercial data set in combination with research and analysis provided by the Atlantic Council GeoTech Center and Johns Hopkins University Applied Physics Laboratory.
The Atlantic Council GeoTech Center’s mission is to shape the future of technology and data together to advance people, planet, prosperity, and peace. The GeoTech Center serves as an essential bridge between technologists and policymakers, bringing them together to consider the broader societal, economic, and geopolitical implications of new and emerging technologies; leverage technology to solve global challenges; and develop actionable tech nology policy, partnerships, and programs.
Detecting Disruption in Closed Systems is a unique en deavor that fulfills every facet of this mission.
The data collaboration was made possible by Dun & Bradstreet, which played an essential role by providing the following:
1. Access to its commercial data set and Analytics Studio, a cloud-based platform. The Analytics Studio software was made available to a project team comprising GeoTech Center staff and fellows as well as a team of researchers from the Johns Hopkins University Applied Physics Laboratory team.
2. The expertise and staff time of a Dun & Bradstreet team of data scientists, who conducted the data analysis and contributed to the writing of the re port, primarily to ensure that the description of the methodological approach is accurate.
3. A gift to support the work of the GeoTech Center in producing this report.
Anthony Scriffignano, PhD, facilitated the partnership between Dun & Bradstreet and the GeoTech Center. He serves on the
Commission on the Geopolitical Impacts of New Technologies and Data, established by the Atlantic Council in 2021, and is a senior vice president and chief data scientist at Dun & Bradstreet Corp. He has contributed to data science practices at Dun & Bradstreet and is the primary inventor on many pat ents globally in the space of data and information processing. Due to the proprietary nature of the commercial data and the expertise needed to analyze it, the majority of the data was analyzed by a Dun & Bradstreet team reporting to him.
He also contributed meaningfully to the writing of this report, particularly to the statistical background, study methodology, and results sections. The methodology of this report and all the analyses conducted by Scriffignano and his team were closely examined and deemed sufficiently rigorous by third-party experts, primarily from the John Hopkins University Applied Physics Laboratory. A full list of contributors and their roles is available in the acknowledgments section of this report.
The Atlantic Council GeoTech Center created a framework for data sharing by the private sector that allows for vetted data analysis to be provided to policymakers with the goal of benefiting citizens and providing increased situational awareness for closed communities such as military bases or other closed ecosystems of high value and importance. The ground rules for data sharing and methodological val idation put in place by the GeoTech Center ensured that the methodology, analysis, and conclusions are sound, ac curate, and rigorous. In keeping with our intellectual inde pendence, the findings and guidance included in this report are independent of the views of our partner.
The responsible use of these commercial data sets can con tribute significantly to the protection of democracy, national security, and society. This collaboration on the part of Dun & Bradstreet represents a pioneering effort by a private-sector company to make data and analytical capabilities more acces sible to policymakers for the public good. We believe that such private, civil, and public-sector data collaborations are essential to securing our future and hope other organizations with join us in making data and meaningful analysis more accessible.
The Atlantic Council GeoTech Center is extremely proud to present this body of work.
Stephanie Wander Director of Programs Lloyd Whitman, PhD Senior DirectorEditor’s Preface and Acknowledgments ii
Executive Summary 1 Study Context and Goals 1 Study Assumptions and Context 2
Contextual Assumptions 2 Attributes Posited in Study 2 Specific Study Methodology 3
Extracting a Sample of Bases 3
Selecting a Set of Known Perturbing Events 3 Employing Identity Resolution and Heuristic Evaluation 3
Selecting a Physical Centroid 4
Establishing Connectivity in Time and Through Time 4
Measuring Perturbation 5
Methodological Validation 6
Review of Statistical Methodology 6 Results 6
Discussion of the Implications and Potential Limitations 10
Implications with Regard to the Elasticity of Decisions 10
Potential Limitations and Remedies 10
Regarding Changes in Observable Data and Human Behaviors 10
Regarding Open-Source Data Implications 11
Possible Next Steps Based on This Study 11 Summary and Closing Implications 11
About the Authors 12
Acknowledgments 14
Editorial Acknowledgments 14
Analytic Acknowledgments 14
Disruption is a natural part of life. It can appear in many forms including natural disasters, economic crashes, and social conflicts. The world’s resiliency to disruptions, par ticularly natural disasters has greatly improved over the past few decades. This resiliency is, in large part, due to enhanced detection and warning capabilities enabled by extensive data sets and commercial analytics.
In order to improve resiliency to disruptions, one must un derstand the strengths and weaknesses of an individual community. This understanding is more complicated for isolated and closed communities. However, recent devel opments in commercial data aggregation and creative data analytics have allowed data experts to overcome this chal lenge. This paper utilizes commercial data aggregation and data analytics to evaluate whether commercial data sets can be used to better understand the resiliency of closed military communities or other closed ecosystems of high value and importance.
In this report, the authors demonstrate that it is possible to analyze commercial data sets to understand resiliency by detecting disruptions (also referred to as perturbations to account for the possibility that changes in interaction can occur without external influence) around military bases or other important geographically localized institutions both isolated in time (e.g., hurricanes) and enduring through time (e.g., pandemic restrictions). The study reveals indications and warnings can be derived from commercial data sets and the observable imprint all organizations leave in com mercial data sources.
As such, this study’s methodology may be employed, ex panded, and refined to analyze other closed communities. It is anticipated that any attempts to camouflage or hide such changes will themselves leave new anomalies that this analytic means can detect.
Disruptions serve to tip off leaders about upcoming or ongoing challenges. They empower leaders to reduce community vulnerabilities to outbreaks, food scarcity, and regional instability. As the world becomes increasingly digi tized, humanity has an opportunity to better understand the impacts of human activities on the globe as well as nature’s impacts on society.
In sum, there are five major takeaways from this report for leaders in both the public and private sectors:
1. The increasing digitization of the planet enables subtle tips and cues to be derived from commercial data, as described in the report.
2. Those seeking to keep their activities confidential need to be aware of the “digital exhaust” they may be producing associated with adjacent activities within the broader ecosystem in which they operate.
3. It is anticipated that any attempts to camouflage or hide such perturbations will themselves leave irregularities that analytic means can detect.
4. Those seeking to better understand the planet should consider how commercial data sets can provide indicators and warnings associated with phenomena such as famine.
5. As organizations and societies become increas ingly digitized, people will be able to understand the impact of human activities on the world, as well as nature’s disruptions on human societies, better than ever before.
Subsequent sections of this report convey the analytic methodology, results, discussion of possible limitations, po tential extensions and next steps, and closing implications.
A natural part of life, disruptions can appear in many forms, particularly at the intersections of natural, climate, and human ecosystems. By understanding what perturbations in commercial data patterns reveal about potential disrup tions in far more closed systems of activities and coordi nation, one can better understand the phenomenological interactions in such ecosystems.
The research conducted for this project had both scientific and ethical goals. The primary scientific goal was to study the impact of acute disruptions on chosen military commu nity ecosystems by observing perturbations in the patterns of the businesses in the commercial ecosystem surrounding the base. This was done by using commercial data provided by Dun & Bradstreet.
Other scientific goals included: determining if commercial data can partially evaluate the resiliency of the associated ecosys tem surrounding a military base (or other closed ecosystems of high value and importance) in the face of disruptions, and determining if any of the chosen military communities have clusters of influential entities that can be held responsible for shaping how these communities react to short, isolated dis ruptions in time and long disruptions through time.
This research also sought to inform defense officials and community leaders how commercial data can be used by
any party, friendly or adversarial, to gauge a community’s resiliency to disruptions and to indicate weak spots in their community needing improvement, particularly regarding disruptions that repeat and potentially worsen, such as those caused by climate change.
To what extent can we meaningfully observe disruption to a known location by observing perturbation in the commer cial ecosystem that physically surrounds it?
The authors of this report conducted this study to measure the impact of acute disruptions on selected military commu nity ecosystems by observing perturbations in the commer cial activities of the businesses in military base ecosystems that are discoverable in commercial data provided by Dun & Bradstreet.
The analytic method used to measure perturbation in this study, an application of geospatial inference methods and Jensen-Shannon divergence,1 works best for military bases or other geographically localized institutions that are large enough to anchor commercial ecosystems. This method also works best for localized institutions that are not near other large economic hubs, such as other military installa tions, as this raises the specter of multimodal effects.
The military installations selected are each separated spa tially from large commercial or government presences, ei ther by distance or de facto boundaries. In each case, the base therefore drives the local area’s economy. Specifically, the military base’s presence justifies the decision of most residents to live and interact commercially nearby.
This study can be applied internationally to military bases and other closed ecosystems, although this method should work best for countries that invest significantly in their mili tary presence and advancement of their installations, along with countries that have significant levels of private-sector data relating to the surrounding ecosystem, and are open to information and data sharing without significantly limiting government control and surveillance.
To construct an empirically rigorous methodology, this study progressively decomposed the conceptual founda tion of the method and formally articulated its axioms and related epistemology. Specifically, this study centered on the following research question:
There are certain presumptions which inform this question. These presumptions are based on the collective experi ence of a group of individuals who are familiar with the types of locations being studied and familiar with commer cial ecosystems. For example, it is commonly known that some individuals who work in such locations travel to and from work. While doing so, they engage in commerce such as buying food, getting car repairs, possibly staying in local hotels, or other commercial transactions. The locus of oper ation itself also engages in commerce with the surrounding ecosystem in many ways such as hiring local practitioners (e.g., cleaning services, road works), community outreach, or consuming locally available goods and services.
Moreover, for the purposes of this study, certain aspects of the entities and environment were presumed to be true. It is certainly possible to construct other studies to test any of these stipulations, however they were held to be true for the purposes of this exercise. The table below describes them.
A1 There is a set of potentially disrupted entities in ecosystems of interest (e.g., military installations or other closed ecosystems of high value and importance) which are identifiable in a way that is empirically rigorous and commonly accepted.
A2 There exists sufficient, well-curated data regard ing the entities in A1 that are stable and represen tative over time.
A3 There exists sufficient longitudinal data to under stand the impact in the entities in A1 surrounding well-understood prior disrupting events (e.g., major natural disasters and significant organiza tional changes).
A4 Latency in the data will be controlled sufficiently with respect to the disrupting events studied.
Of note, this study was not investigating near-term disrup tion where the system is changing faster than the data that describes it. Other methods exist for that class of problem, which are not part of this specific study’s effort.
1 The Jensen-Shannon divergence is named after Jensen’s inequality and the Shannon entropy from information theory. The formulation of the divergence appears to have been introduced in the academic literature by Wong and You in 1985, but it is closely related to the Jensen-Shannon distance introduced by Rao the same year.
This study proposed additional attributes of the entities and ecosystem, and the implementation of the methodology on selected bases intended to clarify the stipulations’ veracity. They include:

It is possible to establish measures of the character and quality of entities or relationships that are part of the theoretical universe tied to Axiom A1, but not repre sented in the corpus of data.
It is possible to establish one or more metrics, which will be tractable and compelling to characterize disruption, in the context of the phases of response.
It may be possible to address key sources of bias including:
• Malfeasance (e.g., manipulation of data, veracity, intentional redaction of derogatory information)
• Observer effects (e.g., individuals/organizations which are aware of the collection of data can change their behavior)
• Latency
Moreover, it may be possible to sensitize or desensitize the methodology according to observable characteris tics such as the density of the commercial ecosystem, limiting geospatial characteristics that may affect inter action with the ecosystem, or other observable traits.
This study began by extracting a sample of bases to study, taking into consideration geography. The major steps of the methodology are summarized in Figure 1.
To initially assess the viability and efficacy of this study’s method, a series of bases were selected where it was known
in advance there should be sufficiently robust data. The pau city of data in certain geographies represented a potential limit on the ability to execute a method such as that pro posed. Accordingly, bases were chosen in North America for the initial round of testing, based on availability of sufficiently robust ecosystem data to demonstrate the methodology.
This presumption of study does not preclude the availability of sufficient data elsewhere. Rather, it represents a rea sonable first step with controls for possible missing data or other constraints. The geographical restriction ensured reasonably consistent data, allowing assignable cause vari ation in the results to be accountable to aspects other than quality issues or other absences in the data.
For the purposes of studying perturbation in the selected bases, there was a desire to identify longitudinal data that would contain well-understood perturbation. The authors considered two types of perturbation. The first type was perturbations in time, which occur in a specific, known and reasonably short timeframe. Examples include natural di sasters such as hurricanes, as well as specific events such as fires or other human-made events. The second type was perturbations through time, which occur over a longer time duration, exhibiting their impact in a more protracted pre sentation. Examples of perturbations through time include response to potential base closings, major organizational changes, and ongoing response to lack of availability of some critical dependency such as locally sourced materials.
To maximize the likelihood of detecting perturbation, initial efforts focused on events in time or through time that had sufficient scope and scale. Expert interviews informed the construction of a small list of well-understood and signifi cantly disruptive events at specific bases. The disruptions were understood either because of direct involvement with
Figure 1. Flowchart of Study Methodologythe perturbation or because the impact of the event on the location was so significant that it was widely recognized. The majority of these were perturbations in time.
Each base in this study was identified in commercial data sets through a commercially available, bespoke identity resolution process, which entails comparing data points and deciding if they represent the same “entity.”2 This pro cess took into account the possibility of multiple entities that could correspond to the base, as well as treatments for geospatial complexity (e.g., intervening mountains, water ways). This process also included treatments for confound ing aspects of identity resolution including multiple names for locations, postal standards, entities with similar sound ing names, orthographic variation, and other characteristics of the data. Robust stewardship rules were employed to ensure consistency across the identity resolution process, as well as heuristic evaluation of results to ensure a recog nizable foundation for the downstream evaluation.
For the purposes of establishing a centroid around the base from which to draw the commercial ecosystem, multi ple methods were considered. Overly simplified Euclidean methods3 were rejected due to known bias that such ap proaches would introduce (e.g., sensitivity is elastic with respect to density of the area of interest). Highly sophisti cated methods that consider the nonspherical nature of the Earth were also rejected because they introduced unneces sary complexity and did not improve the utility of the results for informing decisions.
The ultimate decision was to establish centroids based on haversine distance,4 and scaled according to the known business density in the centroidal region. Accordingly, highly dense areas produced small centroids while sparser areas produced larger centroids. Conservative scaling fac tors were used for the initial iterations of the method to reduce the size of the commercial ecosystem to facilitate the evaluation of the results by human raters.

A set of similarly instructed human raters were asked to evaluate the efficacy of the establishment of centroids. The raters responded that the centroids matched their expecta tions for commercial ecosystems. Since the method used is empirically rigorous, it is scalable to much larger sample sizes for future study.
Based on the established centroids, a small group of bases was used to create a time series of connected graphs, with nodes representing the entities in the ecosystem and edges related to dyadic relationships5 of known commercial interaction. The construction of centroid regions and anal ysis of ecosystems is illustrated in Figure 2. The analytic period chosen for the establishment of the time series were sufficiently large to bracket the known perturbing event, with the intention of including some period of quiescence before the perturbation and return to some steady state after the perturbation.
The resulting time series were then analyzed according to common and bespoke measures of graph complexity and connectivity. These measures were chosen to reflect the characteristics of the graphs and the changes in behavior
2 “Decoding Identity Resolution, Part One: The Basics,” Amperity (blog), May 25, 2022, https://amperity.com/blog/decoding-identity-resolution-part-one-thebasics
3 Benno Artmann, “Euclidean Geometry,” in Encyclopaedia Britannica, September 10, 2020, accessed July 23, 2022, https://www.britannica.com/science/ Euclidean-geometry
4 Akshay Upadhyay, “Haversine Formula: Calculate Geographic Distance on Earth,” IGIS Map, accessed July 23, 2022.
5 “Dyadic Data Analysis,” Columbia University Mailman School of Public Health (website), accessed July 23, 2022, https://www.publichealth.columbia.edu/ research/population-health-methods/dyadic-data-analysis
Figure 2. Illustration of defining and analyzing ecosystems.observed in the dyadic relationships. To facilitate future in gestion of these measures into a higher-order inference, all measures were converted to Z scale (which measures the position of a data point relative to the mean and in units of the standard deviation),6 producing relative probability distributions.
Potential absences in the data were carefully considered. Since not all commercial interactions are observable, the elasticity of decisions made based on these observed re lationships could be problematic. Although the method observes changes in the ecosystem, regardless of absent data, it is important to consider any major changes in cu ration or creation of data that may have occurred during the analytic period, as these changes could present falsely as perturbing events. Such changes could result in artifi cial perception of perturbation when in fact what would be measured would be the effects of changes in the data brought about by curation and creation, not by behavior in the observed ecosystem.
Multiple methods were considered for the overall mea sure of perturbation. Simple statistical measures were deemed insufficient because they had unusually high
sensitivity to changes in one or more of the graph mea sures. Additionally, since the edge types are markedly heterogeneous, factor analysis or other scaling would be required, and would introduce additional sources of elas ticity with respect to observing perturbation. Accordingly, Jensen-Shannon divergence was chosen. This method, comparing the statistical distributions of the various Z scale measures mentioned above, produces a very easily observable measure that can be compared to detect per turbation both at a point in time and over the course of time (“in time” and “through time”).
The Jensen-Shannon divergence was computed for the graph measures of the commercial ecosystems of the se lected bases. Around each known disruption in time, there was a clear observable increase in divergence in the data. Other increases in perturbation that were unexpected were evaluated to determine if the method was overly sensitive or otherwise flawed, or if there were simply other disrup tions that had not been considered.
Figure 3 is an example of the time-series graphs derived in this study. The graphs depict examples of perturbation as measured through the derived method and is visual ized through dyadic relationships before, during, and after a disruption in the commercial ecosystem surrounding an
 Figure 3. Example of time-series graph of the dyadic relationships before, during and after a period of perturbation.
economic driver (e.g., a military base or other closed eco systems of high value and importance).
In this example, perturbation is measured with respect to individual and combined graph measures, allowing for a rich understanding of perturbation in the ecosystem being studied surrounding the economic driver.
It is possible that the method could be influenced by in tentional manipulation of data. For example, if falsified and perturbed data were introduced, it could result in creating Jensen-Shannon divergence not related to actual com mercial fluctuations in the ecosystem. Other types of in tentional manipulation might include smoothing of data through manipulation to avoid the detection of otherwise existing perturbation. However, due to the complexity of the method and the number of attributes measured, as well as the various sources from which the data is drawn, it is highly unlikely that such intentional manipulation could be successfully achieved without producing its own perturba tion, which would accordingly be measured by the process. This “observer effect” of the method to detect any attempts to change the output of the method is a feature worthy of additional study.

For each base studied, current or former residents of the base were interviewed. These residents confirmed that the base was the primary local economic engine.
Once confirmed, businesses were plotted within the base’s centroid region on a map of the locale, and this map was presented to the current and former residents. They were then asked whether all businesses were connected tightly to the base’s economic activities, or if there were other
large commercial or government presences nearby that would constitute economic poles.
Current and former residents responded either by con firming that the centroid region included only the base’s commercial ecosystem—as in the case of Coast Guard Base Kodiak and Joint Base Pearl Harbor-Hickam—or by suggesting a different gate of the base about which to con struct the centroid region—as in the case of Marine Corps Base Camp Lejeune. Geographic regions other than cen troids were considered, such as linear regions conforming to commercial corridors, but centroids were recognized ultimately to be the most consistently appropriate shape.
A Johns Hopkins University graph analytics expert who was not on the team associated with this study reviewed the statistical methodology of the study. The indepen dent expert provided feedback on the method and imple mentation of constructing polyhedrons for each month’s dyadic commercial relations, computing global graph metrics on each month’s polyhedron, and comparing subsequent months’ graph metrics using the JensenShannon divergence. The feedback was consonant with the study’s approach.
Members of the research team identified disruptions temporally coincident with perturbations detected by the methodology described herein. Some of the perturba tions occurred in the aftermath of large climate disruptions in time, such as back-to-back hurricanes landing on the
Figure 4. Demonstrates the depiction of perturbation as measured through the derived method.eastern coast of the continental United States in early September 2019 and an earthquake in the northwestern United States in July 2021. Other disruptions coincident with perturbations were less easily discoverable in public reporting, such as finding a suspicious package on one of the bases and the onset and lifting of another base’s lockdown due to the COVID-19 pandemic. These and other disruptive events, both climate-related and less easily discovered, coincided with or closely preceded perturbations detected by the study method.
Actual results for two of the bases studied, Camp Lejeune and Wright-Patterson Air Base, demonstrate the data perturba tion model as hypothesized. Perturbations were observed at both sites around the time that storms impacted the bases. Camp Lejeune was impacted by back-to-back hurricanes, Dorian and Erin, in the fall of 2019. Wright-Patterson Air Force Base was impacted by a tornado in May 2019.
These results are observed in the graph time series and in the data perturbation quantification below.

The expected disturbances at Camp Lejeune, hurricanes in the fall of 2019, are observable in the perturbation qualifica tion data. The Jensen-Shannon divergence identified anomalies between July and October of 2019 that coincide with Hurricanes Dorian and Erin.
Figure 6. Camp Lejeune Data Perturbation Quantification, March 2019 to February 2020.
 Figure 5. Camp Lejeune, Effect of Dorian and Erin Storms on Data Perturbation in September 2019.
Figure 7. Wright Patterson Air Force Base, Effect of Tornado on Data Perturbation in May 2019.
The expected disturbance at Wright-Patterson Air Force Base, a tornado in May 2019, is observable in the perturbation qualification data. The Jensen-Shannon divergence identified anomalies between April and July of 2019 that coincide with the tornado.

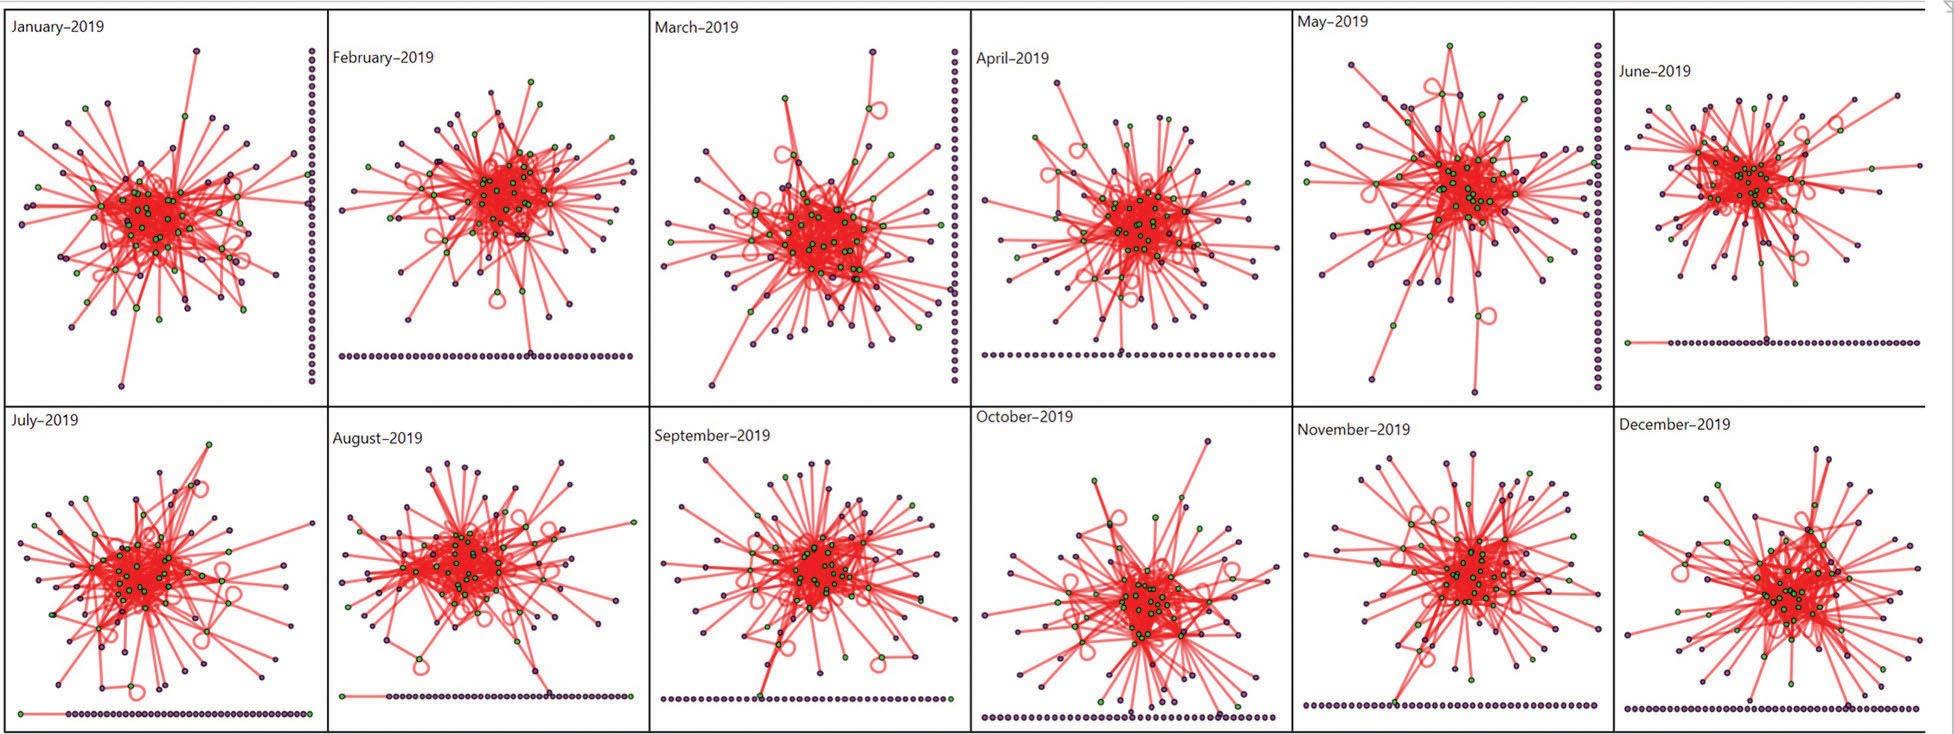
Figure 8. Wright Patterson Air Force Base, Perturbation Quantification, January 2019 to December 2019.
The perturbation quantification data from Pearl Harbor-Hickam is captured below. The peak in early 2020 is coincident with a suspicious item on the base. The peak in the summer of 2020 lines up with the preparation for a hurricane that came closer to Oahu than any in recent years.
Below is the perturbation quantification from Base Kodiak. The largest and longest-duration period of a high level of perturbation occurred in the first three months of the base’s lockdown due to the COVID-19 pandemic. The next-highest perturbation is detected in the aftermath of an earthquake in July 2021.

 Figure 9. Pearl Harbor-Hickam, Perturbation Quantification, June 2019 to December 2020.
Figure 10. Kodiak, Perturbation Quantification, June 2019 to December 2021.Discussion of the Implications and Potential Limitations
Figure 9. Pearl Harbor-Hickam, Perturbation Quantification, June 2019 to December 2020.
Figure 10. Kodiak, Perturbation Quantification, June 2019 to December 2021.Discussion of the Implications and Potential Limitations
This study considered the elasticity of decisions linked to the results shown. Regarding such elasticity of decisions, it is not necessary for the method to be a highly precise de tector of perturbation. What is important is that perturbation is observable.
The findings in this study supported the scientific goal to determine if commercial data can partially evaluate the re silience of the associated ecosystem surrounding a mili tary base or other closed ecosystems of high value and importance in the presence of disruptions. As observed in the prior section, the study determined this to be the case at multiple bases resulting from static disruptions in time and dynamic disruptions through time. It is recommended that future studies work to determine if any of the selected bases have clusters of influential entities responsible for shaping how these communities react to disruptions. Per the study intent, the results are provided to inform de fense officials and community leaders of how commercial data can be used to gauge a community’s resilience to disruptions.
It is important to evaluate the elasticity of decisions made with this study’s method. For example, if the method is used merely to direct the attention of human evaluators to focus in one area versus another, it is only important for the method to be able to separate one base from many to pro vide a relative scale of the likelihood of finding meaningful perturbation were human raters to intervene. In contrast, if more automated methods are used, a more precise mea sure would likely be needed to direct the activity of digital agents to engage in specific interventions. Such precision could be approached with additional bespoke graph mea sures, as well as careful consideration of curation of data as discussed above.
This study’s method should be extensible to any commer cial ecosystem. The only stipulations are availability of suf ficient data, ability to resolve the identity of the target of the centroid, and availability of human raters for heuristic evaluation.
This study’s method relies on defining a selected loca tion’s physically surrounding commercial ecosystem. The current study accomplished this definition by constructing a geospatial centroid region and including all businesses incorporated in the region. This geospatial approach is best suited for facilities isolated or separated from population centers, as the studied bases were.
Moreover, this study’s method assumes data is available at a consistent level before, during, and after a disruption to the base. Interruptions to data collection could present falsely as disruptions to the base’s commercial ecosystem.
To address such potential limitations, this study could ben efit by enriching the methodology with additional dyadic relationships. The nature of the method is such that it can be enriched over time by adding additional dyadic rela tionships without any change to the process. In frequent practice, complex relationships with more than ten dyadic relationship types are easily achievable with commercially available data. We fully expect that adding such data would increase the stability of the method and the granularity with which perturbation can be detected.
Additionally, the concept of a “disruption” could potentially be vague enough that given a facility such as a military base or corporate campus and sufficient time to investi gate, a disrupting event or circumstance could be identi fied. The method employed in this study could catch some disruptions that were not experienced subjectively by indi viduals at the facility—while missing disruptions that were. However, even an incomplete record of disruptions could be valuable to, and exploitable by, an external actor intending to surveil and exploit the community
For example, the data might indicate to moving companies the times of the year families are preparing for transfers in duty station or positions, which could also present an opportunity to blend in to a less routine and more chaotic environment.
Moreover, the research team recognized the statistical pos sibility that this study’s observed results conceivably could be attributed to variation in the graph metrics tied to sea sonal patterns. If so, this would falsely indicate a disruption at the same time every year, for instance. That said, such a study interpretation risk did not appear to be an issue for the bases selected for the study.
This study did consider changes in observable data. There are many potential sources of such change, including regulatory change (e.g., a base realignment), changes in commercial behavior (e.g., during supply chain disruption), introduction of complex collaboration structures in the eco system (e.g., exclusive trade agreements), corporate actions (mergers/acquisitions), and the introduction or departure of a significant entity in the commercial ecosystem (e.g., re location, bankruptcy). Any such change could perturb the data itself, as well as disrupt the underlying ecosystem.
This study also considered changes in human behavior as it is important to consider such changes that take place over a longer duration of time. One example is the emergence of the gig economy, where individuals function as microcen ters of economic activity within an ecosystem. Another ex ample could be digitization, where companies deliver and support products and services in part or in whole by digital means (e.g., online customer service with automated pro grams). All such evolutions will produce additional dyads that have not been seen before, providing exciting poten tial to further study perturbation in the context of changing business behavior in the ecosystem.
This study did consider open-source data and other com mercially available data, to include LexisNexis media data sets, to determine if it is possible to identify disruptions in a facility using these lower fidelity sources. One feasible ap proach is to collect media documents mentioning a closed system and to chart the documents’ sentiment toward the closed system with respect to time. There are open-source and proprietary machine learning models that extract named entities, such as closed systems and their governing organizations, and estimate the document’s overall senti ment toward each entity. A perturbation in the sentiment toward a closed system could indicate a disruption internal to the closed system. This approach is constrained by the data available and the applicability of the sentiment analy sis model to the documents analyzed.
This study examined whether it is possible to detect pertur bation at military bases or other important geographically localized institutions using commercial data sets. The lim ited research done in this study shows that by constructing polyhedrons for each month’s dyadic commercial relations, computing global graph metrics on each month’s polyhe dron, and comparing subsequent months’ graph metrics using the Jensen-Shannon divergence, it is possible to de tect perturbations around the military bases that we chose for the purpose of this study. To further evaluate the meth odology demonstrated by this study, we recommend four additional steps:
Further this analysis to determine if any of the selected bases have clusters of key influential entities responsible for shaping how these communities react to disruptions.
1. Conduct this analysis for ecosystems such as closed military communities or other
geographically localized institutions to expose dispositive cues to the resiliency of the communi ty-to-community leaders, local government, and Department of Defense representatives. Exposing relevant communities to this level of scrutiny from commercial data will allow the base to further se cure itself.
2. Establish a collaborative network of private-sector companies that are willing to share their data for fusing for data visualization to both conduct this type of analysis and collaborate on related projects to ensure resiliency and further national security. For such collaboration to occur, there should be an appropriate level of incentive for these companies to engage in data sharing.
3. Continue to share this research with local gov ernment representatives and on-the-ground base representatives, and repeat a similar analysis on a semiregular basis to evaluate if and how the resiliency of the ecosystem has shifted since the first study. Based on the results of these studies, community leaders, local government represen tatives, and base officials should collaborate to formulate solutions to increase the long-term security of the military installations or other geo graphically localized institutions that are central to their communities.
This report described analyses exploring what perturba tions in commercial data patterns could reveal about po tential disruptions in far more closed systems of activities and coordination, such as military bases or other closed ecosystems of high value and importance. The analyses detected perturbations around military bases in time and through time.
It then discussed the possible shortcomings and poten tial extensions of the analyses, to include employing, expanding, and refining the methods presented to ana lyze other closed systems of activities and coordination around the world. It follows that any attempts to camou flage or hide such perturbations will themselves leave entropic aberrations that analytic means can detect. This logic is akin to studies in thermodynamics, where any attempt to restore an ordered state to a system, a low state of energy (and thus high disorder) will create high disorder somewhere else.
The implications of this study seem to be that certain closed ecosystems cannot fully hide their internal states from the world, as the surrounding commercial ecosystem will re veal perturbations. This conclusion means activities that for whatever reason seek to keep a low-profile either in the United States or elsewhere could be producing digital ex haust associated with adjacent activities within the broader ecosystem in which they operate. This observation has substantial implications for intelligence and counterintelli gence, military defense, and law enforcement activities. At the same time, nature’s disruptions also can produce indi cators and warnings—be they of pandemic, food scarcity, or climate-related shocks and their associated perturbations on data from human societies.
In sum, there are five major takeaways from this report for leaders in both the public and private sectors:
1. The increasing digitization of the planet enables subtle tips and cues to be derived from commer cial data associated with entities and regions of interest.7
2. Those seeking to keep their activities confidential need to be aware of the “digital exhaust” they may be producing associated with, adjacent activities within the broader ecosystem in which they operate.
3. It is anticipated that any attempts to camouflage or hide such perturbations will themselves leave irregularities that similar analytic means can detect.
4. Those seeking to better understand the planet, perhaps to prevent future outbreaks or be fore warned of a possible food crisis or the risk of growing instability in a region, should consider how commercial data sets can provide indicators and warnings associated with such phenomena.8
5. As organizations and societies become increas ingly digitized, people will be able to better under stand the impact of human activities on the world, as well as nature’s disruptions of human societies, better than ever before.
The study authors recommend interested organizations perform an extended analysis to “red team” the worst case scenarios, in terms of surveillance and threat exposure for installations of interest. Such an extended analysis should use the results of worst-case scenarios to build out and test potential improvements and mitigations to further secure military bases and other closed ecosystems of high value and importance.
7 “‘Instrumenting the Planet’: Dr. David Bray Discusses Internet of Things with AIPCA,” Executive Roundtable 2020 (video), GeoTech Cues (series), Atlantic Council, January 2020, https://www.atlanticcouncil.org/insight-impact/in-the-news/instrumenting-the-planet-dr-david-bray-discusses-internet-of-thingswith-aipca/
8 David Bray, “We Can Build an Immune System for the Planet,” GeoTech Cues, Atlantic Council, April 6, 2020, https://www.atlanticcouncil.org/blogs/ geotech-cues/we-can-build-an-immune-system-for-the-planet/Natalie Barrett is a leader at the Johns Hopkins University Applied Physics Laboratory (JHU/APL), primarily focused on human-machine teams, artificial intelligence (AI), and advanced communi cations. She also serves on the laboratory’s climate change strategy team. Prior to joining JHU/ APL, she served across government and commercial industries focused on defense, innovation, robotics, and biotechnology. Key projects include wearables, exoskeletons, isothermal assays (re alized in the rapid COVID-19 diagnostic tests), microarray reader systems for the Human Genome Project, and cancer research.


David A. Bray is a distinguished fellow with the Atlantic Council. He is principal at LeadDoAdapt Ventures and has served in a variety of leadership roles in turbulent environments, including bio terrorism preparedness and response with the Centers for Disease Control and Prevention and the broader US government from 2000 to 2005, executive director for a bipartisan US intelligence community commission on research and development, providing nonpartisan leadership as a fed eral agency senior executive, work with the US Navy and Marines on improving organizational adaptability, and efforts with US Special Operations Command on the challenges of countering disinformation online. He has received the Joint Civilian Service Commendation Award, the Roger W. Jones Award for exceptional federal executive leadership, and the National Intelligence Exceptional Achievement Medal. He also provides strategy to both boards and start-ups espousing human-centric principles to technology-enabled decision-mak ing in complex environments. He was named a senior fellow with the Institute for Human-Machine Cognition starting in 2018.
Business Insider named him one of the top “24 Americans Who Are Changing the World” under forty and he was named a Young Global Leader by the World Economic Forum. For twelve different start-ups, he has served as president, chief strategy officer, and strategic adviser roles. He has been an invited keynote speaker to CEOs, world leaders, and crowds of more than 3,000 participants at events in India, Vietnam, Australia, Taiwan, Dubai, South Africa, Brazil, Colombia, Mexico, Canada, Belgium, Sweden, Switzerland, and the United Kingdom.
Mary Versa Clemens-Sewall is a data scientist at JHU/APL. She designs and implements data analysis methods, especially text analysis methods, for a range of applications. Prior to joining APL, she studied mathematics and Arabic at Dartmouth College. As of fall 2022, she is a PhD student in applied mathematics and statistics at Johns Hopkins University.

Kiran S. Jivnani is an assistant director at the Atlantic Council’s GeoTech Center. She manages projects at the intersection of geopolitics, security, climate, health, and agriculture. Prior to joining the Atlantic Council, she worked for the United Nations Academic Impact and Millennium Campus Network, Millennium Fellowship, where she managed student leaders globally through mentorship on United Nations Sustainable Development Goal-based projects. She subsequently worked for Miriam Dalli, then a member of European Parliament and a vice president of the Social Democrat Party. In this role, she worked on legislative dossiers of the European Parliament’s Environment, Public Health, and Food Safety Committee; the Industry, Research, and Energy Committee; and

the Beating Cancer Committee. Kiran holds a bachelor’s degree from Northeastern University in Boston, where she studied criminal justice, international affairs, and law and public policy.
Anthony Scriffignano, PhDAnthony Scriffignano is Senior Vice President and Chief Data Scientist at Dun & Bradstreet Corp. He is an internationally recognized data scientist with experience spanning over forty years in multiple industries and enterprise domains. Scriffignano has an extensive background in advanced anomaly detection, computational linguistics, and advanced inferential algorithms, leveraging that background as primary inventor on multiple patents worldwide. Scriffignano was recognized as the US Chief Data Officer of the Year 2018 by the CDO Club, the world’s largest community of C-suite digital and data leaders. He also is a member of the Organisation for Economic Co-operation and Development’s Network of Experts on AI, as part of a working group on implementing trustworthy AI. He has briefed the US National Security Telecommunications Advisory Committee and contributed to three separate reports to the president, on big data analytics, emerging technologies strategic vision, and Internet and communications resilience. Additionally, Scriffignano provided expert advice on private-sector data officers to a group of state CDOs and the White House Office of Science and Technology Policy.

The study authors would like to acknowledge the assis tance of experts at Dun & Bradstreet, Johns Hopkins University Applied Physics Laboratory, and the Atlantic Council for their assistance in performing this study and preparing this report.
The authors would also like to specifically acknowledge the following persons for their editorial or analytic expertise and contributions to this report.
Lloyd Whitman, PhD Senior Director GeoTech Center, Atlantic Council
Stephanie Wander Director of Programs GeoTech Center, Atlantic Council
Emily Sespico Program Assistant GeoTech Center, Atlantic Council
Kamel Belkacem Boussaid Senior Principal Data Scientist Dun & Bradstreet
Ilya Meyzin Vice President, Data Science Innovation and Operations Dun & Bradstreet
David Spingarn Leader, Identity Resolution (Global Matching) Dun & Bradstreet
Emma Rafkin Software Engineer, John Hopkins Applied Physics Laboratory John Hopkins University Cetin Savkli, PhD Chief Scientist Johns Hopkins University, Applied Physics Laboratory
John Piorkowski, PhD Chief Artificial Intelligence Architect and Applied Information Sciences Branch Head John Hopkins University, Applied Physics Laboratory
CHAIRMAN
*John F.W. Rogers
EXECUTIVE CHAIRMAN
EMERITUS
*James L. Jones
PRESIDENT AND CEO
*Frederick Kempe
EXECUTIVE VICE CHAIRS
*Adrienne Arsht
*Stephen J. Hadley
VICE CHAIRS
*Robert J. Abernethy
*C. Boyden Gray
*Alexander V. Mirtchev
TREASURER
*George Lund
DIRECTORS
Stéphane Abrial
Todd Achilles
Timothy D. Adams
*Michael Andersson
David D. Aufhauser
Barbara Barrett
Colleen Bell
Stephen Biegun
*Linden P. Blue
Adam Boehler
John Bonsell
Philip M. Breedlove
Myron Brilliant
*Esther Brimmer
*Richard R. Burt
Teresa Carlson James E. Cartwright
John E. Chapoton
Ahmed Charai
Melanie Chen
Michael Chertoff
*George Chopivsky
Wesley K. Clark
*Helima Croft
*Ankit N. Desai
Dario Deste
*Paula J. Dobriansky
Joseph F. Dunford, Jr. Richard Edelman
Thomas J. Egan, Jr.
Stuart E. Eizenstat
Mark T. Esper
*Michael Fisch
*Alan H. Fleischmann
Jendayi E. Frazer
Meg Gentle Thomas H. Glocer
John B. Goodman
*Sherri W. Goodman
Jarosław Grzesiak
Murathan Günal
Frank Haun
Michael V. Hayden
Tim Holt
*Karl V. Hopkins
Ian Ihnatowycz
Mark Isakowitz
Wolfgang F. Ischinger
Deborah Lee James Joia M. Johnson
*Maria Pica Karp
Andre Kelleners
Brian L. Kelly
Henry A. Kissinger
John E. Klein
*C. Jeffrey Knittel
Franklin D. Kramer
Laura Lane
Yann Le Pallec
Jan M. Lodal
Douglas Lute
Jane Holl Lute
William J. Lynn
Mark Machin
Mian M. Mansha
Marco Margheri
Michael Margolis
Chris Marlin
William Marron
Christian Marrone
Gerardo Mato
Timothy McBride
Erin McGrain
John M. McHugh
Eric D.K. Melby
*Judith A. Miller
Dariusz Mioduski
*Michael J. Morell
*Richard Morningstar
Georgette Mosbacher
Majida Mourad
Dambisa F. Moyo
Virginia A. Mulberger
Mary Claire Murphy Edward J. Newberry
Franco Nuschese
Joseph S. Nye
Ahmet M. Ören
Sally A. Painter
Ana I. Palacio
*Kostas Pantazopoulos
Alan Pellegrini
David H. Petraeus
Lisa Pollina
Daniel B. Poneman
*Dina H. Powell McCormick Michael Punke Ashraf Qazi Thomas J. Ridge Gary Rieschel
Lawrence Di Rita Michael J. Rogers Charles O. Rossotti
Harry Sachinis
C. Michael Scaparrotti
Ivan A. Schlager
Rajiv Shah
Gregg Sherrill
Ali Jehangir Siddiqui
Kris Singh
Walter Slocombe
Christopher Smith Clifford M. Sobel
James G. Stavridis
Michael S. Steele
Richard J.A. Steele
Mary Streett
Gil Tenzer
*Frances M. Townsend
Clyde C. Tuggle
Melanne Verveer
Charles F. Wald
Michael F. Walsh
Ronald Weiser Maciej Witucki Neal S. Wolin
*Jenny Wood Guang Yang Mary C. Yates Dov S. Zakheim
HONORARY DIRECTORS
James A. Baker, III Ashton B. Carter
Robert M. Gates
James N. Mattis
Michael G. Mullen
Leon E. Panetta
William J. Perry
Condoleezza Rice
Horst Teltschik
William H. Webster
*Executive Committee Members List as of