The Path to Prosperity
The 2024 Freedom and Prosperity Indexes


Atlantic Council FREEDOM AND PROSPERITY CENTER


Atlantic Council FREEDOM AND PROSPERITY CENTER
The Freedom and Prosperity Center aims to increase the well-being of people everywhere and especially that of the poor and marginalized in developing countries through unbiased, data-based research on the relationship between prosperity and economic, political, and legal freedoms, in support of sound policy choices.
This report is written and published in accordance with the Atlantic Council Policy on Intellectual Independence. The authors are solely responsible for its analysis and recommendations. The Atlantic Council and its donors do not determine, nor do they necessarily endorse or advocate for, any of this report’s conclusions.
© 2024 The Atlantic Council of the United States. All rights reserved. No part of this publication may be reproduced or transmitted in any form or by any means without permission in writing from the Atlantic Council, except in the case of brief quotations in news articles, critical articles, or reviews. Please direct inquiries to:
Atlantic Council 1030 15th Street NW, 12th Floor Washington, DC 20005
For more information, please visit www.AtlanticCouncil.org.
ISBN-978-1-61977-339-4
Cover photos: Unsplash (top); Getty Images (bottom).
June 2024
Atlantic Council
FREEDOM AND PROSPERITY CENTER
Indexes
Ignacio Campomanes
Nina Dannaoui
Joseph Lemoine
Dan Negrea
We are living in turbulent times, and 2024 is without doubt a crucial year. A total of sixty-four countries and almost half of the population of the world will hold national elections this year. Their results will determine the future path for freedom and prosperity in years to come. This report presents the annual update of our indexes, which portray a clear picture of the situation of the world during this decisive year. Moreover, a detailed analysis of the trends of freedom, prosperity, and their respective components during the last decade uncovers several striking facts that can help us understand how we got to this critical juncture.
Freedom at a global level has been stagnant in the last decade, and we document that this is the outcome of two opposing forces: declining political freedom and increasing economic freedom. The former is by far the most worrisome trend in recent years. Our political subindex clearly shows that this process started way before the COVID-19 pandemic, and is still ongoing today, several years after. Overall, the political subindex scores of two-thirds of the countries of the world have decreased since 2013, including a vast majority of countries with well-established democracies in Western Europe and North America.
Analyzing the components of the political subindex, we find that the erosion of political institutions is due to a significant weakening of the safeguards and guarantees that ensure contestation and control of power. Political rights, especially freedom of expression and information, and legislative constraints on the executive, have suffered major declines across the world in the last decade. The widespread wave of disinformation and election interference is deeply troubling. It represents not just an attack on democracy, but a fraudulent attempt to subvert the electoral process. Once in power, if governments succeed in limiting the ability of civil society and other institutions to hold them accountable, they pave the way for a slide into outright autocracy.
While the legal subindex has shown a slight decline since 2013, it’s noteworthy that the components most closely linked to the core principles of liberal democracy, such as clarity of the law and independent justice, have seen the steepest declines. This fact can only reinforce the perception of a major regression in the system of checks and balances that characterizes free societies.
The bright side of freedom measurement in the last decade is driven by freer economic environments across the globe. A total of 130 countries, out of the 164 covered by the
indexes, have improved their economic subindex score. Moreover, this positive tendency is predominantly driven by a prominent improvement of the component measuring women’s economic opportunities, which has risen in virtually all the countries of the world. Furthermore, it is encouraging to notice that some of the worst performers in gender equality in terms of economic affairs, such as some Gulf monarchies, have improved substantially. Globally, economic freedom improvements, including mild but widespread increases in trade and investment freedom, as well as property rights’ protection, have acted as a counterweight to the negative evolution of political freedom.
The Prosperity Index reveals the remarkable effects of the pandemic in several of its components—health, income, and education—which jointly produced a halt in the strong improvement of the previous decades. As of today, the global prosperity scores have yet to reach their pre-2019 levels. Nonetheless, this fact does not seem to be solely attributable to the devastating consequences of the pandemic, given two additional circumstances we document in this report.
On the one hand, the component measuring the treatment received by minorities has worsened consistently since 2013, a trend we connect with the deterioration of the political environment and institutions. On the other, the index shows that the share of countries experiencing prosperity growth rates exceeding the Organisation for Economic Co-operation and Development (OECD) average has been substantially lower since 2013, compared to the previous decade. This means that from 1995 to 2013, developing countries were improving their prosperity faster than wealthy countries. This convergence process has clearly slowed down and fewer countries are progressing as quickly, with significant repercussions for millions of citizens in the world’s least developed areas.
The descriptive trends documented above raise the fundamental question of whether there is a clear link between the evolution of freedom and that of prosperity. Unfortunately, the unprecedented effects of the pandemic on prosperity make it hard to assess the effects of the stagnation of freedom in the last decade. Nonetheless, the ample time coverage of the Freedom and Prosperity Indexes allows us to analyze the relation between both indexes with a long-term perspective. We provide several pieces of evidence, reaching a consistent result: freedom is closely associated with prosperity.
Higher scores in our Prosperity Index are highly correlated with prosperity (0.71). Moreover, when we look at changes in both indexes, we obtain again a very substantial association (0.49). When we compare the third of countries with the highest freedom improvement since 1995 to the less-improved third, we find that prosperity growth has been 50 percent higher in the former group.
Having shown the close long-term relation between freedom and prosperity, we delve into a related question: Do reforms toward freer institutions produce immediate effects on prosperity, or are their fruits only visible after a long time? Our results, based on local linear projections, lean toward the latter. A significant positive shock to the Freedom Index (i.e., the top 20 percent of yearly changes), generates an instantaneous effect on prosperity that is rather small (0.11 points in the year of the shock). Nonetheless, the cumulative effect extends during the
following two decades, and is estimated to be seven times higher after twenty years. Conversely, a negative shock produces a 0.13-point drop in prosperity on the year of the impact, but again the cumulative effect in the next two decades is substantially higher, reaching 0.56 points.
The facts and analysis provided in this report are only a small example of the significant capabilities and usefulness of the Freedom and Prosperity Indexes for academic and policy-oriented research. We firmly believe that unbiased, rigorous, data-driven research and policy implementation is the surest path to advance freedom and generate sustained prosperity across the world. Therefore, we encourage scholars and public officials to use the indexes to further explore the mechanisms and interaction between freedom and prosperity, as well as their components, in specific countries, regions, or periods of time.
The Freedom and Prosperity Center was created as the sixteenth Atlantic Council Center two years ago, with the mission to increase the well-being of people everywhere—and especially of the poor and marginalized in developing countries—through unbiased, databased research on the relationship between freedom and prosperity. The cornerstone of this project is the Freedom and Prosperity Indexes: a sound and rigorous effort to assess the evolution of freedom and prosperity around the world since 1995, nearly three decades.
During the past twelve months, the Freedom and Prosperity Indexes have gained traction in terms of dissemination in academic and policy-oriented circles, and have proven their value and effectiveness as a research and analytical tool. A crucial milestone is the publication of the first edition of the Freedom and Prosperity Atlas, 1 a collection of short country and regional analyses based on our indexes, written by top academics and public officials. Additionally, our indexes have also been used to examine research questions on other topics such as the rise of autocratic models around the world,2 the relation between aspects of freedom and foreign direct investment attraction,3 the timing of the effect of freedom reforms on prosperity, or the connection between free institutions and innovation.
Besides serving as a foundation for rigorous research, we want the Freedom and Prosperity Indexes to help policymakers and other actors effecting change to identify the areas of their institutional environment most in need of improvement, and to use the indexes as an instrument to assess the results of their reform efforts. On this front, the center has also substantially enhanced its impact, with practical and policy-oriented analyses and recommendations in countries such as Myanmar, Mexico, or Bangladesh.4
We hope that the 2024 update of the Freedom and Prosperity Indexes presented in this report, together with the facts documented and analyses provided, can spark new research avenues and continue guiding policy actions that can advance prosperity around the world.
The guiding principles for the construction of the Freedom and Prosperity Indexes (F&P Indexes) are transparency, simplicity, and consistency in the methodology. We do not
produce our own raw data, but instead use data sources which are publicly available and produced by well-established institutions, and widely used in academic and policy-oriented research, such as the World Bank, the Varieties of Democracy (V-Dem) Project, the United Nations, and the Fraser Institute. The value added of the Freedom and Prosperity Indexes lies in a sensible and consistent systematization of the attributes of free and prosperous societies, which permits a rigorous analysis of the relation between freedom and prosperity across countries and time.
Last year, we made a thoughtful revision of the indexes structure to guarantee that our conceptualizations of freedom and prosperity were well grounded in widely accepted definitions of these concepts.5 Therefore, the overall structure of the F&P Indexes is unchanged in the 2024 version. Nonetheless, no quantitative exercise is perfect, and we have once again reviewed the whole methodology, identifying and implementing marginal improvements that are detailed below and in the methodology appendix. We have produced time series for a total of nineteen components, three subindexes, and two overall indexes for 164 countries during the period 1995 to 2023.
Our scaling and aggregation methods clearly reflect the aim to produce measures that are simple and transparent. We limit as much as possible the data transformations carried out to construct the indexes, except for necessary scaling to ensure that all components lie in the zero to one hundred interval. We also use standard techniques to linearize highly nonlinear variables such as gross domestic product (GDP) per capita and CO2 emissions by GDP per capita. In terms of aggregation, we use the arithmetic mean as the general rule to aggregate variables, components, and subindexes. Therefore, when more than one variable is used to obtain a component, they are averaged with equal weights. Legal, economic, and political subindexes are calculated as the equally weighted average of their respective components, and the overall Freedom Index is just the unweighted average of the three freedom subindexes. The Prosperity Index is given by the equally weighted average of its six constitutive components.6
The complete dataset of components, subindexes, and indexes for the period 1995 to 2023 is available on our website, together with a full methodology and replication package. We encourage researchers to use the indexes to further explore particular questions on the mechanisms and linkages between freedom and prosperity. We also
hope that the F&P Indexes can serve as a useful tool for policymakers in order to identify specific areas of reform, compare their country’s performance with that of neighboring nations, and assess the effects of different policies.
We think of freedom comprehensively as a combination of a political dimension (democracy and individual rights), legal dimension (the rule of law), and economic dimension (market economy). Therefore, the Freedom Index aggregates three subindexes (legal, economic, and political), each of them covering several components. Figure 1 shows a schematic representation of the Freedom Index.
The legal subindex measures the degree to which a country abides by the rule of law. To be sure, there is no uncontested definition of the rule of law.7 As we use separate subindexes of the economic and political aspects of free societies, we follow a formal conceptualization of the rule of law, stripped of any substantive content. In a nutshell, the legal subindex captures the extent to which citizens and government officials are bound by and abide by the law,8 and is thus linked to the ideas of certainty, stability, and predictability.
The legal subindex includes five components: clarity of the law; judicial independence and effectiveness; bureaucracy quality and corruption; security; and informality. The first one measures basic formal requirements of the legal system—in particular, if laws are general, clear, public, noncontradictory, consistent, and are predictably enforced. An independent and effective judiciary, together with an efficient bureaucracy and limited corruption, measure the degree to which government officials are subject to and comply with the law. Finally, security (i.e., law and order) and informality assess whether the citizenry generally observes the country’s legal norms and regulations.
The political subindex measures the extent to which governments and lawmakers are responsive to the demands of citizens and respect their individual rights and liberties. The more inclusive the political system, and the more it allows for citizens to oppose and contest those in power, the closer public policies are expected to reflect the preferences of a majority of the population.9
The political subindex has four components: elections; political rights; civil liberties; and legislative constraints on the executive. The first component captures the electoral core of democracy: whether political leaders are chosen by the citizenry in open, clean, and fair elections with
comprehensive suffrage. Political rights encompass individual rights directly linked to the democratic political process, such as freedom of expression (including an independent press) or freedom of association. Civil liberties include an array of individual rights in the liberal tradition (e.g., criminal procedural rights, absence of torture, freedom of movement, religious freedom, and so on), that limit the scope of governmental action—guaranteeing an area of individual autonomy and freedom in personal affairs. Finally, a democratically elected legislative branch imposes an additional level of control and accountability on the executive’s exercise of power, which is captured in the fourth component.
The economic subindex is designed to measure whether the bulk of economic activity in a country is guided by the principles of competitive markets.10 An economically free society enhances the incentives to work and invest, allows businesses and individuals to capture the gains of an efficient allocation of resources guided by the price mechanism, and fully exploits the economic potential of its population.
The economic subindex comprises four components: property rights; trade freedom; investment freedom; and women’s economic freedom (WEF). Well-defined and secure property rights are the foundation of a market economy, so the first component measures the degree to which governments back and enforce such rights. Trade freedom refers to the ability to freely engage in international transactions
of goods and services, while investment freedom measures whether a country allows for free movement of capital across borders. Finally, women’s economic freedom assesses the extent to which economic rights and opportunities are equally distributed by gender.
We scale each component to have the same range (zero to one hundred), and compute each subindex as the unweighted average of its components. Finally, we determine a Freedom Index score for each country and year using the arithmetic mean of the three subindexes.
In order to offer an intuitive and simple representation of the differences in freedom across countries, we assign one of four freedom categories (High Freedom, Moderate Freedom, Low Freedom, and Lowest Freedom) to each country-year observation. To do so, we use the Freedom Index rank for each year, labeling the level of freedom of the first quartile of countries as high (those that rank 1 to 41), moderate for those in the second quartile (ranking 42 to 82), low for the third quartile (ranking 83 to 123), and lowest those in the bottom quartile (ranking 124 to 164). Our category system is thus a relative ordering, showing which countries are in the highest freedom group, the second freest group, and so on, in a given year.
The 2024 version of the Freedom Index introduces some minor changes that refine some components, increasing their theoretical soundness. These include:
● Eliminating all variables that refer to the free movement of capital across borders from the trade freedom component, fixing a small overlap with investment freedom.
● Including all eight areas of women’s economic freedom covered by our preferred source (the World Bank’s Women, Business and the Law 1.0 dataset), making it more comprehensive.
● Moving the component measuring “alternative sources of information” (which had been included last year in the elections component of the political subindex) to political rights, which together with other components measure freedom of expression and information.
● Broadening the civil liberties component of the political subindex, including the full “Private Civil Liberties Index” of the V-Dem dataset and, in particular, religious freedom.
The Prosperity Index also takes a broad view, going beyond the measurement of pure material well-being and including additional social aspects that we see as necessary to talk about a prosperous society.11 Our ultimate goal is to be able to test the hypothesis that a free institutional environment (as captured by the Freedom Index) produces good societal outcomes, and thus we envision the Prosperity Index as a measure of the output or consequence of freedom.
The Prosperity Index has six components: income; health; education; minorities; inequality; and environment. Income per capita is the most widely used indicator of prosperity in economic and social science research. A prosperous society is necessarily one that has escaped generalized poverty and misery, and generates sustained economic growth. We use GDP per capita at constant international dollars, adjusted for purchasing power parity across countries, as our income measure. Nonetheless, economists are aware of the shortcomings of income per capita as a measure of standards of living (distributional aspects, externalities, and so on), and consequently we also measure other aspects that constitute a prosperous and inclusive society.
Health and education are standard dimensions of an integral view of human flourishing. Having a long and healthy life, and the opportunity to acquire knowledge, are signs of a prosperous society. The Human Development Index produced by the United Nations is composed of these three
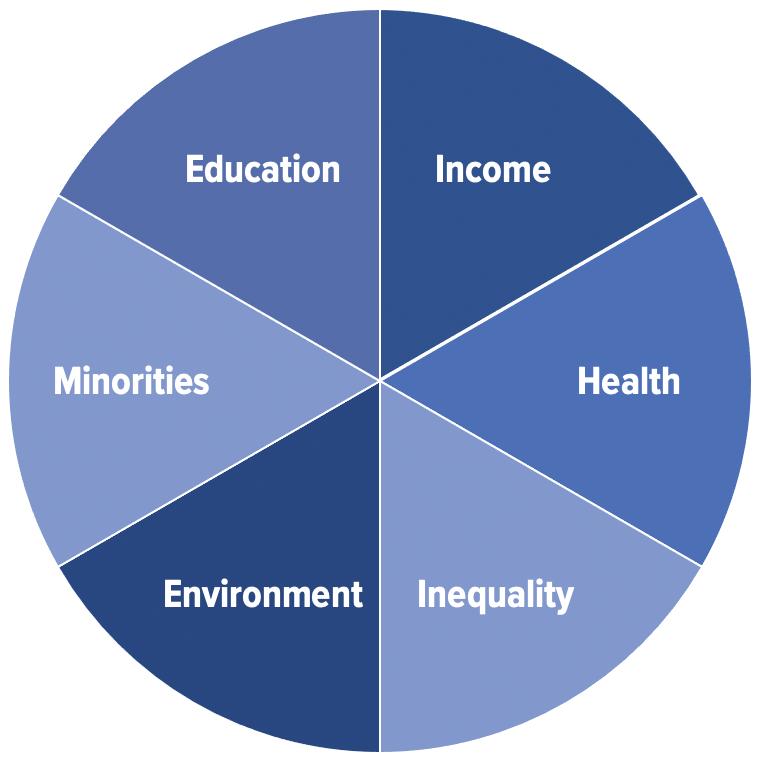
dimensions (income, health, and education), and we follow the UN’s lead by measuring health and education with the same indicators. Health is assessed by life expectancy at birth, while education is captured by a combination of mean and expected years of schooling.
A prosperous society requires that material well-being is shared among citizens and not concentrated in a small group. The components of inequality and minorities are intended to capture the degree of inclusiveness in a country. We measure inequality in terms of income (which is also highly correlated with education and health), using the Gini coefficient12 to show the distribution of post-tax and -transfer income in a society. The minorities component captures the absence of discrimination regarding access to public services and opportunities, based on social group considerations, e.g., ethnic, class, language, gender, political affiliation, etc. (see box on index improvements).
Finally, the Prosperity Index includes a measure of environmental quality. It is not easy to identify a single indicator of environmental quality that is comparable across countries, as these vary significantly in terms of natural resources endowment, level of development, and so on. We try to overcome this difficulty by generating an environment component that is based on three aspects. First, we consider CO2 emissions, the most important driver of climate change. Nonetheless, we acknowledge that CO2 emissions are today an unavoidable cost of economic production. Therefore, we divide emissions by GDP per capita, so our resulting variable measures how clean the production process is in a country. Second, we try to capture the consequences of environmental quality on human life, as measured by deaths from air pollution. The third component considers the fact that in the least developed countries of the world, total emissions may be low due to their low levels of economic production, but nonetheless citizens can be exposed to unclean environments on a daily basis, with severe effects on their health. We address this fact by measuring access to clean cooking technologies at a household level. The final environmental component of the Prosperity Index is the average of the scores in these three measures.
As we do for the Freedom Index, we assign one of four prosperity categories (High Prosperity, Moderate Prosperity, Low Prosperity, and Lowest Prosperity) to each country-year observation. To do so, we use the Prosperity Index rank for each year, labeling as high the first quartile of countries (those that rank 1 to 41), moderate for those in the second quartile (ranking 42 to 82), low for the third quartile (ranking 83 to 123), and lowest for those in the bottom quartile (ranking 124 to 164).
The 2024 Prosperity Index construction includes three methodological changes:
● Measuring inequality with the post-taxes and -transfers income Gini coefficient, instead of the top 20 percent share in national income, because the former provides higher coverage and better represents the level of inequality across the whole population of a country.
● Substantially broadening the environment component, adding to our previous “deaths from air pollution” indicator two more measures: the ratio of CO2 emissions by GDP per capita (both linearized before scaling by taking the natural logarithm), and the share of population with access to clean cooking technologies. In this way, we directly include the major cause of climate change, but also measure highly damaging and polluting situations more prevalent in least developed countries.
● Significantly broadening the minorities component to capture all causes of discrimination instead of focusing only on religious freedom. Moreover, the variables used from the V-Dem dataset do not refer to individual rights but to access to public services and opportunities. Therefore, we avoid any overlaps with the Freedom Index.
The map in figure 3 shows a visual depiction of the Freedom Index scores for the year 2023 for all the countries of the world. Detailed scores and rankings for each country can also be found in figure 3. The results are not very different from last year, and the main patterns are unchanged, as we would expect. Most of the countries covered have experienced minor changes in freedom in the last year, with 70 percent of them changing their ranking by two positions or less.
Nonetheless, specific countries present sharp improvements or declines in the last year. On the positive side, Brazil and Thailand stand out as the most improved countries, gaining twenty-two and fourteen positions in the freedom ranking, respectively, followed by Guinea-Bissau and Malaysia, with both rising seven positions. On the negative side, three countries in sub-Saharan Africa log the largest declines: Burkina Faso, down fourteen positions; Niger, eight; and the Democratic Republic of Congo, six.
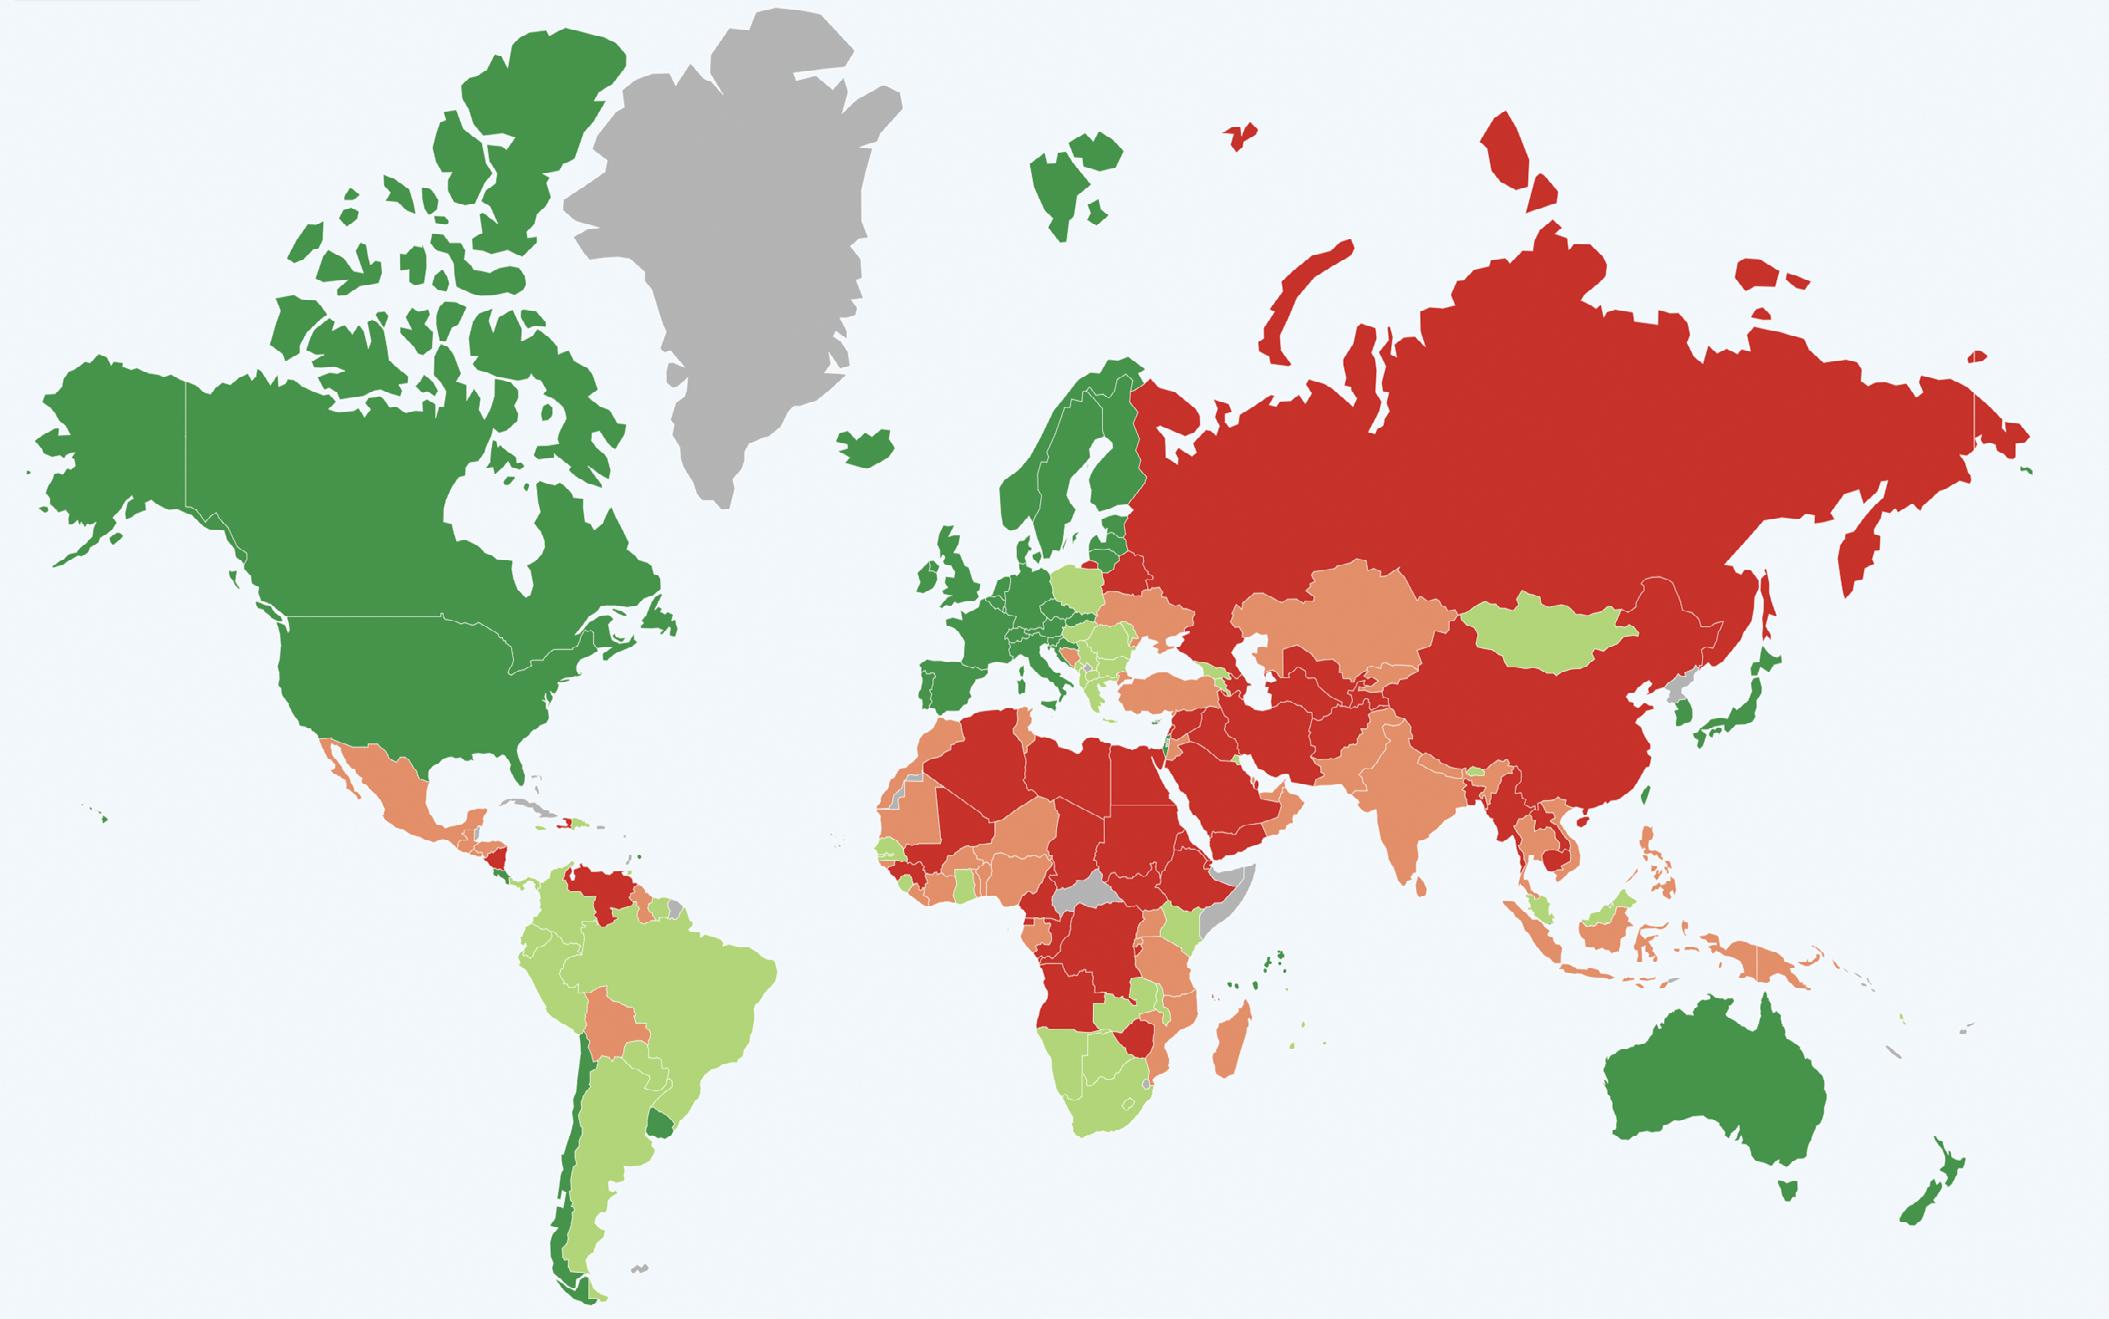
The map and table above portray a static picture of the situation of freedom around the world today. Knowing where we are is important, but it might be even more useful to understand how we got there, what have been the trends in the recent years and, ultimately, what is the likely evolution in the near future. Consequently, this year’s report presents a detailed analysis of the evolution of freedom in the last decade, showing a series of remarkable insights.
Figure 4 shows the global-level evolution of the Freedom Index and its three subindexes: legal, political, and economic. Aggregate freedom presents a moderately flat trend, with a marginal decrease throughout the period. But the graph makes clear that this flat evolution obscures two opposing processes at the subindex level. On the one hand, average political freedom has decreased in a sustained fashion since 2013, and this fact cannot be solely explained by the COVID-19 crisis, as the decreasing trend is evident before 2019 and has continued well beyond the return to normality.13 On the other, the average economic subindex score has improved significantly. The magnitude of these diverging movements is very similar which, together with a mildly negative evolution of the legal subindex, results in an aggregate freedom index score that slightly falls during the period of analysis.
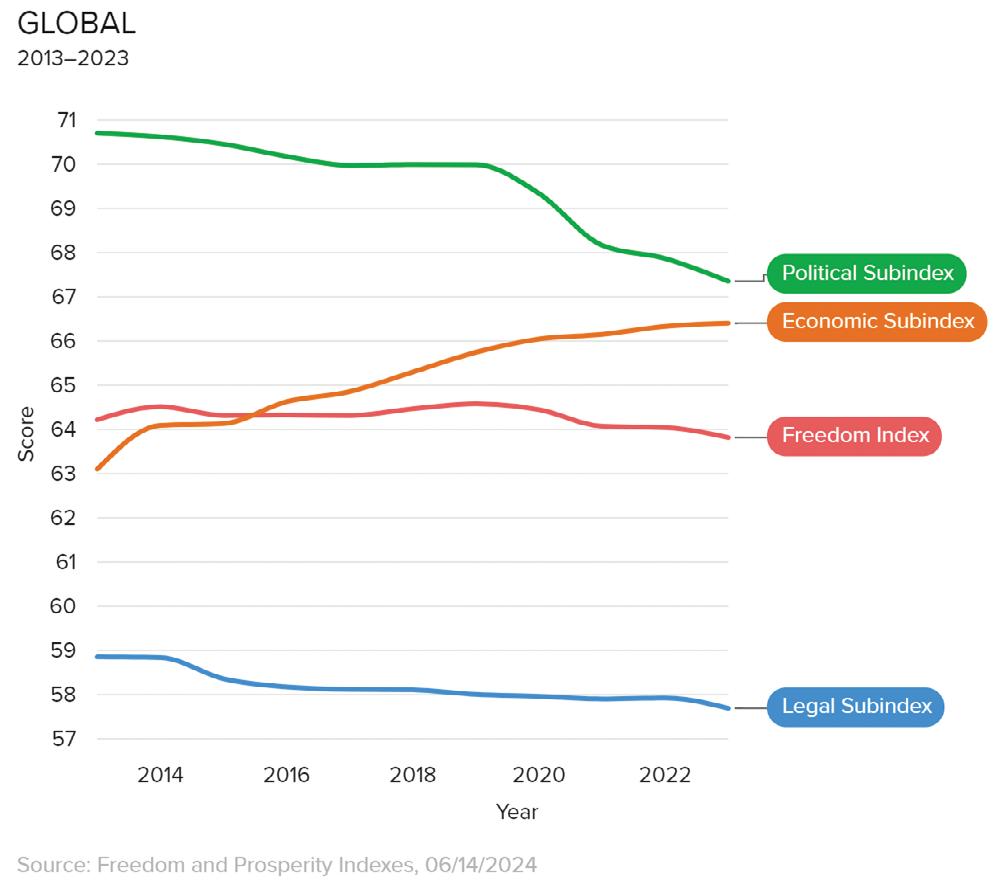
Table 1 below further explores these patterns. The first three columns show that there is great variability regarding freedom movements across countries. When looking at each region, roughly half of the countries are improving their freedom score, while the other half are doing the opposite, explaining the low average changes in freedom at the regional level (less than one point except for the Middle East & North Africa region).
The most striking insight of table 1 is given by the movements in the political and economic subindexes—in opposite directions. Political freedom has decreased in twothirds of the countries of the world, and the magnitude of this drop is substantial, with the Middle East & North Africa
and South & Central Asia falling by more than five points on average. Figure 5 below clearly shows this pattern at a country level. We observe that a great majority of countries lie below the diagonal, meaning that their freedom score has declined since 2013. Furthermore, it is visually evident that the change in countries with decreasing freedom is by a larger amount than those with increasing freedom, as measured by the vertical distance from the diagonal.
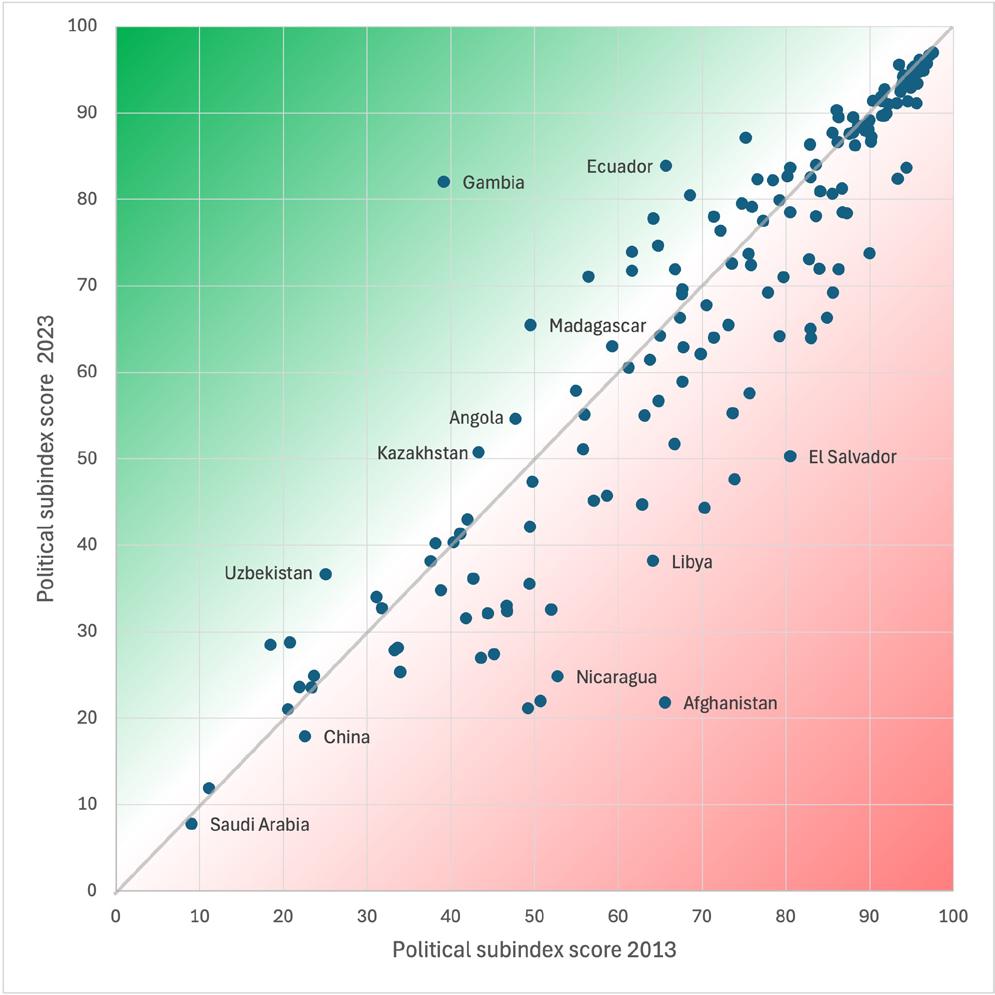
Let’s turn our attention to the upper right corner of Figure 5. Here, we see a tight cluster of countries. These are mainly the group of developed countries with the highest levels of freedom both in 2013 and 2023. Even among these high-ranking countries, political freedom is declining, as evidenced by most countries falling below the diagonal line, although the size of the movement is smaller. Figure 6 reinforces this perception, presenting the cumulative political freedom change in all OECD countries since 2013. Strikingly, only seven OECD countries out of a total of thirty-eight have increased their political subindex score in the last decade, while twenty-nine have declined, and some of them by large amounts (with Turkey, Hungary, Greece, and Poland all falling by more than ten points).
Czech
Republic
Slovakia
Colombia
Latvia
Ireland
Estonia
France
New Zealand
Switzerland
Luxembourg
Spain
Denmark
Lithuania
Italy
Sweden
Belgium
Germany
Costa Rica
South Korea
United Kingdom
Finland
Norway
Netherlands
Iceland
Japan
Australia
Austria
Chile
Israel
Canada
United States of America
Slovenia
Portugal
Mexico
Poland
Greece
Hungary
Turkey
05
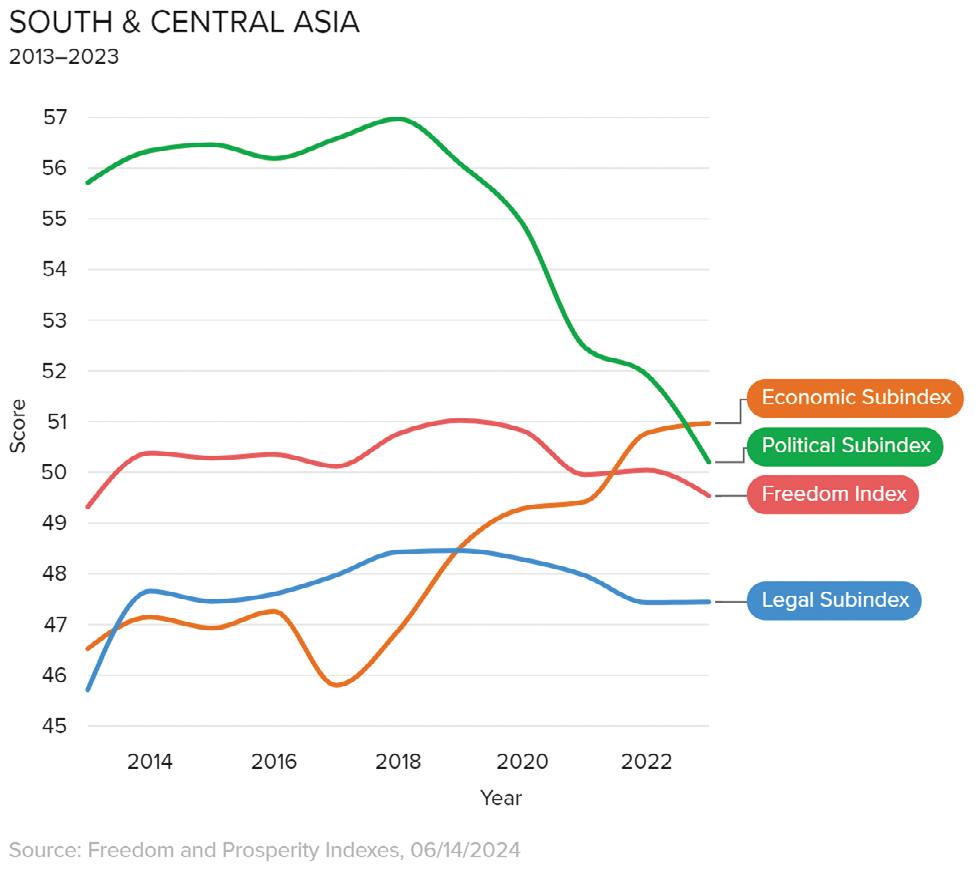
The evolution of the economic subindex was clearly the bright side of freedom measurement in the last decade. Economic freedom has improved in 80 percent of the countries of the world, with an average improvement of 3.31 points since 2013. The highest improvement is found in sub-Saharan Africa, with thirty-six countries improving their score and only ten declining, with an average progress of 4.46 points. South & Central Asia is the second region where economic freedom has improved the most, making it an extreme example of the global pattern, combining large drops in political freedom with strong gains in economic freedom (see figure 7).
Figure 7. Dimensions of Freedom in South & Central Asia (20132023)
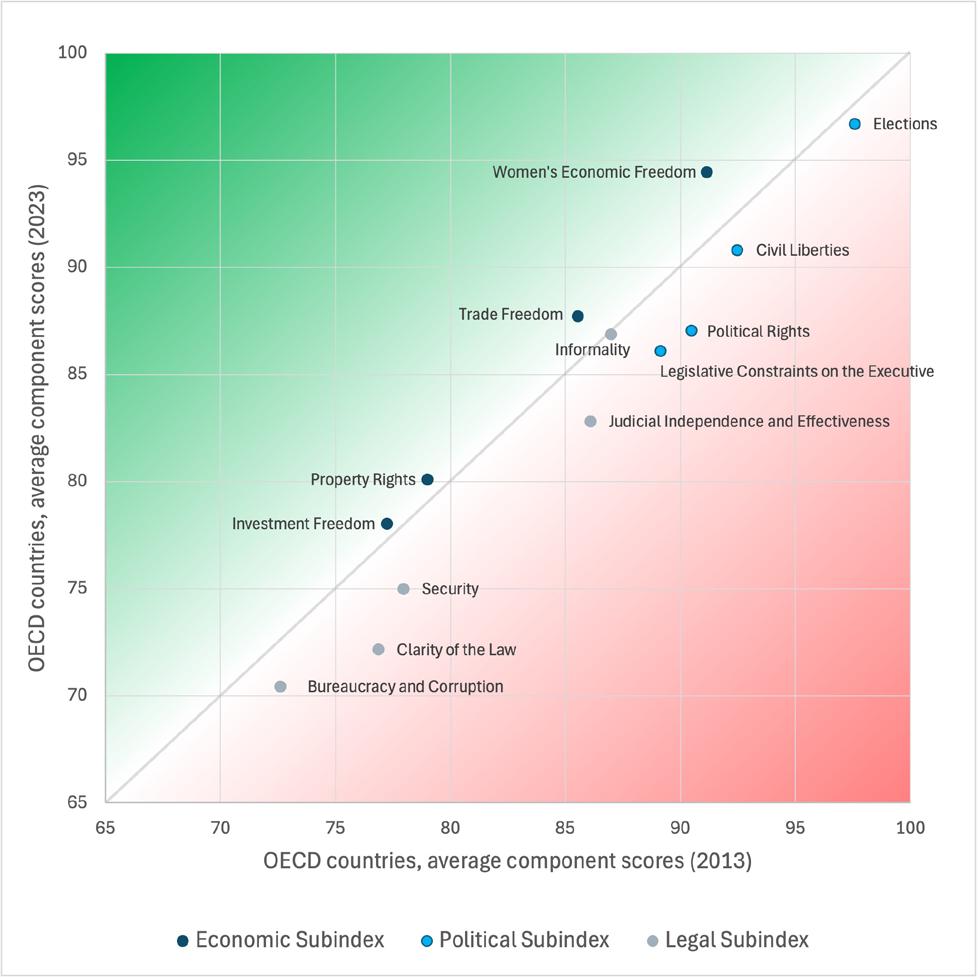
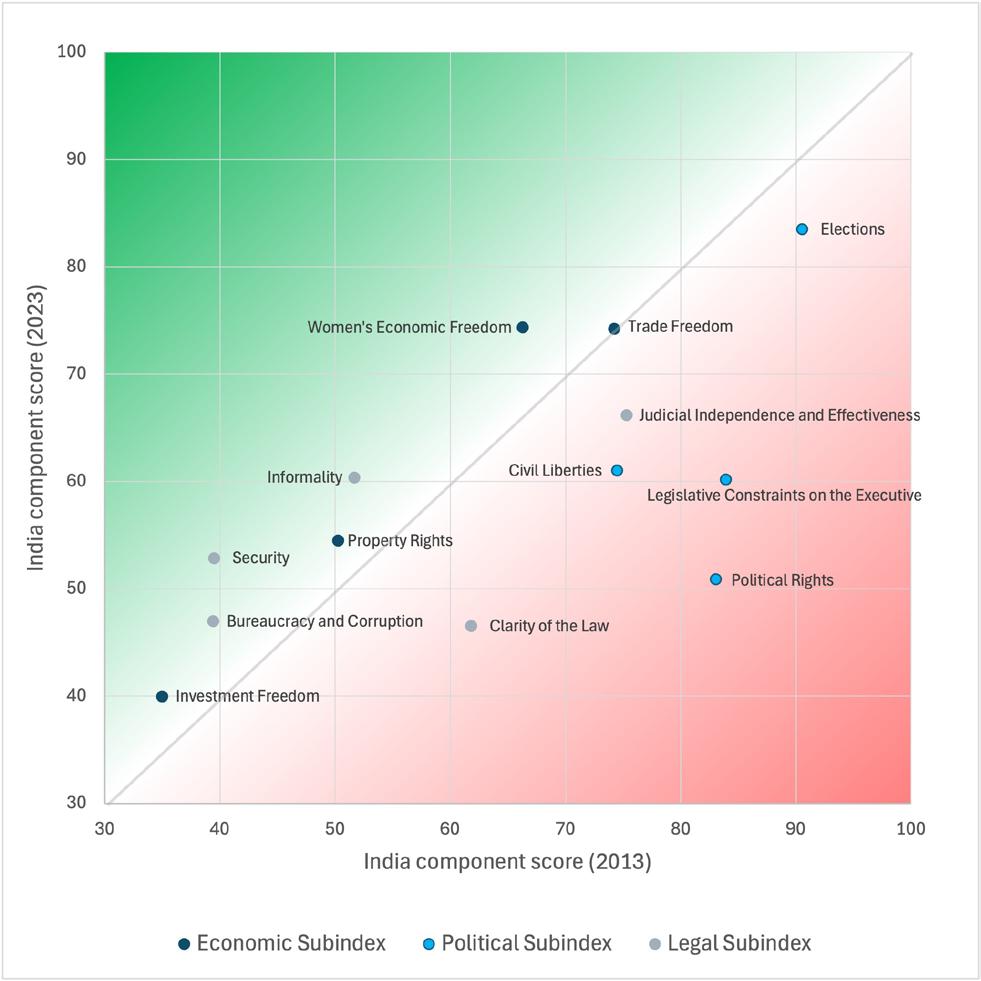
The comprehensive approach of the Freedom Index allows us to dig deeper into these two tendencies, by analyzing the different components of the political and economic subindexes, in order to disentangle their driving forces. First, the decline in political freedom is distinctly driven by significant backsliding in the components of political rights and legislative constraints on the executive.14 The electoral and civil rights components are also declining generally across the globe, but the fall is clearly of smaller magnitude. Figure 8 below illustrates this point with two specific cases. The graph on the top focuses on OECD countries, portraying the average change in each component of the three freedom subindexes. Two facts are worth noting. First, that the fall in political rights and legislative constraints on the executive is around three times larger than that on elections or civil liberties. Second, that the components of the legal subindex have also dropped notably, and especially those components most closely related to the democratic political system (clarity of the law and judicial independence).
The graph on the bottom of figure 8 exposes the paradigmatic case of India, the most populous country of the world. In ten years, the political rights’ score in India has plummeted by more than thirty points, and its score on legislative constraints on the executive by more than twenty. Moreover, the insights regarding the rule of law observed in OECD countries are even more exacerbated in India, casting serious doubts on the resilience of democratic institutions of the country.15
Figure 8. Political subindex components in OECD countries and in India (2013-2023)
When trying to understand the increase in economic freedom across the world, all components of this subindex present positive evolutions, but women’s economic freedom undoubtedly stands out as the soundest driving force.16 Figure 9 shows the change in this component for all the countries covered for this report, between 2013 and 2023. Virtually all countries of the world have improved their national score, and thus lie above the diagonal line. Moreover, the magnitude of the improvement is generally high, as measured by the vertical distance from the diagonal, and certainly exceptional in some countries such as the UAE (56 points), Gabon (44 points), and the Democratic Republic of Congo (36 points). Seeing such a great improvement in women’s economic freedom in some of the countries that received the lowest scores in 2013, such as the Gulf countries, is good news. But it must also be highlighted that these large reformers are still far from the levels of gender equality in economic affairs observed in the most advanced countries of the world, and thus have ample room for improvement.
Figure 9. Women’s economic freedom is progressing around the world (2013-2023)

Overall, the recent evolution of freedom around the world is certainly worrisome. The deterioration of political freedom in the last decade is obviously troubling, and especially in a year in which a large share of the countries of the world will hold national elections. Whether the regression in the liberal components of democracy (civil and political individual rights, executive constraints, judicial independence, and so on) will continue or even quicken is the crucial question today. If the negative trend persists, it is clear that the electoral core of democracy will eventually suffer, which could precipitate a fall into outright autocracy. Moreover, the illiberal populist wave across the world is a threat not only to political freedom and the rule of law, but has proven to also damage economic freedom (see the paradigmatic case of Venezuela or, to a lesser extent, Argentina) as this kind of leader tends to be guided by shortsighted economic policies that many times are based on protectionist and extreme, redistributive policies.
Freedom Index:
Biggest improvers and decliners overall and by subindex (2013-2023)
Sao
Freedom Index (overall)
United
Guinea-Bissau
Gambia
Uzbekistan
Nepal
Seychelles
Malaysia
Ecuador
Sao Tome and Principe
Dominican
Honduras
Armenia
Vanuatu
Sierra
Saudi
Egypt
Guinea-Bissau
United
Russian
Poland
Tunisia
Niger
Iran
Burundi
Mozambique
Lebanon
Haiti
Benin
Mauritius
Change
Economic Subindex
Comoros
Sao Tome and Principe
South
United
Vanuatu
Liberia
Cote d'Ivoire
Saudi
Guinea
Bahrain
Djibouti
Vietnam
Democratic Republic of the Congo
Equatorial
Pakistan
Turkmenistan
Kazakhstan
Gabon
Uzbekistan
Nepal
Uzbekistan Serbia
Comoros
New
Sao Tome and Principe
South Sudan
Libya
Benin
Vanuatu
Tanzania
United Arab
Emirates
Papua New Guinea
Liberia
United Kingdom
Cote d'Ivoire
Guinea
Bangladesh
South
Saudi Arabia
Jamaica
Bahrain
Chile
Djibouti
Iran
Vietnam
Ethiopia
Democratic Republic of the Congo
Trinidad and Tobago
Equatorial Guinea
Pakistan
Mozambique
Turkmenistan
Syria
Burundi
Kazakhstan
Sri
Gabon
Yemen
Nepal
Lebanon
New Zealand
Afghanistan
Libya
Benin
Tanzania
Change in Economic Subindex (2013–2023)
Gambia
Seychelles
Uzbekistan
Dominican
Honduras
Sierra
Bahrain
Paraguay
Jamaica
Malaysia
Nepal
Guyana
Papua New Guinea
United Kingdom
Bangladesh
South Africa
Jamaica
Chile
Iran
Ethiopia
Trinidad and Tobago
Mozambique
Syria
Burundi
Sri Lanka
Yemen
Lebanon
Afghanistan
Jordan
Angola Sri
Gambia
Seychelles
Benin
Austria
Dominican
Honduras
Norway
South
Bahrain Sierra
Haiti
Tunisia
Gambia
Ecuador
Madagascar
Malaysia
Armenia
Sri Lanka
Seychelles
Nepal
Uzbekistan
Guinea-Bissau
Laos
Honduras
Syria
Kazakhstan
Angola
Sierra Leone
Montenegro
Dominican Republic
Zambia
Bulgaria
Philippines
Mauritius
Benin
Chad
Belarus
Serbia
Haiti
Turkey
Kyrgyzstan
Niger
India
Guinea
Libya
Comoros
Burkina Faso
Nicaragua
Myanmar
Yemen
El
Afghanistan
Gambia
Seychelles
Uzbekistan
Dominican Republic
Honduras
Sierra Leone
Bahrain
Paraguay
Jamaica
Malaysia
Nepal
Guyana
Laos
Congo
Egypt
Kenya
Kazakhstan
Jordan
Sri Lanka
Angola
Benin
Austria
Norway
South Sudan
Haiti
Tunisia
Mexico
Yemen
Mali
Afghanistan
Cyprus
Mauritius
Belarus
Libya
Mozambique
Nicaragua
Turkey
Myanmar
Poland
El Salvador
The top improvers and worst decliners in the Freedom Index and subindexes since 2013 offer several interesting insights on specific country cases:
● Gambia’s democratic transition, which started in 2016, earned the country the top spot among freedom improvers in the last decade. It is encouraging to see that such a process is not only reflected in the political subindex, but has also helped the country to substantially increase its legal subindex score.
● Some Gulf monarchies also appear among the largest improvers (Bahrain, Saudi Arabia, and the UAE) and have made significant strides towards economic freedom, particularly in the area of women’s economic freedom. While there’s still room for progress in comparison to leading nations, these improvements represent a positive step forward.
● Egypt appearing among the top improvers is likely a product of our choice of period of analysis, as 2013 coincides with the instability surrounding the resignation of the Morsi government. In 2023, Egypt ranks 133 in the Freedom Index, and is among the lowest freedom category.
● Among the worst decliners, some cases can be explained by the onset of civil conflict and severe internal instability (Afghanistan, Yemen, Libya), but others are the product of a gradual but sustained deterioration of their institutional environment, down to autocratic levels (El Salvador, Nicaragua, Belarus, or Russia).
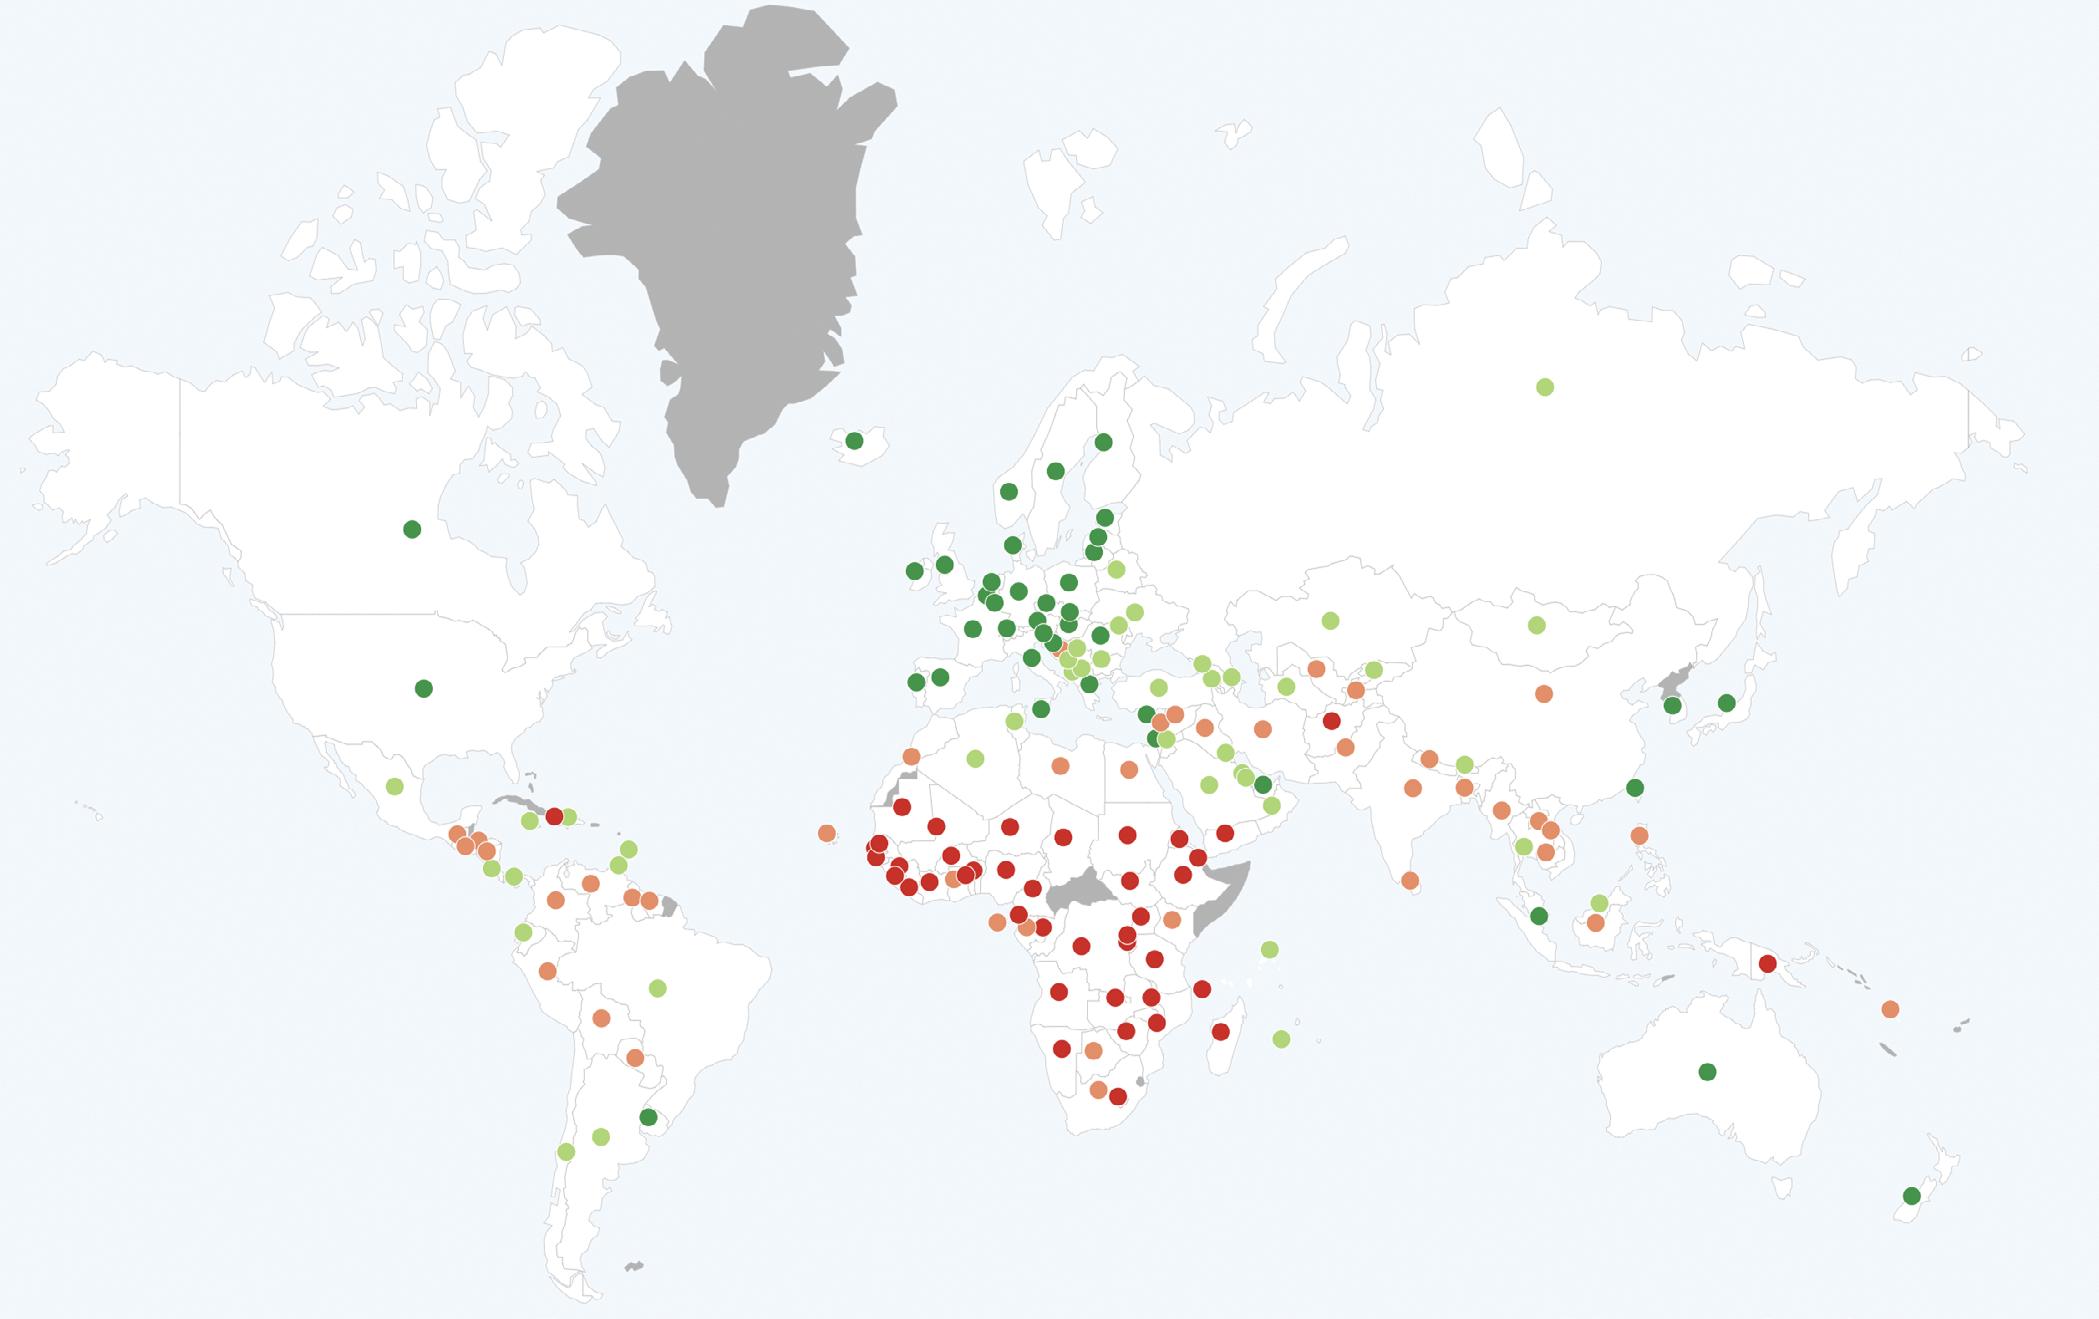
The state of prosperity across the world for the year 2023 is depicted in figure 10, with countries labeled in the map by the prosperity category, and with detailed scores and ranking for the 164 countries covered in the Freedom and Prosperity Indexes. Again, the situation is static, without major changes from last year, as prosperity entails an even slower process than freedom. A vast majority of countries have experienced marginal movements in
ranking compared to last year, with more than 95 percent of the countries moving two positions or fewer. The Czech Republic and Jordan are the most improved countries, rising four positions each in the last year; meanwhile, Niger and Burkina Faso have the largest slippage on this measure, with seven and three positions lost, respectively.
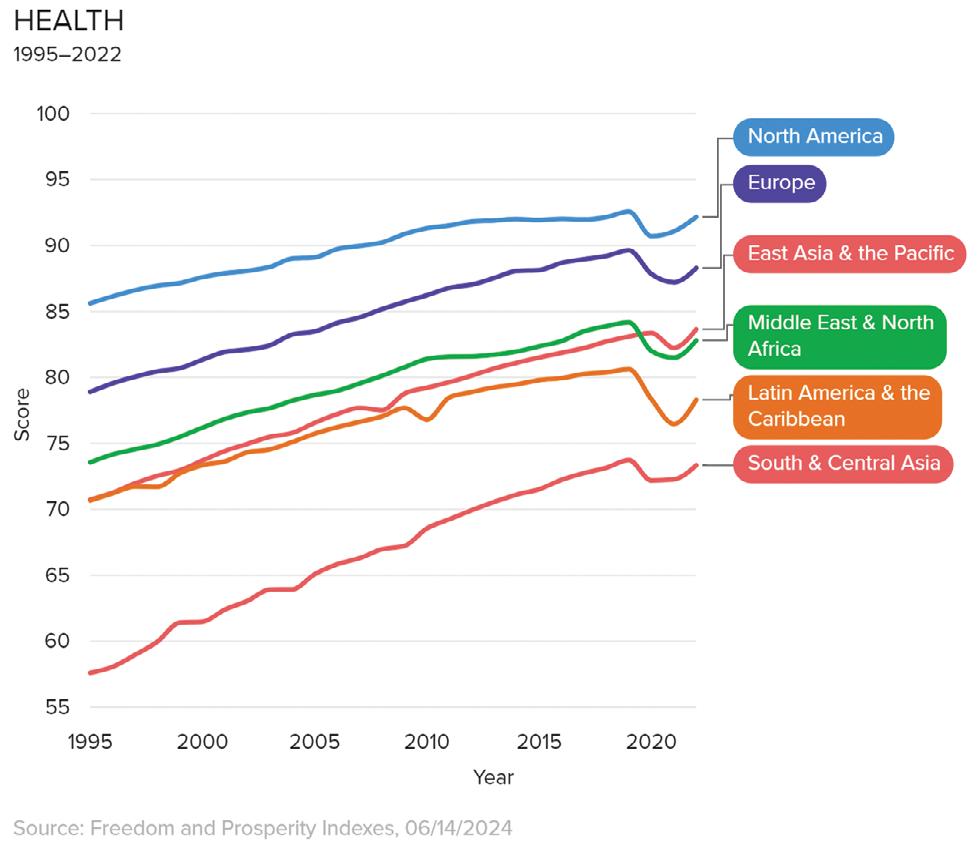
But once again, it is of utmost interest to understand the recent trends in prosperity, and its components, and we present below a detailed analysis of the dynamics of the last decade. Given that the last available year for the underlying data of some components of the Prosperity Index is 2022,17 we restrict our analysis to the period 2012-2022. Figure 11 presents the evolution of aggregate prosperity and its components since 2012 (except for health, which is shown in figure 12 for the period 1995-2022) at the global level. The sustained increase in the global prosperity score halted in 2020 due to the effects of the COVID-19 pandemic, and still lags the 2019 level.
Figure 11. Global prosperity has not fully recovered from COVID-19 (2012-2022)
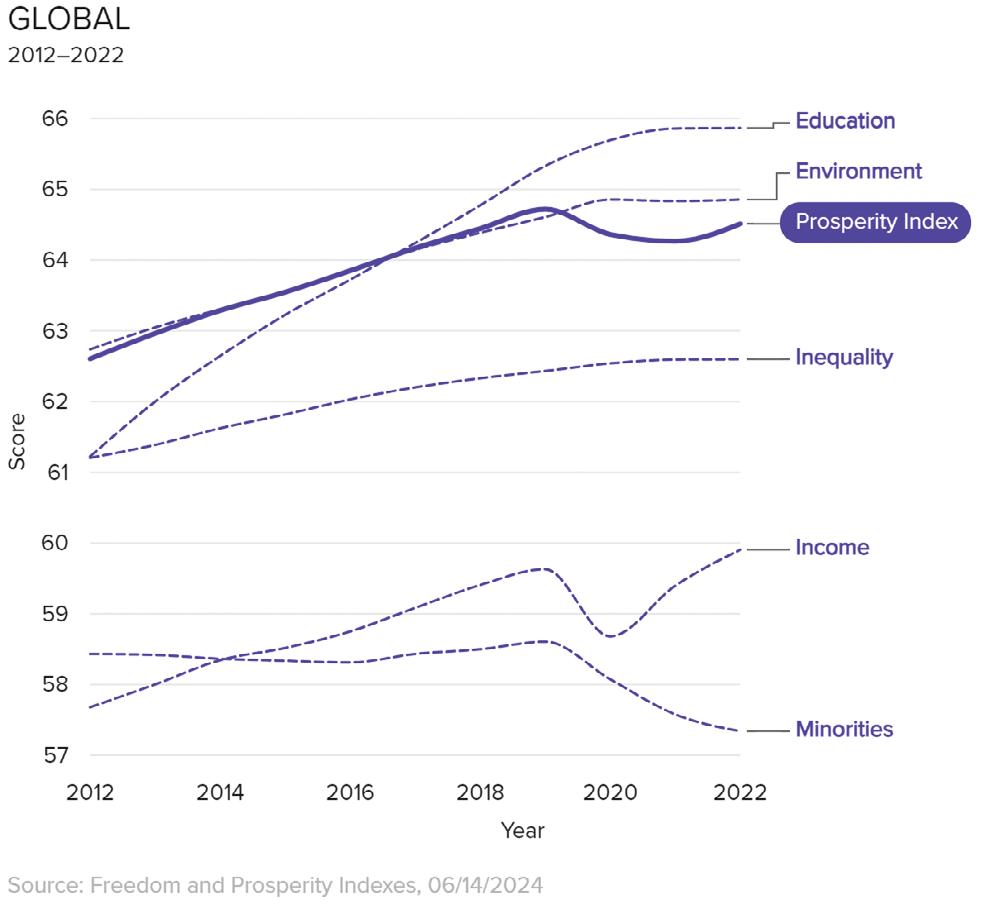
The effects of the pandemic were especially pronounced in the components of income, education, and obviously health. The latter is illustrated separately in figure 12, which shows the average regional score in the health component for the last three decades. The effect of the shock cannot be underestimated. For regions like the Middle East & North Africa, Latin America, and even Europe, the health score declined to levels not seen in a decade; besides East Asia and the Pacific, no region has yet recovered to the 2019 level. The hit on income is also notable, but it is clear that the recovery has been faster in this regard, and the average score at the global level is now higher than in 2019. Finally, the lockdowns and school closures implemented to fight the pandemic likely contributed to the slowdown in the growth rate of the education component.
Figure 12. In all regions, COVID-19 erased years of health progress (1995-2022)
Finally, figure 11 shows another noticeable trend that is not likely solely linked to the COVID-19 pandemic: that of minorities. This component is the only one that was not increasing before 2019 and has declined since then—so far without reversal. Recall that we measure this component with several variables from the V-Dem dataset, which refer to discrimination regarding public services and opportunities, based on social group considerations (ethnic, caste, immigrant status, gender, political affiliation, and so on). Therefore, our interpretation of this fact drifts away from explanations based on the response to the pandemic, and rather links it to the deterioration of the political subindex analyzed in the previous subsection.
Notwithstanding the significant effects of the COVID-19 pandemic, the world is still more prosperous than in 2012, as evidenced by the first three columns of table 2. A vast majority of the countries of the world (almost 86 percent) have improved their level of prosperity in the last decade, and the statement holds for all regions of the globe. This in itself is good news—and not surprising, as most of the components of the Prosperity Index have clear positive trends that not even a global pandemic can fully reverse.
What matters more is whether we can identify a process of convergence at the global level in terms of prosperity: that is, if countries that started with a lower level of prosperity are generating more prosperity faster than those that started above them, and thus are catching up with the high prosperity group. To try to shed light on this, columns four and five of table 2 present the number of countries in each region that have grown faster than the OECD average in terms of prosperity over the past decade (we use
2013-2023 to allow for direct comparability with table 1). Almost 60 percent of the countries of the world have done so, and in some regions the share is even higher, most noticeably in South & Central Asia (75 percent), East Asia and the Pacific (67 percent), and sub-Saharan Africa (67 percent). Thus, it is clear that a sizable number of the less prosperous countries are converging to the levels of prosperity of the most developed countries of the world.
However, comparing the situation of the 2013-2023 period with the preceding decade does not present such an optimistic picture. The last three columns of table 2 not only show that the average prosperity increase has been significantly smaller compared to the 2003-2013 decade, a situation clearly attributable to the pandemic, but also that the share of countries growing faster than the OECD average has been 20 percentage points lower in the last decade. And this latter fact is only partially a consequence of COVID-19, as the effects of the negative shock of 2020 are not substantially different across countries with different development levels.
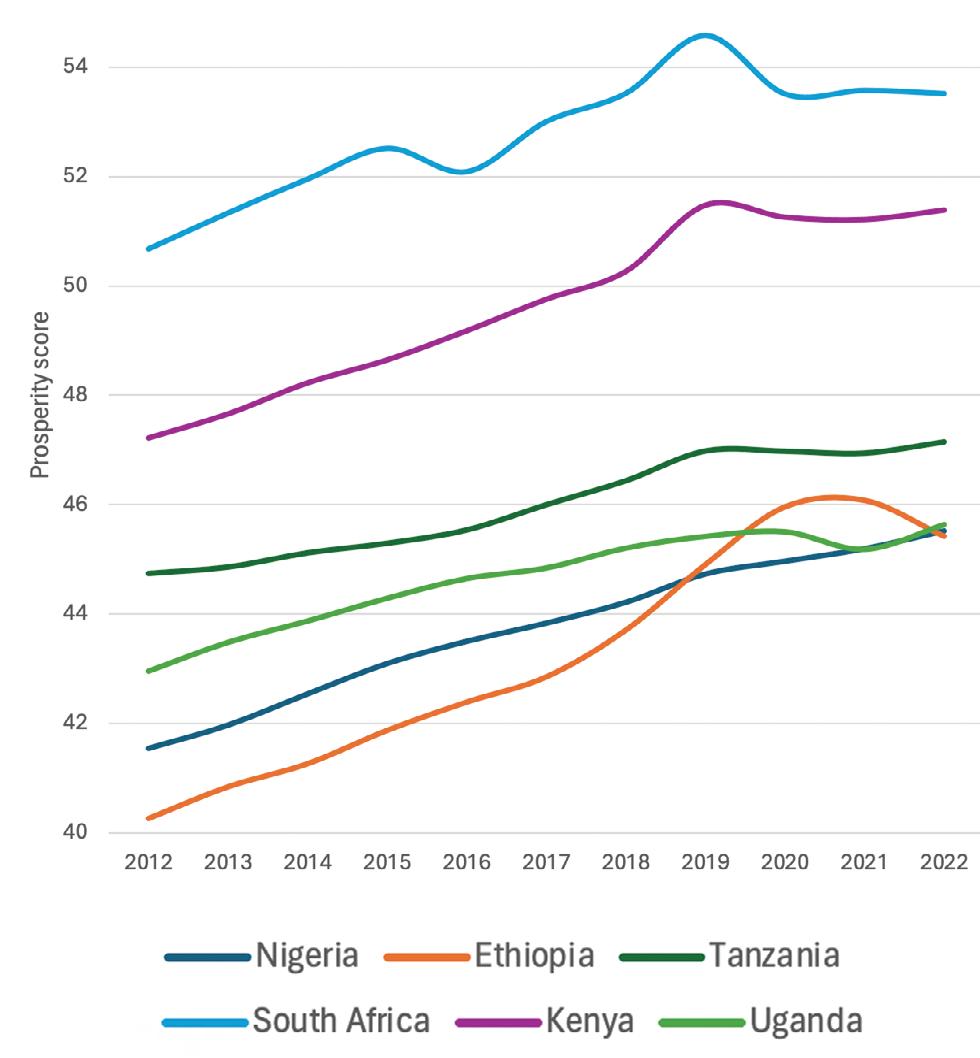
To close this section, we can focus our attention on sub-Saharan Africa, given that it is the least prosperous region of the world, with only two countries out of forty-six reaching the moderate prosperity category. Nonetheless, it is important to understand that the region is composed of countries that differ widely in terms of population, which introduces a caveat on the analysis of the unweighted regional average. It might be more enlightening to look at the biggest countries of the region. In particular, figure 13 presents the prosperity score for the six most populous countries (Nigeria, Ethiopia, Tanzania, South Africa, Kenya, and Uganda), which account for almost half of the population of the region. All of them have increased
their prosperity score above the average for sub-Saharan Africa. Whether these countries are able to recover the pre-2019 trend, especially regaining traction in health and educational improvements, is of utmost interest for millions of citizens.
Prosperity Index:
Biggest improvers and decliners (2013-2023)
Dominican
United
Bhutan
Prosperity Index (overall)
Bangladesh
Dominican
United
China
Sudan
Georgia Guyana
Bhutan
Namibia
Equatorial
Cape
United States of America
Iran
Jamaica
Mauritius
South
Saudi
Russian
Syria
Bangladesh
Sierra
Mongolia
Lesotho
Botswana
Uganda
Tanzania
Laos
Ethiopia
Malawi
Mozambique
Iraq
Togo
Morocco
Syria
Burundi
Bangladesh
Health
North
South
Iraq
Equatorial
United States of America Cape
Saudi
Rwanda
Sierra
Angola
Mongolia
Thailand Azerbaijan
Lesotho
Honduras
Albania
Laos
Tunisia
Ethiopia
Serbia
Malawi
Guyana
Mozambique
Peru
Iraq
North
Togo
Seychelles
Morocco
Costa
Venezuela
Bolivia
Colombia
Paraguay
Jamaica
Guatemala
Honduras
Ukraine
Oman
Bulgaria
Serbia
Yemen
Guyana
Lebanon
Peru
North
Seychelles
Costa
Change in Health (2013–2023)
Venezuela
Bolivia
Colombia
Paraguay
Moldova
Comoros
Djibouti Egypt
Lebanon
Change in Prosperity Index (2013–2023)
Czech
Papua
United
Equatorial
Bahrain
Luxembourg
Czech
Zambia Chad
Saudi
Venezuela
Poland
Moldova
Minorities
Gambia
Sudan
Montenegro
Ethiopia
Jordan
North Macedonia
Iraq
Saudi Arabia
Chad
Zambia
Moldova
Seychelles
South Africa
Czech Republic
Suriname
Costa Rica
Kenya
Bahrain
Algeria
Uzbekistan
Slovenia
Panama
Kyrgyzstan
Peru
Mozambique
United States of America
Hungary
El Salvador
Brazil
Greece
Lebanon
Canada
Yemen
Russian Federation
Venezuela
Poland
Mauritius
Belarus
Afghanistan
Niger
Oman
Yemen Bulgaria
Lebanon
Education
United Arab
Emirates
Bangladesh
Bahrain
Myanmar
Bhutan
Morocco
Nigeria
Angola
Saudi Arabia
Moldova
Comoros
Egypt
Djibouti
Papua New Guinea
China
Kuwait
Equatorial
Guinea
Thailand
Cameroon
Cyprus
Luxembourg
Czech Republic
Venezuela
Poland
Iran
Mali
Yemen
New Zealand
Hungary
Estonia
Bulgaria
Libya
Belarus
Cape Verde
Mongolia
Benin
Madagascar
Albania
Syria
Ukraine
in Education (2013–2023)
The top improvers and decliners in the Prosperity Index also provide some insights that are worth noting:
● The effect of the war in Ukraine is significant on the health component, as we would expect, but also in education, which underlines the severe persistent effects of war not only in the present but also in the long run.
● Both China and India appear as top improvers since 2013, which contrast with the clear deterioration of freedom in both countries in the same period. The rise in prosperity is likely to be result of the past reforms toward more open societies, and it is likely that the recent freedom regression will eventually slow this trend.
● The United States shows up among the worst decliners, and is the only country in the high prosperity category to experience a decline. Even more striking is the fact that even in the prosperity components in which the country has experienced positive improvements, these have been smaller than in other Western countries, making the United States fall in its ranking in virtually all categories of the Prosperity Index since 1995. Yet this decline must be put in perspective as the country remains well established in the high prosperity category.
The previous section has provided a detailed, but separate analysis of the trends of freedom and prosperity in the last ten years. Nonetheless, it is not easy to draw clear conclusions about the relation between the two in this time period for at least two reasons. First, the considerable consequences of the pandemic on prosperity obscure the potential effects of the evolution of freedom in the previous years. Second, it would be naive to think of changes in the institutional environment captured by the Freedom Index as producing large instantaneous or very rapid effects on prosperity, besides very extreme exceptions. Instead, we would expect the results of movements in freedom in terms of prosperity to be visible mainly in the long run. For this reason, in this section we take full advantage of the remarkable time coverage of the Freedom and Prosperity Indexes (twenty-nine years), in
order to shed light on the hypothesis that free institutions are the surest path to a prosperous society.
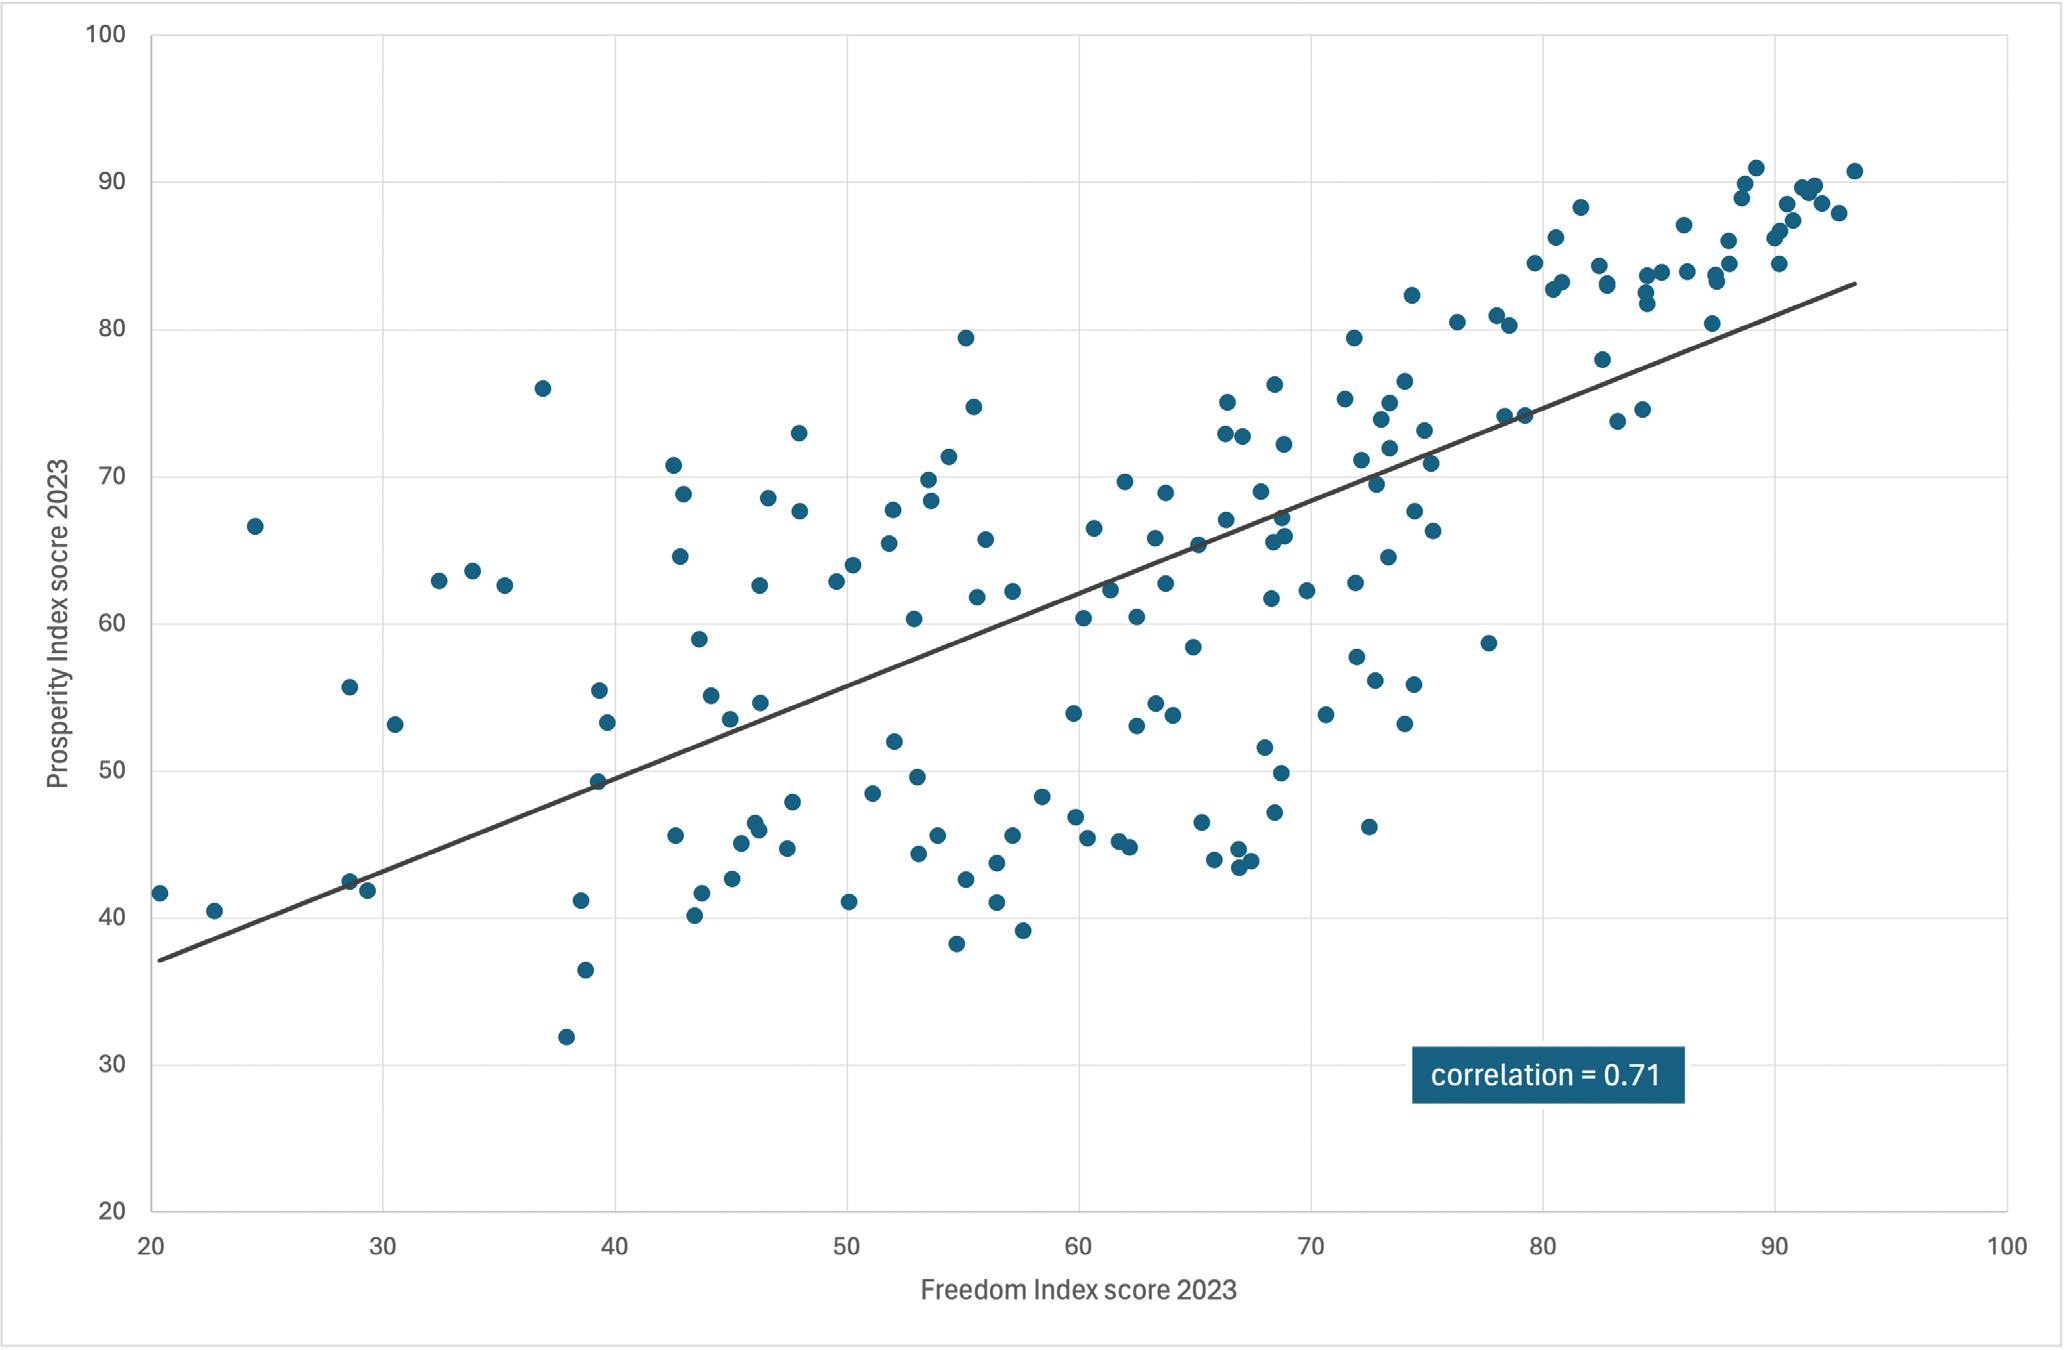
First, we provide three pieces of evidence that, even if simple, show a clear association between freedom and prosperity at an aggregate level. Figure 14 presents a straightforward scatter plot of freedom and prosperity scores for the year 2023 and all countries covered by the indexes. The conclusion is evident: freer countries are more prosperous. The correlation between both scores is high (0.71), as evidenced by the clear positive slope of the regression line. Moreover, the close association between levels of freedom and prosperity is also present when analyzing each region separately, or each income group.
It can be argued that freedom and prosperity are the result of very long-run processes or have deep roots, and thus the level of prosperity today may be the result of other causes besides the level of freedom (natural resource abundance, geography, historical legacies, culture, and so on). To overcome this critique, we also look at the relation between changes in freedom and changes in prosperity. That is, are countries that have increased their level of freedom more also the ones with higher increases in prosperity? Figure 15 presents the results of this approach. We have calculated the change in the Freedom Index score for each country from 1995 up until 2023, and we have plotted
it against the change in the Prosperity Index score during the same period. Furthermore, we have removed countries with a change in freedom smaller than five points (positive or negative), to focus only on “true movers.” We again find a close association between both variables, with a correlation of 0.49, confirming the hypothesis that the more a country increases its freedom, the higher the increase in prosperity.
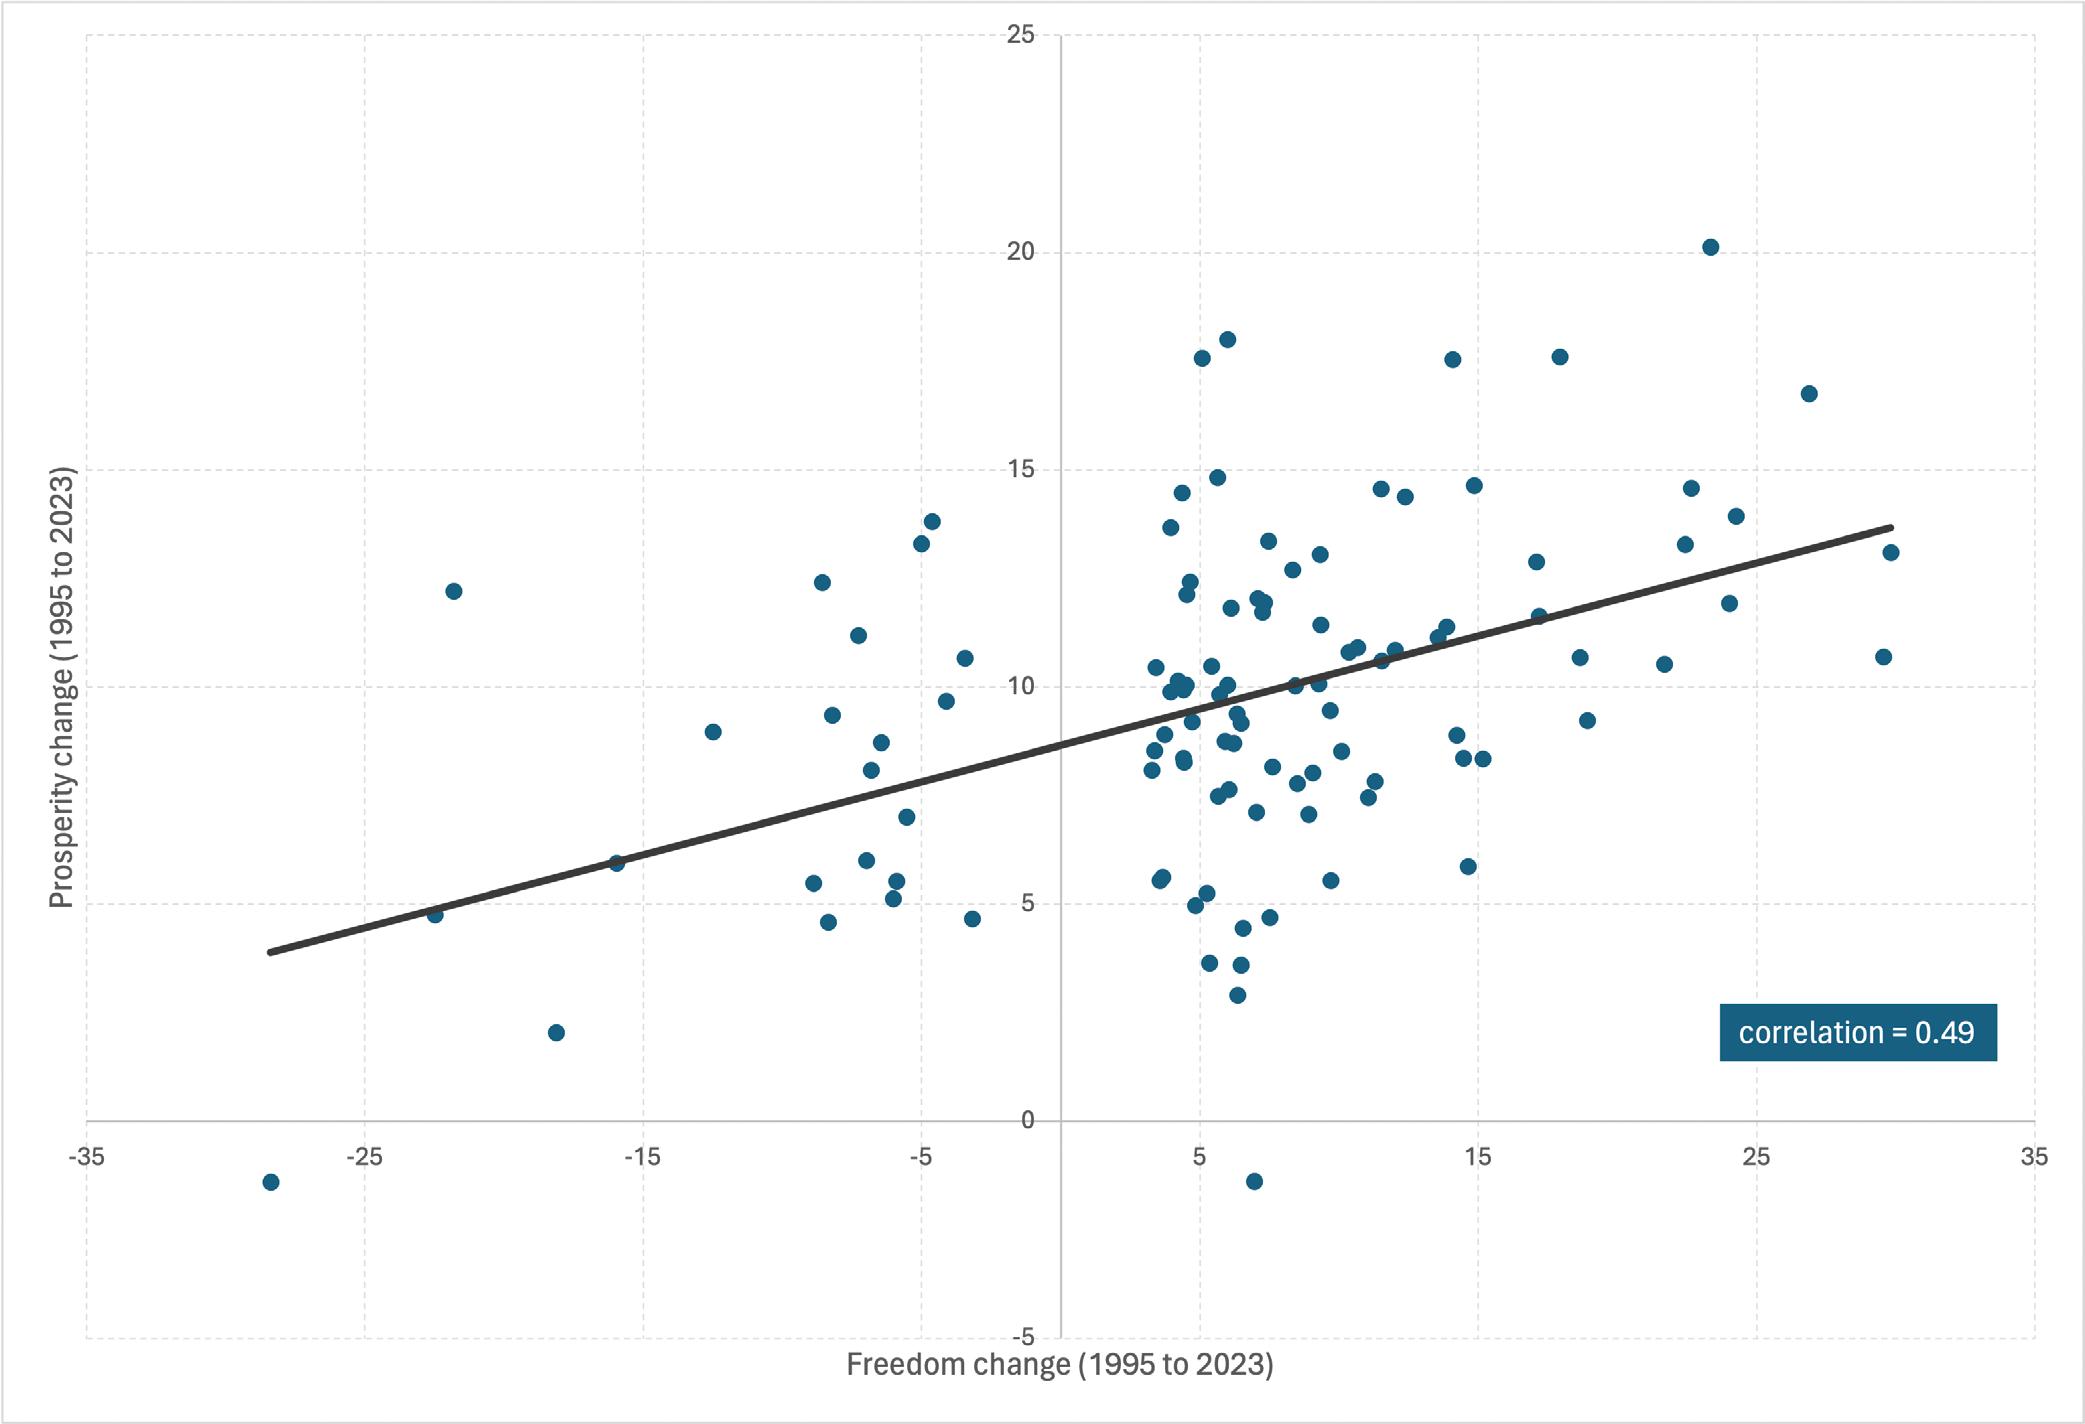
Notes: The graph contains all countries covered by the Freedom and Prosperity Indexes that experienced a cumulative change of greater than five points in the Freedom Index between 1995 and 2023
The last piece of evidence also looks at changes in both indexes (see figure 16). All countries of the world are classified in three equally sized groups, depending on the magnitude of the change in their Freedom Index score since 1995. We then computed the average growth in prosperity for each group, up until 2023, and normalized average prosperity for each group in 1995 to equal 100, so that the plot clearly shows the percentage increase in prosperity throughout the whole period. Countries with the highest freedom improvements have experienced an average growth in prosperity of 22 percent, significantly higher than the average for the intermediate group (18 percent) or the group of countries with the lowest increases in freedom (14.5 percent). Another interesting insight of the graph is that it makes evident that differences in the evolution of prosperity are not so noticeable initially, but compound over time and are pronounced in the long run. In the next subsection, a more sophisticated analysis reinforces this intuition.
Figure 16. The higher the freedom improvement, the higher the higher the prosperity increase (1995–2023)
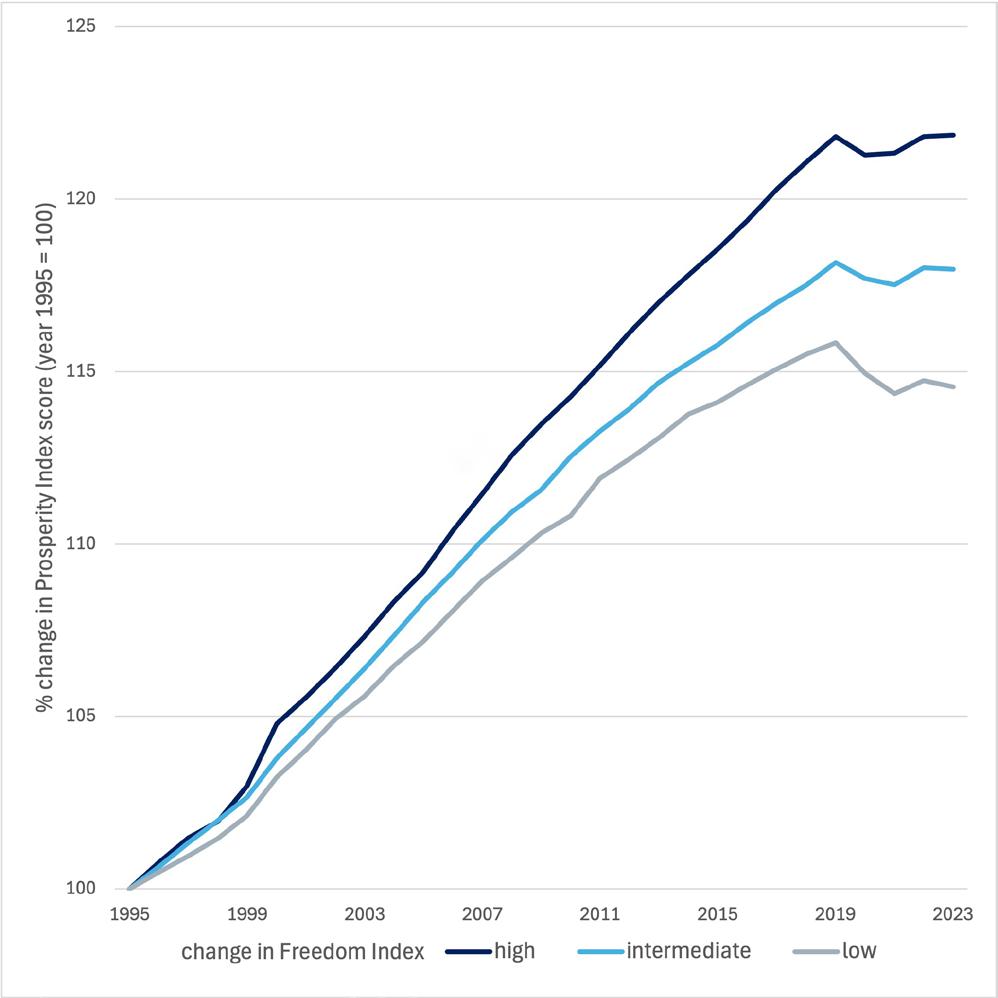
Notes: Countries are grouped according to their cumulative change in the Freedom Index in the 1995-2023 period. Each line portrays the average prosperity increase of each group, normalizing the average prosperity level in 1995 to equal 100.
The previous analysis provides a simple test of the close association of freedom and prosperity, using the full period covered by the indexes. While clearly showing the relation between both variables in the long run (twenty-nine years), such an approach does not deal with a crucial aspect of the relationship: the timing of the effect of freedom on prosperity. That is, do reforms toward freer institutions have an instantaneous effect on prosperity, or are the fruits only visible after a considerable lag of time? This question is of paramount interest, especially to policymakers and other actors seeking to bring about change.
We try to provide a preliminary take on the issue by means of simple local linear projections.18 In a nutshell, the technique is based on the computation of separate regressions for a shock (in this case a significant change in freedom in a given period) on the outcome variable at different points in time in the future (in this case, change prosperity in the subsequent twenty years). The coefficients of each regression are plotted for each time lag, producing a very intuitive graph that tackles closely our question at hand, namely, the timing of the effect of freedom on prosperity.
For our exercise, we define a shock to freedom as a change in the Freedom Index score in the top-twentieth percentile (positive shocks), or bottom-twentieth percentile (negative shocks) of yearly freedom changes for the full sample. In order to keep the specification as simple as possible, we include a minimal set of controls. These are time-fixed effects, in order to capture the aggregate positive trend in prosperity observed for the period of analysis, regional and OECD dummies, to control for regional differences in prosperity that are not explained by the other factors, and the initial level of prosperity in 1995 to account for potential convergence effects.
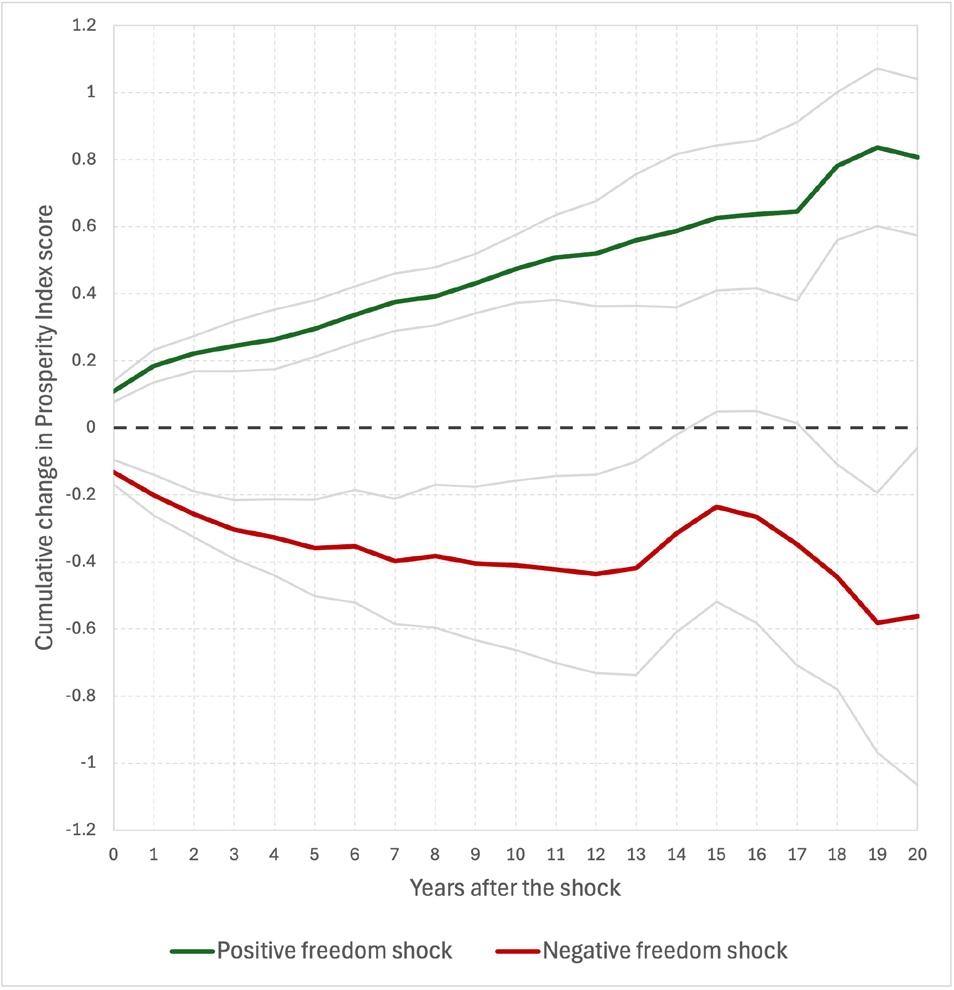
Notes: Local linear projection of a shock to the Freedom Index score on the Prosperity Index score. Shocks are defined as yearly changes in the Freedom Index among the top 20 percent (positive) and bottom 20 percent (negative) of the distribution of changes for the whole sample. Gray bands show the 95 percent confidence interval. The estimation includes year-fixed effects, regional and OECD dummies, and the prosperity score in 1995 as controls.
The results of this exercise are presented in figure 17. A positive shock to freedom (green) generates a somewhat small contemporaneous increase in prosperity (0.11 points), but the cumulative effect increases to 0.47 points after ten years, and in twenty years is more than seven times larger, reaching a total increase in the prosperity score of 0.8 points. Conversely, a negative freedom shock leads to a fall in prosperity of around 0.13 points in the year of the event, but the effect is three times larger after ten years, and is estimated to reduce prosperity by 0.56 points after twenty years. That is, in both cases it is clear that substantial freedom movements exert an effect on prosperity that is only fully accounted for with a considerable lag, but in the long run the gap in prosperity between countries that move toward freer institutions compared to those that move in the opposite direction is significant.
The results, though preliminary, provide two important policy implications. First, that governments willing to carry out reforms toward freer institutions need to be patient. The fruits of their efforts will not appear instantaneously, but ultimately will make their way to generate sizeable increases in the level of prosperity of their populations. Second, countries in a path of freedom regress must understand that the apparent harmless effects of their policies in the short run are just an illusion, and are likely to be extremely harmful for the citizens they govern.
In the last decade, the world has experienced a series of worrying trends. The gradual and sustained erosion of political freedom across the world is clearly the most disturbing. Uncertainty is high regarding whether this tendency toward less free political systems will be reverted, will persist, or worsen.
The deterioration of political rights and mechanisms of control of those holding political power imply a subtle but profound risk to liberal democracy, as these act as safeguards of other rights and freedoms. Illiberal populism, polarization, and attacks on freedom of expression and judicial independence can create the conditions for an unchecked executive to fall into a process of increasing autocracy, i.e., autocratization.
The established democracies of the Western world cannot fall into complacency when seeing that the drop in political freedom they have experienced is of relatively smaller magnitude than that of the rest of the world. The negative evolution of freedom among this group is unprecedented. So far, democracies in the West have proven resilient, but it is highly uncertain whether they can endure such continuing pressure in their very foundations.
Developing nations must continue their liberalization efforts in all three dimensions of freedom. Increasing economic freedom has fueled growth and increased prosperity for millions of people in Africa and Asia, but it is certainly not sufficient. Strengthening the rule of law and political liberalization must follow if sustained economic development is to be attained.
Governments in all countries need to understand a crucial insight shown in this report: that institutional reforms— either toward freer or less free environments—compound over time and produce long-term effects on prosperity. Countries trying to increase freedom must be patient. The fruits of their efforts will take time to be fully visible, but will be significant. Conversely, governments that assume that freedom regression is innocuous because the shortterm effects are minor, as may be the case in many developed nations today, can be jeopardizing the prosperity of the next generation.
Citizens around the world cannot forget that it was free institutions—political, legal, and economic—that generated the conditions to escape widespread poverty in today’s most developed nations and attain a level of prosperity unimaginable just two centuries ago. Freedom is truly the surest path to prosperity.
The Freedom and Prosperity Indexes are a creation of the Atlantic Council’s Freedom and Prosperity Center. The center’s mission is to increase the well-being of people everywhere—and especially of the poor and marginalized in developing countries— through unbiased, data-based research on the relationship between freedom and prosperity.
The center’s work is both theoretical and practical. It aims to produce research regarding the best path to development, but also to apply the conclusions of this research through reform proposals, education, and an active media presence around the world. It is in this spirit that we created the Freedom and Prosperity Indexes.
They are two separate indexes that rank 164 countries around the world according to their levels of freedom and prosperity. All index measurements are weighted equally and the score for each index is simply the average of its component parts. Scores range between zero and one hundred, with higher values indicating more freedom or prosperity. The indexes are constructed using publicly available datasets produced by other prominent organizations and international institutions.
The Freedom Index ranks countries according to the equally weighted average of three subindexes : economic subindex, political subindex, and legal subindex. Each country’s score ranges between zero and one hundred, with higher values indicating more freedom.
Countries are placed into four categories based on the Freedom Index ranking for each year: “high freedom,” “moderate freedom,” “low freedom” and “lowest freedom.” Our category system is therefore a relative ordering of countries in four equal groups.
The Prosperity Index ranks countries according to the equally weighted average of six components: income, health, education, environment, minorities, and inequality. The index is scaled so that a country’s score ranges between zero and one hundred, with higher values indicating more prosperity.
The definition of a prosperous society is the subject of an ongoing theoretical debate that involves various perspectives from fields such as economics, sociology, political science, and philosophy. One view is that prosperity is characterized by high levels of economic growth and material wealth, as measured by metrics like GDP per capita. This approach emphasizes the importance of
policies that promote free markets, investment, and innovation to achieve sustained prosperity. However, critics of this view argue that a narrow focus on economic growth can lead to negative consequences for society, including income inequality, environmental degradation, and social exclusion.
Another perspective on prosperity suggests a more holistic approach that considers social cohesion, environmental sustainability, and human well-being as key components of a prosperous society. Proponents of this view argue that policies should be designed to promote these outcomes, in addition to economic growth and material wealth.
There is also a debate about the contested and value-laden nature of the concept of prosperity, with some arguing that different societies may have different ideas about what constitutes prosperity and that these ideas may evolve over time.
Here we took the holistic approach and captured the most commonly accepted components in the literature and for which data was available. We decided to give equal weight to all to remain neutral.
Countries are placed into four categories based on their Prosperity Index ranking for each year: “high prosperity,” “moderate prosperity,” “low prosperity” and “lowest prosperity.” Our prosperity category system is again relative, classifying countries in four equal groups for each year.
The indexes use data produced, among others, by the Fraser Institute, the Global Carbon Budget, the Heritage Foundation, the Institute for Health Metrics and Evaluation, the United Nations, the Varieties of Democracy (V-Dem) Institute, the World Bank, World Economics, and the Standardized Income Inequality Database. In the few exceptional cases in which we do not have data for a variable from our preferred source, we use alternative sources of data. These instances are listed in each relevant section.
The Freedom and Prosperity Indexes cover the period of 1995 to 2023. For the most recent year, the indexes use the most recent data available. For the Freedom Index, most of these data are from 2023. For the Prosperity Index, most of these data are from 2022. If a country-year observation is missing for a given variable, we follow a transparent algorithm to fill in the missing values. Whenever possible, we use linear interpolation between two available observations. When missing data are at the beginning or ending of the series, it is not possible to interpolate. In such
cases, we extend forward or backward the closest available observation.
We try to minimize data transformations. Besides the necessary scaling to ensure that all components lie in the same range (zero to one hundred), we only use standard techniques (taking the natural logarithm) to linearize highly nonlinear variables such as GDP per capita.
The Freedom Index has three subindexes: economic, political, and legal. Each subindex is comprised of multiple components. The components used to construct each subindex are listed below, together with the original sources of data and analyses. A spreadsheet with the raw data, as well as the code used to construct the indexes are publicly available on our website.
Economic subindex refers to an economic system that upholds the rights of all businesses and entrepreneurs. Economic freedom is measured as an equally weighted average of four components: property rights, trade freedom, investment freedom, and women’s economic freedom.
The property rights component assesses the extent to which a country’s legal framework allows individuals to acquire, hold, and utilize private property, secured by clear laws that the government enforces. It provides a quantifiable measure of the degree to which a country’s laws protect private property rights and the extent to which those laws are respected.
Source of data: Fraser Institute, Component 2C Protection of Property Rights, Economic Freedom of the World. For details on the methodology of Component 2C, see Economic Freedom of the World: 2023 Annual Report, Fraser Institute, accessed May 4, 2024, https://www.fraserinstitute.org/sites/ default/files/economic-freedom-of-the-world-2023.pdf.
The trade freedom component covers a diverse range of trade restrictions, encompassing tariffs, quotas, hidden administrative restraints, and exchange-rate interventions. It is the average of three equally weighted components: tariffs, regulatory trade barriers, and black-market exchange rates. A high score reflects a nation that maintains low tariffs, enforces streamlined and effective
customs clearance processes, and has a freely convertible currency.
Source of data: Fraser Institute, Component 4A Tariffs, 4B Regulatory trade barriers, 4C Black-market exchange rates, Economic Freedom of the World. For details, see Economic Freedom of the World: 2023 Annual Report, Fraser Institute, accessed May 4, 2024, https://www.fraserinstitute.org/sites/ default/files/economic-freedom-of-the-world-2023.pdf.
The investment freedom component assesses several regulatory limitations that are usually enforced on investments. Points are subtracted from a country’s investment regime’s perfect score of one hundred for each restriction present. An ideal score indicates a country with unrestricted flow of investment capital, allowing individuals and firms to transfer their resources freely into and out of specific activities, both within the country and across its borders.
Source of data: Heritage Foundation, Index of Economic Freedom. See “Methodology,” Heritage Foundation, https:// www.heritage.org/index/pages/about#indexMethodology
The women’s economic freedom component attempts to capture inequality in legislation between men and women throughout the duration of a woman’s working life, from the time she can enter the labor force through retirement. The component is measured on a scale of zero to one hundred, with higher values representing more equality.
Sources of data: World Bank, Women, Business and the Law Index 1.0. For details, see World Bank, https://wbl.worldbank. org/en/methodology
Political subindex measures the institutional framework for the selection of those holding executive political power and the limits and controls imposed on exercising this power. It is a concept that closely resembles the ideals of democracy and individual rights. Political freedom is measured as an equally weighted average of the following four components: elections, civil liberties, political rights, and legislative constraints on the executive.
The elections component captures the electoral core of democracy, that is, whether political leaders are chosen by the citizenry in open, clean, and fair elections with ample suffrage. It is an equally weighted average of three components: share of population with suffrage, clean elections, and elected officials.
Sources of data: V-Dem dataset including share of population with suffrage indicator (v2x_suffr), Clean Elections Index (v2xel_frefair), and Elected Officials Index (v2x_elecof). For details on the methodology of each component, see V-Dem Codebook V14, V-Dem website, accessed March 15th, 2024, https://v-dem.net/documents/38/V-Dem_Codebook_v14.pdf.
The civil liberties component includes an array of individual rights in the liberal tradition (i.e., criminal procedural rights, absence of torture, freedom of movement, etc.) that limit the scope of governmental action, guaranteeing an area of individual autonomy and freedom in personal affairs. It is an equally weighted average of two components: private civil liberties and physical violence.
Sources of data: V-Dem dataset including Private Civil Liberties Index (v2x_clpriv) and Physical Violence Index (v2x_clphy).
The political rights component encompasses individual rights directly linked to the democratic political process, such as freedom of expression or association. It is an equally weighted average of two components: Freedom of Expression and Alternative Sources of Information Index and the Freedom of Association Thick Index.
Source of data: V-Dem dataset Freedom of Expression and Alternative Sources of Information Index (v2x_freexp_altinf) and Freedom of Association Thick Index (v2x_frassoc_thick).
D. LEGISLATIVE CONSTRAINTS ON THE EXECUTIVE
The legislative constraints on the executive component evaluates the level of control the democratically elected legislative branch has on the executive’s exercise of power.
Source of data: V-Dem dataset Legislative Constraints on the Executive Index (v2xlg_legcon).
Legal subindex measures the degree to which a country abides by the rule of law, has a legal system that fairly protects property and contract rights, and prevents corruption and the arbitrary abuse of power. The legal subindex is measured as the equally weighted average of five components: clarity of the law, judicial independence and effectiveness, bureaucracy and corruption, security, and informality.
The clarity of the law component measures the basic formal requirements of the legal system, in particular if laws are general, clear, public, noncontradictory, consistent, and are predictably enforced.
Source of data: V-Dem dataset, Transparent Laws with Predictable Enforcement Index (v2cltrnslw).
The judicial independence and effectiveness component measures the strength of an efficient and fair judicial system, which ensures that laws are fully respected and that any violations are met with appropriate legal action. It is an equally weighted average of two components: the Judicial Constraints on the Executive Index, and Independent and Accessible Justice components.
Sources of data: V-Dem dataset including Judicial Constraints on the Executive Index (v2x_jucon), and Independent and Accessible Justice data (simple average of v2xcl_acjst, v2juaccnt, v2jureview, v2jupurge, v2jupoatck).
C. BUREAUCRACY AND CORRUPTION
The component on bureaucracy and corruption measures the degree to which government officials are subject to and comply with the law. It is an equally weighted average of two components: government effectiveness and control of corruption.
Sources of data: World Bank, Worldwide Governance Indicators (WGI) for government effectiveness and control of corruption
D. SECURITY
The security component measures whether the citizenry generally observes the country’s legal norms and regulations. It is based on perceptions of the likelihood of political instability or violence driven by political motives, such as terrorism.
Sources data: World Bank, Worldwide Governance Indicators (WGI) for political stability and absence of violence/terrorism
E. INFORMALITY
The informality component measures informal economic activity. Data for this component is expressed as a percentage of GDP made up by the informal economy. To convert to a scale of zero to one hundred, we subtract that value from the perfect score of one hundred. High scores represent less informality.
Sources of data: We use data from World Economics Quarterly Informal Economy Survey (https://www.worldeconomics.com/Concepts/InformalEconomy/), which is available for the period 2000-2023. To cover the period 1995-1999, we use the World Bank’s Dynamic General Equilibrium model-based estimates of informal output (https://www.worldbank.org/en/research/brief/informal-economy-database). To avoid artificial jumps at the year 2000, we calculate the average ratio between both series for the period 2000-2005 for each country, and use that value to scale the World Bank data.
The Prosperity Index attempts to capture both the average level of prosperity, through the level of purchasing power and human capital that an average citizen displays, and shared prosperity, through measures of environment quality as well as income inequality and the well-being of minority groups. Countries are scored and ranked according to the equally weighted average of six components. The index scores are indicated on a scale from zero to one hundred, where zero represents the worst performance in the sample and one hundred the best. The components are listed below.
The income component is measured according to GDP per capita, expressed in constant 2017 US dollars and adjusted for purchasing power parity (PPP). The original data is linearized before scaling by taking the natural logarithm. Higher scores indicate greater GDP per capita.
Sources of data: World Bank, World Development Indicators “GDP per capita, PPP, constant 2017 international $,” (https:// databank.worldbank.org/reports.aspx?source=2&series=NY. GDP.PCAP.PP.KD&country=); for data for Afghanistan, Eritrea, South Sudan, Taiwan, Venezuela, and Yemen, we use the IMF’s “World Economic Outlook” databases (https://www.imf. org/en/Publications/WEO/weo-database/2024/April); and for data for Syria, we use Penn World Table (https://www.rug.nl/ ggdc/productivity/pwt/?lang=en).
The environment component is measured by the unweighted average of three components: the ratio of CO2 emissions to GDP per capita (both in logs), death rates from air pollution per 100,000 people (age standardized), and the share of the population with access to clean cooking technologies. Higher scores indicate better environmental performance (less emissions, less deaths, or higher access, respectively).
Sources of data: For emissions, we use data from The Global Carbon Budget 2023 “Fossil CO2 emissions by country (territorial)” (https://essd.copernicus.org/articles/15/5301/2023/). GDP per capita uses the same series and sources as our income component. For deaths from air pollution, we use data from the Institute for Health Metrics and Evaluation, 2019 Global Burden of Disease study, http://ghdx.healthdata.org/ gbd-results-tool. For access to clean fuels, we use World Bank data (“Access to clean fuels and technologies for cooking (% of population),” (https://databank.worldbank.org/metadataglossary/world-development-indicators/series/EG.CFT.ACCS. ZS).
The minorities component is measured through several variables from the V-Dem dataset, which capture discrimination and/or exclusion from public services, state jobs, or business opportunities based on gender, political affiliation, and social group (ethnic, race, language, region, caste, religious, immigration status, and so on). The resulting component is the unweighted average of nine V-Dem indicators, where higher values imply less discrimination.
Source of data: V-Dem dataset, including access to public services distributed by gender (v2peapsgen), access to state jobs distributed by gender (v2peasjgen), access to state business opportunities distributed by gender (v2peasbgen), access to public services distributed by political group (v2peapspol), access to state jobs distributed by political group (v2peasjpol), access to state business opportunities distributed by political group (v2peasbepol), access to public services distributed by social group (v2peapssoc), access to state jobs distributed by social group (v2peasjsoc), and access to state business opportunities distributed by social group (v2peasbsoc).
The health component is measured through life expectancy. The measurement of life expectancy is expressed in years that a newborn infant would be expected to live if the prevailing patterns of mortality at the time of birth were to stay the same throughout the individual’s life.
Source of data: United Nations, Department of Economic and Social Affairs, Population Division, World Population Prospects 2022: Data Sources, UN DESA/POP/2022/DC/NO. 9, 2022, https://population. un.org/wpp/Publications/Files/ WPP2022_Data_Sources.pdf
The education component is measured through both expected years of schooling and mean years of schooling. We set eighteen as the maximum value for the former, and fifteen for the latter, just as the United Nations Human Development Index does. We take the average of both measures, and the result is scaled to the interval zero to one hundred.
Source of data: United Nations Human Development Index, https://hdr.undp.org/data-center/human-development-index#/ indicies/HDI.
The inequality component measures the equal distribution of income across the population. It is measured through the after taxes and transfers Gini coefficient. Higher scores indicate lower inequality.
Source of data: Standardized World Income Inequality Database v. 9.6., variable gini_disp.
The Freedom and Prosperity Indexes methodology is designed to be an easily replicable way to benchmark specific characteristics. But it also has limitations that should be understood. Ensuring comparability of the data across a global set of countries is a central consideration. When selecting sources to be included in the indexes, coverage has been a determining factor. Data were collected over the past year, using the most recent information available. They might not reflect the latest political or economic developments. These indexes should not necessarily be taken as an accurate reflection of the most recent current events. We will, however, update the indexes over time to capture real-world changes on an annual basis. We did our best to collect the most reliable information available. The objective of these indexes is to provide standardized measures that can be applied to every country. One might argue that the methodology or the data collected are irrelevant to certain types of political situations or specific countries. That might be the case in some instances, but rarely so. Moreover, there is an inherent tension between generalizable and specific knowledge. In this study, we self-consciously opt for the former. We encourage other researchers to explain how our indexes illuminate or obscure country-specific dynamics.

Ignacio Campomanes : Ignacio P. Campomanes is a senior advisor at the Atlantic Council’s Freedom and Prosperity Center and a resident fellow at the Navarra Center for International Development, a research center at the University of Navarra in Spain. Previously, he spent one year at the National Bureau of Economic Research in Cambridge, Massachusetts, as a post-doctoral fellow on long term fiscal policy. His research lies at the intersection of political economy, public economics, and development economics. In particular, his work focuses on the institutional determinants of economic development, and how these are mediated by features of the politico-economic environment such as inequality, social mobility, and foreign aid. His work has been supported by the Peterson Foundation, Acton Institute, and the Ramon Areces Foundation. He has taught classes of principles and intermediate macroeconomics at the University of Minnesota, and economic growth and business cycles at the University of Navarra.
Campomanes holds a BA in economics and a BA in law from Carlos III University in Spain, master’s degrees in economics from Complutense University of Madrid and the University of Minnesota, and a PhD in economics from the University of Minnesota.

Nina Dannaoui: Nina Dannaoui is the associate director at the Atlantic Council’s Freedom and Prosperity Center. In her previous role, she held the position of director at K2 Integrity, where she provided advisory services to government and financial institution clients regarding matters related to financial crimes compliance. Prior to that, she worked as a financial sector specialist at the World Bank Group, offering guidance to governments on matters of financial integrity, inclusion, and transparency. Additionally, she gained experience in regulatory compliance through her roles at Western Union Business Solutions and Lockton Companies.
Dannaoui’s educational background includes a Master of Laws in international legal studies from Georgetown University in Washington, DC, and a law degree from the Holy Spirit University in Lebanon. She is a member of both the New York Bar Association and the Lebanese Bar Association.

Joseph Lemoine: Joseph Lemoine is the director of the Atlantic Council’s Freedom and Prosperity Center. Previously, he was a private sector specialist at the World Bank. An expert in development indicators, Lemoine specializes in assessing business and investment climates, regulatory governance, women’s entrepreneurship, and government transparency.
Lemoine has advised governments on policy reforms that help boost entrepreneurship and shared prosperity, primarily in Francophone Africa and the Middle East. He is a graduate of the Georgetown University Law Center, Université Paris 1 Panthéon-Sorbonne, and Sciences Po Grenoble.

Dan Negrea: Dan Negrea is the Senior Director of the Freedom and Prosperity Center.
He was the State Department’s Special Representative for Commercial and Business Affairs between 2019 and 2021. In that capacity, he pioneered and led the Deal Team Initiative, a coordination mechanism between U.S. government agencies. The initiative promotes business relations between U.S. and foreign companies around the world.
He was a member of the Secretary of State’s Policy Planning office between 2018 and 2019 where he was responsible for the economic portfolio. He coordinated the Global Entrepreneurship Summit held in The Hague in 2019 that was attended by 2,000 participants from government, business, academia, and international organizations.
For three decades before that, he held leadership positions in Wall Street firms. He raised over $15 billion in financings in the United States and abroad, mostly for middle-market companies.
He defected from Communist Romania where he had been an official in the Ministry of Finance and was involved in negotiating government loans with the World Bank and the International Monetary Fund. He holds an MBA from Cornell University and an MA from the School of International Economic Relations in Bucharest, Romania. He has published extensively on foreign affairs.
The 2024 Freedom and Prosperity Indexes: Notes to pages 5–11
1 Dan Negrea, Joseph Lemoine, and Ignacio Campomanes, eds., 2024 Atlas: Freedom and Prosperity Around the World, Atlantic Council, February 2024, https://www.atlanticcouncil.org/programs/ freedom-and-prosperity-center/2024-atlas-freedom-and-prosperity-around-the-world/.
2 Joseph Lemoine et al., “False Promises: The Authoritarian Development Models of China and Russia,” Atlantic Council, January 2024, https://www.atlanticcouncil.org/in-depth-research-reports/ report/false-promises-the-authoritarian-development-models-of-china-and-russia/.
3 Jérémie Bertrand et al., Attracting Foreign Direct Investments: How Economic Freedom, Strong Institutions, and the Rule of Law Make a Difference,” February 2024, Atlantic Council, https://www. atlanticcouncil.org/in-depth-research-reports/report/attracting-foreign-direct-investments/.
4 Nina Dannaoui, Annie Lee, and Joseph Lemoine, Freedom and Prosperity in Bangladesh, Atlantic Council, April 2024, https://www.atlanticcouncil.org/in-depth-research-reports/report/how-bangladesh-can-achieve-its-vision-of-prosperity/.
5 Dan Negrea and Joseph Lemoine, Prosperity That Lasts: The 2023 Freedom and Prosperity Indexes, Atlantic Council, June 2023, https://www.atlanticcouncil.org/in-depth-researchreports/report/prosperity-that-lasts-the-2023-freedom-and-prosperity-indexes/.
6 Explore our interactive website: https://freedom-and-prosperity-indexes.atlanticcouncil.org/.
7 See, for example, J. Møller and S. Skaaning, The Rule of Law: Definitions, Measures, Patterns and Causes (London: Palgrave Macmillan, 2014); B. Z. Tamanaha, On the Rule of Law: History, Politics, Theory (Cambridge, UK: Cambridge University Press, 2004); or T. Ginsburg, “Difficulties with Measuring the Rule of Law,” in Handbook on the Rule of Law (Cheltenham, UK: Edward Elgar Publishing, 2018).
8 This very intuitive and simple definition of the rule of law is given by B. Z. Tamanaha, “The History and Elements of the Rule of Law,” Singapore Journal of Legal Studies, 2012. 232–247.
9 Our conceptualization of political freedom closely resembles that of Robert Dahl’s concept of polyarchy. See R. Dahl, Polyarchy: Participation and Opposition (New Haven, CT: Yale University Press, 1971). V-Dem’s indexes also are based on this definition, and that is why we used several variables from their dataset to construct our political subindex components.
10 Our idea of economic freedom broadly resembles that of the classic thinkers of economic liberalism, such as F. A. Hayek or M. Friedman, but we remain agnostic about government size (level of taxes and transfers), and focus on property rights protection, free movement of goods, services, and capital, and women’s economic freedom.
11 Some predecessors of our Prosperity Index, on which we rely for some components, are the UN Human Development Index or the Legatum Index.
12 The Gini coefficient, also known as the Gini index, assesses how income is distributed within a country or group. Developed by Italian statistician Corrado Gini (1884-1965), this common measure reflects how far a society’s distribution deviates from perfect equality.
Results: Notes to pages 12–32
13 This process has been documented by political scientists in the last decade. See, for example, A. Lührmann and S. I. Lindberg, “A Third Wave of Autocratization Is Here: What Is New About It? Democratization 26, no. 7 (2019): 1095–1113.
14 The picture portrayed by the political subindexes coincides with F. Fukuyama’s argument that we are experiencing a crisis of liberalism more than a crisis of democracy. See F. Fukuyama, Liberalism and Its Discontents (London: Profile Books Limited, 2022).
15 For an in-depth analysis of the Indian case, read the chapter on India written by M. Pratab included in the 2024 Freedom and Prosperity Atlas.
16 The last Women, Business and the Law report and dataset produced by the World Bank, on which our women’s economic freedom component is based, provide a detailed analysis of the specific policies implemented in different countries.
17 Because we use only external sources, we rely on the release cycles of the institutions that produce them. Collecting and compiling data from so many countries takes time, and delays in the release of this data are common. This primarily affects our Prosperity Index, which relies heavily on data from the United Nations and the World Bank.
The path to prosperity: Note to pages 33–37
18 The technique was first introduced by O. Jordà and has proven very useful in macroeconomic analysis due to its simplicity and flexibility. See O. Jordà, “Estimation and Inference of Impulse Responses by Local Projections,” American Economic Review 95, no. 1 (2005): 161–182.

CHAIRMAN
EXECUTIVE CHAIRMAN EMERITUS
PRESIDENT AND CEO
EXECUTIVE VICE CHAIRS
VICE CHAIRS
TREASURER
DIRECTORS
Grzesiak
HONORARY DIRECTORS
*Executive Committee Members List as of April 24, 2024