11 minute read
max ebb: projecting
It was good to see that someone had finally read my instructions about how to prepare their boat for an inspection. The storm jib hoisted, the trysail bent on, jacklines rigged, and emergency steering system set up and ready to demonstrate. Even the anchor rodes were run out along the dock, ready to measure. This inspection would go quickly, and I might even have time to go sailing later in the afternoon.
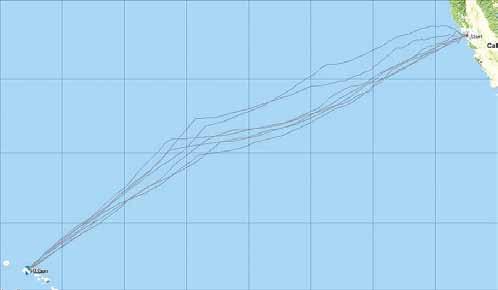
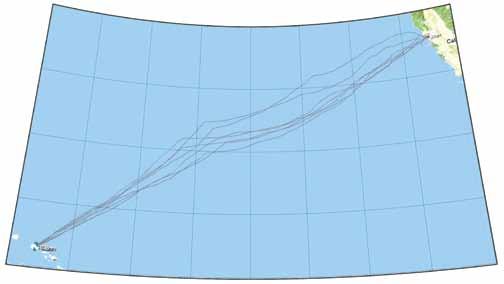
By the time I went below to find the skipper, I had checked off most of the deck items: Toerail around the foredeck, lifeline stanchions secured in place, padeyes for harness tethers. Things were just as well organized downstairs, with age plan. "Looks like they might have gone a little too far north in the last race," I said. "Is that to remind the crew not to take that route again?" "That's just the 'passenger chart,' like what they post on a cruise ship," said Lee. "And, like, it's not as far north as it looks on that projection." "Right," I said. "I understand that the track chart is on a Mercator projection, so the great circle course is a curve to the north of a straight line. I guess when you have a spherical earth and make it into a flat map, it's impossible to show
Advertisement
"For most applications the Mercator projection is more practical because it's, like, conformal and loxodromic."
Against my better judgment, I asked what those words meant. "Conformal," Lee explained, "just means that shapes and angles are preserved, as long as their extents are small compared to the size of the earth. That is, a circle will always look like a circle, and a right angle will always be a right angle. Now, the scale may change a lot. We have the 'Greenland syndrome,' whereby Greenland looks bigger than South America, even though it's really much smaller. But the shape of any reasonably small feature is preserved accurately. Like, a bay in Alaska will appear five times the size of a bay in Brazil, but it will still have the right proportions." "That's because the meridians all converge at the poles, but the Mercator projection keeps them at the same distance on the chart," I volunteered. "So the scale becomes infinitely large at the pole." "And the chart would become infinitely large at the pole too," added Lee.
all the required PFDs, harnesses, tethers, flares, and other emergency items on display. Still no sign of the owner or skipper, but there was a file folder on the chart table marked "For Inspector" that contained copies of the raft certification and other required documents.
The inspection checklist was almost complete before the owner — or in this case, the owner's rep — came aboard. "Max!" cried Lee Helm as she jumped down the companionway ladder. "I didn't expect you to be our inspector!" "Well," I countered, "I didn't expect you to be on the crew. Did they leave you in charge of inspection prep? And are you on this boat for the Hawaii race?" "For sure," she said. "Nice ride, huh?" "It looks fast," I agreed.
Ichecked off some more basic items in the cabin — bilge pump handles, floor boards secured, ditch bag within easy reach — when I noticed a track chart taped to the bulkhead next to the stow-
The track chart at the top shows division winners of the 2012 Pacific Cup, in Mercator and tangential projections. When you see the great circle as a straight line, it doesn't look as if the winners went all that far north.
the shortest distance as a straight line." "That's not true at all," Lee informed me. "There are lots of ways to represent a sphere on a plane, and some of them show all great circle paths as straight lines." "Well then why don't we use them for navigation?" I asked. "Seems like it would be much more intuitive." "That's why a Mercator projection — at least one aligned with the equator — never reaches the pole. But shapes and angles are preserved intact, so the projection is conformal." "What was that other property?" "Loxodromic," Lee continued. "That just means that a straight line from point A to point B will have the same heading over its entire length." "In other words, a rhumbline course," I said. "But, like, in this case 'rhumbline' is not the shortest distance from A to B.
of tangency, accurately represents the great circle direction from that point. It's another property of the tangential projection. I'll demonstrate."
Lee pushed me over to the nav station and had me sit down at the chart table. Moving the race paperwork out of the way, she opened a little hatch in the chart table lid that revealed a laptop computer. While we waited for it to boot up she explained that "GRIB" stands for "gridded binary," and is the form in
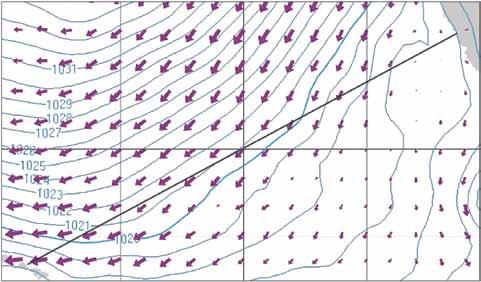
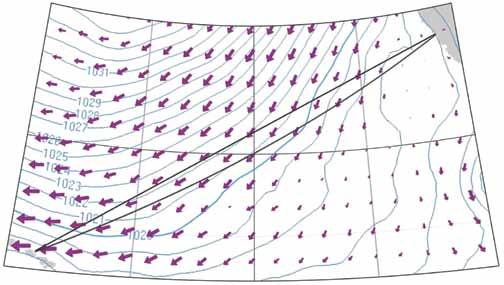
GRIB file showing the surface wind field and pressure, as it might be downloaded at sea. The gnomic projection makes it a little easier to choose an optimal route, especially if you are second-guessing your routing software.
It gets confusing in longer races where there's a difference, and a lot of people say rhumbline but really mean great circle." "Keeping all this straight is just part of the navigator's art," I suggested. "We all know that when you look at a Mercator chart from here to Hawaii, you have to imagine that the shortest distance is an arc to the north." "For sure, Max. But, like, we have computers now. For my charts, I like to re-project in a gnomonic projection that shows all great circles as straight lines. There's a little bit of distortion because it's non-conformal, but I think it shows a more accurate picture of the race course, especially in relation to weather systems and wind forecasts." "I still don't see how you can project a sphere to a plane so that all the lines are straight," I said. "Lots o' ways," Lee repeated. "For example, consider a tangential projection." "Tangential projection?" I asked. "Imagine a plane tangent to the earth's surface. Make the point of tangency near the middle of the race, like 30° degrees north by 140° west. Now imagine a light bulb at the center of the earth, and the map is drawn by literally projecting the shadows of the earth's coastlines, and the shadows of the meridians and parallels, onto that flat plane." "Okay, that's not hard to imagine." "Now it gets fun. Consider a great circle course from San Francisco to Hawaii. The radius of a great circle in three dimensions is the same as the radius of the earth, so the plane that contains the great circle is a plane that passes through the center of the earth." "I'll buy that," I said after a little thought. "And because that imaginary light bulb is at the center of the earth, the line representing the great circle on the earth's surface will also project along that plane that contains the earth's center. The intersection of two planes is always a straight line, so the great circle maps to a straight line on the tangential projection. And, like, any great circle will map to a straight line, for the same reason, even if it's distant from the point of tangency. Because it's in a plane that passes through the center of the earth." "Darn it, you're right!" I said after several more minutes of pondering and a few repetitions of the logic by Lee. "But this projection method can't ever map a point 90° away from the point of tangency, and I imagine the distortion is pretty severe as you get close to that." "True," said Lee. "But, like, for a few thousand miles of ocean, I like seeing non-distorted great circle tracks. I can live without the conformal shapes. So, like, I re-project all my GRIB file views to an azimuthal gnomonic projection." "Azimuthal gnomonic?" "That just means that directions to any object on the map, from the point which some of the most useful weather maps are transmitted in low-bandwidth email via single-sideband radio or sat- phone connections.
A few seconds later we had a GRIB file viewer on the screen, showing the predicted wind field as an array of arrows of various sizes, and surface pressure contours over the race course. "Like, this really should be a feature built into the GRIB file viewer," Lee complained. "But it was written by volunteers, so, like, I can't complain. I have to use a separate program to change from Mercator to a gnomonic view." "Lee, I'm surprised that the viewer shows arrows instead of wind barbs. Aren't wind barbs the meteorological standard notation?" "It's a setting on the viewer; wind barbs distort the visual analog," Lee claimed. "The feathers on the barb make the angle seem a little different. Also they only vary in increments of five knots, and we're concerned with way smaller differences for route optimization. And, like, the best part of using arrows is that when you set the viewer to scale the length of the arrow to the wind speed, the area of the arrow — and like, the amount of ink
on the page — scales according to the area of the arrow."
She could see that this did not impress me. "Get it? The amount of ink is proportional to the length of the arrow squared, so it's also proportional to wind speed squared, so it's proportional to dynamic wind pressure. It's like, a direct representation of the real force of the wind." "Still, to a meteorologist it might look domain that does this?" I asked. "USGS has a program called MapIMG, but I like Geocart a lot better. Much better manual, too, with a really good tutorial on what all the different projections can and can't do for you. Like, did you know that there's a difference between azimuthal, a map that shows the direction to any other point on earth, and retroazimuthal, a map that shows the direction to you from any other point on earth?" "Those two maps should be identical," I asserted. "BZZZT! Wrong! Remember that the grid of parallels and meridians is not rectilinear in an azimuthal projection. The heading changes during the trip, so the initial course for the reverse trip is not the reciprocal of the initial course
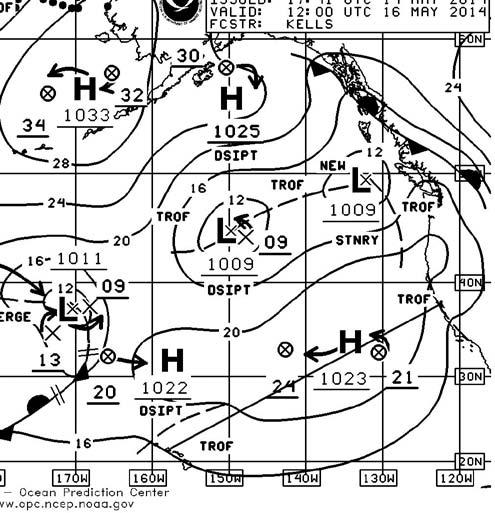
Above and right: Weatherfax surface program, in Mercator and tangential projections. The tangential projection brings Alaska back down to its actual size, along with the highlatitude weather systems.
amateurish." "Heck with that, it gives a better picture of the wind than those silly barbs with feathers every five knots."
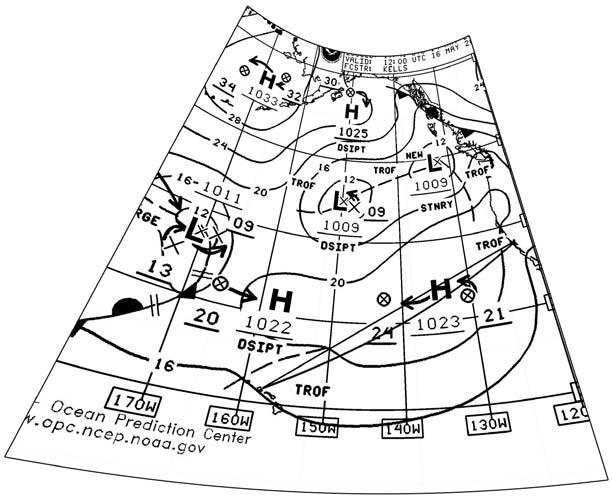
As Lee was arguing for arrows over barbs, she was also bringing up a program called Geocart. She opened a GRIB viewer image in JPEG format, did some manipulations with parallels of latitude and meridians of longitude in a Mercator projection to get it to match the GRIB image, then saved it, opened it again, and we had a new weather map with none of the great-circle distortion. "Nice!" I said. "Where can I get this program?" "The demo is a free download from Mapthematics.com. Full featured, if you don't mind a big watermark 'demo' on all your output. Not all that expensive to buy, in the scheme of things." "Isn't there anything in the public for the outbound trip." "Well, maybe," I allowed. "I remember when I had what must have been an azimuthal map, back when I had a Ham radio set. It was important to know the direction to any other point on earth for aiming the antenna. But why would anyone want a retroazimuthal map?" "It's a classic problem," said Lee. "Which way is Mecca?" "Ah, of course." "Actually," Lee said as she brought up another chart to re-project, this one from a weatherfax broadcast that included a lot of high-latitude distortion, "the app I really want would take any graphic image of a map, figure out for itself what the projection was, then re-project in just one step according to my settings. Right now I can overlay the track chart, the GRIB viewer output, and the weatherfax charts all on the same projection and same scale — but there's a fair amount of legwork to do that. Like, it should all be built into the GRIB viewer or something." "You really think a program could deduce the projection of an image file all on its own?" I asked. "Okay, maybe help it out by clicking on some points and keying in their latlong," Lee conceded. "But, like, 'til then you just have to practice a little with Geocart."
Lee demonstrated a few more map conversions, and since the chart table had a good Internet connection, I bought the program from mapthematics right then and there. Our play was only interrupted by the footsteps of a horde of race crew climbing aboard the boat. "It's the rest of the crew!" Lee exclaimed, looking up at the clock on the bulkhead. "We have a practice scheduled for this afternoon. I thought the inspection would be over by now." "Well, it would have been," I said. "Quick, show me that the bilge pumps both work, and let me take a better look at the emergency rudder. We're supposed to do a test under power..."
The pumps worked fine, the mast step was secure, the fuel tank had its shut-off valve, and the batteries in the EPIRBs and strobes were all within spec. "Just do a doughnut or two with your emergency rudder on your way out of the harbor," I said. "I'll watch from the yacht club." "Deal!" said Lee.
And the inspection, one of the longest ever, was finally over.
— max ebb
Readers — check out these resources: Geocart website: http://www.mapthematics.com (free demo version, $240 for non-commercial license). MapIMG website: http://cegis.usgs.gov/projection/ acc_proj_data.html (free, open-source)


