
10 minute read
Point Clouds
from AUGIWORLD
by AUGI, Inc.
Considering Making The Jump To Point Clouds?
A Comparison of Propeller and Autodesk Products to compute Stockpile Volumes
In the fall of 2021, I had the opportunity to fly drones at active stockpiles in southern Washington State. I have been fascinated with drones since I was a kid (after all, they’re pretty cool!). As a Topcon Application Engineer, frequently I am having conversations with Civil Engineers who are either utilizing or experimenting with point clouds. I am excited to be a part of advancing the civil infrastructure industry as we use drones to capture dense amounts of accurate existing conditions data. I constantly see new devices and platforms in this industry. Obstacle sensing technology, camera quality and efficiency are some of the key pieces pushing this rapidly changing field. Top end drones worth thousands of dollars a few years back are worth mere fractions of that today. With the constant advancement in technology, I took the opportunity with this stockpile project to compare two drones and platforms for engineering use.
For this project, I flew the same stockpile with two different drones and used two different software platforms to compute the results. For drones, I used a Phantom 4 RTK (retails for $6600) and a Mavic 2 Pro (retails for less than $2,000). The Phantom 4 RTK, geared for surveyors and mapping, boasts centimeter accurate data while requiring fewer ground control points. The Mavic 2 Pro, a consumer grade drone, features many of the same camera capabilities as the Phantom 4 RTK without the high-level mapping features which can require more ground control. For our ground control, I used Propeller AeroPoints and a TopCon HiPer HR (multi-purpose GNSS receiver).
On the software end, I used the Autodesk suite of products which included the following: Recap Photo, Recap Pro and Civil 3D. Propeller is a slick platform which focuses on eliminating the labor-intensive backend processes allowing surveyors to double their collection capabilities in a single day.
Understanding the site and the process to collect data is extremely important with the final outputs. After all, the results are only as good as the raw data. This includes monitoring the weather and collecting accurate and well-located ground control data.
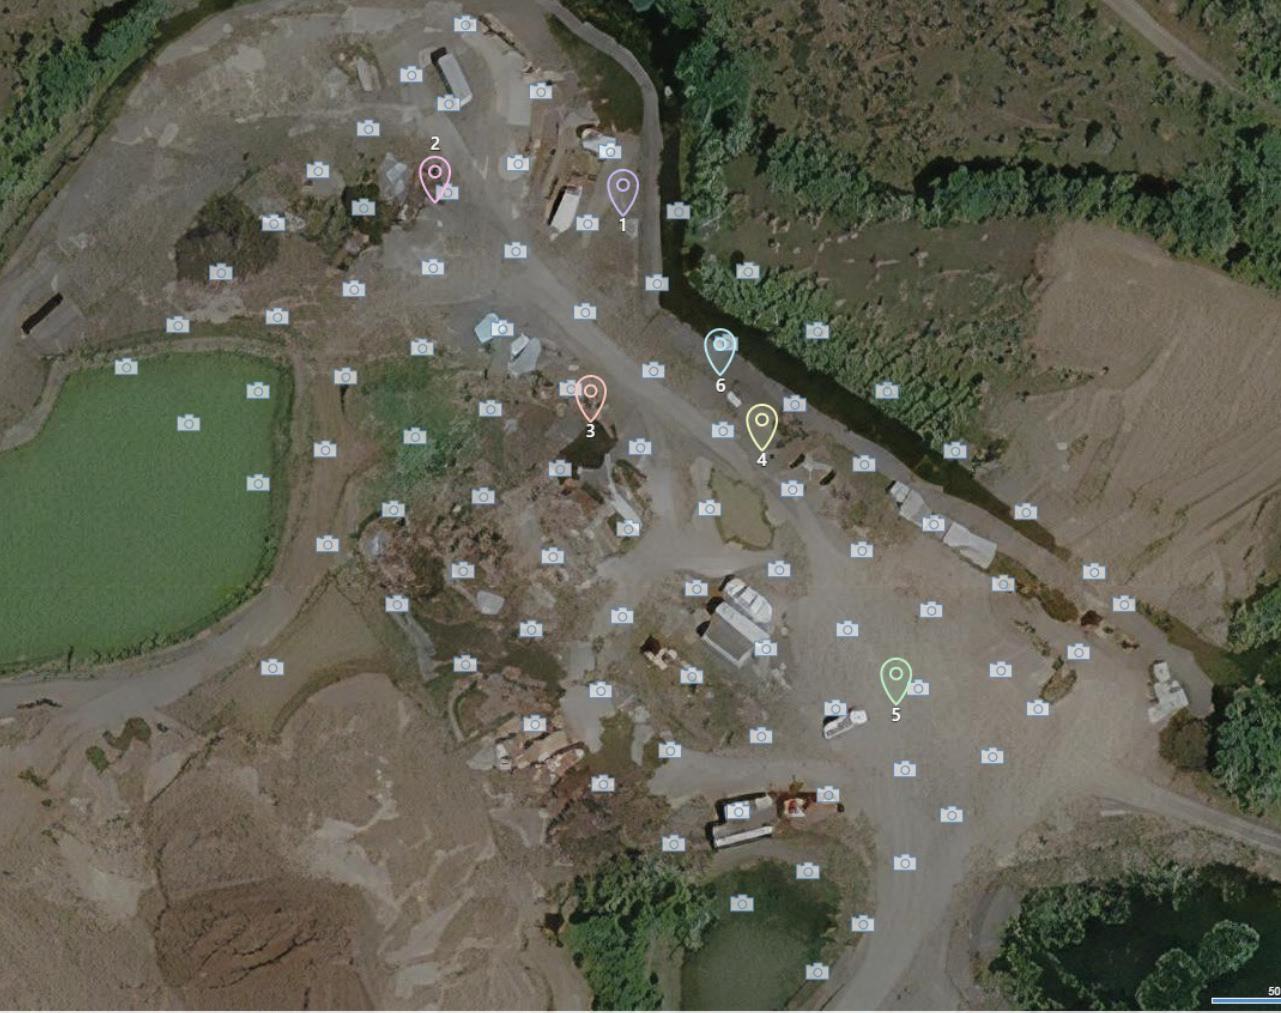
I collected six control points at the site. Recap Photo requires a minimum of three. While Propeller uses the AeroPoint and only requires a single point. It is important to label the ground control so that it is visible from the drones’ photographs. Labeling can be accomplished in a variety of methods some of which include targets and washable paint. When a drone is flying at north of 200’ Above Ground Level (AGL), ensure these points are large enough as they can get lost in the details of the terrain. After the ground control had been collected and locations targeted, it was time to fly. Recap Photo requires a minimum overlap of 60%. We captured photos at 80% overlap at 250’ AGL to stay on the safe side. In addition, all data was collected in a
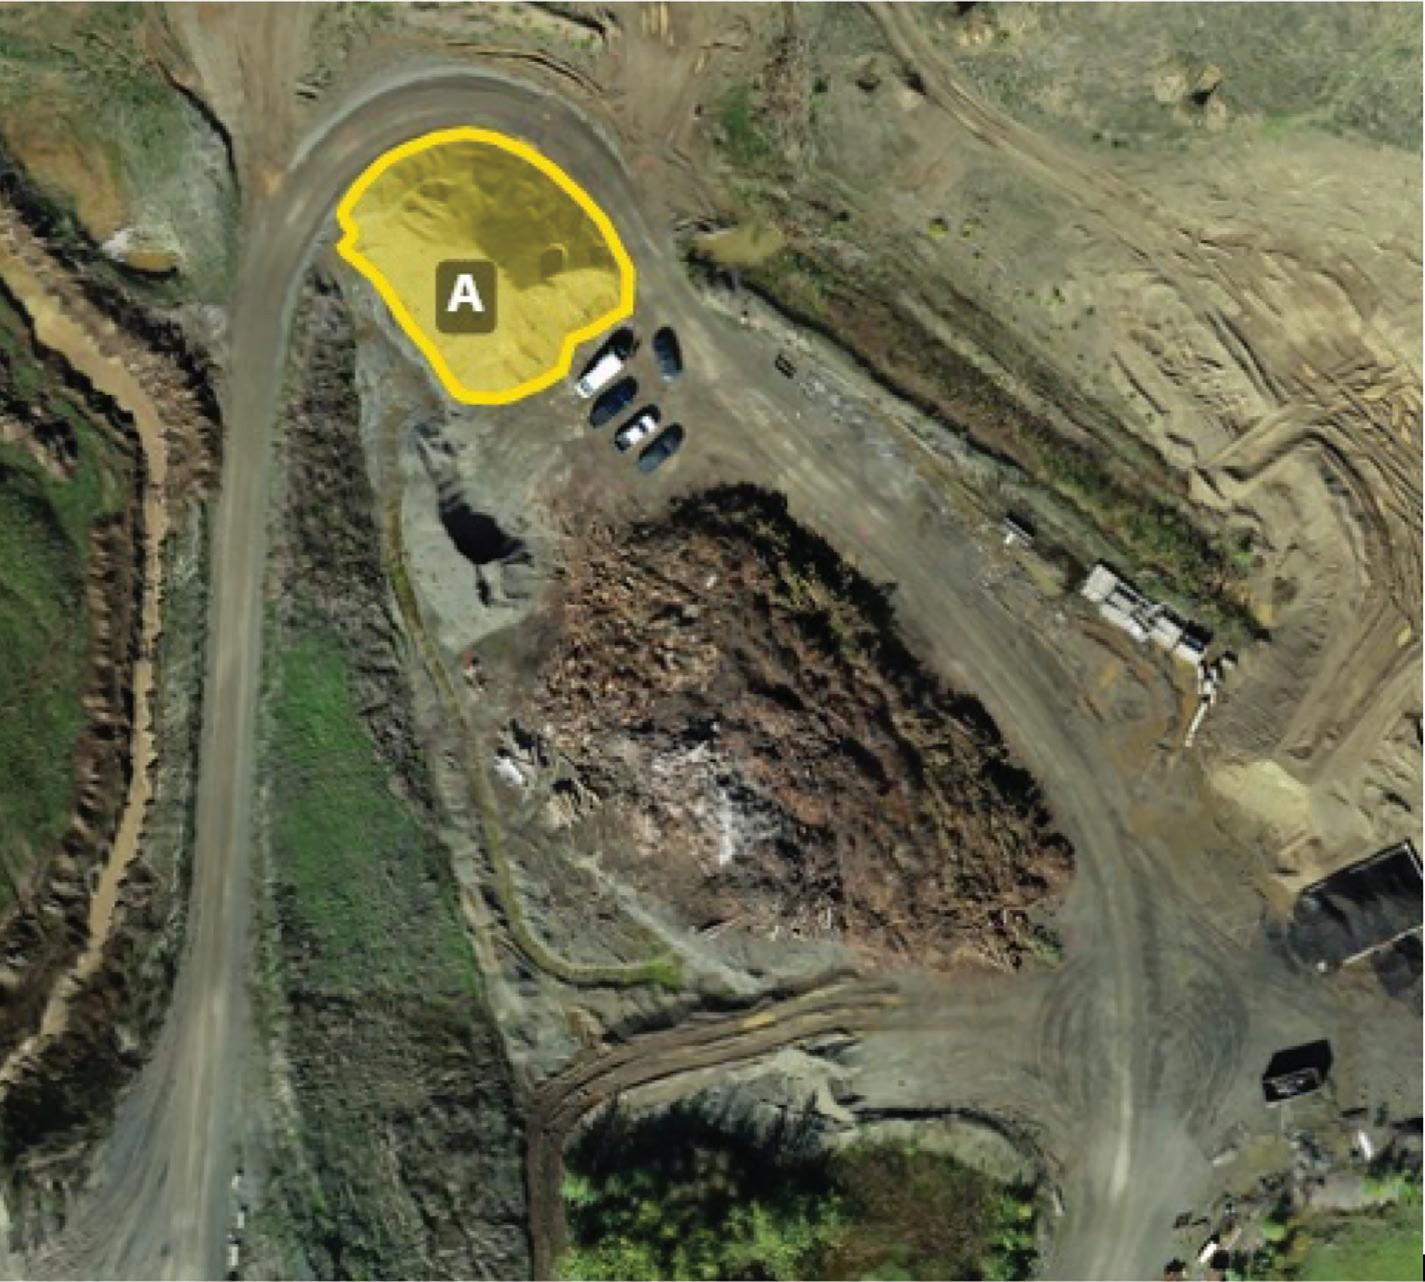
Figure 1: Site and Stockpile (A)
Figure 2: Photos & Ground Control
single flight to ensure the highest data collection quality. Using the DJI app, we set the following parameters and let the “birds” individually fly their respective 10-minute missions.
After collecting the photos, I did a quick photo quality check in the field before heading back to the office to process the data. My co-worker, Curtis, and I split the tasks; he would work on the propeller output, and I would do the Recap to Civil 3D output. Afterwards, we would compare our results. I was a bit jealous I drew the short end of the stick as you’ll find the Recap to Civil 3D workflow is a lot more labor intensive than Propeller.
RECAP PHOTO
In Recap Photo, we created an Aerial Project. Aerial projects have a maximum of 2000 photos and consumes 1 Cloud Credit per 50 photos. Each of these projects ranged from 90 to 150 photos. After adding the photos to the project, the ground control points (GCP’s) needs to be tied in with the respective photos. Recap requires a minimum of 3 GCP’s on 4 separate photos. The more photos the GCP is attached to the better the results.
After tying in our ground control data, it was time to submit the project for cloud processing. Before submitting, I inputted a project name, cloud drive location, requested outputs (RCM, RCS and TIF) and selected the desired coordinate system. Primarily, I am looking for the RCS file on the output as that contains the point cloud data. Establishing that correct coordinate system from the beginning is important as the rest of the software platforms need to follow suit.
You may notice the PPK/ RTK enabled photos option. This is a new feature in Recap 2022 where cloud processing will add more weight to the EXIF data of the photos increasing the accuracy.
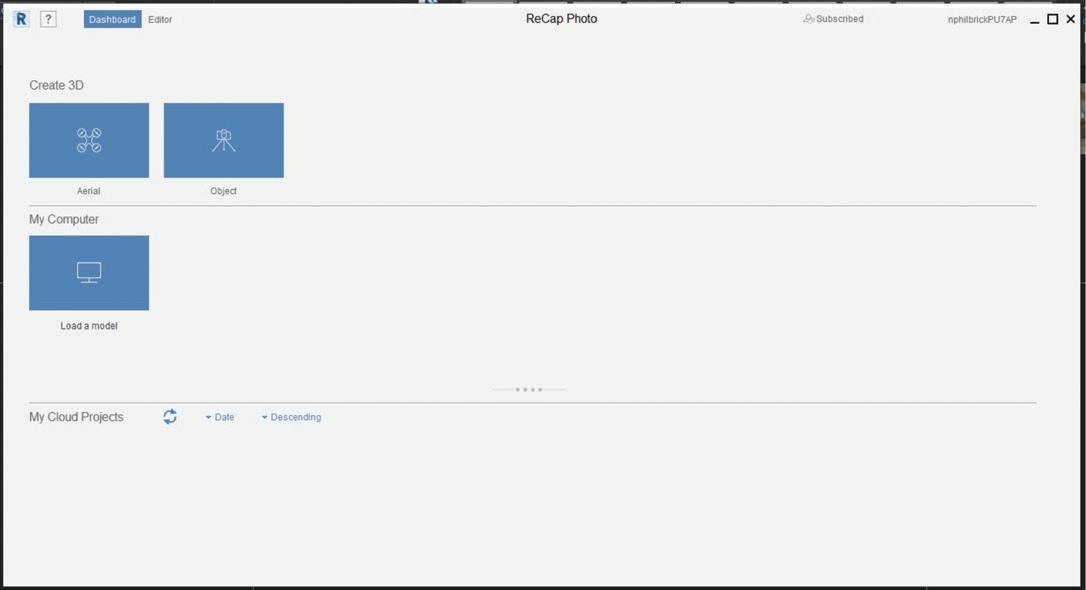
Figure 3: Aerial Project
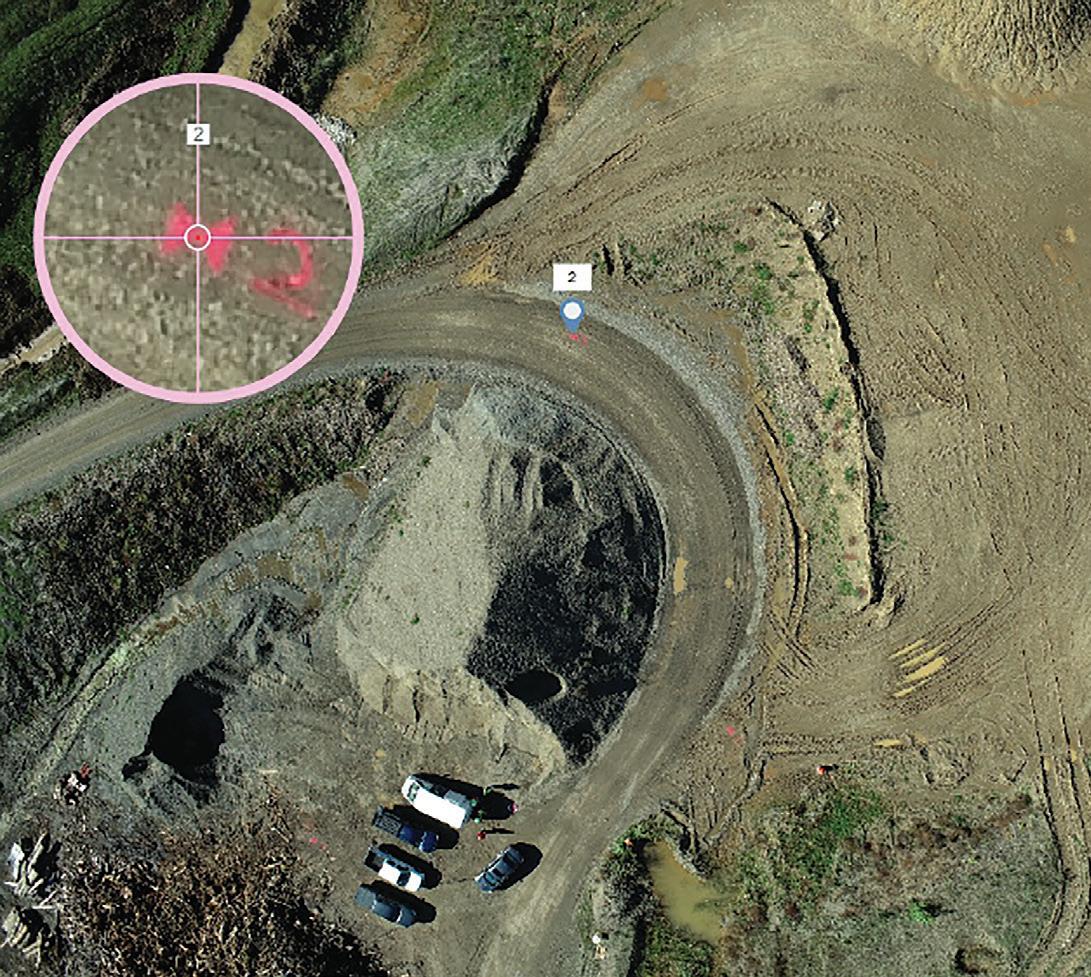
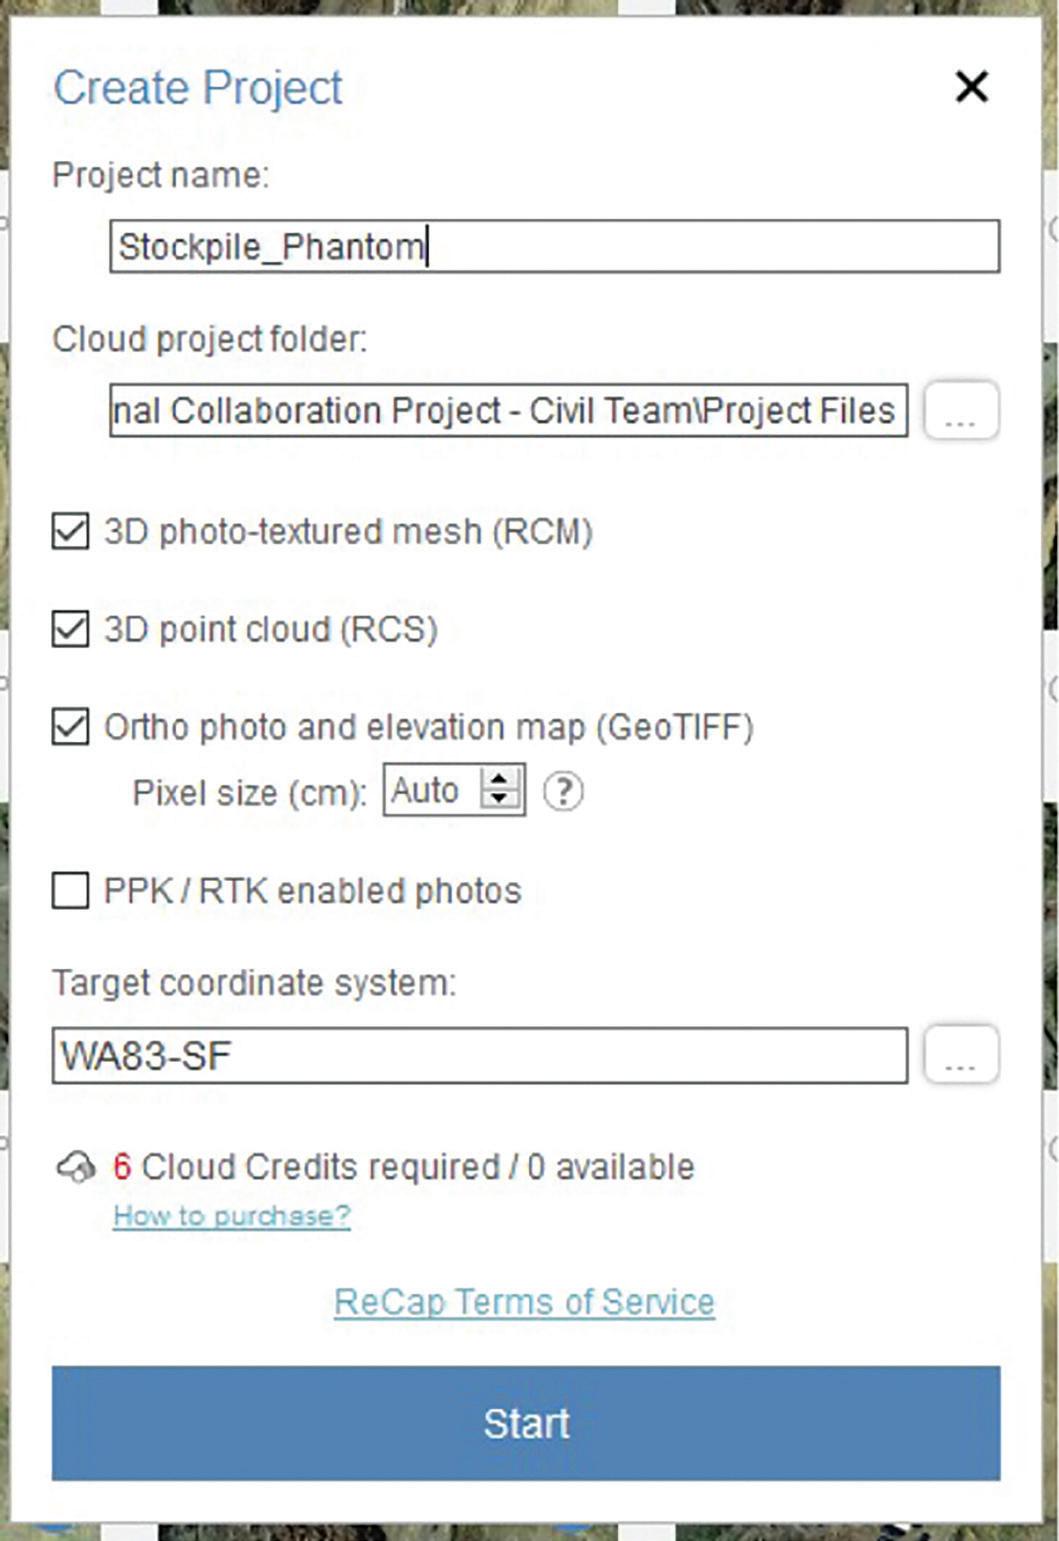
Figure 5: Create Project
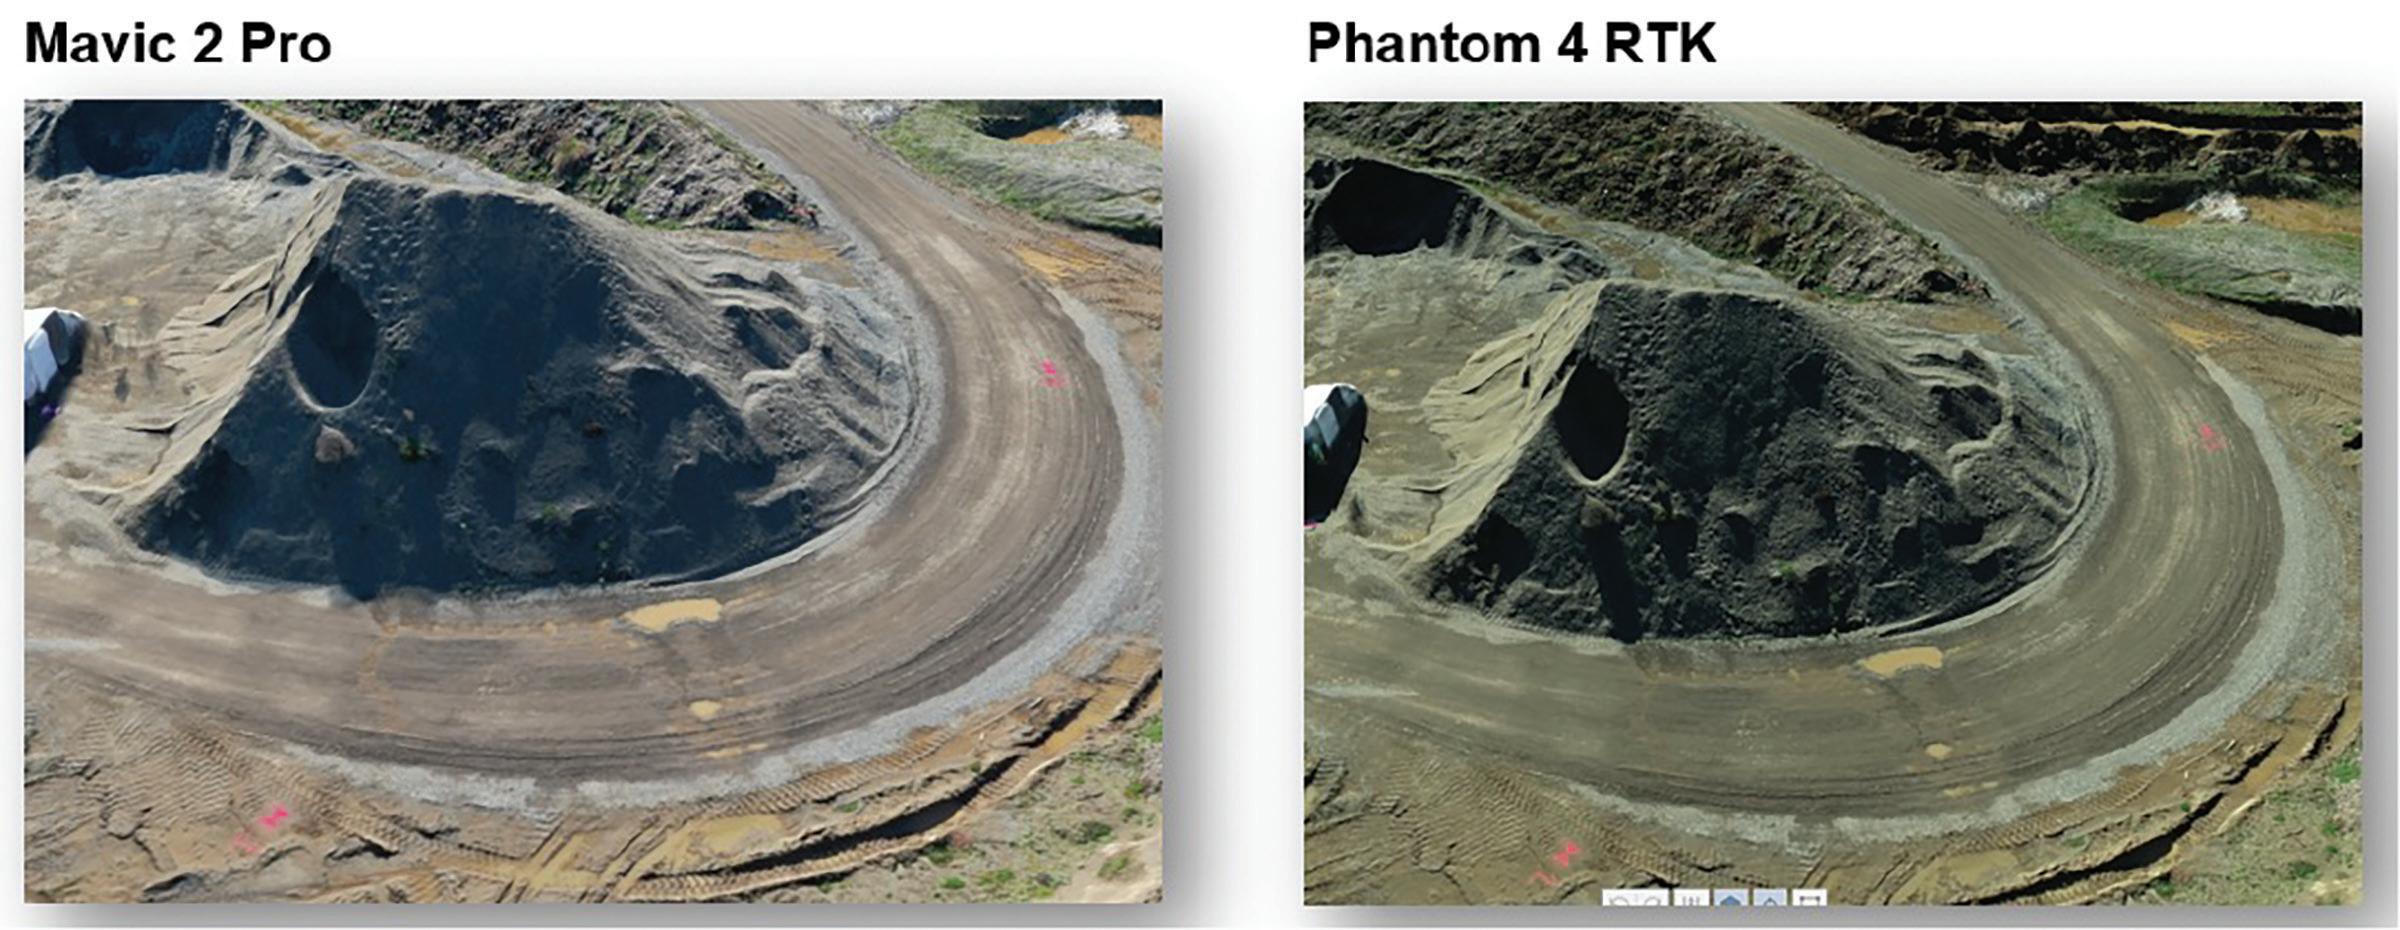
Figure 6: Recap Mesh File

Figure 7: Full Point Cloud
After a few hours, the project was ready to download. I cracked open the RCM (mesh) file in Recap Photo to have a look at the results. The mesh file mirrors the results of the RCS (point cloud) which was imported into Civil 3D.
RECAP PRO
Next step was to eliminate the extraneous data in Recap Pro. For most projects, this is generally optional. With the dense data from these point clouds, it is best to only carry what you are actively using.
In Recap Pro, I edited the full outputted point cloud to simplify the stockpile. Once I was satisfied with my edits, the point cloud was ready for Civil 3D. The point cloud can either be saved or exported out as a unified RCS file. Personally, I prefer the RCS as it eliminates the “attached” support folder which tags along with an RCP file.
CIVIL 3D
Now I am ready to bring attach the cleaned point cloud file in Civil 3D. Point clouds can carry thousands if not millions of points. As a rule, it is best to “weed” or “decimate” these points prior to bringing into Civil 3D. New workflows in InfraWorks and decimating in Recap minimize the number of points in Civil 3D. Since this stockpile is about only 100’ in diameter, I left all the points since I wanted
the most accurate volumetric calculation possible. With the point cloud attached, I created a surface from it, Pit Surface (Figure 9). Once I had the Pit Surface, I needed a base surface to compare it against. I extracted the border of the pit surface and created a base surface. I proceeded to compute the volume of the base and pit surface.
Looking back on it, it would have been advantageous to shoot control points around the pit (or at least at the toe). This would have allowed the base surface to be created from the points and not the extents of the Pit Surface. One of the important lessons of understanding the site. Next time!
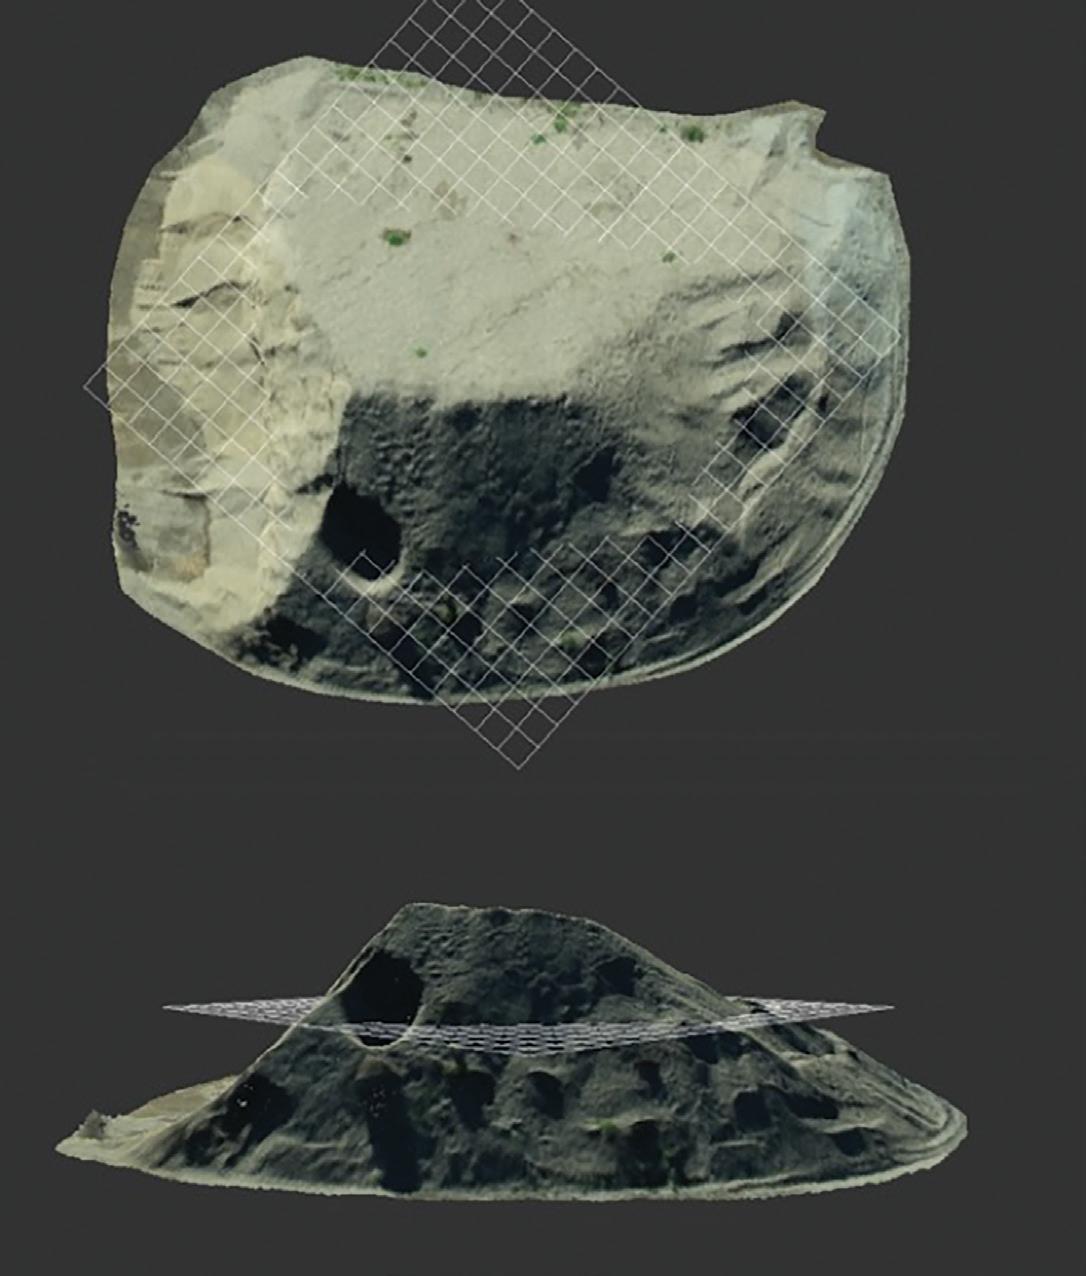
Figure 8: Edited Stockpile
COMPARISON OF RESULTS

The photo quality between the drones was similar. With identical cameras outside of the mechanical shutter for the Phantom 4 RTK, I would expect similar results. The mechanical shutter helps with quality when taking photos at a moving speed as opposed the Mavic 2 Pro which has a rolling shutter. It is interesting the Phantom 4 RTK’s photos are a shade darker even though these drones were flown within 20 minutes of each other on a cloudless day. Notice in figure 6, the outputted mesh also follows suit with the shading. In all, I give a slight edge to the Phantom 4’s results since the quality of the photos were better when flying at a moving speed. Theoretically if the Mavic 2 Pro stopped before taking each photograph, the quality would be identical.
Now let’s look at the volumetric results (Table 1). Curtis and I did not converse during this process so both of our results were unbiased!
Table 1: Summary of Results
Mavic 2 Pro Flight 1 Mavic 2 Pro Flight 2 DJI Phantom 4 RTK Autodesk: ReCap to Civil 3D # Of Photos # Of Points Pit Volume (cu. yd.)
97 520,000 2025
172 627,000 1985
88 479,000 1980
Propeller
Origin # Of Photos # Of Points Pit Volume (cu. yd.)
Mavic 2 Pro Flight 1 DJI Phantom 4 RTK 97
88 520,000 2025
N/A 1930
Overall, we were satisfied with the results. The estimated Pit Volume was within 100 cu. yd. for all
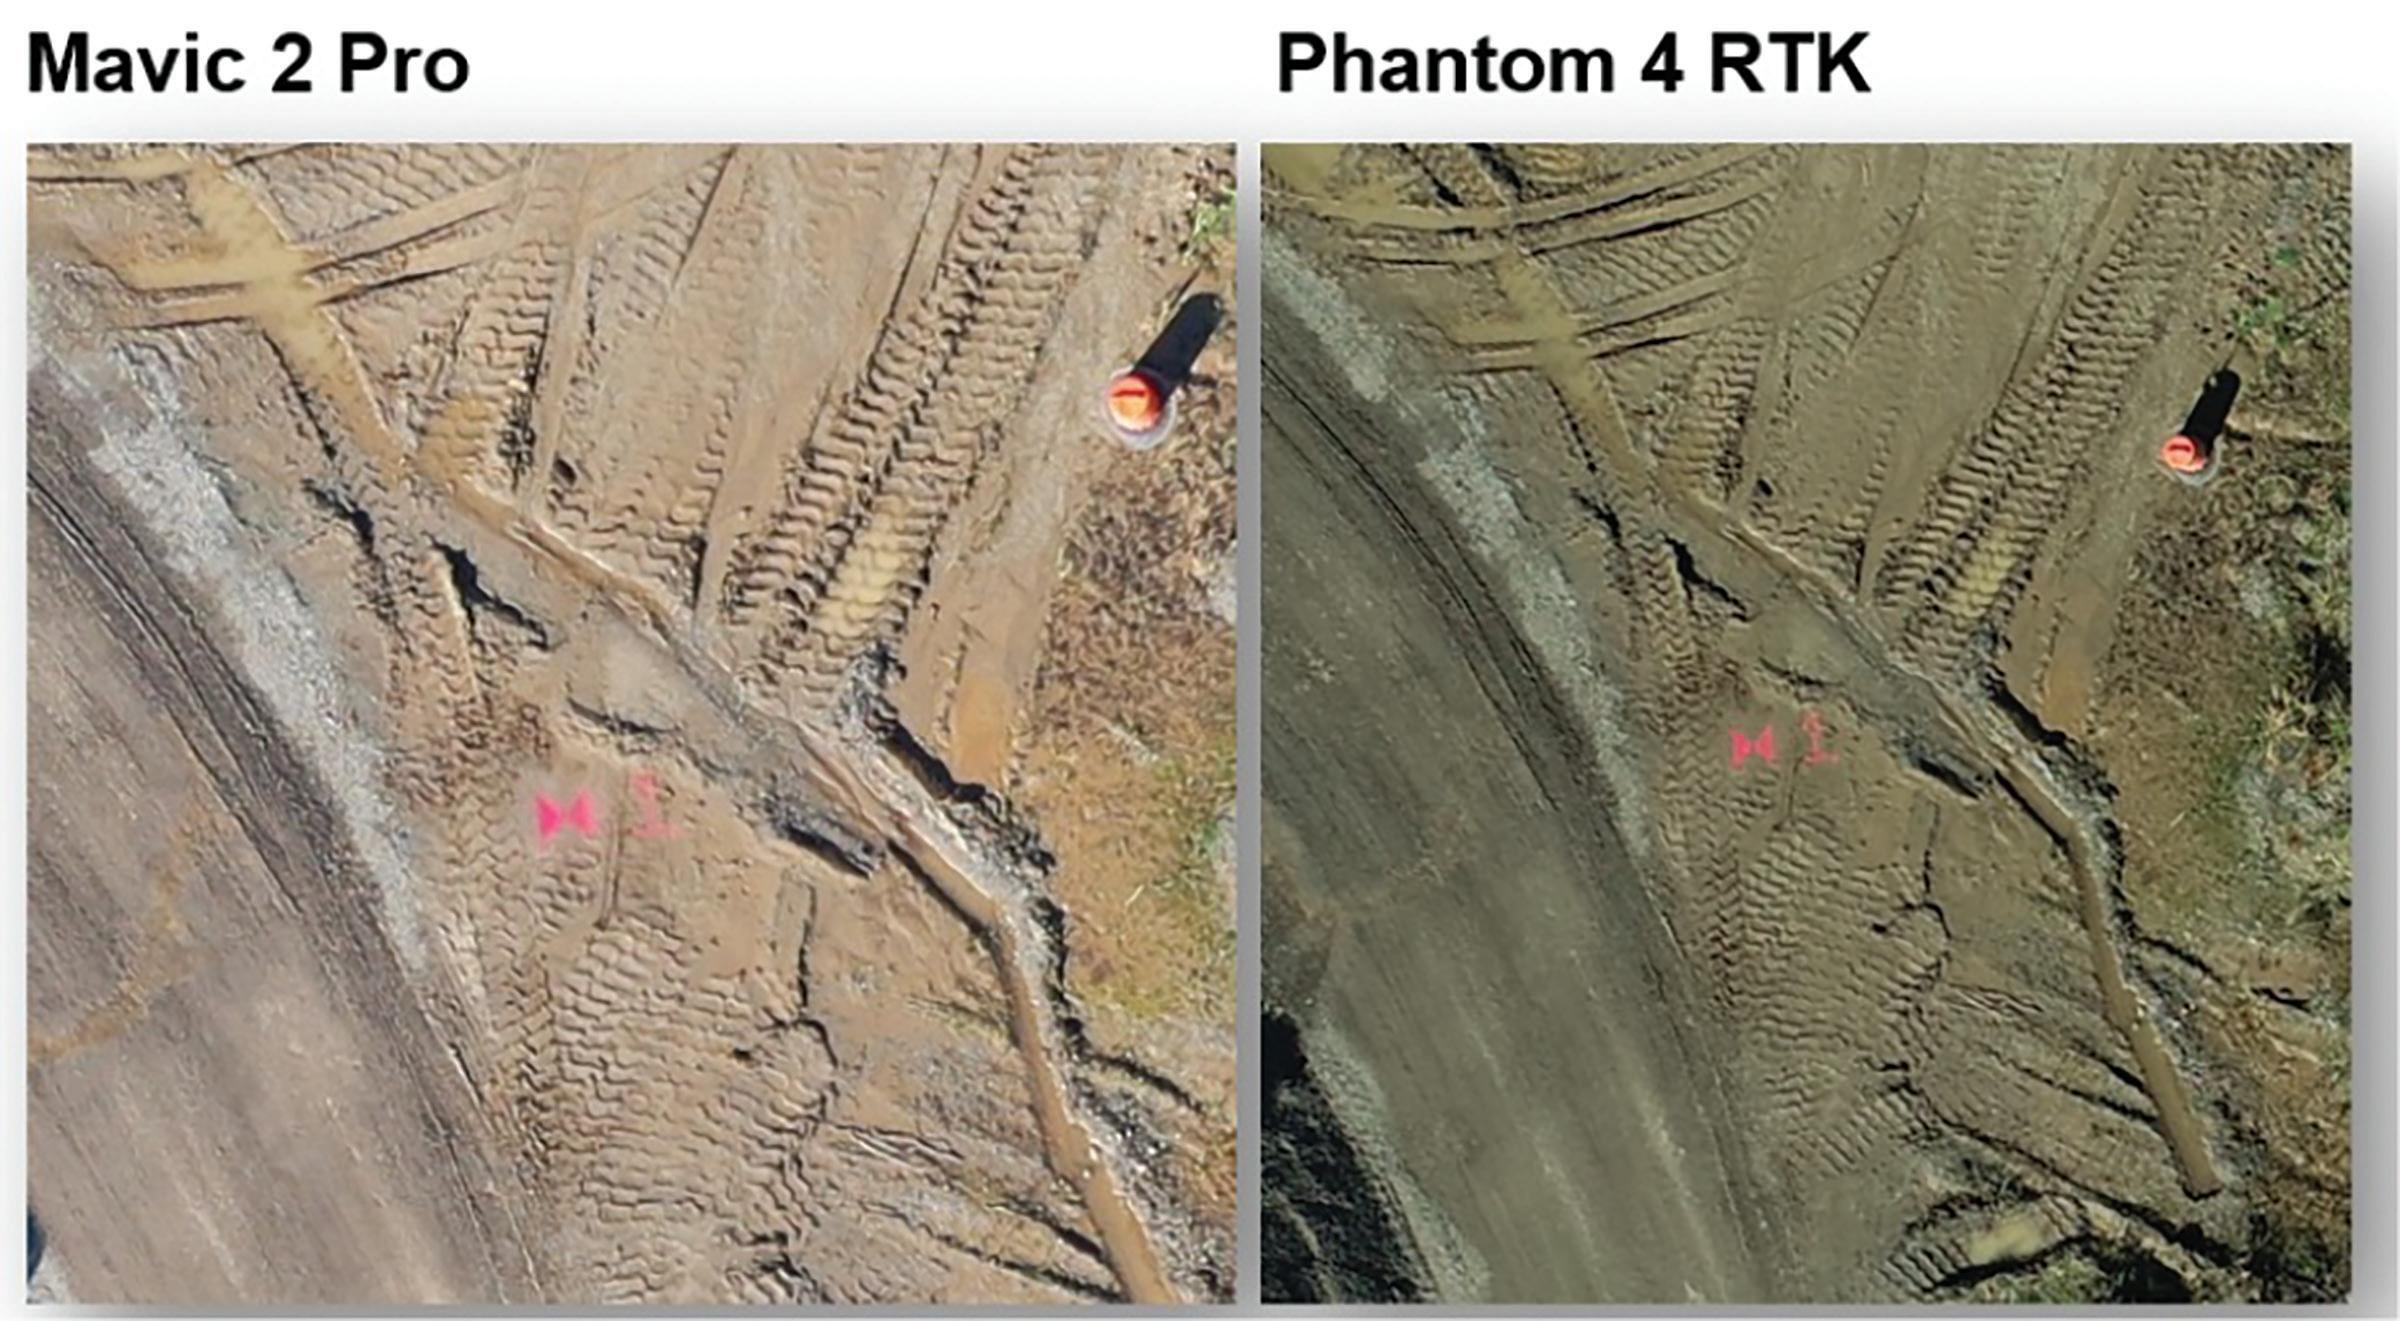
Figure 10: Photo Quality
four flights. An interesting result is the relationship between the number of photos captured and the number of points created in the outputted point cloud. Comparing the first and second flights of the Mavic 2 Pro, we see more than 100,000 more points added to the point cloud file for the same area. While it is logical to see more points with more pictures, I was surprised to see the number of points increase that much. If you are chasing high levels of detail, take more photos.
Using the Autodesk platform, the results from the drones are similar. Phantom 4 RTK has better location accuracy than the Mavic 2 Pro. The Mavic 2 Pro has a consumer grade GPS (think of your iPhone maps navigation). On the other hand, the Phantom has RTK accuracy. This means the drone has a better idea of the X, Y and Z data of the photos. Yet, with quality GCP data, we are seeing similar results with both drones.
With RTK enablement in ReCap Photo, you will get better results when processing projects without GCP data. The photos know where they are in relation to each other. You will also get better results with fewer GCP’s. For example, some cases you may only need three GCP’s for the Phantom 4 RTK and six for the Mavic 2 Pro. With Autodesk products, the quality of the result is most dependent on the quality of the photos and accurate, well collected GCP data.
So, now you may ask if the Mavic 2 Pro and Phantom 4 RTK results are only 5 cu. yd. different, what’s the incentive on the price tag of the Phantom 4 RTK? The key is efficiency.
Using the propeller platform, you only need a single Ground Control Point. This makes it much faster to survey a site. It is also a lot easier if you don’t have access to certain regions of it. This is a great platform if you are planning to survey a lot of sites or frequently survey the same sites. You also don’t need to tie in the ground control data to the photos afterwards. That is all done with the AeroPoint; simply uploading the control data for the AeroPoint and the photos produces the result.
Nate Philbrick is an application engineer at Topcon Solutions Store in Portland, OR. He is an Autodesk Certified Professional for Civil 3D as well as a Part 107 Drone Certified Pilot. Nate grew up in a small New England town called Henniker, NH (kudos if you recognize from the Civil 3D realm). He attended the University of New Hampshire and earned a B.S. in Civil engineering followed by my MBA. After school, he worked in the consulting world in New England focusing on wastewater projects. Following that experience, Nate took off for the west coast, Portland, OR, and worked at Autodesk as an infrastructure specialist focusing on Civil 3D, InfraWorks and ReCap. In his free time you can find him skiing, mountain biking and whitewater kayaking in the Pacific Northwest.


