12 minute read
Why Grandparents are Important
Breeding the blood or breeding for EBVs are the two things related and can genomic information be beneficial for both.
Progeny relatedness to parents
It might be stating the obvious, but each individual calf gets 100% of its genetic material from its parents, 50% from the cow and 50% from the bull. Which 50% the calf inherits from each parent differs for each full sibling (brother or sister), resulting in genetic diversity between full siblings.
Although full siblings are 100% related by pedigree (they have the same sire and dam), they are only, on average, 50% related by genetic content. Each animal gets a different combination of genes from its parents. It occurs when the sperm and egg are created in each parent, producing a sample of 50% of each of its parents’ full genomes. The chromosome pairs are reformed during fertilisation with new combinations of each parent’s DNA. The resulting progeny will have different random combinations of each parent’s DNA.
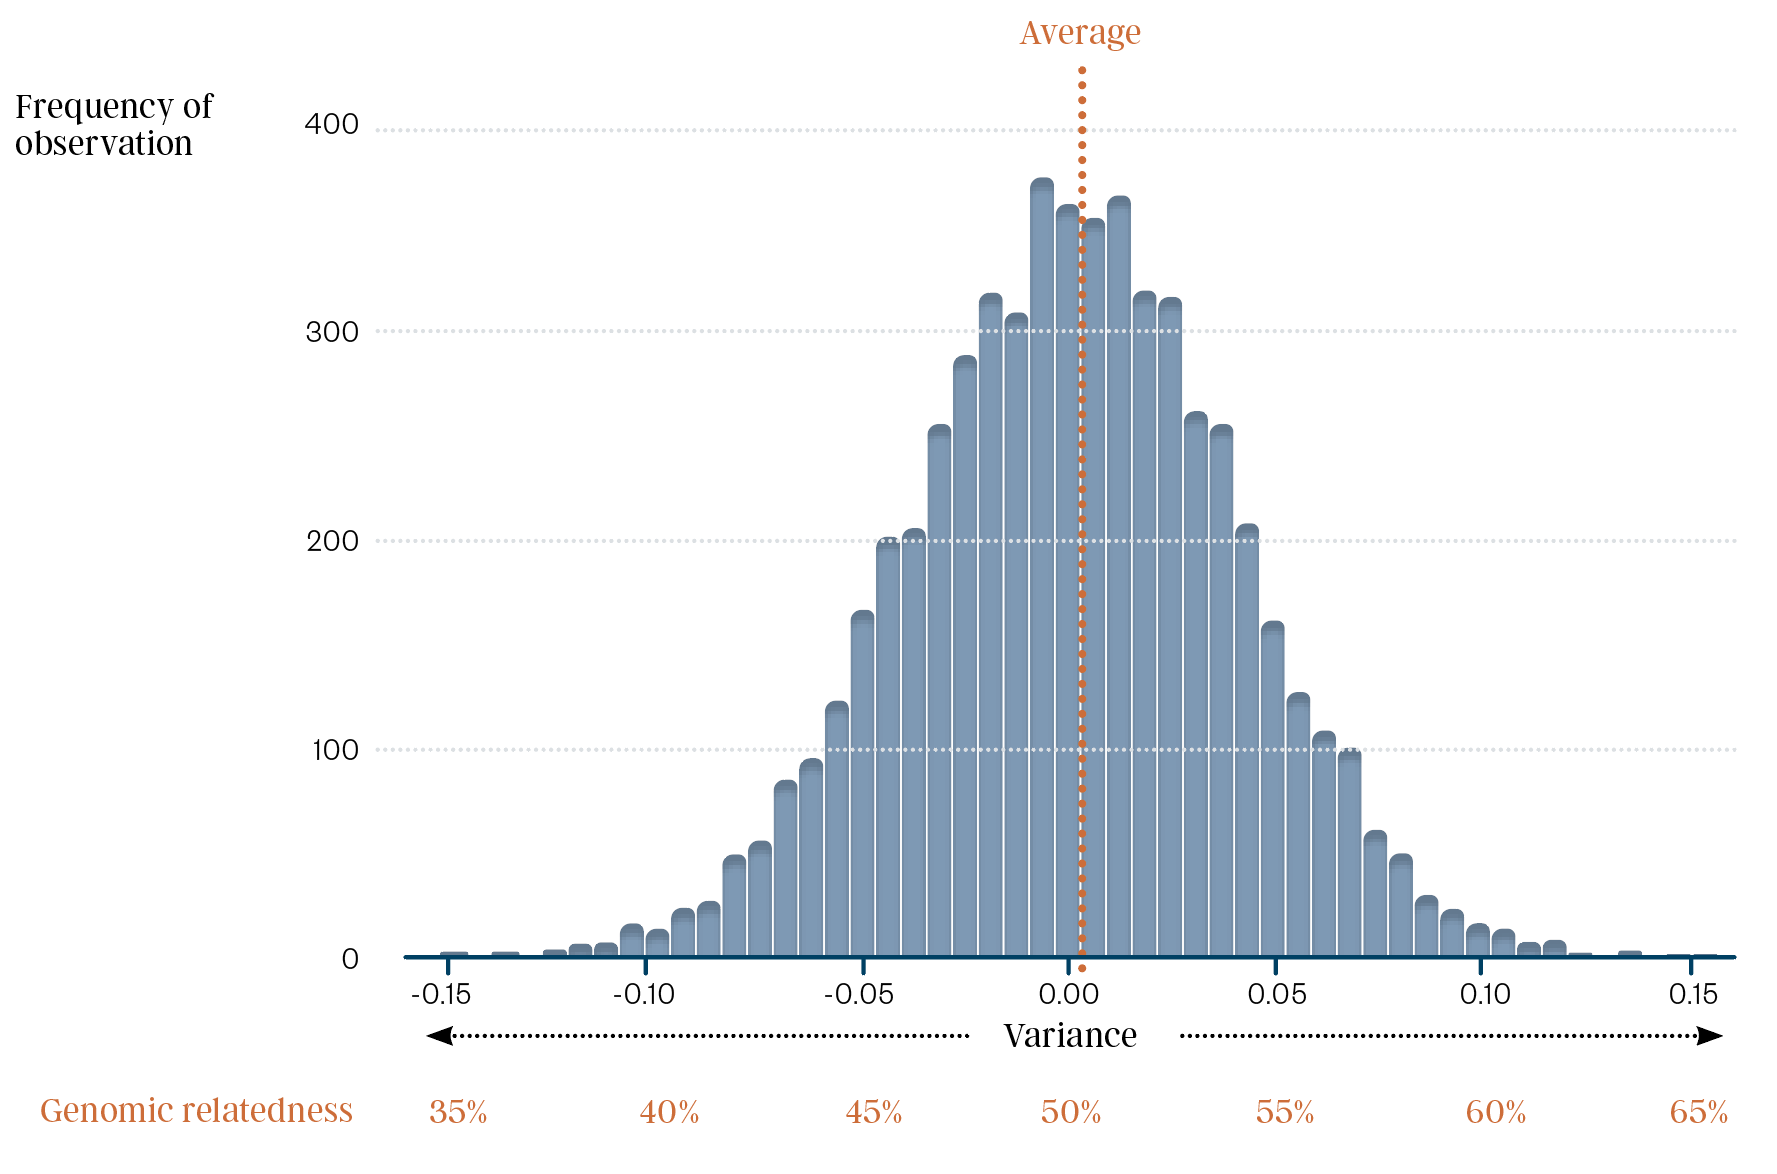
While full siblings will, on average, share 50% DNA with each other (50% genomic relatedness), the randomness allocation of genetic material in forming the sperm and egg means that the relatedness of full siblings varies greatly. Full siblings can be as low as 35% related or as much as 65% related at a genomic level.
The below figure is adapted from a recent scientific article from David Kenny and co-authors (2023) published in the Genetics Selection Evolution Journal, Volume 55, article 27. It shows that the genomic relatedness between full siblings in a cattle population can vary between 35% and 65%, with the average relatedness being 50%.
Progeny relatedness to grandparents
Taking this one step further, each parent has two of its own parents (the grandparents of the calf), from which each parent received its' genetic material. So, each calf gets 50% of its DNA from its paternal grandparents and 50% of its DNA from its maternal grandparents.
By sampling the parents' DNA in making the sexual gametes (the sperm and egg), the relative contribution of each of the grandparents can vary quite significantly. Through a process called Mendelian sampling, different segments of each parent's chromosomes are selected into unique new chromosome arrangements in the sperm and egg. This involves recombination and independent sorting of each parent's chromosomes to generate the random sample of 50% of each parent's genome in each sperm and egg.
On average, a calf will inherit 25% of its DNA from each grandparent. But the contribution of each grandparent can vary from below 20% to more than 30%. An example of the independent sampling of grandparent genetic information to form different full siblings is shown in figure 2. Blue and grey chromosome segments are inherited from the father, and pink and yellow chromosome segments are inherited from the mother.
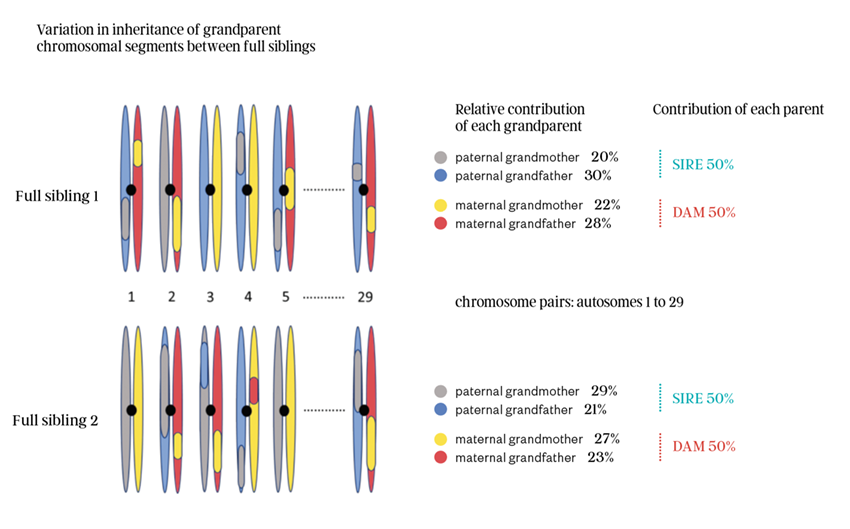
As depicted in figure 2, full siblings can receive very different segments of paternal and maternal DNA. Comparing the two siblings, this can range from as low as 20% to above 30% for each paternal grandparent, with the combined paternal (sire) DNA contribution being 50% of the calf’s DNA. The same difference in the relative proportion of maternal grandparent DNA can occur, ranging from below 20% to above 30%, with the combined maternal (Dam) DNA contribution being 50% of the calf’s DNA.
Comparing the full sibling calves in figure 2, the blue and grey chromosome halves (chromatids) are the inherited genetic material from the father. The relative proportion of paternal grandfather DNA in sibling 1 is much higher than in sibling 2. Visa versa, looking at the pink and yellow maternal chromosome halves, the contribution of the maternal grandmother is much higher in sibling 2 compared to sibling 1.
This independent assortment of chromosomal segments and the resulting impact on genetic diversity between full siblings gives rise to the variation in genomic relatedness between full siblings shown in figure 1.
Impact of genetic diversity between full siblings on linebreeding. Understanding the genetic diversity between full sibling calves and the variation in sampling of genes from the grandparents has a large impact on line-breeding in Wagyu. If the purpose of line-breeding is to conserve desired genetics from one generation to another, variation in the contribution of grandparent DNA to the progeny of between 20% and 30% for each grandparent can have significant impacts on success. For example, if the same cow is the grandmother of both the sire and dam, the range in genetic contribution of that grandmother to the calf is between 40% and 60% of the calf’s full genome.
Genetic variation comes from parents and grandparents
The Mendelian sampling of DNA that occurs when sperm and eggs are formed means that different segments of the grandparent DNA are combined to make new genomes in full siblings. So, when different calves are born from the same parents, the relative contribution of genomic DNA from each grandparent can vary greatly, meaning that the relatedness of the calves to each other will also vary. No two calves will share exactly the same DNA unless they are identical twins formed by the splitting of an embryo.
As mentioned in the prior section, during the process of creating sperm and egg cells (the sexual gametes), chromosomes from each parent undergo recombination, which can shuffle and exchange genetic material between homologous chromosome segments. This process can create new combinations of gene variants, leading to further genetic diversity in the progeny.
The mixing of parent chromosomal segments and recombination of the DNA in the formation of the calf’s genome will mean that each calf will have different gene variant combinations that were not present in the parents or in the grandparents.
Some calves may inherit new combinations of gene variants that are advantageous for a trait, while others may inherit combinations of gene variants that are detrimental to trait performance for any given trait.
This is another reason a calf's trait performance or Estimated Breeding Values (EBVs) can exceed its parents or grandparents. Likewise, a calf may have lower genetic merit than its parents or grandparents for any trait.
A story of 48 full siblings
In looking through the Australian Wagyu Association (AWA) database, we came across one example where a breeder had flushed one of their favourite cows to the same sire several times and has registered 48 full siblings with genomics.
The cow is Westvale Teruchika LOCFZ0505, owned by long-time Wagyu breeder Michael Lockwood of Coldwood Wagyu at Deepwater NSW. Michael’s family joined the AWA in 2001 under the LOC Westvale Wagyu membership (Trevor and Liz Lockwood), which celebrates its 22nd year of membership with the AWA in 2023. Michael took over the family partnership in 2012 and created a second MJL Coldwood Wagyu membership. Michael now runs a large commercial embryo calf-raising operation through his Coldwood Pastoral business.
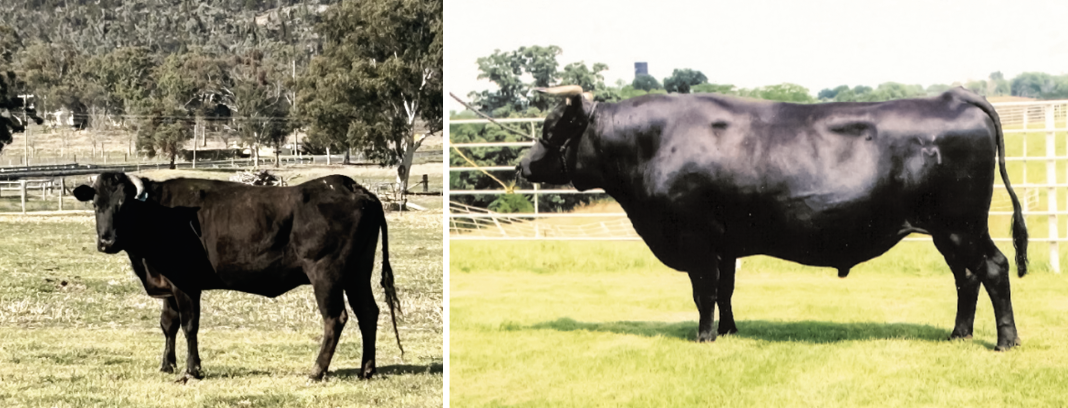
Westvale Teruchika LOCFZ0505 was born in 2004 and now has 73 progeny of her own registered with the AWA (48 have genomics) see figure 3. Her first recorded natural calf was LOCFD0803, registered in 2008. She was identified early on as producing outstanding feeder steer progeny when crossed to the well-known foundation sire Michifuku WKSFM0164 and finished through the Macquarie Wagyu feedlot. Her early steer progeny all grading AUS-MEAT marble score 9 with good carcase weight. Her first 6 Michifuku-sired embryo calves were born in 2011, with 42 more born over the next ten years.
Westvale Turuchika is still alive and well. She is 19 years old, has produced multiple natural calves within her recorded 73 progeny and is still part of the Coldwood Wagyu breeding herd. This cow is one of Michaels’ favourite breeding females. She will be used again in the Coldwood Wagyu artificial breeding program in late 2023.
We can compare the registered 48 full sibling embryo calves with genomic DNA profiles recorded with the AWA from the LOCFZ0505 x WKSFM0142 joining to compare their relatedness at the genomic level. Figure 4 (see page 25) is a heat map that shows the genomic relatedness of each of the 48 full siblings with each other.
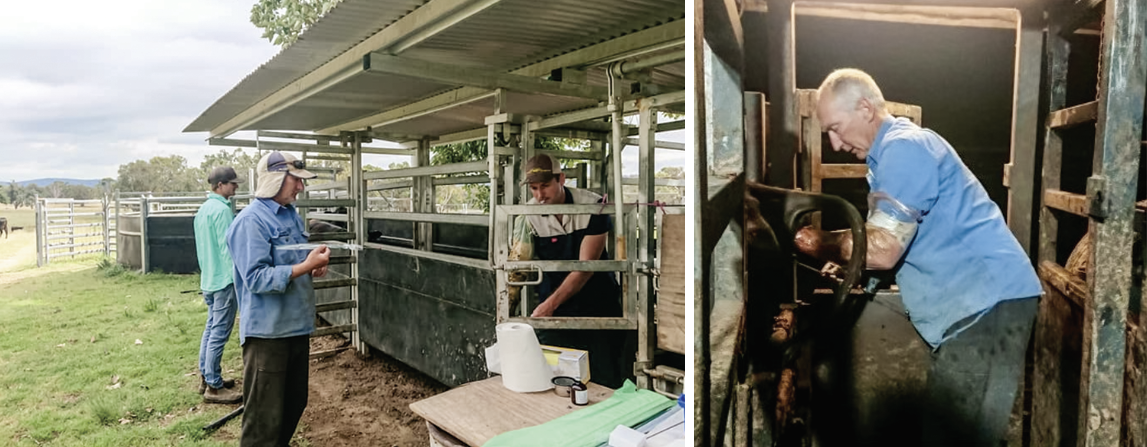
Figure 3 Michifuku WKSFM0164 (right) is one of the AWA Foundation sires, he has 48 recorded progeny with LOCFZ0505 that have genomic DNA profiles recorded with the AWA.
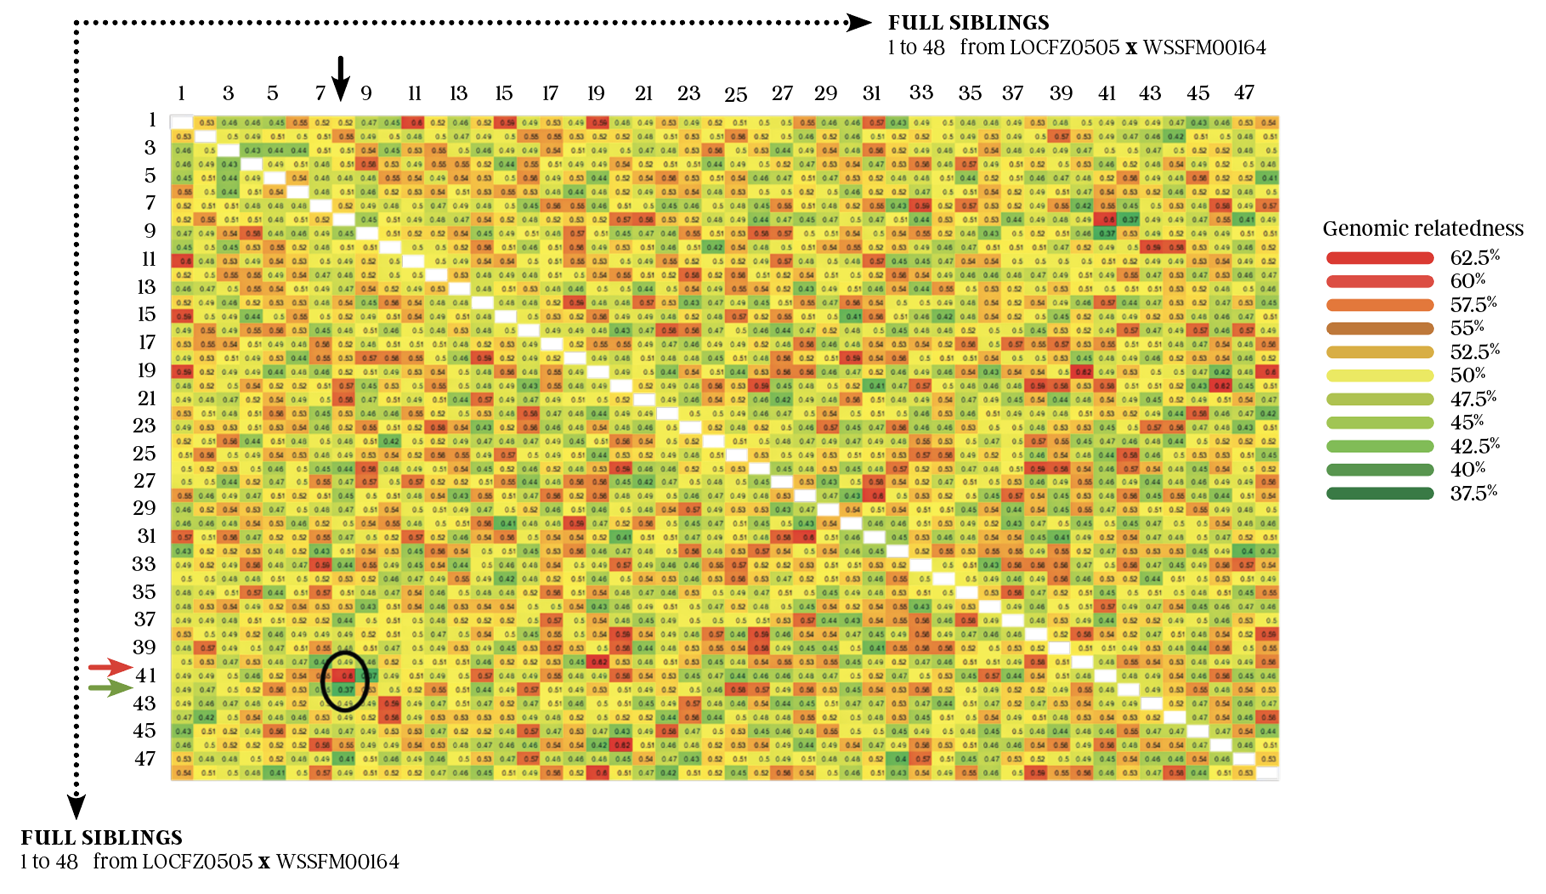
The first thing to notice about the heat map in figure 4 is that the colour code spans from red (62.5% = high genomic relatedness) down to deep green (37.5% = low genomic relatedness). The second thing to notice is that there is a great range in diversity between the full siblings, with no observable or predictable trend across the siblings other than the huge range in relatedness between individuals.
The white diagonal line through the middle of figure 4 is the relationship between each sibling and itself, which is 100% and has been coloured white. Each side of the white diagonal white line is a mirror image of the other side.
Figure 4 is a real example of using Wagyu data in a Wagyu full sibling population to demonstrate the creation of genetic diversity through the Mendelian sampling and recombination process in sexual reproduction. If you were looking to identify animals more closely related to each other without using genomics, you could have no confidence in identifying more genetically similar siblings. In other words, there is no other way to determine the “real” genetic differences between full sibs except through genomic analysis.
For the purpose of line-breeding, if the principle of the exercise were to enrich the genetics of a particular grandparent, it would be helpful to identify the male and female progeny that had the highest genomic relatedness to that grandparent using an approach similar to that used in figure 4.
As a specific example of genetic diversity between siblings, if you identify sibling eight on the top axis (black arrow) and follow it down to determine its relatedness with sibling 41 (red arrow), you can see that these two siblings share 60% genomic information with each other. They share high similarity and relatedness at the DNA level. The relatedness of sibling 8 with the next sibling, sibling 42 (green arrow), is much lower, at 37.5% genomic relatedness. They share relatively low similarity and relatedness at the DNA level.
Genetic diversity in trait performance between
48 full siblings
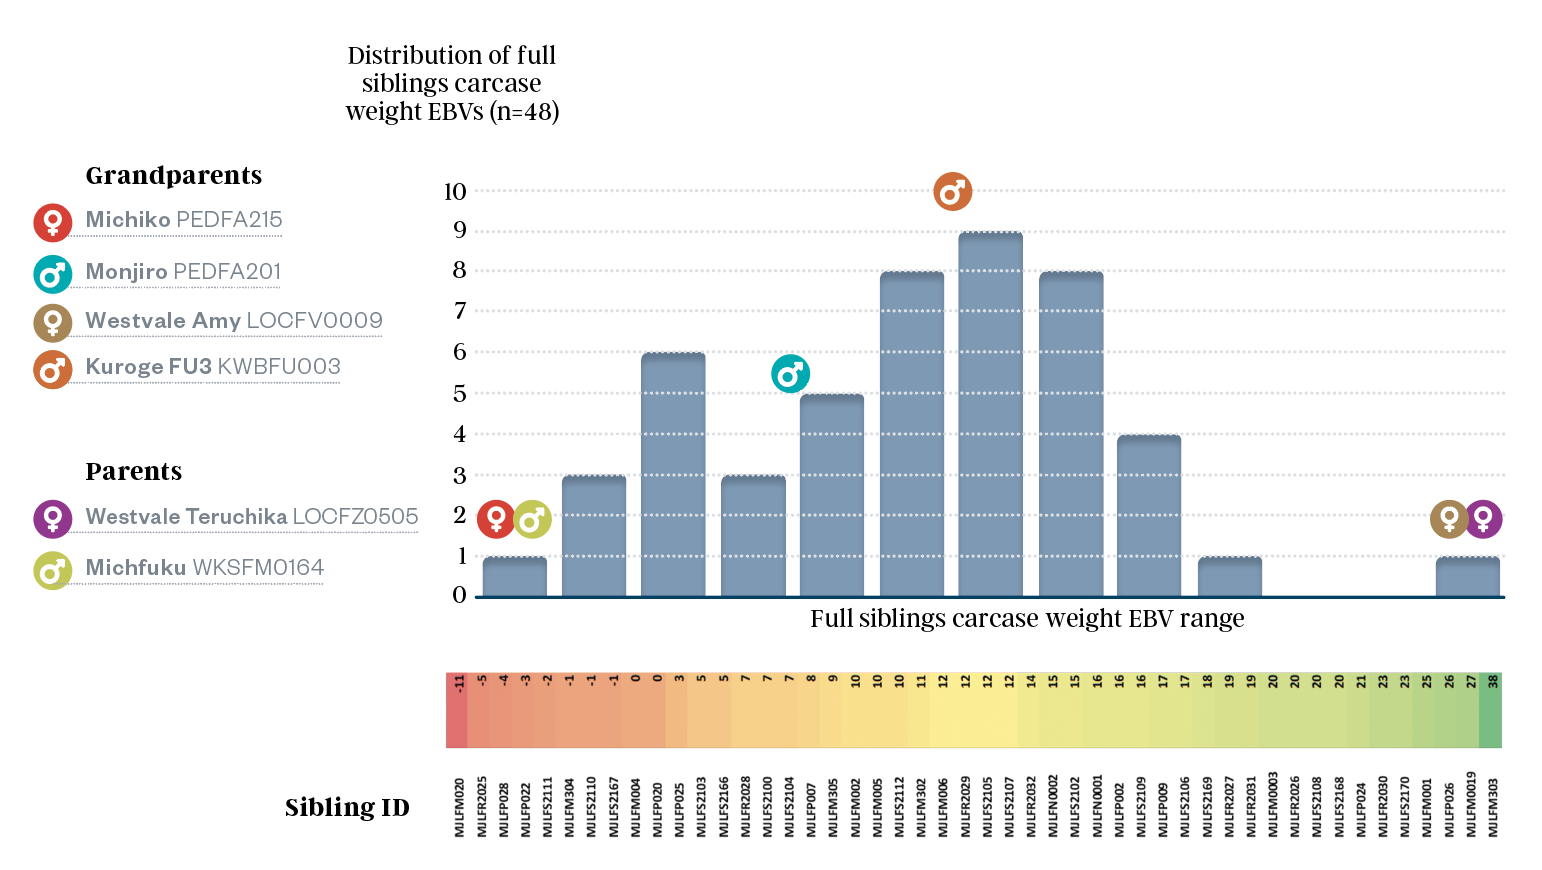
This genetic diversity between full siblings manifests in different genetic merit for production traits in Wagyu cattle. Using the Carcase Weight (CWT) EBV as an example, figure 5 shows the range in EBVs of 48 full sibling progeny of LOCFZ0505 x WKSFM0142 (colour scale from low (red) to high (green)) at the bottom of the blue distribution graph. These EBVs can be compared to their parents and grandparents' EBVs, which align with the coloured arrows and names at the top of figure 5.
Figure 5 shows an extreme range in the CWT EBVs of the 48 Full siblings, ranging from -11 to +38. This full range expresses the variation in the grandparents.
In breeding Wagyu cattle for production phenotype performance, before genomics in Wagyu BREEDPLAN, all progeny of LOCFZ0505 x WKSFM0142 would have had their genetic merit estimated at a mid-parent EBV of +14. This estimate would roughly represent the midpoint of the blue bar distribution graph in figure 5. Still, it would need to recognise the true genetic range of the 48 full siblings.
The future of genetic diversity in Wagyu
The AWA now has over 200,000 genomic profiles for Wagyu cattle. We are investigating ways to use this genomic information to assist breeders in identifying high-performing animals for a range of traits and identifying more genetically diverse and less inbred animals to breed from. Using genomic and pedigree information on Wagyu cattle worldwide, we aim to develop new tools to assist breeders in identifying ideal genetics to manage their genetic diversity and trait improvement programs.
Important notice on SNP DNA testing
SNP 500 is not genomic DNA testing.
Of note for all breeders: if you use SNP500 for parentage verification of your progeny, SNP 500 is not a genomic SNP test. The SNP 500 test only uses 500 SNP markers to determine parentage. If you purchase SNP 500 tests, the data can only be used for parentage testing and has no future value for any other purpose.
Genomic SNP tests cost slightly more than SNP 500 tests but provide data on between 50,000 and 100,000 SNP markers to determine whole genome relationships. The data from this SNP test can be used repeatedly for parentage and genomics testing in BREEDPLAN and, in the future, any number of value-added tools like genomic relatedness, genetic diversity and genomic inbreeding. The AWA is currently working on these solutions for Wagyu breeders. Animals tested on SNP 500 will not benefit from new future genomic tools that will be important to Wagyu breeders. Genomic DNA testing is an investment in your future breeding herd. SNP 500 testing is a cost for parentage only.


