
Unit
The Geographer’s World
Introduction 4 Lesson 1 10
The Tools of Geography How do geographers show information on maps?
Lesson 2 24
A Spatial Way of Thinking Why do geographers use a variety of maps to represent the world?
Contents
1
Unit
Canada and the United States
Introducing the Region: Physical and Human Geography 42
Lesson 3 50
Settlement Patterns and Ways of Life in Canada
How does where you live influence how you live?
Lesson 4 64
The Great Lakes: The U.S. and Canada’s Freshwater Treasures How can people best use and protect Earth’s freshwater ecosystems?
Lesson 5 78
Urban Sprawl in North America: Where Will It End? How does urban sprawl affect people and the planet?
Lesson 6 92
National Parks: Saving the Natural Heritage of the U.S. and Canada What features make national parks special and worth preserving?

Lesson 7 106
Consumption Patterns in the United States: The Impact of Living Well
How do American consumption patterns affect people and the planet?
Lesson 8 118
Migration to the United States: The Impact on People and Places
How does migration affect the lives of people and the character of places?
2
Unit
Latin America
Introducing the Region: Physical and Human Geography 132
Lesson 9 140
Spatial Inequality in Mexico City: From Shacks to Skyscrapers Why does spatial inequality exist in urban areas?
Lesson 10 150 Indigenous Cultures: The Survival of the Maya of Mesoamerica How do indigenous peoples preserve their traditional culture while adapting to modern life?
Lesson 11 162
Dealing with Extreme Weather: Hurricanes in the Caribbean
What causes extreme weather, and how do people deal with it?
Lesson 12 176
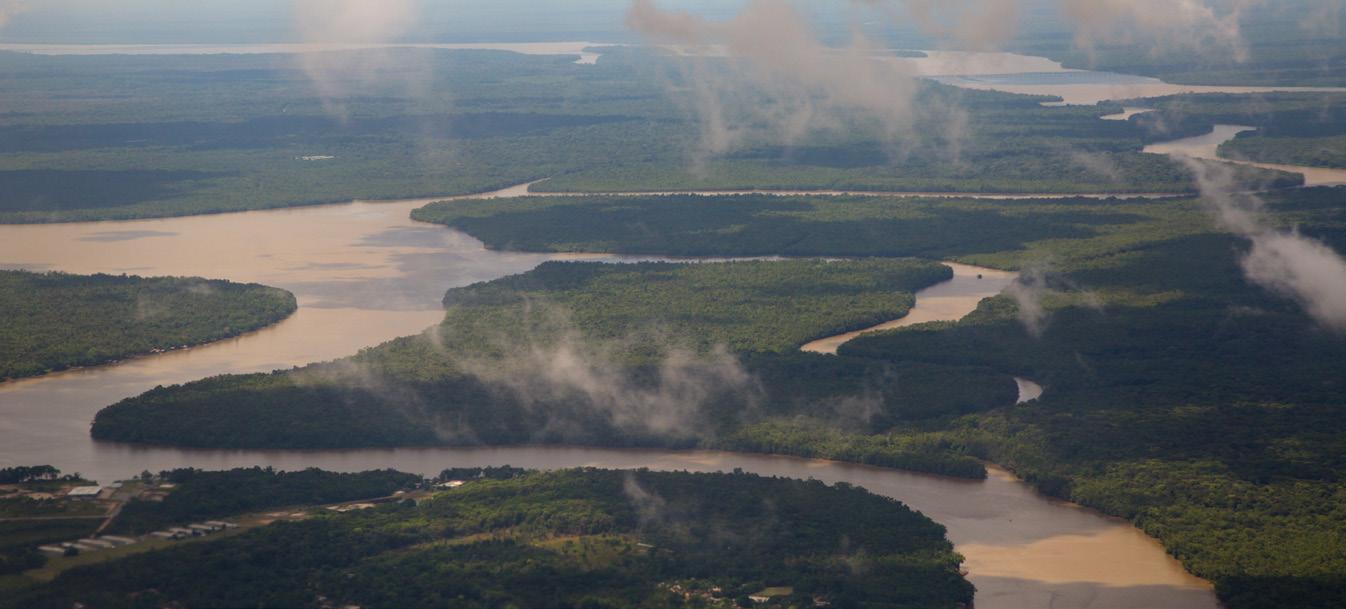
Land Use Conflict in the Amazon Rainforest How should the resources of rainforests be used and preserved?
Lesson 13 190
Life in the Central Andes: Adapting to a Mountainous Region How do people adapt to living in a mountainous region?
3
Europe and Russia
Introducing the Region: Physical and Human Geography 204
Lesson 14 212
Supranational Cooperation in the European Union
What forces work for and against supranational cooperation among nations?
Lesson 15 224 Population Dilemmas in Europe
How do population trends affect a country’s future?
Lesson 16 238
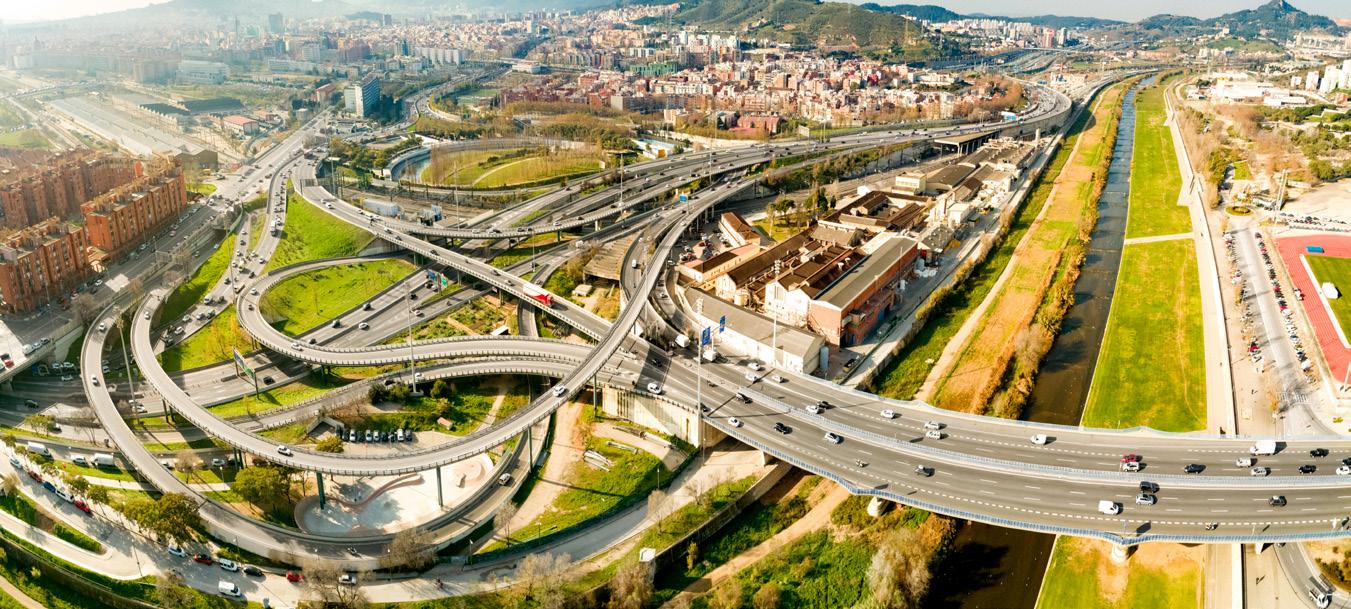
Invisible Borders: Transboundary Pollution in Europe
How can one country’s pollution become another country’s problem?
Lesson 17 250
Russia’s Varied Landscape: Physical Processes at Work
How do physical processes shape Earth’s landscape?
Lesson 18 264
Nation-States from the Old Soviet Empire: How Have They Succeeded?
What factors contribute to the success or failure of new nation-states?
Unit 4
5Africa

Introducing the Region: Physical and Human Geography 278
Lesson 19 286
The Nile River: A Journey from Source to Mouth How do rivers change as they flow across Earth’s surface?
Lesson 20 298
Life in the Sahara and the Sahel: Adapting to a Desert Region How do people adapt to living in a desert region?
Lesson 21 310
Micro-entrepreneurs: Women’s Role in the Development of Africa How are women micro-entrepreneurs in developing countries changing their communities?
Lesson 22 322
Nigeria: A Country of Many Cultures
How can dividing a diverse country into regions make it easier to understand?
Lesson 23 334
Resources and Power in Post-apartheid South Africa
How might ethnic group differences affect who controls resources and power in a society?
Unit
Southwest and Central Asia
Introducing the Region: Physical and Human Geography 348
Lesson 24 356
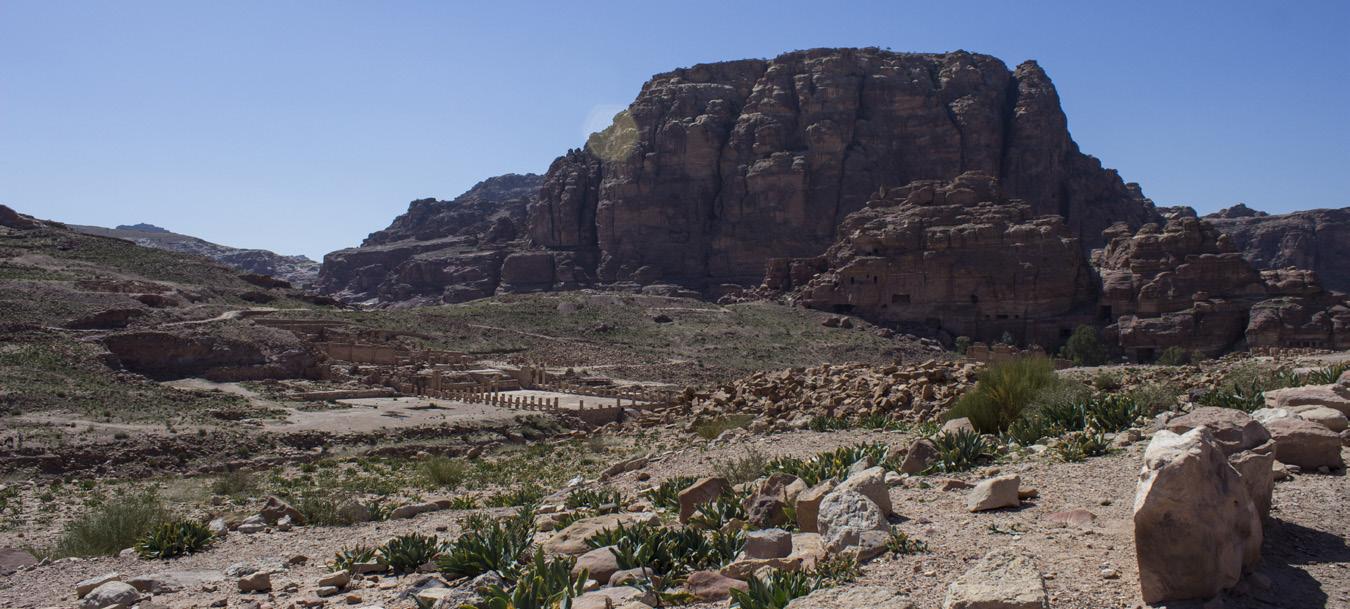
Oil in Southwest Asia: How “Black Gold” Has Shaped a Region How might having a valuable natural resource affect a region?
Lesson 25 368
Istanbul: A Primate City Throughout History
Where are primate cities located, and why are they important?
Lesson 26 378
The Aral Sea: Central Asia’s Shrinking Water Source
How are humans affected by changes they make to their physical environment?
Unit 6
Monsoon Asia
Introducing the Region: Physical and Human Geography 390
Lesson 27 398
Waiting for the Rains: The Effects of Monsoons in South Asia
How does climate influence human activity in a region?
Lesson 28 408 Tech Workers and Time Zones: India’s Comparative Advantage
What factors give some countries a comparative advantage in the global IT revolution?
Lesson 29 418
Mount Everest: Climbing the World’s Tallest Physical Feature
How can people both experience and protect the world’s special places?
Lesson 30 430
China: The World’s Most Populous Country

How does a country meet the challenges created by a large and growing population?
Lesson 31 442
Population Density in Japan: Life in a Crowded Country
How does population density affect the way people live?
Lesson 32 454
The Global Sneaker: From Asia to Everywhere
What is globalization, and how does it affect people and places?
Unit 7
Oceania and Antarctica
Introducing the Region: Physical and Human Geography 468
Lesson 33 476
Relative and Absolute Location: What Makes Australia Unique? How does a country’s location shape life within its borders?
Lesson 34 488
The Pacific Islands: Adapting to Life Surrounded by Ocean How do people adapt to life in an island region?
Lesson 35 502
Antarctica: Researching Climate Change at the Coldest Place on Earth
How might global warming affect the environment in the world’s coldest places?
Resources
Photographs from Around the World 514
516
Glossary 570
Atlas
Index 582 Notes 604 Credits 605 Pronunciation Guide 608 Unit 8
The Geographer’s World
UNIT 1
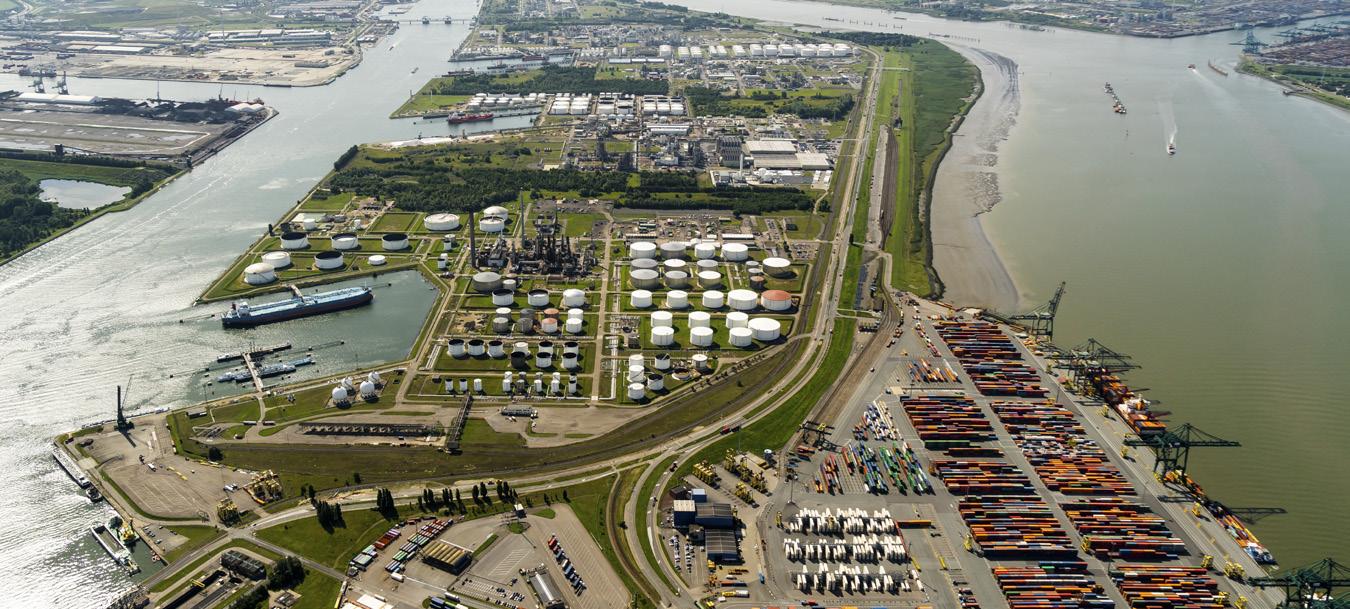
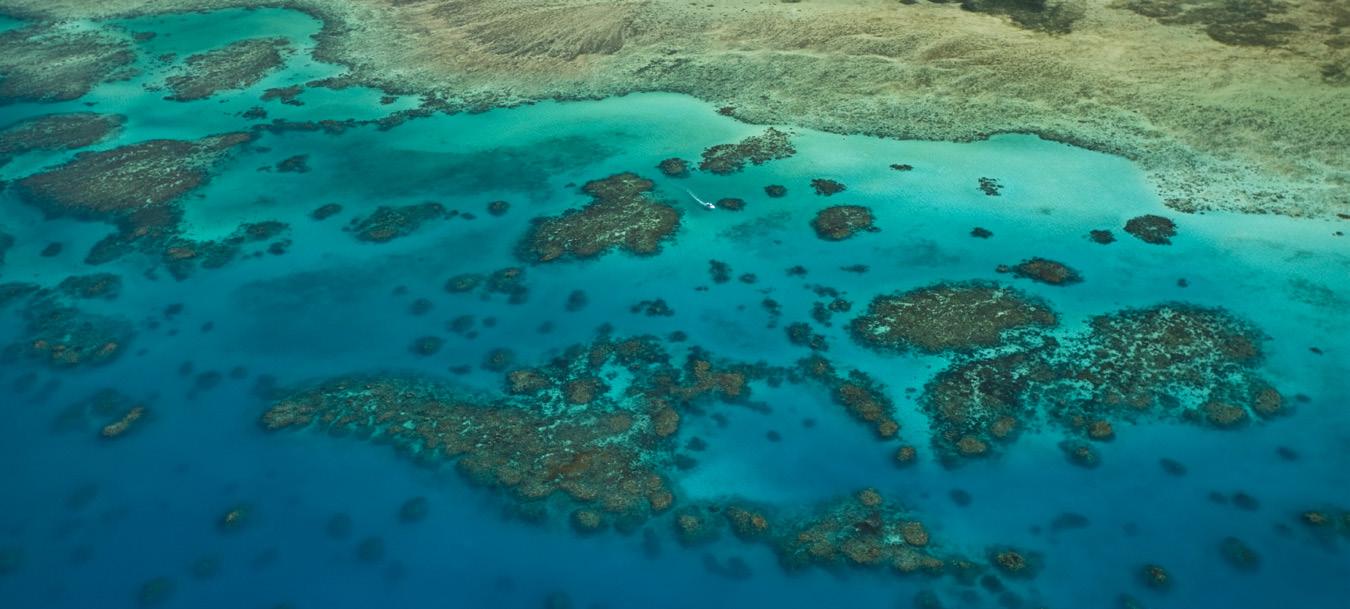
Introduction Lesson 1 The Tools of Geography Lesson 2 A Spatial Way of Thinking What patterns do you see in this photograph? See page 514 for details. TCI5 677 GA_SE_01A-0b.eps Fir st Proof s
Welcome to Geography Alive! Regions and People. You have just begun an active, handson journey into the world around you. That journey started with the dramatic photograph you saw on the previous page.
Before going back to look at that photo again, picture yourself in a tiny airplane star ing down at the strange landscape below. What is happening down there, you think to yourself. As you look more, your mind is flooded with questions. Where are we? Who lives down there? What are they doing? Why does the land look this way? With such questions tickling your brain, you have just entered the geographer’s world.
The Field of Geography

Geography is the study of Earth and its people. It helps us understand how people, places, and environments came to be and how they affect one another.
When geographers look at something on Earth, they ask questions. Where is it located? Why is it there? How did it get there? How does it affect the people who are living there? How does it affect the natural environ ment in this area? That “something” could be as ordinary as a nearby factory or a bustling outdoor market. Or it could be as extraordi nary as a distant, fire-belching volcano.
To answer such questions, geographers look at the world in spatial terms. This means they look at how things are arranged in space relative to each other. Look at the photograph of the camels below. The first question to pop into a geographer’s mind about this photograph would be a spatial one. Of all the
places on Earth, where were these camels when this picture was taken? Why were they there?

Physical Geography
Geographers divide their field into two broad branches: physical and human. The word physical means relating to things that can be seen, tasted, or felt. Physical geography is the study of natural features on the surface of Earth. These are things that can be seen (and sometimes tasted), such as mountains, plants, and animals. They also include things that can be felt more than seen, such as tem perature, wind, and weather.
Physical geographers looking at the camel photograph below would be interested in its desert landscape. They would wonder how this place got to be so very dry, what the sur rounding area is like, and what might live in this sea of sand.
Human Geography
Human geography is the study of people as they have spread across Earth. Human geog raphers seek to understand who lives where, how, and why. They are also interested in human-made features such as towns, farms, dams, and roads. Viewing the same camel picture, a human geographer might inquire about who is driving those camels. Where did the people come from? Where are they going? And why are they traveling through such a harsh, dry environment?
Introduction 4 Unit 1
The Geographic Inquiry Process
Geography is a very old field of study. Around 450 b .c .e., a Greek scholar named Herodotus created the first map of the known world. You can see a modern version of it at the bottom of this page. Looking at his map, you may notice two things. First, how much of the world it shows. Second, how much of the world is miss ing. What you cannot see is how Herodotus created his map. He followed a series of steps known as the geographic inquiry process .
Asking Geographic Questions
Herodotus began by asking geographic ques tions. What is the world like? What lands and seas cover Earth? What peoples does the world contain? Where do they live?
Acquiring Geographic Information
To answer his questions, Herodotus needed geographic information. He traveled widely to see the world. He interviewed other travelers and traders. They told him many tales, some true and some tall, about distant lands. In this way, Herodotus learned about peoples and places he would never see. Geographers today still travel in search of geographic information. Those travels may take them to nearby places or to distant lands. Like Herodotus, they also look for information gathered by others. This information can often be found in books and on the Internet.
Organizing Geographic Information
Once Herodotus had collected his informa tion, he needed to organize it in some way.
There are many ways to organize geographic information. The most common, however, is the one he chose to organize information about all of the places he had learned about: a map.
A map is a way of showing how things are arranged in space. On his map, Herodotus showed what he had learned about the loca tions of lands, seas, and peoples.

Analyzing Geographic Information
To analyze means to examine something in detail in order to discover more about it. Analyzing geographic information involves seeing patterns and making connections.

As Herodotus analyzed his information, he compared different ways of life. He noticed that Egyptians, for example, did many things “backward” from a Greek point of view. They wrote from right to left, instead of from left to right. They ate outdoors but washed indoors, while the Greeks did just the opposite.
Answering Geographic Questions
At the end of his inquiry, Herodotus tried to answer the questions he had started with. He wrote down all that he had learned. He also recorded conclusions about peoples based on his analysis. People still read his books today.
Throughout this course, you will be en gaged in the geographic inquiry process. You will ask questions and gather information. You will organize and analyze that information. Finally, you will try to answer your questions. You may find, however, that each answer leads to new questions. When that happens, you are thinking like a geographer.
The Geographer’s World 5
Program Overview
The goal of Geography Alive! Regions and People is to help you see the world through a geographer’s eyes. With those eyes, you will be able to make better sense of the world around you. Each element of this program has been designed to help you not only to reach this goal, but to have fun doing it.
Mastering the Basics
In this first unit, you will master the basic con cepts, skills, and tools that you will be using all year. Lesson 1 introduces the most impor tant tools of geography: maps and globes. In Lesson 2, you will explore different kinds of maps. You will also learn map-reading skills that you will use throughout this program.

The Tools of Geography
While completing your Mapping Lab, take time to read the unit introduction. It will give you a broad overview of the region that you will be studying for the next few weeks.


Lesson Case Studies
You will explore each region through a series of case studies. Each case study takes you to a new place while focusing on a key topic in geography. In one, you will learn how oil has affected countries in Southwest Asia. In another, you will experience what it is like to climb the world’s tallest mountain. In still another, you will “step into” an image of a hurricane to learn how such storms form.
Regions and Mapping Labs

After Unit 1, the program is divided into seven world regions. The study of each region begins with a Mapping Lab. In these labs, you will be challenged to use maps to answer questions about a region. Sometimes you will have to organize and analyze information from several maps to find your answer.
A Standards-Based Program
Geography Alive! Regions and People is closely based on the National Geography Standards. These standards set out what every young person should know and be able to do in geography. You can read more about those standards on the next three pages.

Our Trusted Advisors
To ensure that this program meets the National Geography Standards, we asked several geographers from the National Council for Geographic Education to serve as our advisors. We are deeply grateful to them for helping everyone involved in this program’s creation see the world through the eyes of a geographer.
Introduction 6 Unit 1 Maps and compasses are two common tools used by geographers. How do geographers show information on maps? A geographer made this map to show information about the world. The words, lines, and symbols are clues from the geographer to help you make sense of the map. Keep this map and its clues in mind as you try to answer the Essential Question. Essential Question Graphic Organizer
Introduction In the early 1800s, the United States was just beginning to expand west across North America. No American of European descent had ever crossed the territory that lay west of the Mississippi River. This vast area was a mostly mysterious blank space on the maps of the time. To find out about this unknown territory, President Thomas Jefferson sent Meriwether Lewis and William Clark to explore the western frontier. Lewis and Clark led team of explorers on a two-year expedition to the Pacific Ocean. The team mapped mountains and rivers as they crossed them. They collected samples of wildlife and plants that they had never seen before. The explorers also met the American Indians of the West and learned how they lived. In many ways, today’s geographers are explorers like Lewis and Clark. They study the natural features of the land, the sea, and even the sky above. They try to understand the way people interact with the world around them. For example, they look at where people choose to live and why. They study the way people use Earth’s resources, such as forests, water, and minerals. They explore the advantages that come with living in cities or in the country. Often geographers use maps as a basic tool for recording information and making new discoveries. In this lesson, you will learn how to use different kinds of maps. You will see how maps can illustrate information about people and places on Earth. You will then put these tools to use in your own study of geography. Over 10,000 0–1,000 Over 3,050 0–305 Elevation 3,0 Homolosine projection Cyan Magenta Yellow Blac Physical Features of the World LESSON 1
National
Standards
The World in Spatial Terms
Geographers look at the world in spatial terms. (Remember that spatial means relating to or happening in space.) They are interested in where things are located on Earth and why. They use a number of tools to help show these spatial relationships. Standards 1–3 say that a person educated in geography should know and understand these things:
Standard 1 How to use maps and other geographic representations, tools, and technologies to acquire, process, and report information from a spatial perspective
Standard 2 How to use mental maps to orga nize information about people, places, and environments in a spatial context
Standard 3 How to analyze the spatial orga
Places and Regions
You live in a particular place. That place may be in a city, small town, or rural area. It has a name and an address. You also live in a region. A region is not a specific place. Rather, it is a way of thinking about a group of places that have something in common. The Sunbelt, for example, is a region of the United States made up of warm-weather states. Standards 4–6 say that a person educated in geography should know and understand these things:
Standard 4 The physical and human charac teristics of places
Standard 5 That people create regions to interpret Earth’s complexity
Standard 6 How culture and experience influence people’s perceptions of places and regions
Sample Case Study: Lesson 22 Nigeria: A Country of Many Cultures
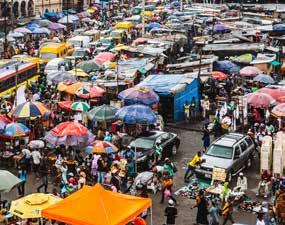
This case study will introduce you to more than 250 different ethnic groups that live in the country of Nigeria. You will see how dividing Nigeria into cultural regions helps geographers make sense of this complex country. You will also design an educational web page about the regions of Nigeria.
Geography
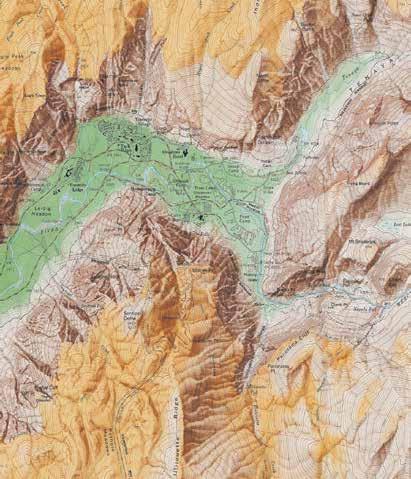
The Geographer’s World 7 worth preserving. Half Dome 5,000 River Intermittent stream Trail Picnic area Roads Building Campground Contour lines Index contour Elevation Tour stop Distance between contour lines = 40 feet Distance between index contours = 200 feet California Yosemite National Park 0 1 kilometer 0 1 mile 0.5 0.5 YO S EMITE MERCEDRIVER Upper Yosemite Fall Lower Yosemite Fall Mi Lake 3,500 4,000 8,842 . TCI5 266 GA_OT_6E.eps Cyan Magenta Yellow Black Fir st Proof N S EW
Physical Systems
Physical geography focuses on processes that shape and change Earth’s surface. The wearing away of coastlines by ocean waves is a physical process. Most physical processes work very slowly over time. But they create the ecosystems, or natural environments, in which we live. Standards 7 and 8 say that a person educated in geography should know and understand these things:
Standard 7 The physical processes that shape the patters on Earth’s surface
Standard 8 The characteristics and spatial distribution of ecosystems on Earth’s surface
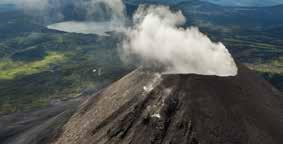
Sample Case Study: Lesson 17 Russia’s Varied Landscape: Physical Processes at Work
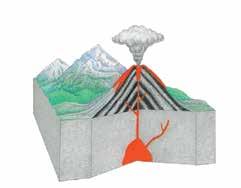
In this case study, you will learn about four physical processes: volcanic activity, glaciation, erosion, and tectonic move ment. You will act out each of these pro cesses to show how they shape Earth’s surface. You will also do research on physical processes close to home.
Human Systems
People are central in the study of geography. Human activities—such as trade, migration, settlement, and warfare—affect where and people live. Standards 9-13 say that a person educated in geography should know and understand these things.
Standard 9 The characteristics, distribution, and migration of human populations on Earth’s surface
Standard 10 The characteristics, distribution, and complexity of Earth’s cultural mosaics
Standard 11 The patterns and networks of economic interdependence on Earth’s surface
Standard 12 The processes, patterns, and functions of human settlement
Standard 13 How the forces of cooperation and conflict among people influence the divi sion and control of Earth’s surface
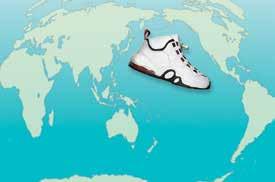
Sample Case Study: Lesson 32
The Global Sneaker: From Asia to Everywhere
In this case study, you will learn how economic interdependence brings you sneakers. You will see how making sneakers has become a global business. You will also find and map other “global” products in your home.
National Geography Standards 8 Unit 1
GA_SE_32-01_rv1 C M Y K 2nd Pr oo f 10-21 -20 05 Designing Locating materials Manufacturing Distributing Stages in the Making of a SneakerMagma chamber: the place deep underground where magma collects Main vent: the place where magma bur sts through Earth’s crust Lava: liquid rock that erupts from a volcano Crater: the hole at the top of a volcano where land around the opening has collapsed
Environment and Society
People constantly interact with their physical, or natural, environment. Human geographers study how physical environments shape the way people live and how human activities change physical environments. Standards 14-16 say that a person educated in geography should know and understand these things:
Standard 14 How human actions modify the physical environment
Standard 15 How physical systems affect human systems
Standard 16 The changes that occur in the meaning, use, distribution, and importance of resources.
Sample Case Study: Lesson 26
The Aral Sea: Central Asia’s Shrinking Water Source

The Uses of Geography
Geography opens a window to the world we live in today. It helps us to understand the past and to plan for the future. Standards 17 and 18 say that a person educated in geogra phy should know and understand these things:
Standard 17 How to apply geography to interpret the past
Standard 18 How to apply geography to interpret the present and plan for the future
Sample Case Study: Lesson 35
Antarctica: Researching Climate Change at the Coldest Place on Earth
You will travel to Antarctica in this case study to do research on climate change. You will visit research stations to gather data on air temperatures, ice shelves, and penguins. After analyzing your data, you will write a dialogue that explores climate change and how it may affect our future.
This case study takes you to what was once a large freshwater lake in Central Asia. You will learn how human activities have turned this lake into a shrinking, saltwater sea. You will also create docu mentaries that explore how the shrink ing of the Aral Sea has affected people living in this region.

The Geographer’s World 9
Lesson 110
The Tools of Geography
Introduction
In the early 1800s, the United States was just beginning to expand west across North America. Few Americans of European descent had ever crossed the territory that lay west of the Mississippi River. This vast area was not yet mapped in detail on most maps of the time.
To find out more about this territory, President Thomas Jefferson sent Meriwether Lewis and William Clark to explore the western frontier. Lewis and Clark led a team of explorers on a two-year expedition to the Pacific Ocean. The team mapped mountains and rivers as they crossed them. They collected samples of wildlife and plants that they had never seen before. The explorers also met Indigenous groups of the West and learned how they lived.
In many ways, today’s geographers are explorers like Lewis and Clark. They study the natural features of the land, the sea, and even the sky above. They try to understand the way people interact with the world around them. For example, they look at where people choose to live and why. They study the way people use Earth’s resources, such as forests, water, and minerals. They explore the advantages that come with living in cities or in the country. Often geographers use maps as a basic tool for recording information and making new discoveries.
In this lesson, you will learn how to use different kinds of maps. You will see how maps can illustrate information about people and places on Earth. You will then put these tools to use in your own study of geography.

Essential Question Graphic Organizer
How do geographers show information on maps?
A geographer made this map to show information about the world. The words, lines, and symbols are clues from the geographer to help you make sense of the map. Keep this map and its clues in mind as you try to answer the Essential Question.
Physical Features of the World
used
Maps and compasses are two common tools
by geographers.
N S EW Feet Over 10,000 5,001–10,000 2,001–5,000 1,001–2,000 0–1,000 Meters Over 3,050 1,526–3,050 611–1,525 306–610 0–305 Elevation 0 3,0 00 kilometers 0 3,000 miles1,50 0 Goode’s Homolosine projection
LESSON 1 11
1. The Geographic Setting
In September 1805, the Lewis and Clark expedition crossed the Rocky Mountains on the way to the Pacific Ocean. Lewis and Clark wanted to explore the Columbia River, which could take them to the ocean, but they didn’t know how to find it. A Nimiipuu (Nez Perce) chief named Twisted Hair came to the rescue. He drew a map on a white elk skin that showed the explorers how to reach the Columbia and indicated that the river was “five sleeps” away.
Today we still use maps to find the locations of places and determine how far apart they are. Like Twisted Hair’s drawing, the most basic map is a diagram that shows what is where.
Locating Things on Earth: The Main Purpose of Maps For geog raphers, maps are tools that show where things are on Earth. With these tools, we can find the absolute location of any place in the world. Every feature is located at a precise, or absolute, point on Earth, and there are many ways to describe this precise point. Your street address, for example, indicates the absolute location of your home. Later in this lesson, you’ll learn how a grid, or system of lines, can be used to show the absolute location of places on a map.
Maps also show the relative location of places on Earth. This is the location of one place compared to another. For instance, one place might be located east or west of another one. You probably use relative location when you give someone directions. Suppose you want to tell a friend how to locate the street where you live. You might tell her to proceed along a main street and then turn right one block past the park. With these directions, you would be telling her your street’s location relative to a place she knows well.
Distortion: The Big Problem with Maps Maps are great tools, but they’re not perfect pictures of Earth’s surface. Maps are two-dimen sional, or flat. In contrast, Earth is three-dimensional and shaped like a sphere, much like a basketball. The only way to show a spherical Earth on a flat map is by stretching some parts of it—a process that changes the shape, size, and position of Earth’s features. These changes are called distortion. The photographs and maps in this section show just how severe this distortion can be.
One way geographers deal with the problem of distortion is to use globes. Because they are spheres, globes are better models of the whole Earth than flat maps. They show the size, shape, distance, and direction of places on Earth very accurately. Unfortunately, globes cannot show a lot of detail without becoming huge. Maps, in contrast, can show smaller areas of Earth and include much more detail. In addition, maps are much easier than globes to carry around.
A second way to deal with distortion is to use map projections. A map projection is a particular way of showing Earth on a flat surface. All map projections have some kind of distortion. For example, one projec tion that accurately shows the sizes of places will distort their shapes, while another that shows accurate shapes will distort sizes and distances. Geographers choose the projection that best suits the kind of informa tion they want the map to show.
Lesson 112
sGeoterms


absolute location the precise point where a place is located on Earth


distortion a change in the shape, size, or position of a place when it is shown on a map
map projection a way of representing the spherical Earth on a flat surface
relative location where a place is located in relation to another place
Flattening a Sphere Distorts Features

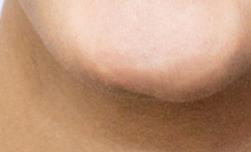


A person’s head is shaped almost like a sphere. If you try to flatten a head, its features stretch and change shape. As a result, the person becomes almost unrecognizable. In a similar way, flat maps can distort information about Earth’s features.


The Tools of Geography 13
0
AUSTRALIA
CHINA
RUSSIA
BRAZIL
0
UNITED STATES
CANADA
TCI5 75 GA_SE_01-3a
Cyan Magenta Yellow Black
The Top of a Map Doesn’t Always Point North
Second Proof
2. Map Titles and Symbols
4/11/05
On most maps, the top of the map points north, but not all maps work this way. This map turns our usual view of Earth upside down. The map isn’t right or wrong. After all, Earth does not have a “right” side up as seen from space. When you look at any map, be sure to check the compass rose so that you know which direction is which.
Like Lewis and Clark, early explorers often had no maps to guide them on their journeys. Lewis Carroll, the well-known English author of Alice in Wonderland and Through the Looking Glass, made fun of their situation in a poem called The Hunting of the Snark. The poem tells of sailors searching for an imaginary creature called a snark. To assist them, the ship’s captain unrolls a large map of the sea without a trace of land or even a mark indicating where anything was. The snark-hunting sailors, Carroll wrote,
were much pleased when they found it to be
A map they could all understand . . .
“A perfect and absolute blank!”
Luckily for us, instead of being blank, the maps we use today are filled with information.
The Title Tells What a Map Shows A map’s title gives us our first clue about its content. The title usually describes the area shown on the map and identifies the map’s main topic. The topic might be gold or silver mining, politics, agriculture, or even the night sky. Often the title also includes a date that tells us that the map shows the locations of places at a certain time.
A Compass Rose Shows Directions on a Map Have you ever used a magnetic compass to find your way when you were lost and in a strange place? If so, you know that the needle of a compass always points in a northward direction—toward the North Pole. Knowing where north is can help you determine which way to go.
2,000 Kilometers
2,000 Miles Eckert projection 1,0 00
2,000 kilometers 2,000 miles kert IV projection S N WE
Political Boundaries of the World Lesson 114
Mapmakers use a small diagram called a compass rose to indicate directions on a map. Because these diagrams often resembled a flower on early maps, sailors called this direction-finding tool a compass rose. It gave them courage to sail out of sight of land.
A simple compass rose has two short lines that cross at right angles. The points at the ends of the lines are labeled with the cardinal directions—north, south, east, and west. A more elaborate compass rose has lines between the cardinal points showing the intermediate directions—northeast, southeast, southwest, and northwest.
A Legend Identifies Symbols on a Map A compass rose is one of many symbols used to show information on a map. Some symbols incorporate color to show features. Blue lines, for example, are symbols that indicate the locations of rivers. Lakes and oceans are often colored blue as well. Other symbols use shapes to show information. A bold star is a common symbol for the capital of a state or country, while miniature airplanes are often used to show the locations of airports.
The symbols used on a map are usually identified in a box known as the map legend, or sometimes the map key. The map legend lists each symbol and explains what it shows on the map in this section.
Marshall Gold Discovery State Historic Park
SouthFork
can
MainSt
MonroeRid
A Grid Organizes Space on a Map Mapmakers often use a system of imaginary lines called a map grid to divide up space on their maps. You can see an example of a grid on the map above. To form this grid, the mapmaker drew a network of evenly spaced horizontal lines and vertical lines that meet at 90-degree angles. (Remember that horizontal lines go straight across, while vertical lines go up and down.)
Geographers make map grids useful by giving each line a label. For instance, on some maps the horizontal lines are labeled with letters and the vertical lines are labeled with numbers. Each number and letter iden tifies a particular section of the map. Once the grid has been labeled, a letter and number combination such as C3 or H7 can be used to specify the location of any place or feature on the map. The letter and number indicate the intersection of a horizontal and a vertical line on the map. Find the intersection of these two lines, and you will have found the place or feature you are looking for close by.
One very useful type of grid is the system of latitude and longitude. This global grid allows people to locate any point on Earth’s surface with the use of a simple numeric code. You will learn more about the global grid in the next section.
MonumentRd.
BridgeSt.
BackSt.Brewery
HighSt.
Using a Map’s Title, Compass Rose, Legend, and Grid
You can use this map to tour a historic site. The map title tells which site you will be exploring. The compass rose shows which way north is on the map. The map legend tells you what the symbols on the map mean. Once you know what you want to visit, the map grid will help you locate it on the map.
Paved road Footpath Picnic area Historical monument Park building N S EW
Ameri
R .
. Mt.MurphyRd. Hwy . 49
Church St. C lo d Sp r ing s Rd Hwy 49
St.
g e Trail Monument Tra i l James Marshall Monument Marshall’s Cabin St. John’s Church Catholic Cemetery Emmanuel Church Olde Coloma Theatre Thomas House Jail Ruins Park Headquarters Gold Discovery Museum Miners’ Cabin Bedrock Mortar Schoolhouse Bell’s Store Ruins Blacksmith Shop Post Office Monroe House Sawmill Replica Mill Site Gold Discovery Site 1 A B C D E F G H I J 23 45 67 8
The Tools of Geography 15
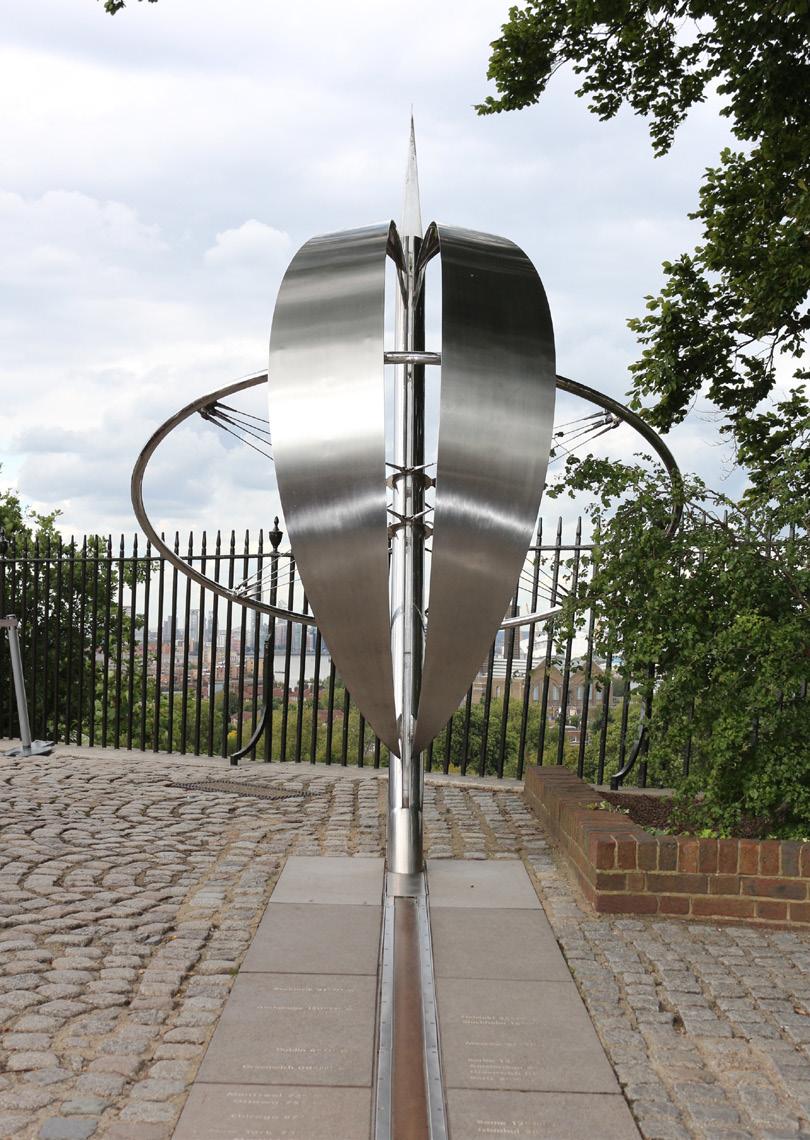
51° North, 0° West
This statue near the Royal Observatory in Greenwich, England, marks the location of the Prime Meridian.
3. The Global Grid: Longitude and Latitude
In April of 2017, two people were driving through the Gibson Desert in Australia. When their car became stuck in the sand, the couple had a serious problem. They were almost 200 miles from the nearest town. Luckily, the two had brought their Personal Locator Beacon, and they pressed a button to call for help. A helicopter crew soon rescued the two and flew them to safety.
How did the rescuers find these stranded travelers? Their locator beacon showed their exact location on the same global grid that geogra phers use to show the absolute location of every place on Earth.
Lines of Latitude Parallel the Equator The global grid system is made up of two sets of imaginary lines. The first set of lines, parallels of latitude, run east and west around the globe.
The equator is the most important parallel of latitude. It circles Earth exactly midway between the North and South poles. All other lines of latitude are parallel to the equator. Parallels of latitude are mea sured in degrees (°), with the equator marking 0° latitude. Other parallels are measured with reference to the equator.
Equator
Latitude Lines Run East to West
Latitude Is Measured from the Equator
TCI5 77 GA_SE_01-4b
Cyan Magenta Yellow Black Third Proof 6/1/05
Lines of Longitude Run from Pole to Pole The other set of lines in the global grid are half-circles, called meridians of longitude, that run from the North Pole to the South Pole. These lines are not parallel to each other, so the distance between them varies.
The most important of these north-south lines is the prime merid ian, which runs through Greenwich, England. Like parallels of latitude, meridians are measured in degrees, with the prime meridian marking 0° longitude. The prime meridian is a reference for measuring other meridians.
The next most important meridian is the International Date Line. This line runs though the Pacific Ocean halfway around the world from the prime meridian. When travelers cross the International Date Line, they cross over to a different day. Travelers moving west across the line go forward a day, while those traveling east across the line go back a day.
Longitude Lines Run North to South
Longitude Is Measured from the Prime Meridian
15ºN 15ºS 30ºS 45ºS 30ºN 45ºN 60ºN 75ºN North Pole South Pole
GA_OT_1C- 2 CMYK 2n d Proo f 7/1/0 5
Prime 15ºWMeridian 15ºE 30ºE 45ºE60ºE60ºW45ºW30ºW North Pole South Pole GA_SE_0 GA_OT_1C-4_r 1 CMYK 3r d Proo f 7/11/0 5
Lesson 116
PACIFIC OCEAN
ATLANTIC OCEAN
ARCTIC OCEAN
INDIAN OCEAN
PACIFIC OCEAN
SOUTHERN OCEAN
Latitude and Longitude Mark Absolute Location The numbering system of the global grid helps make it easy for you to locate any place on Earth.


Moving north from the equator, the parallels of latitude increase in number from 0° up to 90°N (north) at the North Pole. A similar thing happens moving south of the equator, where the numbers of the parallels increase from 0° to 90°S (south) at the South Pole. One degree of latitude covers about 69 miles, or 111 kilometers.
Meridians of longitude start from 0° at the prime meridian. Traveling east from there, the numbers on lines of longitude increase until they reach 180° at the International Date Line. These numbers are labeled E (east). The same thing occurs going west from the prime meridian. The numbers increase until they reach 180° at the date line and are labeled W (west).
absolute location of any place on Earth can be described as the meeting point of a parallel of latitude and a meridian of longitude. The numbers of these lines are the geographic coordinates of a place. These coordinates are like a street address for your house. They tell exactly where that place is located.


The Absolute Location of Cities
Latitude and longitude mark the absolute location of cities. The coordinates of Rio de Janeiro are 23°S, 43°W. To find this location, look for the parallel of latitude that is 23 degrees south of the equator. Move your finger along it until you come to the prime meridian. Now move west along the same line until you reach 43 degrees. You should be pointing to Rio de Janeiro.


The
N S EW 0 3,000 kilometers1,50 0 0 3,0 00 miles Mercator projection 1,50 0 150ºW 75ºN 60ºN Arctic Circle Antarctic Circle Tropic of Cancer Equator Tropic of Capricorn 45ºN 30ºN 15ºN 0º 15ºS 30ºS 45ºS 60ºS 135ºW 120ºW 105ºW 90ºW 75ºW 60ºW 45ºW 30ºW 15ºW Prime Meridian 0º 15ºE 30ºE 45ºE 60ºE 75ºE 90ºE 105ºE 120ºE 135ºE 150ºE 165ºE 180º International Date Line 23 ºN1 2 66 ºN1 2 66 ºS1 2 23 ºS1 2
Quebec City Los Angeles Mexico City Lima Santiago Rio de Janeiro Dakar Cape Town Mombasa London St. Petersburg Tehran Mumbai Jakarta Shanghai Tokyo Melbourne (Bombay) • • • • • • • • • • • • • • • • • •
Cities Around the World The Tools of Geography 17
Maps with Different Scales
The map on the left is a small-scale map. It shows where Washington, D.C., is located in relation to nearby cities. The map does not show details like city streets. But it does show larger features, such as major highways. The map on the right is a large-scale map. It focuses on Washington, D.C. You could use it to find your way through the city’s streets to the White House or other monuments.

4. Dealing with Distances: Map Scale



In Ithaca, New York, a winding path called the Sagan Planet Walk takes people on a journey past models of the sun and the planets. In less than a mile, walkers pass through a model of the entire solar system. The model shrinks the vast distances of space to make them easier to understand. For instance, people can see that the planet Mars is about one and a half times Earth’s distance from the sun.
A map does a similar thing for the area it shows. The scale on a map tells you how the distances on the map compare to the actual distances on Earth.
How Scale Affects Details A map can be large scale or small scale. A large-scale map gives a close-up view of a small area with a lot of detail, such as street names and interesting places to visit. You could use a large-scale map to find a store in a mall or on a neighborhood street. A small-scale map, in contrast, shows a larger area but with fewer details. Small-scale maps are best for finding your way between cities, states, and larger areas.
Estimating Distance with a Map Scale Many maps include a map scale, which tells you how to read distances on the map. For instance, an inch on a map might equal 10 miles or 100 miles or even 1,000 miles on Earth. The map scale appears either inside the map legend box or in a relatively open area on the map.
The map scale is usually made up of two short lines with notches along them, one line measuring distance in miles and the other in kilo meters. The easiest way to use a map scale is to make a scale strip. Place a strip of paper under the map scale, mark the scale’s notches on the paper, and label the marks with the numbers of miles or kilometers. Then, place your strip with the “0” mark at one point on the map, and line up the strip with a second point. Now read the closest number on your strip to this second point. You’ve just figured out the distance between those two points.
Washington, D.C., and Surrounding Areas


Washington, D.C.

0 10 kilometers5 0 10 miles5 N S EW P o t o m a c R Potomac Bethesda MARYLAND VIRGINIA College Park Silver Spring Camp Springs New Carrollton WASHINGTON, D.C. Arlington McLean Falls Church Annandale Alexandria Suitland Hyattsville • • • • • • • • • • • • • TCI5 82 GA_SE_01-5a 270
Downtown
0 0.5 kilometer0.25 0 0.5 mile0.25 N S EW Holocaust Museum The Mall Washington Monument Smithsonian Institution Washington Conv. Ctr. Nat'l. Portrait GalleryWhite House The Ellipse U.S. Capitol Verizon Center 7TH ST.L ST. K ST. 13TH ST. 12TH ST. 11TH ST. 10TH ST. 9TH ST. 8TH ST. 6TH ST.NEW YORK AVE. NEW YORK AVE.MASSACHUSETTS AVE. 1ST ST. 3RD ST. 4TH ST. N CAPITOL ST. CONSTITUTION AVE. PENNSYLVANIA AVE. MARYLANDAVE. I "EYE" ST. H ST. F ST. MADISON DR. E ST. INDEPENDENCE AVE. K ST. NEW JERSEY AVE. 395 TCI5 83 GA_SE_01-5b Lesson 118
Hemispheres, Continents, and Oceans
“One of my favorite things to do when I have time off is to just watch the world go by,” said astronaut Ed Lu about his experience in space. In 2003, Lu watched Earth go by while he was living aboard the International Space Station. “It isn’t exactly seeing Earth like a big blue marble,” he explained. “It’s more like having your face up against a big blue beach ball.” On the “big blue beach ball,” he saw Earth’s wide continents and blue oceans.
Few of us will ever see Earth from an astronaut’s point of view, but we can use maps and globes to get a bird’s-eye view of our planet’s natural wonders. Geographers make these features easier to understand by dividing Earth into different areas.
A Hemisphere Is Half a World Geographers divide Earth into halves called hemispheres. The equator divides Earth into two hemispheres. The northern half is called the Northern Hemisphere, and the southern half is called the Southern Hemisphere.
Geographers also divide Earth in half by longitude. The Western Hemisphere lies west of the prime meridian, and the Eastern Hemisphere lies to the east of it. The two hemispheres divide again at the International Date Line.
Continents and Oceans Cover Earth Geographers also divide Earth’s lands and seas into areas. Ocean water covers more than 70 percent of Earth’s surface. In fact, this ocean is really just one big body of water. But geographers usually divide it into five oceans—the Atlantic, Pacific, Indian, Southern, and Arctic oceans. Sometimes the Atlantic and Pacific oceans are divided at the equator into the North and South Atlantic and the North and South Pacific.
These oceans lap the shores of continents, the largest areas of land on our planet. The seven continents identified by geographers are, from largest to smallest, Asia, Africa, North America, South America, Antarctica, Europe, and Australia. Europe and Asia are actually parts of one huge landmass, but geographers usually think of them as two continents because they have different cultures and histories.
The World
OCEAN
Northern Hemisphere
Equator
Southern Hemisphere
Eastern Hemisphere Western Hemisphere
TCI5 84 GA_SE_01-6a
Cyan Magenta Yellow Black
Third Proof
6/1/05
P rime Meridian
Hemispheres
TCI5 85 GA_SE_01-6b
Cyan Magenta Yellow Black
The equator splits the globe into Northern and Southern hemispheres. The prime meridian and International Date Line split the globe into Eastern and Western hemispheres.
Third Proof
6/1/05
Earth’s Continents and Oceans
You can see from this map that oceans cover most of Earth. The five major oceans are actually a single body of water that surrounds the seven continents.
5.
Equator Prime Meridian 0 3,00 0 kilometers 0 3,00 0 miles Robinson projection 1,50 0 000 kilometer 3,000 N S EW ARCTIC OCEAN ATLANTIC OCEAN SOUTHERN OCEAN PACIFIC OCEAN PACIFIC
INDIAN OCEAN NORTH AMERICA SOUTH AMERICA EUROPE AUSTRALIA AFRICA ASIA ANTARCTICA 0º40ºW 40ºE 80ºE 120ºE 160ºE80ºW120ºW160ºW 60ºS 80ºS 40ºS 20ºS 20ºN 40ºN 60ºN 80ºN 0º TCI5 86 GA_SE_01-6c Cyan Magenta Yellow Black
The Tools of Geography 19
Arctic Circle
6. Earth and the Sun
For centuries, most people believed that Earth stood still in space. Today we know that our planet is in constant motion, moving at an aver age speed of about 67,000 miles per hour. That motion creates our years, months, and days and also helps to create our seasons.
Equator
Tropicof Cancer Tropicof Capricorn
The Tilted Earth
The tilt of Earth on its axis means that some areas receive more sunshine than others each day. This difference creates Earth’s seasons.
The Moving Earth Earth moves around the sun in a nearly circular path called an orbit. One round trip, called a revolution, takes about 365¼ days, which makes an Earth year.
As Earth revolves around the sun, it spins like a giant top upon its axis. The axis is an imaginary line that runs from the North Pole to the South Pole through the center of Earth. The spinning motion of Earth is called rotation
Earth makes one full rotation about every 24 hours. As Earth spins, it is daytime on the side facing the sun, and on the side facing away from the sun, it is night.
Earth’s Tilt Creates the Seasons Earth’s axis is tilted at an angle relative to the sun. Because of this tilt, the Northern and Southern hemi spheres receive different amounts of sunlight as Earth moves around the sun. These differences create Earth’s seasons.
During the north’s summer, half of Earth is tilted toward the sun causing the Northern Hemisphere to receive more sunlight for more hours and allowing most places to enjoy hot days. Winter, the colder part of the year, comes when this hemisphere tilts away from the sun and the days grow short and cool.
Of course, during these same months of winter, the Southern Hemisphere tilts toward the sun, so in the south it is summer. Similarly, when it is summer in the Northern Hemisphere, it is winter in Earth’s southern half.
Tropics, Circles, and Zones
Because of Earth’s tilt, the sun never beats straight down on places in the far north and south. Two lines of latitude mark the northernmost and southernmost points where the sun’s rays ever beat straight down. The northern line is called the Tropic of Cancer, and the southern line is called the Tropic of Capricorn. The Tropic of Cancer and the Tropic of Capricorn are equidistant from the equator.
The areas between these two lines and the equator are known as tropical zones. Tropical zones receive a lot of sunshine and are hot all year round. Considerable rain falls, especially in the hot rainy season, but there is no winter season.
Two other lines of latitude, the Arctic Circle and the Antarctic Circle, mark the farthest north and south points where the sun doesn’t shine at all on one day each year, meaning that the night lasts a full 24 hours. The areas between these circles and the North and South poles are known as polar zones. These zones receive little direct sunlight and are cold most of the year.
Between the tropical and polar zones lie the temperate zones, which lack temperature extremes. Generally, in the temperate zones summers are warm and winters are cool.

23 1 2 ° N
S
Antarctic Circle Lesson 120
The Revolution of Earth Around the Sun
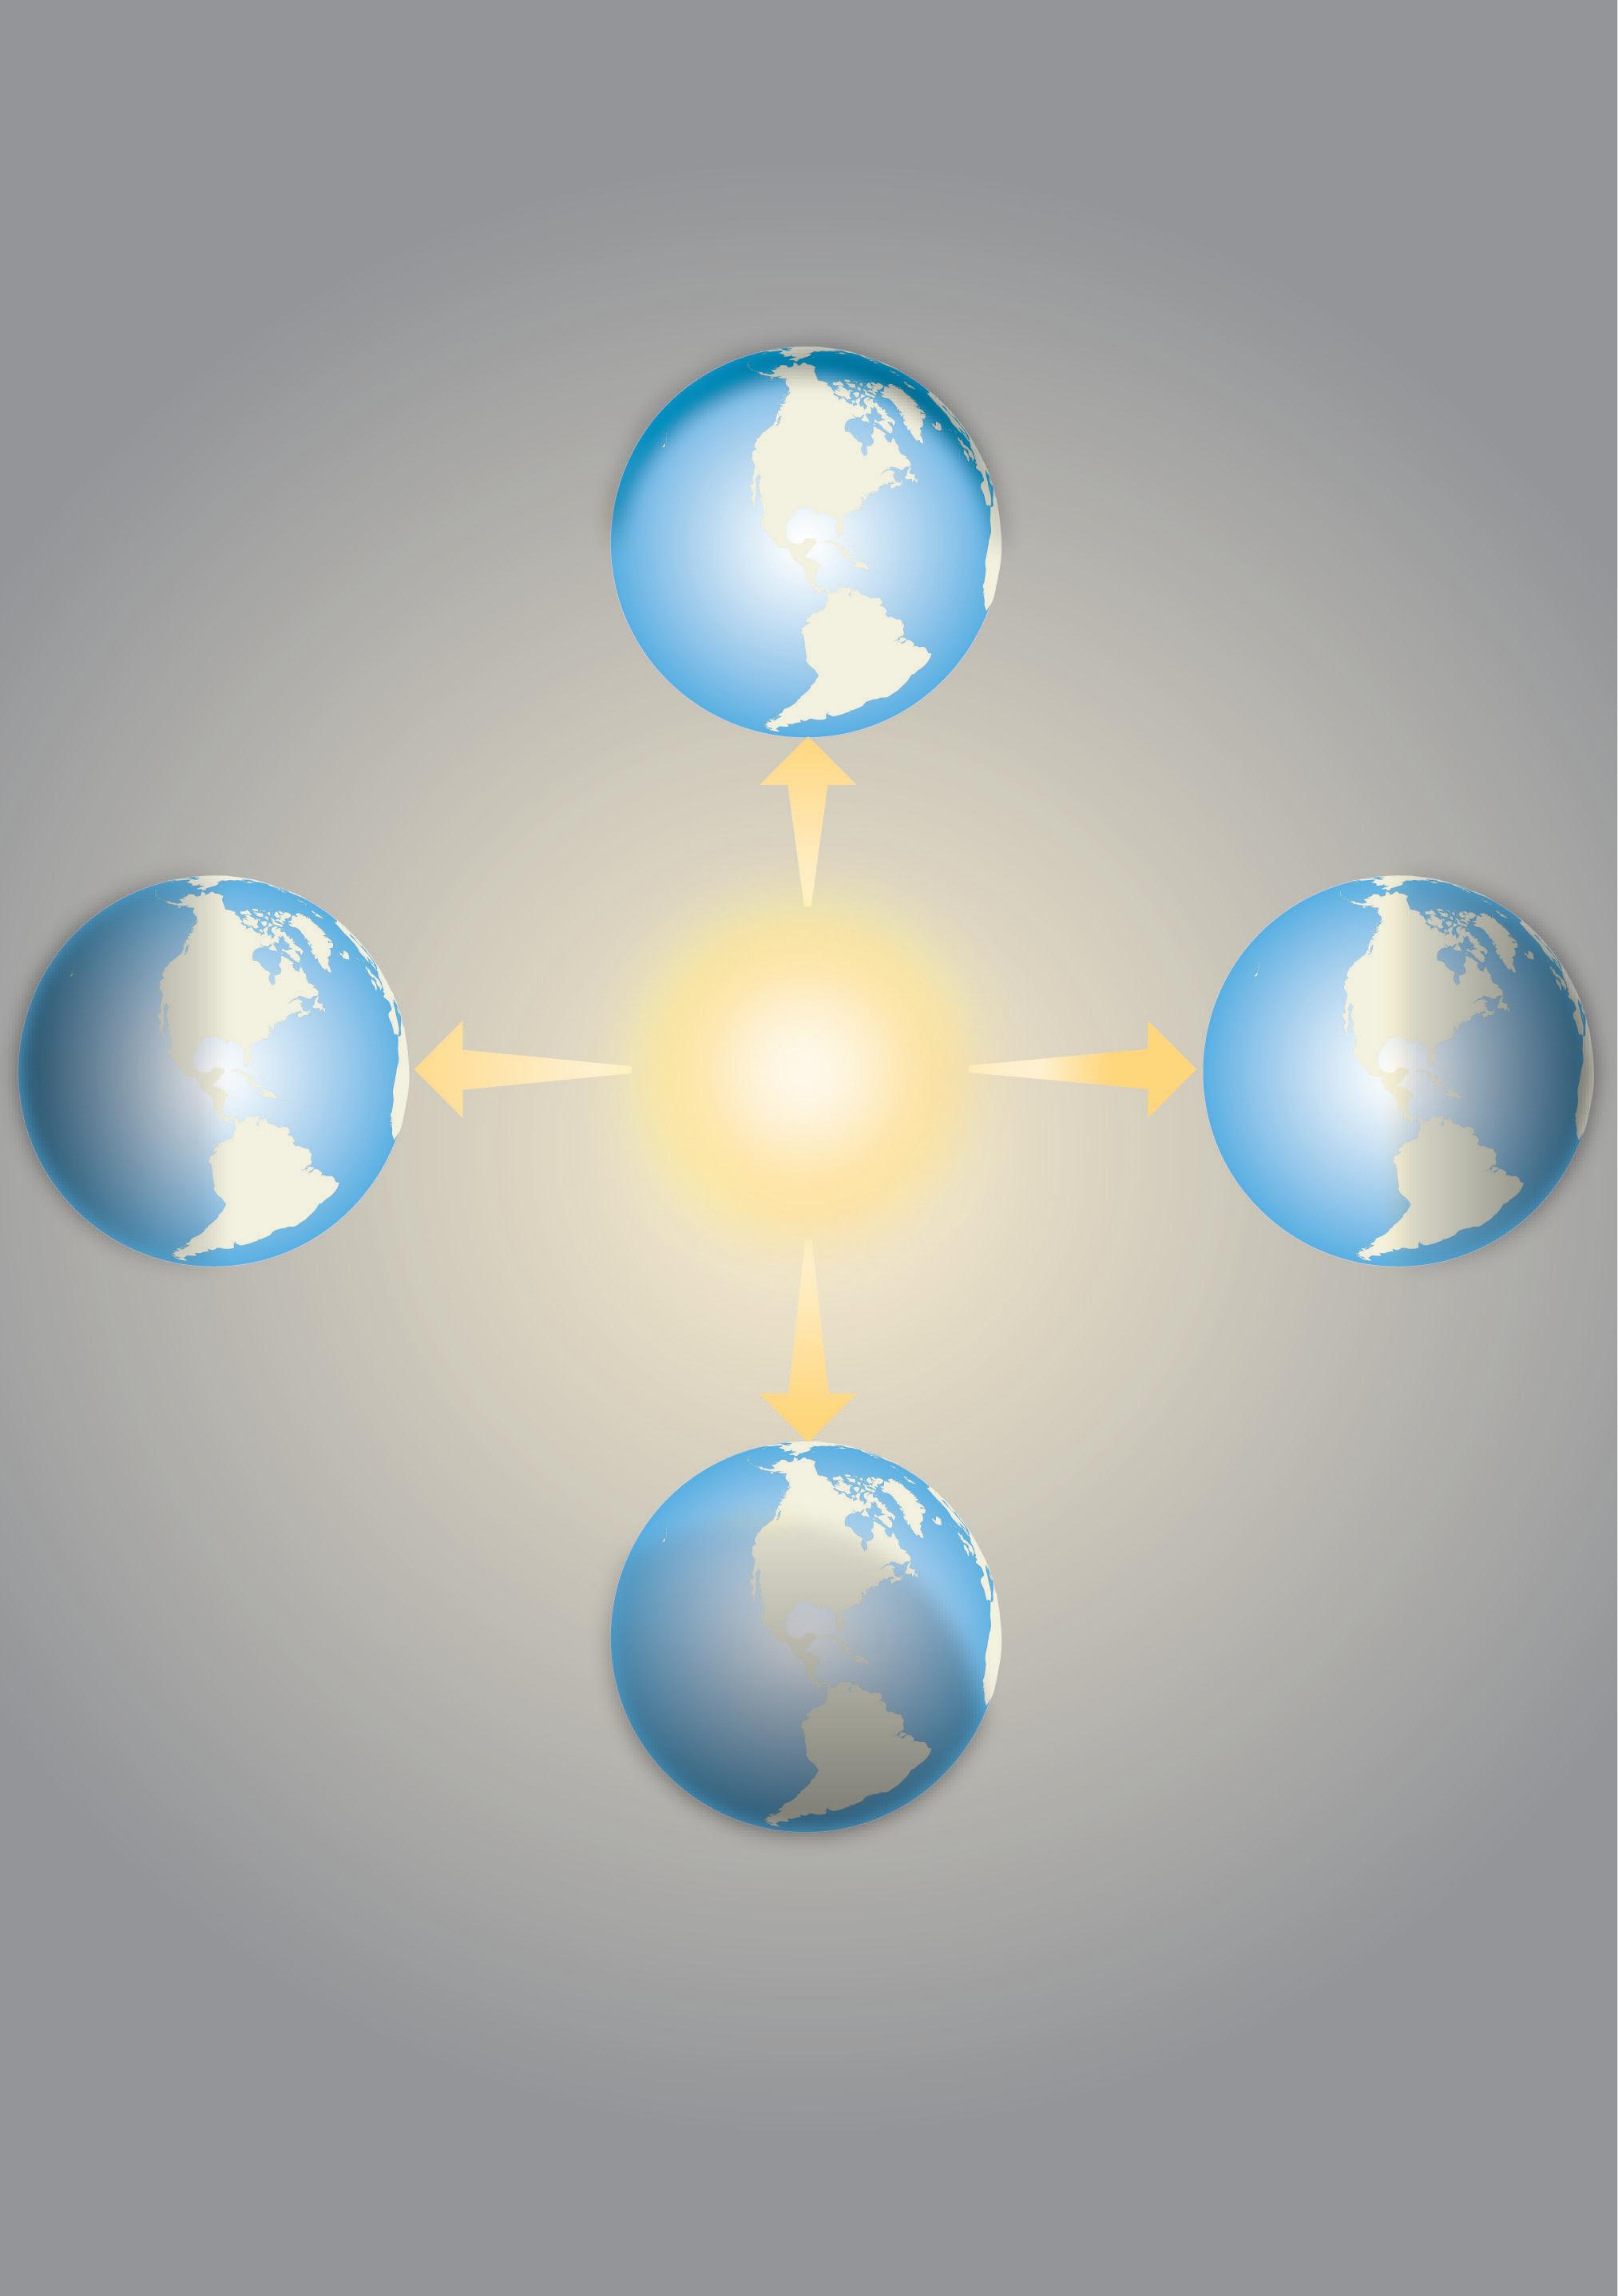
On March 20 or 21, the sun shines straight down on the equator. On this day, spring begins in the Northern Hemisphere, and fall starts in the Southern Hemisphere.
Tropic of Cancer
On June 21 or 22, the sun shines straight down on the Tropic of Cancer. On this day, summer begins in the Northern Hemisphere, and winter starts in the Southern Hemisphere.
Equator
On September 22 or 23, the sun shines straight down on the equator again. On this day, fall begins in the Northern Hemisphere, and spring starts in the Southern Hemisphere.
S
N S
Tropic of Cancer Equator TropicofCapricorn
N EquatorTropicof Capricorn
Earth’s Revolution and the Seasons
Sun
N
Tropic of Cancer
Equator
TropicofCapricorn Tropicof Capricorn
On December 22 or 23, the sun shines straight down on the Tropic of Capricorn. On this day, winter begins in the Northern Hemisphere, and summer starts in the Southern Hemisphere.
N
Tropic of Cancer
S
This diagram shows how Earth’s tilt creates the seasons during our planet’s year-long trip around the sun. Notice that the seasons are reversed in the Northern and Southern hemispheres.
S
TCI5 88 GA_SE_01-7b Cyan Magenta Yellow Black Third Proof 6/1/05
The Tools of Geography 21
Showing a Round World on a Flat Map
In this lesson, you learned how geographers show information on maps. Exploring a map’s title, compass rose, legend, and symbols can help you understand what a map shows.
You learned how geographers describe where a place is in terms of its absolute location. The global grid allows mapmakers to indicate the exact location of any place on Earth using lines of latitude and longitude labeled with letters and numbers. Map scales are useful for describing the relative distance between two places. Using a map scale and absolute location allows you to estimate how far two places are from each other.
All Flat Maps Have Distortion Geographers use maps to show important features of Earth, such as its oceans and continents. However, every flat map of Earth involves some distortion. As a result, the size or shape of landmasses or large bodies of water may be distorted, and the distances between places may not be accurately shown.
TCI5 89 GA_SE_01-8a
Lambert Projections Show Polar Areas that Other Maps Distort
Cyan Magenta Yellow Black Third Proof
6/1/05
A Lambert projection is a circular map. It shows size accurately at its center, but not distance or shape. It is good for showing the areas around the North or South pole. Most other map projections distort the shape and size of the Arctic and Antarctica.
To deal with distortions, mapmakers use different map projections. Many projections are named after the mapmakers who designed them. For example, Arthur Robinson designed the Robinson projection. The world map in Section 5 is a Robinson projection. It is a popular projec tion because it balances the distortions of size and shape, resulting in a fairly accurate picture of the world.
Notice how each projection does some things better than others. As you compare the shapes and sizes of the oceans and continents displayed on the various maps, think about what type of information each projec tion might show best.
The World
Mercator Projections Show Direction but Distort Size
Gerardus Mercator designed his map projection in 1569. It shows directions between places accurately near the equator. But it distorts the size of continents, especially near the North and South poles. This is called area distortion.
7.
N S EW 0 3,000 kilometers 0 3,000 miles Mercator projection 1,50 0 TCI5 90 GA_SE_01-8b Cyan Magenta Yellow Black Third Proof
0 2,0 00 kilometers 0 2,0 00 miles Lambert Azimuthal Equal-Area projection 1,0 00
The World Lesson 122
Eckert IV Projections Show Size but Distort Shape
The Eckert IV projection is an equal-area map. Equal-area maps show the sizes of places accurately. However, they distort shape near the poles. This is called shape distortion. Geographers often use Eckert IV projections to show the number of people in different areas.
TCI5 91 GA_SE_01-8c
Cyan Magenta Yellow Black Second Proof 4/11/05
The World
Goode’s Homolosine Projections Show Continents but Distort Oceans
Goode’s Homolosine projection uses a trick to help us see how the continents compare in size. It snips bits out of the oceans. This trick allows the continents to stretch without distorting their shapes. But it distorts the shape and size of the oceans.
TCI5 92 GA_SE_01-8d
Cyan Magenta Yellow Black
Second Proof 6/1/05
N S EW 0 2,0 00 kilometers 0 2,0 00 miles Eckert IV projection 1,000
N S EW 0 3,0 00 Kilometers 0 3,0 00 Miles Goode’s Homolosine Projection 1,50 0 3,000 3,000 3,0 00 kilometers Homolosine
The World
The Tools of Geography 23

Lesson 224
A Spatial Way of Thinking


Introduction


In the late summer of 1854, a highly contagious disease called cholera struck a neighborhood in London, England. People suddenly began suffering cramps, vomiting, and terrible thirst. The disease was so severe that many people died within hours of their first symptoms. In just 10 days, the disease killed about 500 people. Wagons groaned under the weight of corpses being taken away for mass burial.
No one knew how cholera spread or had any idea how to contain the outbreak—except a doctor named John Snow. Snow convinced officials to remove the handle from a water pump on Broad Street so that no one could draw water from the well there. As the cholera outbreak slowed, Snow knew he had correctly identified the source of infection: polluted drinking water.
Snow had, in effect, solved the mystery by using the skills of the geo graphic inquiry process. First, he asked a question: How was cholera spread? Next, he acquired information by going door to door to find out where people were dying. He then organized his information on a neighborhood map, marking the house of each cholera death. His next step was to analyze his map. Thus, he was able to answer his question: The Broad Street pump must be spreading the disease because most of the deaths were clustered around it.
John Snow’s map is an example of a thematic map, a map that pres ents information related to only one theme, or topic. In this lesson, you will learn how to identify and read different types of thematic maps. In addition, you will see how geographers use these tools to make sense of Earth’s physi cal and human features.
Essential Question Graphic Organizer
Why do geographers use a variety of maps to represent the world?
Geographers use maps for many purposes. A map legend tells you what kind of information the map shows. Colors, for example, can show different climates. Symbols can show physical features like rivers, or they can identify human features such as roads and cities. Keep this fictitious map and its legend in mind as you try to answer the Essential Question.


These thematic maps of South America show different information about the area. Sulli van Richfield Oceanside Oakbrook Jeffer son Quincy Blue Se a Apple River Lake Perry N S EW Mercator projection0 10 0 kilometers 0 10 0 miles 50 50 River Body of water Mountain Feet Over 10,000 2,001–10,000 0–2,000 Meters Over 3,050 611–3,050 0–610 Elevation Physical Features Country border City Capital Human Features LESSON 2 25
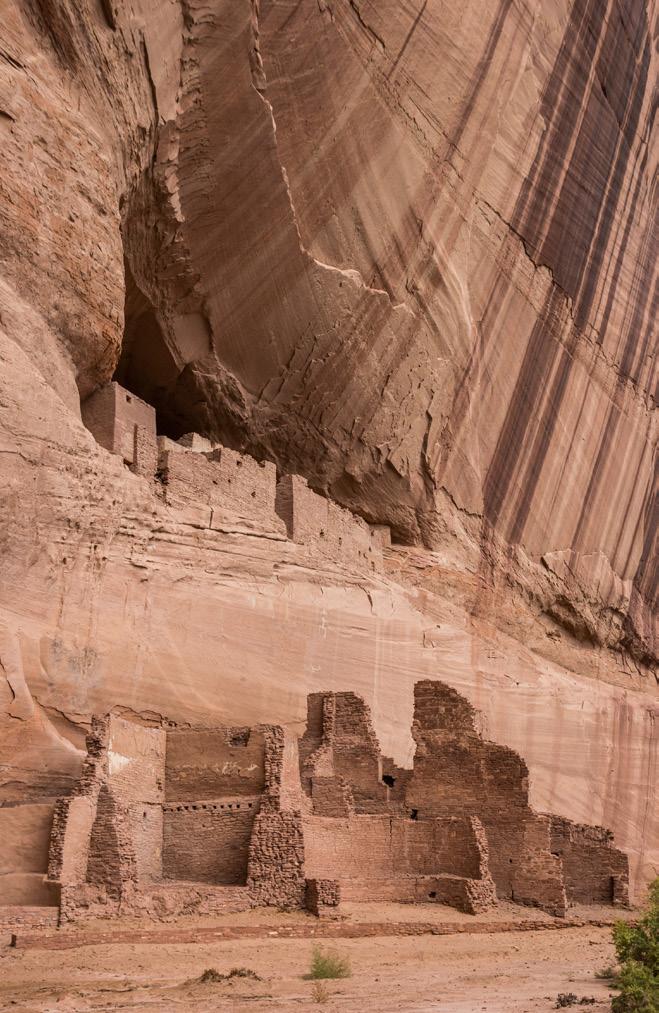
The Steep Rock Walls of Canyon de Chelly
A canyon is a landform found mostly in the southwestern United States. Canyon de Chelly was once home to Anasazi Indians. They built their villages in the steep canyon walls. You can find Canyon de Chelly on a physical features map of Arizona.
1. The Geographic Setting
Thematic maps are all around us. Tune in to a news program and you’re likely to see a weather map with the high and low temperatures for towns in your area. To find your way on the local bus system, you might use a map showing bus routes. By focusing on a specific topic, or theme, maps like these show information about some aspect of physical or human geography.
Thematic Maps Can Show Physical Geography Some thematic maps focus on physical geography. For instance, they may display Earth’s physical features, or the natural parts of Earth’s surface. Such fea tures include landforms like mountains, valleys, plains, and plateaus. Physical features also include bodies of water such as oceans, seas, rivers, and lakes.
Thematic maps can also illustrate other aspects of the physical environment. For example, some maps focus on climate, or long-term weather patterns. Climate maps show how much rainfall different areas receive. They also show how hot or cold various places tend to be in winter and summer.
Climate has a tremendous effect on the types of vegetation, or trees and other plants, that will grow in an area. You can see this by comparing a climate map of Earth with a vegetation map, a map that shows the kinds of trees and other plants that grow in various places. In many ways, it looks like a climate map, although other factors also affect what will grow where.
Thematic Maps Can Show Human Geography Thematic maps can also focus on human geography. John Snow’s map of the cholera deaths near the Broad Street pump is a good example. Another example is a political map. A political map of the United States shows the borders of the 50 U.S. states. Political maps of larger areas show the borders between countries. In addition to borders, political maps also show important cities, such as the capitals of states and countries.
Another type of thematic map shows population density. This is the average number of people living in a unit of area, such as a square mile. The higher the number, the more crowded an area is. A population density map reveals where large numbers of people cluster.
Besides showing where people live, a thematic map can show what they do. A map of economic activity focuses on the ways people produce, buy, and sell goods and services. This kind of map might show the main types of business and industry in an area. It might also show the natural resources that fuel the area’s economy. Natural resources are useful items found in nature, such as wood, coal, and oil.
A Map’s Title and Legend State its Theme To read a thematic map, first look at a map’s title. The title usually states the topic of the map. Then, look at the map legend to determine how to read the map’s symbols. On a U.S. political map, the legend often shows the symbols for the national and state capitals. A map legend may also explain how the map uses colors. For instance, a thematic map might use colors to show differences in elevation or population density.
Lesson 226
Geoterms
climate the pattern of weather over a long period of time economic activity any action that relates to the making, buying, and selling of goods and services
landform any natural feature of Earth’s surface that has a distinct shape. Landforms include major features such as continents, plains, plateaus, and mountain ranges. They also include minor features such as hills, valleys, canyons, and dunes.
physical feature any natural characteristic of Earth’s surface, such as landforms and bodies of water
population density the average number of people who live in a unit of area, such as a square mile. Population density measures how crowded an area is.
region an area defined by one or more natural or cultural characteristics that set it apart from other areas
thematic map a map that shows a particular theme, or topic
vegetation all the plants and trees in an area
Political Boundaries of the United States
Political Maps
Political maps help us see where countries, states, and important cities are located. On this map of the United States, you can see the borders of your state. A star marks the state’s capital, and a star with a circle around it shows the nation’s capital.

A Spatial Way of Thinking 27
Landforms and Water Bodies
You will see both landforms and bodies of water labeled on maps. This diagram shows many of these physical features.
2. Mapping Earth’s Physical Features
In the winter, snowboarders look for a snowy mountain to practice their sport on. In the summer, vacationers seek to cool off by a lake or river. These are just three of the landforms and bodies of water that you might see on a physical features map.

Common Landforms Geographers have given names to the many landforms found on Earth. Some landforms have distinctive shapes when viewed from above. A long, narrow peninsula, for example, juts out from a continent into the ocean and is surrounded by water on three sides. Other landforms have distinct shapes when viewed from ground level. Mountain ranges tower over low, flat plains. A plateau is a raised, flat area of land. A canyon is a deep, narrow valley with steep sides. Physical features maps show the shapes of features as seen from above. They also show the elevation, or height above sea level, of various features. These maps typically use colors and shading to show changes in elevation.
Bodies of Water Geographers also label bodies of water on physical features maps. Many kinds of bodies of water appear on continents. For instance, rivers flow from mountains and make their way to the sea. Lakes are entirely surrounded by land. Other water bodies are created where oceans and seas meet continents. A bay is part of an ocean that is enclosed by an inward-curving stretch of coastline. A gulf is a body of water that cuts deeply into the shoreline and is enclosed by land on three sides.
plateau
tributary cape
reefharbor
lake
river
canyon
hill
valley
mountain range cliffs fjord
glacier
sea
ocean
plain delta bay
TCI5 12 3 GA_SE_02-3a.eps Lesson 228
Physical Features Map

This map shows major physical features in India. The Himalayas are India’s highest physical feature. Two long rivers, the Ganges and the Brahmaputra, flow out of the Himalayas and form one of the world’s largest river deltas where they meet the Bay of Bengal.
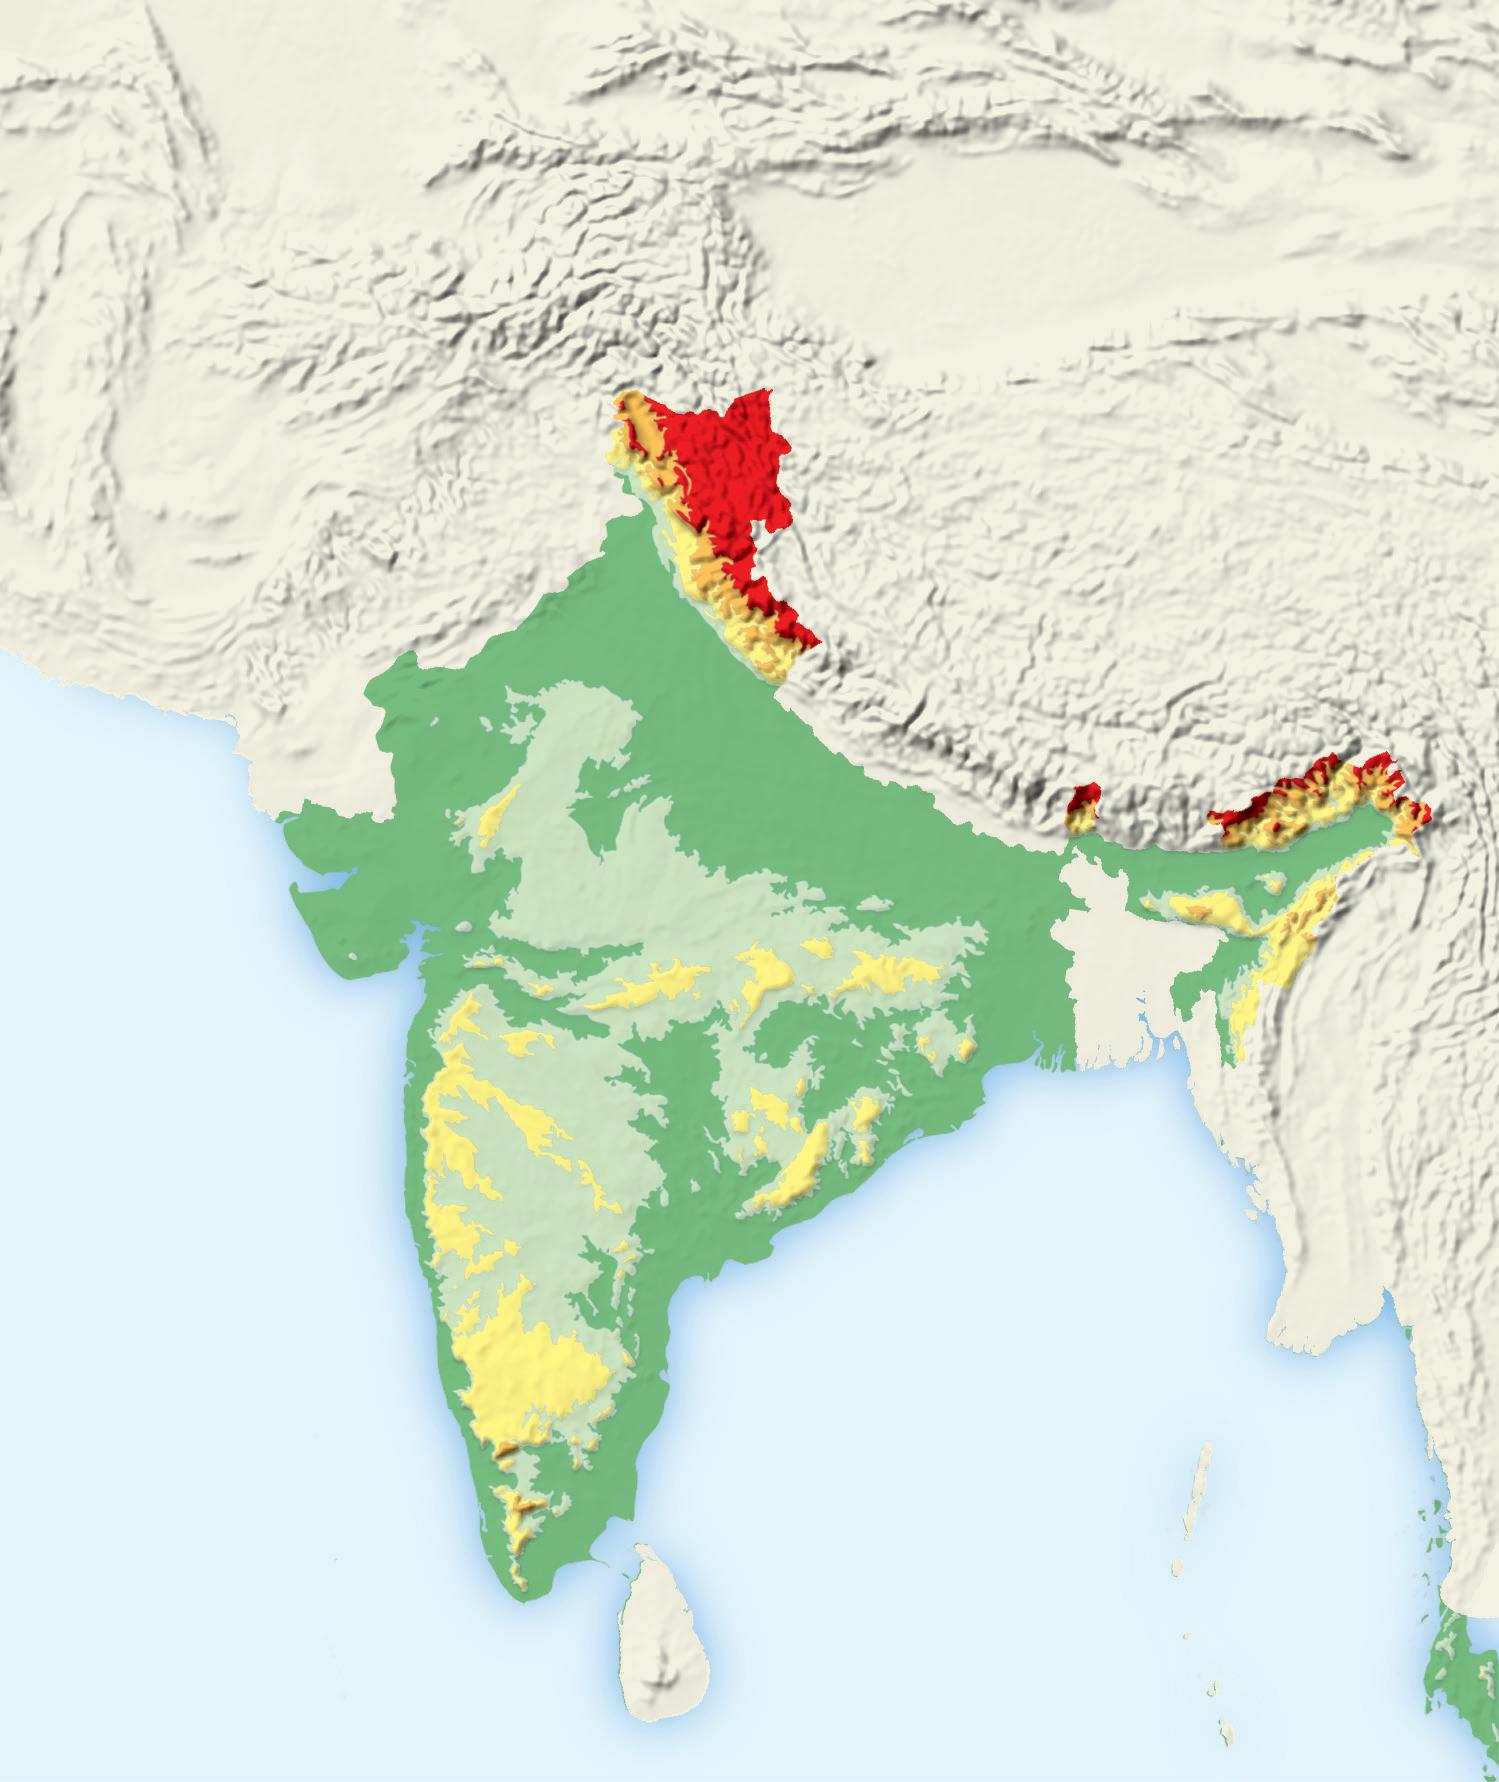
Mt. Everest (29,035 ft 8,850 m) H I M A L A Y A S Deccan Plateau Thar Desert W e s t e r n G h a t s Chota Nagpur Plateau Ganges Delta Ganges Plain Hindu Kush E a s t e r n G h a t s Bay of Beng alArabian Se a Brahmaputra R GangesR . Indus R. Godavari R. Narmada R Krishna R. I r r a waddy R. Tropic of Cancer 20ºN 30ºN 10ºN 90ºE 80ºE70ºE Mountain peak Feet Over 10,000 5,0 01–10,000 2,0 01–5,000 1,0 01–2,000 0–1,000 Below sea level Meters Over 3,050 1,526–3,050 611–1,525 306–610 0–305 Below sea level Elevation N S EW Lambert Azimuthal Equal-Area projection 0 50 0 kilometers 0 50 0 miles 250 250
coast peninsula strait basin mouth dune gulf archipelago isthmus desert oasis mesa volcano source mountain island Physical Features of India A Spatial Way of Thinking 29
World Climate Zones
Examine these climagraphs for 12 different climate zones found around the world.
3. Hot, Cold, Wet, Dry: Earth’s Climates
Do you check a weather report each morning to see what the day will be like? Are most days sunny, or does it rain a lot where you live? Such long-term patterns in weather are called climate.
Climate Zones To study climates, geographers divide Earth into climate zones. Each zone has a particular pattern of temperature and precipitation: rain, snow, or other forms of moisture. This pattern is often shown on a climagraph.
A climagraph shows the average temperature and precipitation in a place over a year. The letters at the bottom of a climagraph stand for the months of the year. The curved line indicates the average monthly temperatures, while the bars show the average monthly precipitation.
Location Affects Climate
Many factors affect a location’s climate, but none is more important than latitude. Places in tropical latitudes, near the equator, get the most direct rays from the sun all year, so these places have hot weather year-round. Places at high latitudes, close to the North and South poles, receive much less sunlight and remain quite cold all year.
Elevation, or altitude, also affects climate. Places at high elevations have colder climates than those lower down. Large bodies of water can also affect an area’s climate. In coastal areas, ocean winds and warm-water currents keep temperatures even year-round. Places farther inland have more extreme climates, with hotter summers and colder winters. You’ll learn more about the factors that affect climate throughout this program.
west coast
ice cap very cold all year with permanent ice and snow subarctic cold, snowy winters and cool, rainy summers marine
warm summers, cool winters, and rainfall all year tundra very cold winters, cold summers, and little rain or snow highlands temperature and precipitation vary with latitude and elevation humid continental warm, rainy summers and cool, snowy winters JF MA MJ JA SO ND 50 70 90 30 10 –10 –30 12 10 8 6 4 2 0 South Pole, Antarctica Month Av er ag e t emper at ur e (ºF) Av er ag e pr ecipitation (inc hes) JF MA MJ JA SO ND 90 70 50 30 10 –10 –3 0 12 10 8 6 4 2 0 Nome, Alaska Month Av er ag e t emper at ur e (ºF) Av er ag e pr ecipitation (inc hes) JF MA MJ JA SO ND 90 70 50 30 10 –10 –3 0 12 10 8 6 4 2 0 Archangel, Russia Month Av er ag e t emper at ur e (ºF) Av er ag e pr ecipitation (inc hes) JF MA MJ JA SO ND 90 70 50 30 10 –10 –3 0 12 10 8 6 4 2 0 La Paz, Bolivia Month Av er ag e t emper at ur e (ºF) Av er ag e pr ecipitation (inc hes) JF MA MJ JA SO ND 90 70 50 30 10 –10 –3 0 12 10 8 6 4 2 0 Sydney, Australia Month Av er ag e t emper at ur e (ºF) Av er ag e pr ecipitation (inc hes) JF MA MJ JA SO ND 90 70 50 30 10 –10 –30 12 10 8 6 4 2 0 Month Minneapolis, Minnesota Av er ag e t emper at ur e (ºF) Av er ag e pr ecipitation (inc hes) Lesson 230
Zones


Climate Maps


Australia has seven climate zones. This climate map shows each zone in a different color.


Mediterranean warm all year with dry summers and short, rainy winters semiarid hot, dry summers and cool, dry winters tropical wet and dry hot all year with rainy and dry seasons humid subtropical hot, rainy summers and mild winters with some rain arid hot and dry all year with very little rain tropical wet hot and rainy all year JF MA MJ JA SO ND 90 70 50 30 10 –10 –3 0 12 10 8 6 4 2 0 Nice, France Month Av er ag e t emper at ur e (ºF) Av er ag e pr ecipitation (inc hes) JF MA MJ JA SO ND 90 70 50 30 10 –10 –3 0 12 10 8 6 4 2 0 Shanghai, China Month Av er ag e t emper at ur e (ºF) Av er ag e pr ecipitation (inc hes) JF MA MJ JA SO ND 90 70 50 30 10 –10 –3 0 12 10 8 6 4 2 0 Ankara, Turkey Month Av er ag e t emper at ur e (ºF) Av er ag e pr ecipitation (inc hes) JF MA MJ JA SO ND 90 70 50 30 10 –10 –3 0 12 10 8 6 4 2 0 Windhoek, Namibia Month Av er ag e t emper at ur e (ºF) Av er ag e pr ecipitation (inc hes) JF MA MJ JA SO ND 90 70 50 30 10 –10 –3 0 12 10 8 6 4 2 0 Mexico City, Mexico Month Av er ag e t emper at ur e (ºF) Av er ag e pr ecipitation (inc hes) JF MA MJ JA SO ND 90 70 50 30 10 –10 –3 0 12 10 8 6 4 2 0 Bangkok, Thailand Av er ag e t emper at ur e (ºF) Month Av er ag e pr ecipitation (inc hes) INDIAN OCEAN Great Australian Bight Gulf of Carpentaria Bass Strait Timor Sea Coral Sea Tropic of Capricorn 20ºS 10ºS 150ºE140ºE130ºE120ºE 30ºS 40ºSClimate
Marine west coast Mediterranean Humid subtropical Semiarid Arid Tropical wet and dry Tropical wet N S EW 0 50 0 kilometers 0 50 0 miles Lambert Azimuthal Equal-Area projection 250 250 Climate Zones of Australia A Spatial Way of Thinking 31
World Vegetation Zones
Geographers divide the world into vegetation zones. Each zone has a certain mix of plants and trees that have adapted to the conditions in that zone.
4. Trees and Other Plants: Earth’s Vegetation
Think about the climate where you live and about the kinds of trees and other plants that grow nearby. In an arid climate like a desert, you might see hardy cacti and scrubby brush. In a humid continental climate, you might see lofty fir and pine trees that stay green all year. Climate has a major effect on the kind of vegetation that grows in a place.
Vegetation is Adapted to Its Environment Plants of some kind grow nearly everywhere on Earth. But in order to survive, plants must adapt to their environment.
Plants have found ways to adapt to even extreme environments. A tundra climate zone is very cold and dry, yet small plants and bushes grow there and wildflowers blossom in the tundra’s short summer. In arid climates, cacti can survive very hot days and go for long periods without water. Other kinds of vegetation need plentiful precipitation to thrive.
In addition to climate, other factors affect what plants grow where. Among them are elevation, amount of sunlight, and richness of the soil.
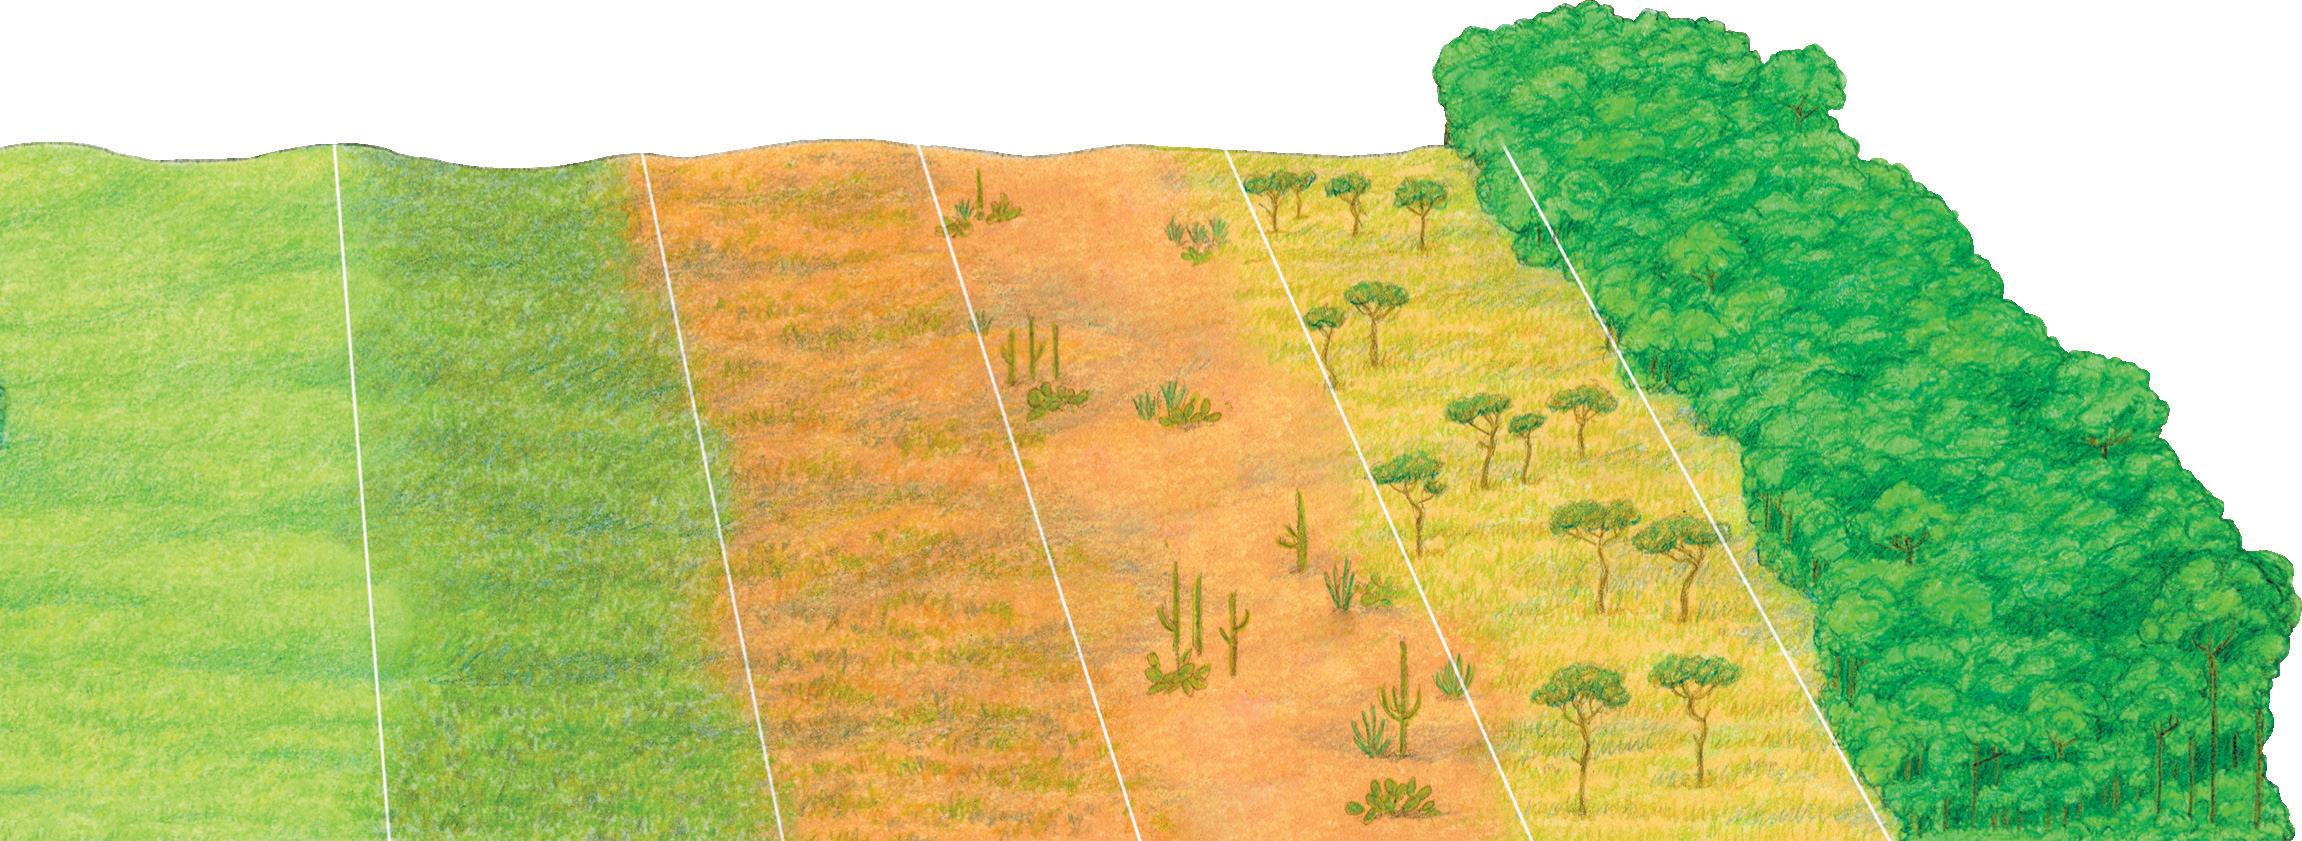
Global Vegetation Zones Geographers study where different plants grow by dividing the world into vegetation zones. In each zone, a certain mix of plants has adapted to similar conditions.
Like climate zones, vegetation zones are affected by latitude and elevation. They range from the barren ice cap zones at the poles to the dense broadleaf evergreen forest zones near the equator. Highlands vegetation zones are usually on mountain slopes.

ice cap permanent ice and snow; no plant life
tundra treeless plain with grasses, mosses, and scrubs adapted to a cold climate
mixed forest a mix of coniferous and deciduous trees
deciduous forest trees with broad, flat leaves that are shed before winter
coniferous forest evergreen trees with needles and cones
Lesson 232
Red Sea


Vegetation Maps
This map shows the vegetation zones found in North Africa. Chaparral thrives beside the Mediterranean Sea. Desert and desert scrub are found in the dry Sahara. A narrow band of broadleaf evergreen forest appears in the northeast corner of North Africa. What do you think allows tropical trees to survive in such an arid region?
highlands varies by elevation


Highlands varies by elevation temperate grassland short and tall grasses adapted to cool climates


chaparral small trees and bushes adapted to a Mediterranean climate
desert scrub small trees, bushes, and other plants adapted to a dry climate
desert arid region with few plants tropical grassland grasses and scattered trees adapted to a tropical wet and dry climate
broadleaf evergreen forest tall trees with large leaves that remain green all year
Mediter ranean Se a Tropic of Cancer 20ºN 30ºN 40ºN 20ºE 30ºE 40ºE Vegetation Zones Highlands Desert Desert scrub Temperate grassland Tropical grassland Chaparral Broadleaf evergreen forest N S EW 0 50 0 kilometers 0 50 0 miles Sinusoidal projection 250 250 Vegetation Zones of North Africa A Spatial Way of Thinking 33
Population Density from High to Low
Population density is a measure of crowding. Some countries are very densely populated, while others are not. These photographs show places with different population densities.
5. Where People Live: Population Density
In 2010, the 8.2 million people residing in New York City were jammed into an area of about 300 square miles. Compare this with the town of Skwentna, Alaska, in 2010, where approximately 40 people were spread out over about 450 square miles. When it comes to crowding, these two places are about as different as they can be. Geographers show these kinds of differences using population density maps.
Population Density Measures Crowding Population density tells us how crowded a place is. To calculate the density of a place, divide the total number of people living there by the location’s total land area. The higher the result, the more crowded the place is. In 2010, New York City had a population density of more than 27,000 people per square mile. In contrast, Skwentna had less than 1 person per square mile.
Population density affects how people live. In Skwentna, houses are so spread out that people rarely see their neighbors. There are no roads, so residents use airplanes, boats, or snowmobiles to get to the local store and the post office. Skwentna’s version of rush hour comes in February, when dogsled racers speed through town.
Things are far different in New York City. Many people live in highrise apartments, where they may have hundreds of neighbors just in their own building. Every day at rush hour, New Yorkers pour into railroads, ferries, and underwater tunnels to get to their destinations. Millions of “straphangers” hold on tight as they jostle one another in the city’s crowded subways.
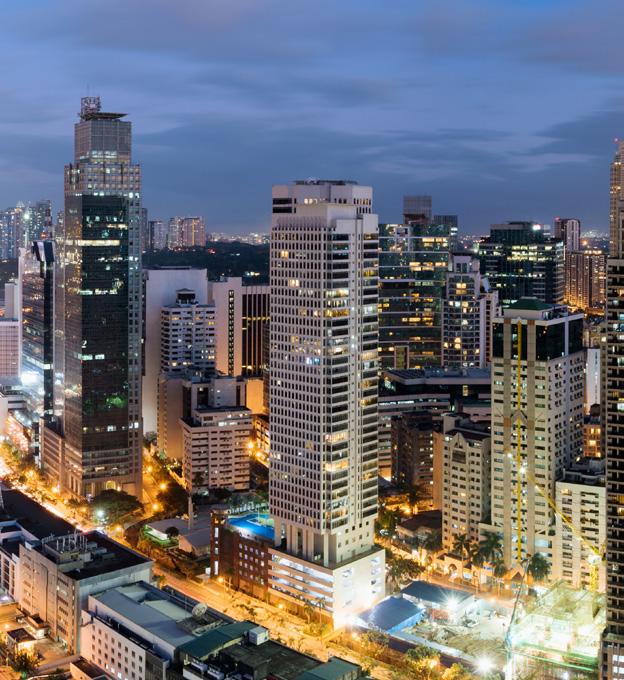
More Than 250 People per Square Mile
Manila in the Philippines is the most crowded place on Earth. On average, many more than 250 people live in a square mile in this busy city.
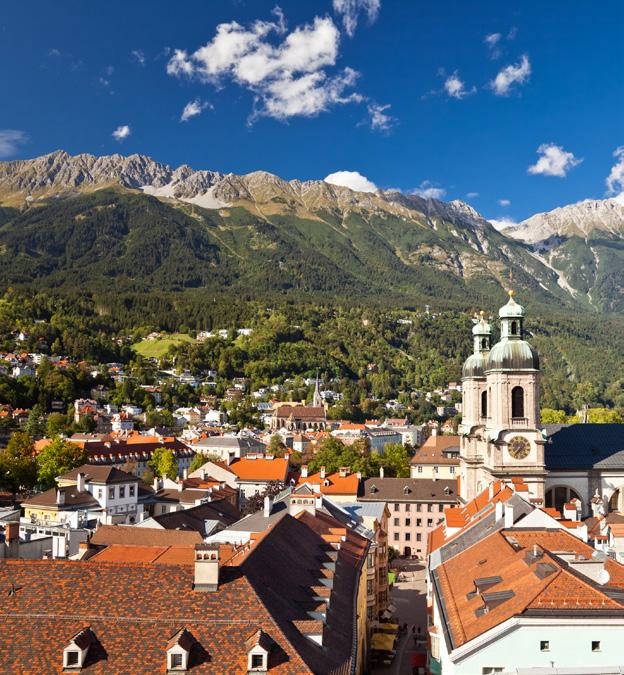
125 to 250 People per Square Mile
Austria is a fairly crowded country. On average, between 125 and 250 people live in every square mile of this mountainous land.
Lesson 234
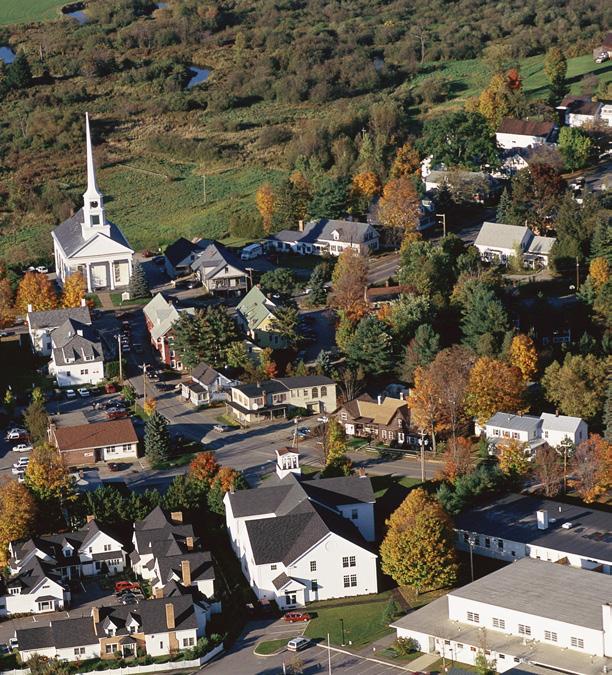
25 to 125 People per Square Mile
This uncrowded New England village has a lot of space for living. On average, between 25 and 125 people live in every square mile of this town.
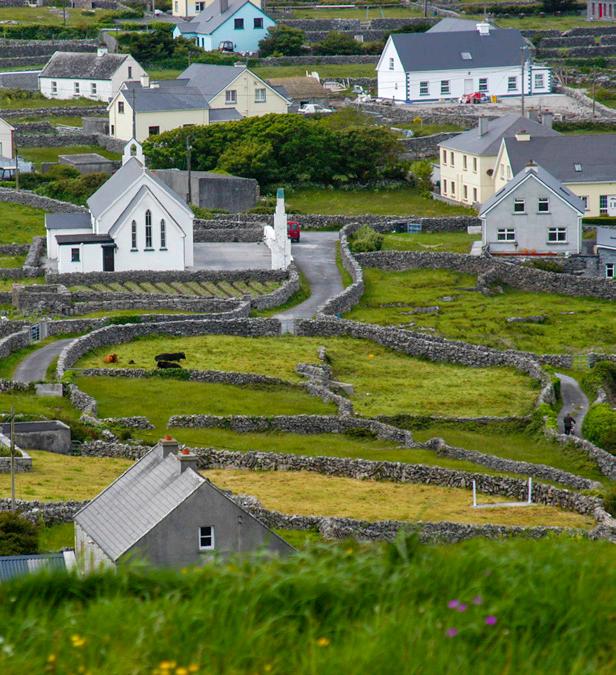
2 to 25 People per Square Mile
This photo of Ireland’s countryside shows a thinly populated country. Ireland has some big cities, but in most of Ireland, there is an average of 2 to 25 people per square mile.
Population Density Maps
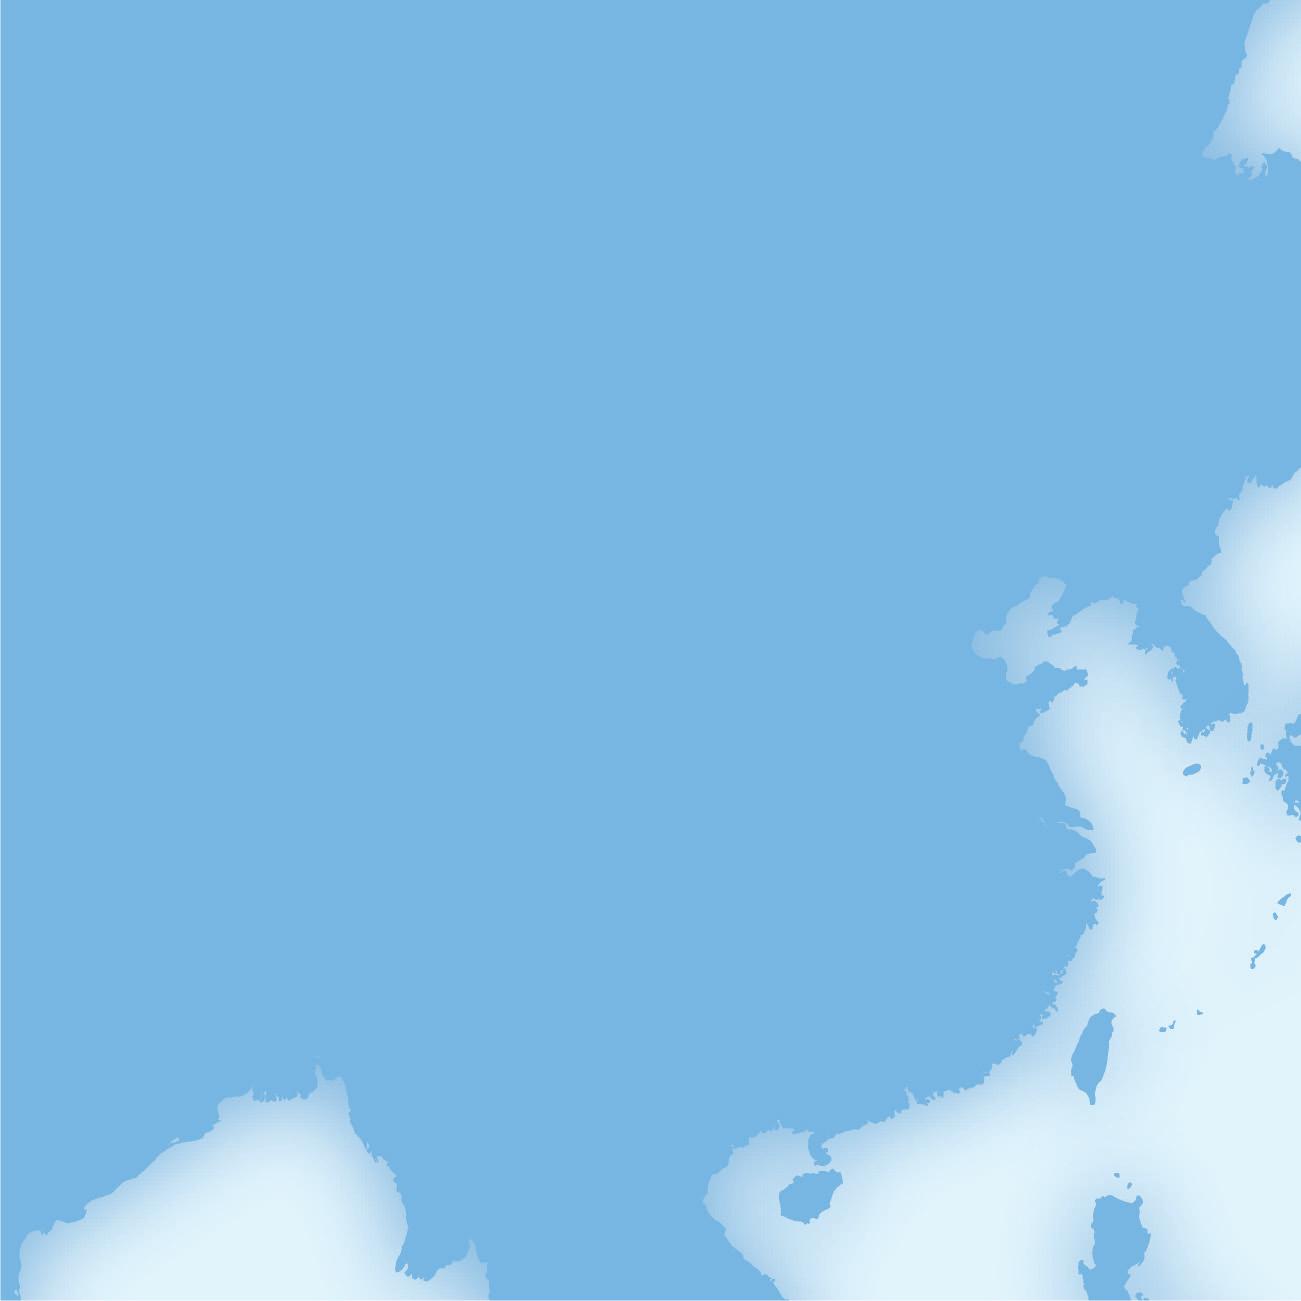
Population density maps show patterns of where people live. On this map, much of the North China Plain is colored purple, as are many coastal areas. These are the most crowded parts of China.
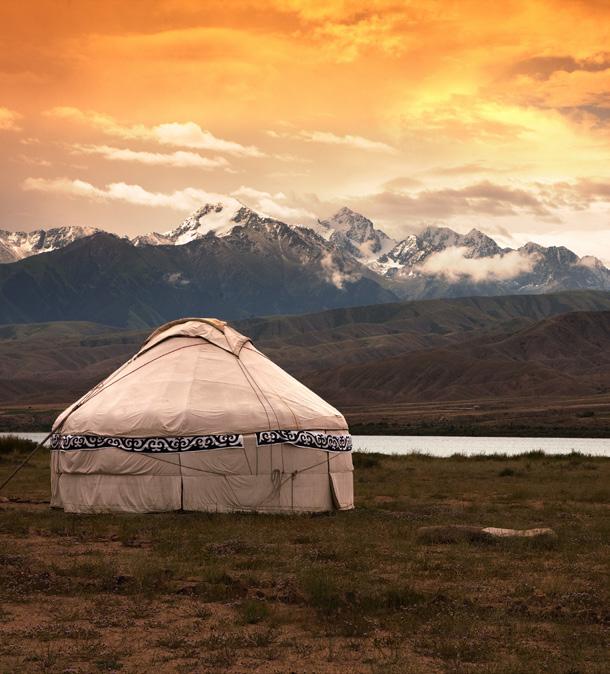
Fewer Than 2 People per Square Mile
Some people of Central Asia live in almost empty countries. Fewer than 2 people might live in every square mile of areas like this one.
Xi’an Ürümqi Qiqihar Jilin Anshan Fushun Tangshan Dalian Shijiazhuang Baotou Taiyuan Zhengzhou Qingdao Fuzhou QuanzhouXiamen Nanchang ChangshaGuiyang Kunming Lanzhou Jinan Changchun Shenyang Wuhan Chongqing Chengdu Harbin Tianjin Hangzhou Nanjing Suzhou Guangzhou Shenzhen Dongguan S outh China Se a East China Se a Yellow Se a C hangJiang(Yangtze R.) HuangHe(Yellow R ) MONGOLIA NORTH CHINA PLAIN RUSSIA KAZAKHSTAN INDIA NEPAL BHUTAN BANGLADESH MYANMAR (BURMA) THAILAND LAOS VIETNAM Taiwan JAPAN SOUTH KOREA NORTH KOREA PHILIPPINES CHINA Shanghai Beijing Hong Kong 60 N Tropic of Cancer 20 N 30 N 40 N 50 N 130 E 140 E120 E110 E100 E90 E80 E70 E Population DensityUrban Population Number of People Over 8,000,000 4,000,000–8,000,000 1,000,000–4,000,000 Per sq. km Over 100 50–100 10–50 1–10 Under 1 Per sq. mi. Over 250 125–250 25–125 2–25 Under 2 N S EW Lambert Azimuthal Equal-Area projection 0 50 0 kilometers 0 50 0 miles 250 250 TCI17 01 China Population Density, 20 09 GA_SE_02-6c.eps Cyan Magenta Yellow Black Fir st proof Population Density of China A Spatial Way of Thinking 35
Land Use and Resources
How people use land depends on the natural resources in their area. Some still get their food by hunting and gathering, and others grow crops and raise animals to sell. Many others make and sell goods created from natural resources. Natural resources are not evenly distributed around the world.
6. Economic Activity: Land and Resources
Do you like chocolate? This sweet treat comes from cocoa beans, the fruit of the cacao tree. The cacao tree grows only in hot, humid tropical areas near the equator. However, the factories that convert cocoa beans into chocolate are found mostly in Europe and the United States. The locations of cacao plantations and chocolate factories are examples of the kind of information you might see on an economic activity map.
Land Use Shows How People Make a Living Economic activity maps often show patterns of land use, or the way people use the land they live on to meet their needs. In some areas, for example, people use land for farming or for grazing large flocks of cattle, goats, and sheep. In other areas, they may use land for mining.
Natural Resources Affect Economic Activity Economic activity also depends on a country’s natural resources. Forestry, or the harvest ing of trees to produce wood products, is important in forested areas. Near oceans, fishing is an important industry.
Some resources lie concealed beneath the ground. This is true of mineral resources such as iron, copper, and gold. Fossil fuels such as oil, coal, and natural gas are extracted from Earth and burned to meet people’s energy needs. Uranium, another underground energy resource, provides fuel for nuclear power plants. In contrast, moving water is an easy-to-find energy resource. Dams can be built on rivers to harness the moving water’s energy and convert it to hydroelectric power.
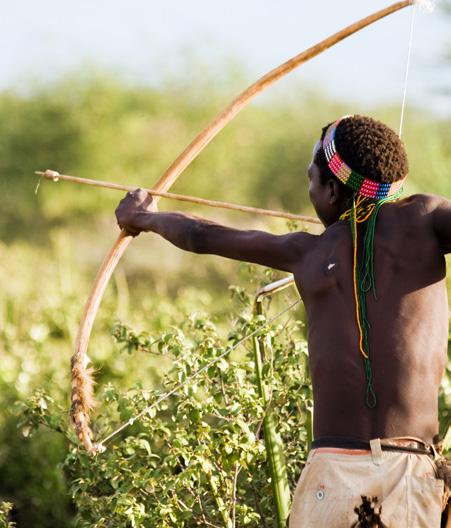
Hunting and Gathering in Tanzania
Many people still hunt animals and gather plants for food. Most live in small groups that move from place to place. This hunter in Tanzania uses a bow and arrow to hunt wild game.
Subsistence Farming in Myanmar
Some farmers grow only enough crops to feed their own families. This is called subsistence farming . Most farms in Myanmar are small and only provide enough food for the owners. Most of the subsistence farmers are women.

Commercial Farming in Brazil
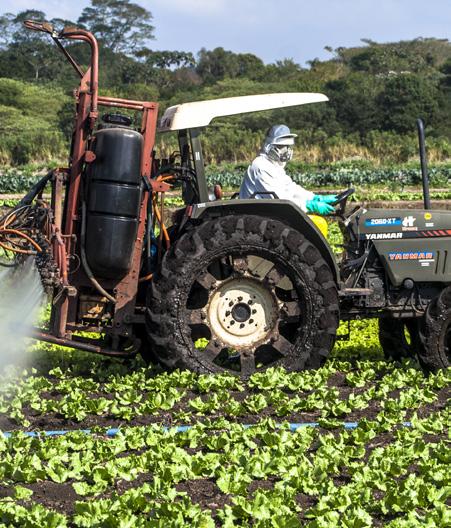
Commercial farmers raise crops or livestock to sell. Commercial farms are often very large. Many grow a variety of crops, while others specialize in just one crop.
Nomadic Herding in Nepal
Millions of people around the world are nomadic herders, moving around often to find food and water for their animals. This herder in Nepal uses the animals’ milk, hides, and other products.
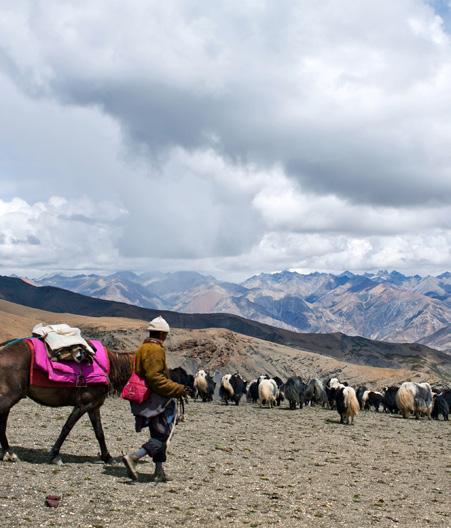
Lesson 236
Economic Activity Maps
The colors on this map show land use patterns in Europe. The most widespread land use is commercial farming. The symbols show the locations of important resources in Europe. Where is petroleum, or oil, found in Europe?
Livestock Raising in Australia
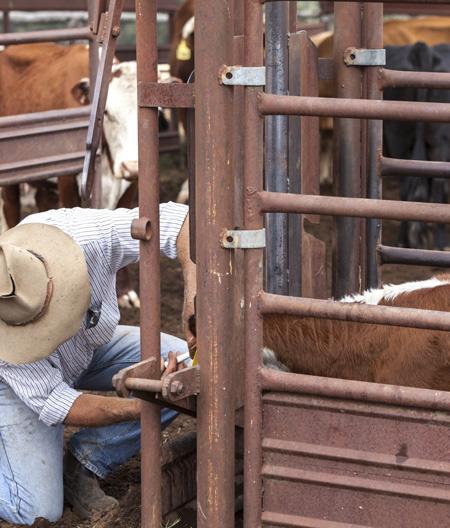
Cattle, sheep, and goats are raised on huge ranches. More than half of the farmland in Australia is used for raising sheep and cows. Australian livestock raisers lead the world in production of wool for clothing and carpets.
Commercial Fishing in Asia
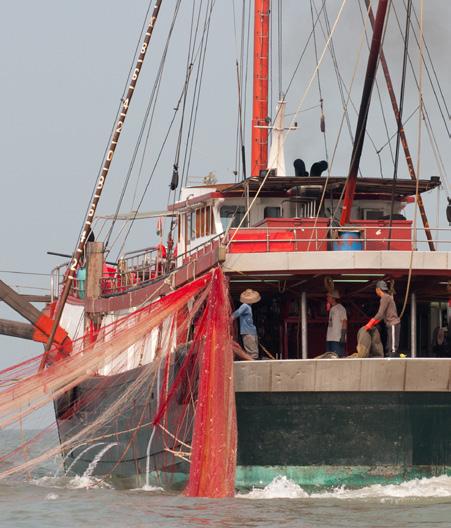
Many people make their living by fishing the world’s oceans, lakes, and rivers. The Pacific Ocean yields more than half the world supply of fish. In 2014, about 55 million people worked in the fishing industry, with the majority in Asia.
Forestry in the United States
Forestry uses trees as a resource for making homes, furniture, and paper. In 2014, the United States was the second leading supplier of wood in the world. The United States also uses up more forest resources than any other country.

Trade and Manufacturing in Germany
Manufacturing turns resources into goods to sell. In this German factory, workers assemble cars for shipment around the world.

ATLAN TIC OCEAN Black Sea Mediterranean Sea 60ºN 50ºN 40°N 70ºN ArcticCircle 10ºW 0º20ºW40ºW 20ºE 40ºE 60ºE N S E W 0 50 0 kilometers 0 50 0 miles Lambert Azimuthal Equal-Area projection 250 250 Land Use Resources Hunting and gathering Subsistence farming Commercial farming Nomadic herding Commercial fishing Forestry Trade and manufacturing Little or no activity Coal Hydroelectric power Iron Natural gas Petroleum (oil) Precious metals (gold, silver, copper) Uranium Economic Activity of Europe A Spatial Way of Thinking 37
Transportation Region Maps


A region is an area with one or more features that set it apart from other areas. A feature might be something physical like climate, or it might be a human feature such as roads and train lines. The network of routes on this map defines a transportation region in the San Francisco Bay Area.
7. Organizing Earth’s Surface: Regions




As you have learned, geographers use many kinds of maps to help make sense of the world. Some of these maps focus on physical geography, and others focus on human geography. All of them reveal interesting patterns to explore.
Geographers use these patterns to organize Earth’s surface into regions. A region is an area with one or more features that set it apart from other areas. As you will see, the concept of region allows geogra phers to divide the world in useful ways.

Unique Features Define a Region Think about the community in which you live. Does it have a business district? A shopping mall? An industrial park? A civic or community center? A residential neighbor hood? Each of these areas has unique features that set it apart from other parts of the community. You might think of one area as a business region, another as a shopping region, and still another as a residential region. Each region looks different, has a different purpose, and has different requirements.
San Francisco Bay Area Rapid Transit (BART)


Pittsburg/ Bay Point
North Concord/ Martinez
Richmond
El Cerrito del Norte
El Cerrito Plaza
Concord North Berkeley
West Oakland Ashby Downtown Berkeley
Embarcadero
Powell St. Montgomery St.
16th St. Mission Civic Center
24th St. Mission Balboa Park (Transfer Station)
Daly City
Colma

Glen Park
South
Pleasant Hill
Walnut Creek Lafayette Orinda

Rockridge MacArthur (Transfer Station) 19th St./Oakland Oakland City Center/12th St. (Transfer Station)Lake Merritt
Fruitvale


Coliseum/ Oakland Airport
AirBART Shuttle Oakland International Airport
San Francisco San Francisco International Airport (SFO)
San Bruno
San Francisco Bay
San Leandro Castro Valley Hayward South Hayward Union City

Bay Fair (Transfer Station) Dublin/ Pleasanton

West Dublin/ Pleasanton
Millbrae
S





Fremont
Warm Springs/ South Fremont
∆ ∆
N
EW Albers Conic Equal-Area projection 0 10 kilometers 0 10 miles 5 5 TCI17 02 BAR T map GA_SE_02-8a First proof cy an magenta yellow black
Lesson 238
Geographers define regions in several ways. The Sunbelt is a region made up of states in the southern and southwestern United States, from Florida to California, that is defined by physical, or natural, features. What sets the Sunbelt apart from other regions is its warm, sunny climate. The Corn Belt, in contrast, is a region made up of states in the center of the country, such as Indiana, Illinois, and Iowa, and it is defined by the human feature of raising corn as an important economic activity.
Dividing the World into Seven Major Regions The world is a very large place to make sense of. For this reason, geographers usually divide it into regions to study. These world regions are still very large, but each has its own distinct features.
This program divides the world into seven major regions. Each region is shown in a different color on the world regions map. Your study of a region will begin with an introduction to its most important physi cal and human features, in which you will begin to see what makes each of these regions unique.
Regions of the World
World Regions Maps
This program divides the world into seven large regions. Each region has certain distinct physical features. Each also has unique human features.
CANADA AND THE UNITED STATES
ARCTIC OCEAN ATLANTIC OCEAN PACIFIC OCEAN
AMERICA
EUROPE AND RUSSIA
SOUTHWEST AND CENTRAL ASIA MONSOON ASIA
AFRICA
INDIAN OCEAN
OCEANIA AND ANTARCTICA
SOUTHERN OCEAN
PACIFIC OCEAN
0 3,00 0 kilometers 0 3,00 0 miles Robinson projection 1,50 0 1,50 0 3,0 00 kilometer 3,0 00 N S EW
LATIN
A Spatial Way of Thinking 39
Monsoon Asia
UNIT 7
Introducing the Region: Physical and Human Geography Lesson 27 Waiting for the Rains: The Effects of Monsoons in South Asia Lesson 28 Tech Workers and Time Zones: India’s Comparative Advantage Lesson 29 Mount Everest: Climbing the World’s Tallest Physical Feature Lesson 30 China: The World’s Most Populous Country Lesson 31 Population Density in Japan: Life in a Crowded Country Lesson 32 The Global Sneaker: From Asia to Everywhere What patterns do you see in this photograph? See page 514 for details. TCI5 553 GA_SE_ML_07-1.eps Cyan Magenta Yellow Black Second Proof s
Monsoon Asia begins at the western bor der of India. From there, it reaches east to the Pacific Ocean. In the north, it spreads across China to the Korean Peninsula. A large peninsula south of China includes Vietnam, Laos, Cambodia, and Thailand. This peninsula is ringed by the South China Sea, the Gulf of Thailand, and the Bay of Bengal.
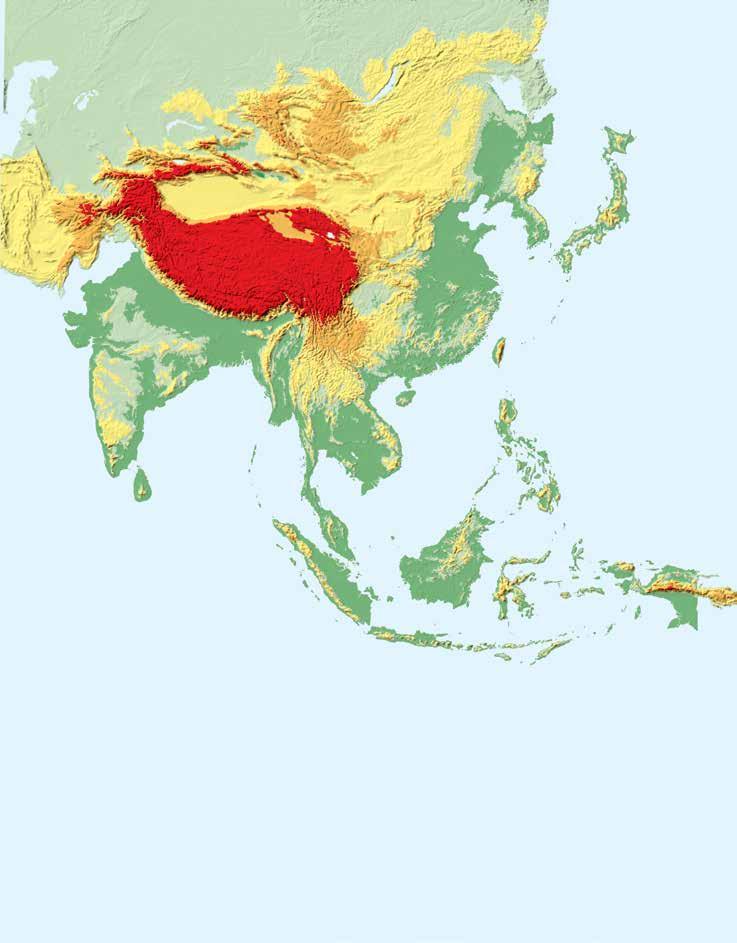
Physical Features of Monsoon Asia
This region has several countries made up of many islands. They include Japan, the Philippines, and Indonesia. Sri Lanka, Brunei, and East Timor are other island nations .
The countries of Monsoon Asia are often grouped into three sub-regions. These smaller regions are South Asia, East Asia, and South east Asia
Mt. Everest (29,035 ft 8,850 m) H I M A L A Y A S Plateau of Tibet Deccan Plateau Taklamakan Desert T I A N S H A N A LTA Y M T S . G o b i D e s e rt K U N L U N S H A N Andaman Islands Java Celebes Ceram Halmahera Mindanao LuzonHainan Malay Peninsula Greater Sunda Islands Kyushu Shikoku Honshu Hokkaido Mindoro Negros Samar Palawan New Guinea FloresSumbawa Sumba Borneo Nicobar Islands Batu Islands Mentawai Islands Sumatra Ryukyu Is l a n d s W e s t e r n G h a t s E a s t e rn Ghats AnnamCordill e r a Maoke Mts. Bay of Beng al S outh China Se a S eaof J apan (East S ea) East China Se a Yellow Sea Gulf of Thailand J ava Se a Banda Se a Celebes Se a Qinghai Hu Tonle Sap Brahmaputra RGangesR . IndusR. Amur R HuangHe(YellowR) Xi R. Mekon g R S a l w e e n R AyeyarwadyR Timor Sea Arafura Sea Sulu Sea P h i l i p p i n e S e a ChangJiang (YangtzeR.) INDIAN OCEAN PA CIFIC OCEAN BANGLADESH BHUTAN BRUNEI CAMBODIA EAST TIMOR JAPAN INDIA LAOS MALA Y SIA MALDIVES MONGOLIA NEPAL SRI LANKA NORTH KOREA MYANMAR (BURMA) CHINA PHILIPPINES SINGAPORE Taiwan THAILAND VIETNAM SOUTH KOREA I N D O N E S I A East Asia South Asia Southeast Asia Tropic of Cancer 20°N 30°N 40°N 50°N 60°N 10°N 0° Equator 10°S Tropic of Cancer 20°N 30°N 40°N 50°N 10°N 0° Equator 10°S 80°E 90°E 100°E 110°E 120°E 130°E 140°E 130°E 140°E 150°E 150°E 160°E 120°E110°E100°E90°E80°E 70°E 70°E Mountain peak Feet Over 10,000 5,001–10,000 2,001–5,000 1,001–2,000 0–1,000 Below sea level Meters Over 3,050 1,526–3,050 611–1,525 306–610 0–305 Below sea level Elevation N S EW Lambert Azimuthal Equal-Area projection 0 1,000 kilometers 0 1,000 miles 50 0 50 0 TCI17 13 1 GA_SE_27A-1a.eps Monsoon Asia Second proof 0p0.083
Introducing the Region: Physical Geography
Features
Mountains are the most commanding fea ture of Monsoon Asia’s landscape. The rug ged Himalayas form India’s northern border. They include Mount Everest, the world’s high est mountain. Like other mountain ranges, the Himalayas were formed when sections of Earth’s crust, called plates, collided. The two plates that came together to create the Himalayas are still colliding. As a result, the mountains are getting higher. But mountain building is a slow process. Mount Everest grows about half an inch a year.
South Asia
India makes up most of South Asia. Many people call India a subcontinent. Mountains and ocean separate India from the rest of Asia, so it is almost like a small continent.
Three important rivers begin in the Hima layas. They are the Indus, the Ganges, and the Brahmaputra. The Ganges and Brahma putra meet to form one of the world’s largest river deltas . Then, they empty into the Bay of Bengal.
The Ghats are another mountain range in India. The Eastern and Western Ghats run parallel to India’s coasts. Between them lies the Deccan Plateau. The Deccan Plateau cov ers most of southern India’s interior.
East Asia
East Asia’s landscape is diverse. Mountains surround the Plateau of Tibet. The Huang He begins on this plateau. So does the Chang
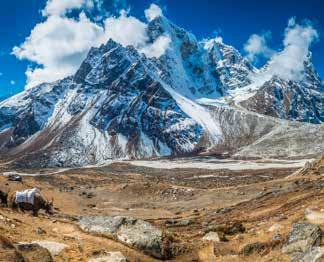
Jiang (Yangtze), the third longest river in the world. Both rivers run east across China before emptying into the Pacific.
North of the Tibetan Plateau lie the Taklamakan and Gobi deserts. The Gobi is one of the world’s largest deserts. According to legend, an angry Mongolian chief created it. He turned the land to desert when Chinese warriors forced him to leave this area.
The hilly Korean Peninsula and the chain of islands that make up Japan are also part of East Asia. Japan’s islands were formed by volcanoes .
Southeast Asia
Southeast Asia is not one big landmass . Instead, it is made up of peninsulas and islands. For example, the Malay Peninsula juts out into the South China Sea. Thousands of islands dot the seas of Southeast Asia. Some, like Borneo, are fairly large. Others are so small that they just look like specks on a map.
Physical
Monsoon Asia 391 15, 000 10, 000Elevation (feet) Elevation (meter s)5, 000 0 4,572 20, 000 6,096 3,048 1,524 0Se a L evel East China Sea Himalayas Plateau of T ibet Chang Jiang (Yangtze Ri ver) Ganges Ri ver TCI5 555 GA_SE_ML_07-3a.eps Third proof Elevation Profile of Monsoon Asia
The
Himalayas are the world’s highest mountain chain. 30°N Latitude
Climate
As the name of this region suggests, the climate of much of Asia is shaped by monsoons . Monsoons are strong winds that create the rainfall patterns in this region. In summer, monsoons blow from the ocean toward the land, bringing clouds that are heavy with rain.
In areas affected by monsoons, summers are very wet and winters fairly dry. Mumbai, India, for example, has a monsoon climate. It gets more than 70 inches of rain between June and September. But the same city gets little or no rain from December to April.
South Asia
South Asia’s climate ranges from arid to tropical. The northwest part of the subconti nent is dry. So is part of the Deccan Plateau in central India.
The Himalayas have a highlands climate. In a highlands zone, the climate gets colder as elevation increases. The Himalayas are very high and very cold. Snow covers the higher peaks throughout the year. In fact, the word Himalaya means “House of Snow.” Tropical climates dominate the rest of South Asia. A tropical wet climate makes the west coast hot and rainy all year long. Much of interior South Asia is tropical wet and dry
The mountain regions of Japan have severe winters with heavy snow.
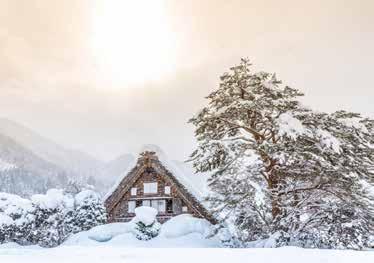
man in Bangkok is selling hats to protect people from the tropical sun. In what months will people trade their hats for umbrellas?
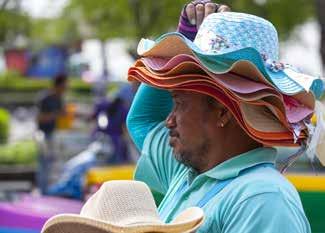
The area has one rainy season and one dry season. Temperatures remain fairly high year-round. Finally, north central India has a humid subtropical climate, with hot, humid summers and mild winters.
East Asia
Like South Asia, East Asia has a variety of climates. A highlands climate is found in the Plateau of Tibet. Arid and semiarid areas bor der this landform. They include the Gobi and Taklamakan deserts.
The Korean Peninsula has a humid continental climate. People there endure hot, steamy summers. Then, they face very cold winters. Parts of Japan and eastern China experience a humid subtropical climate. They have hot, steamy summers and mild winters. Rain falls fairly evenly throughout the year.
Southeast Asia
Southeast Asia is tropical. Most areas nearest the equator have a tropical wet climate. It is hot and rainy all year in the Philippines, Singapore, and most of Malaysia and Indonesia. Other parts of Southeast Asia have a tropical wet and dry climate. The weather is hot all year with both rainy and dry seasons in most of Thailand, Cambodia, and southern Vietnam.
392 Unit 7 This
GA_SEU_07-04b_rv1 C M Y K 2nd Pr oof 11 -1 -20 05 JF MA MJ JA SO ND 12 10 8 6 4 2 0 90 70 50 30 10 –1 0 –3 0 Bangkok, Thailand A verage temperature (°F) Month A verage precipitation (inches)
Vegetation
The vegetation in Monsoon Asia varies as much as the region’s climate does. In the drier parts of the region, only desert scrub survives. But in the tropical zones, lush plants thrive and form thick rainforests
Elevation also has a big effect on Monsoon Asia’s plant life. Remember that in a highlands climate, temperature varies with elevation. Vegetation varies with elevation as well. The region’s highest mountains are so cold that they are covered by ice and snow. Very little can grow in this ice cap vegetation zone.
South Asia
The plant life of South Asia varies with the climates and the altitude. The driest land supports only desert scrub. Tropical grass land covers much of central India. Mixed forest appears on the lower slopes of the Himalayas. In the tropical climate zones, broadleaf evergreen forest is common.
East Asia
Because East Asia has so many climate zones, this sub-region supports many different types of plant life.
The Plateau of Tibet and mountainous parts of China support highlands vegetation. The large deserts are home to desert and desert scrub vegetation. Much of the northern part of this sub-region is too dry for trees. But grasses grow well there.
The warmer and wetter areas of East Asia support forests. Northeast China, the Korean Peninsula, and Japan are covered with mixed and deciduous forest . Many pines grow on Japan’s mountains and along its seashores.
Much of southeastern China has a humid subtropical climate. Broadleaf evergreen forests thrive where it is warm and rainy.
Southeast Asia
Just about all of Southeast Asia is warm and wet. Rainforests and tropical grassland cover most of this region. Over time, much of the rain forest has been cleared to raise crops that do well in the tropics. People grow rice, sug arcane, tea, and rubber.
Many types of bamboo grow well here. Bamboo is a grass. But unlike most grasses, it can grow to huge sizes. Some types of bamboo may reach over 100 feet high and have stems a foot in diameter. Bamboo stems are made into everything from houses to tools. Bamboo probably has more uses than any other plant in tropical areas.
Tibet is often called the “Roof of the World.” Yaks graze in the highland meadows on the Plateau of Tibet, which lies more than 10,000 feet above sea level.

Monsoon Asia 393
There are 25 countries in Monsoon Asia.
Some, like China, are very old. Others, like East Timor, are quite new.
Much of Monsoon Asia is densely settled. China is the world’s most populous country. It has more than 1.4 billion people. India is a close second with more than a billion people.
With so many people,
no surprise that
the world’s largest and most crowded cities
found in Monsoon Asia. They include Kolkata
Mumbai, India; Dhaka, Bangla desh; Shanghai, China; Seoul, South Korea; Tokyo, Japan; Manila, Philippines; and Jakar ta, Indonesia.
it is
some of
are
and
N S EW Lambert Azimuthal Equal-Area projection 0 1,000 kilometers 0 1,000 miles 50 0 50 0 BANGLADESH BHUTAN BRUNEI CAMBODIA EAST TIMOR JAPAN INDIA LAOS MALAYSIAMALDIVES MONGOLIA NEPAL SRI LANKA NORTH KOREA MYANMAR (BURMA) CHINA PHILIPPINES SINGAPORE Taiwan THAILAND VIETNAM SOUTH KOREA Hong Kong (China) Macau (China) I N D O N E S I A Tropic of Cancer 20°N 30°N 40°N 50°N 60°N 10°N 0° Equator 20°S 10°S Tropic of Cancer 20°N 30°N 40°N 50°N 10°N 0° Equator 20°S 10°S 80°E 90°E 100°E 110°E 120°E 130°E 140°E 130°E 140°E 150°E 150°E 160°E 120°E110°E100°E90°E80°E70°E60°E 60°E 70°E New Delhi Kathmandu Thimphu Colombo Male Dhaka Yangon (Rangoon) Bangkok Hanoi Bandar Seri Begawan Dili Vientiane Kuala Lumpur Jakarta Manila Taipei Beijing Ulaanbaatar Seoul TokyoPyongyang Phnom Penh TCI5 556 GA_SE_ML_07-6.eps Introducing the Region: Human Geography 394 Unit 7 Political Boundaries of Monsoon Asia
History
Some of the world’s earliest civilizations arose in Monsoon Asia. At different times, rulers united parts of the region into empires Later, European countries colonized much of the region. In modern times, most Asian peoples have gained their independence.
Early Times
East Asia’s first civilization took root in the Huang He valley. China was split into many kingdoms early in its history.
In 221 b.c.e., one of these kingdoms, the Qin, united China. The name China comes from the word Qin. The first ruler of this empire, the Emperor Qin, built China’s first Great Wall. From the first emperor until modern times, China was ruled by a series of dynasties, or ruling families. When one fam ily lost power, another rose to take its place.
South Asia’s first civilization arose in the Indus River valley around 2500 b c e One of its main cities was Mohenjo-daro. As many as 40,000 people lived there. The people of Mohenjo-daro enjoyed comforts that were very advanced for that time. Their homes had indoor bathrooms that drained into a city sewer system.
No one knows how the Indus Valley civilization ended. But by 1700 b c e , it had vanished. For centuries after that, South Asia was a land of small kingdoms.
In the 320s b.c.e., a powerful family called the Mauryas saw how weak these kingdoms were. The Mauryas conquered most of
them and united India into one empire. The Mauryan Empire lasted for about 130 years.
Conquests and Colonies
After the Mauryan Empire fell, India once more broke apart. Then in 1526, invaders from Central Asia conquered India. The invaders, called Mughals, united India as a new empire. The Mughals ruled India into the early 1700s.
Starting in the late 1400s, Europeans colonized many parts of Monsoon Asia. The Spanish set up trading posts in the Philippines. The Dutch started colonies in Indonesia. The British began businesses in India. By the late 1700s, the British ruled most of India.
In the 1800s, France joined the race for colonies. The French took over much of Southeast Asia. They controlled the area that is now Vietnam, Laos, and Cambodia.
The Modern Era
In the last half-century, most colonies in Monsoon Asia freed themselves from European control. India gained its indepen dence from Great Britain in 1947. The French left Southeast Asia in the 1950s.
Parts of Monsoon Asia have prospered in recent years. Japan is now one of the world’s leading industrial countries. Other areas, such as South Korea, Taiwan, and Singapore, have also developed modern industrial economies. However, Monsoon Asia has developed unevenly. Some people live very well. But in many parts of the region, most people still live in poverty.
Monsoon Asia 395 Monsoon Asia Timeline Early Times Conquest and Colonies Modern Era 5000 B.C.E. 0 500 C.E. 1000 C.E. 1500 C.E. 2000 C.E. 1565–1571 Spain conquers the Philippines2500–1700 B.C.E Rise and fall of civilization along Indus River 3000–1700 B.C.E Civilization arises along Huang He 221–210 B.C.E Emperor Qin unites China Late 1400s–mid 1900s European colonization 1757 British colonize India 1945–present Industrialization of Asia 1947 India wins its independence 320s B.C.E Mauryas unite India
Population
About 3.9 billion people live in Monsoon Asia. That is more than half the world’s people. China, India, and Indonesia are three of the world’s five most populous countries.
Monsoon Asia is mostly rural . However, cities are growing quickly. Every year, large numbers of people leave the countryside to look for work in cities. As a result, many cities suffer from overcrowding. The people who live there are often unemployed and poor. Monsoon Asia is a region with many religious traditions. In India and Nepal, most people are Hindu. Islam also has many followers in Monsoon Asia. In fact, Indonesia has one of the world’s largest Muslim popula tions. Nine out of ten people there are Muslim.
Buddhism is the main religion in Southeast Asia. Most people in Japan practice Shinto or Buddhism. Confucianism began in China about 2,500 years ago. Its influence is still felt today. Christianity also has followers in Monsoon Asia, especially in the Philippines.
Hinduism,
396 Unit 7 Sources: United Nations Department of Economic and Social Affairs, Population Division. Encyclopaedia Britannica. Monsoon Asia: Urban and Rural Population, 2007 Monsoon Asia: Population Growth, 1950–2050 Monsoon Asia: Major Religions GA_SEML_07-08a_rv1 C M Y K 2nd Pr oof 11 -3-20 05 Christianity, 6.9% Buddhism, 13.4%
28.4% Islam, 16.1% Indigenous, 10.1% Other, 1.4% No religion, 23.6% GA_SE_27A-4b_rv1.eps C M Y K 1st P roof 5-25-20 09 Urban, 46% = Rural, 54% 10% of the total population GA_SE_27A-4c_rv1.eps C M Y K 1st P roof 5-25-20 09 5,000 4,500 4,000 3,500 3,000 2,500 2,000 1,500 1,000 500 0 1950 1955 1960 1965 1970 1975 1980 1985 1990 1995 2000 2005 2010 2015 2020 2025 2030 2035 2040 2045 2050 Year Population (millions of people) Year 1950 1,335 million Year 2010 3,800 million Year 2050 4,606 million estimated
Economic Activity
The economy of Monsoon Asia is a mix of old and new. Most people still work to feed themselves by farming and fishing. At the same time, parts of the region have become important centers for industry and finance.
The many people of Monsoon Asia who live near the seacoast have always fished for food. But fishing has also become a big business in Asia. Commercial fishing is different from traditional small-scale fishing. Commercial fishing boats can gather huge amounts of fish in their nets. Most of what they catch is processed, packaged, and sent all over the world.
Resources
Monsoon Asia is rich in resources. Northern China has large coal deposits. It produces more coal than any other country on Earth. Southeast Asia has much of the world’s tin. Petroleum reserves lie beneath Indonesia. In addition, the region’s many riv ers are well suited for hydroelectric power.
Indian villagers examine the fish they caught. Fishing is a major part of Monsoon Asia’s economy.
Land Use
Most people in Monsoon Asia still live off the land. Some are subsistence farmers. They grow enough to feed their families. Rice is the staple for many of them. Others are com mercial farmers. They grow crops for export, including tea, cotton, spices, and tobacco.
More than 90 percent of the world’s rub ber is produced in Southeast Asia. Rubber comes from the sap of the rubber tree. To get the sap, a rubber tapper cuts a diagonal shaving of bark from the tree. A metal spout and cup are attached to the bottom of this cut. Sap oozes from the cut and drips into the cup. Tappers collect about a teacup of sap each time they tap a tree.
China’s commercial fishing industry is among the world’s largest. Indonesia exports large amounts of shrimp and tuna. India, Japan, and South Korea also have large fish ing industries.
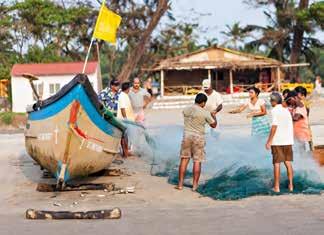
Nomadic herders live in some remote parts of Monsoon Asia. Their lives are similar to their ancestors’ lives. They herd cattle, goats, sheep, and yaks. Other parts of Monsoon Asia, however, have booming modern econo mies. International trade is strong in Taiwan, Singapore, Hong Kong, and South Korea. China is a major producer of consumer goods, as well as machinery. Japan is a world leader in the production of cars and electronics.
The Three Gorges Dam, on China’s Chang Jiang river, was completed in 2009. It produces more hydroelectric power than any other dam in the world. This power will support the growth of industry across China.
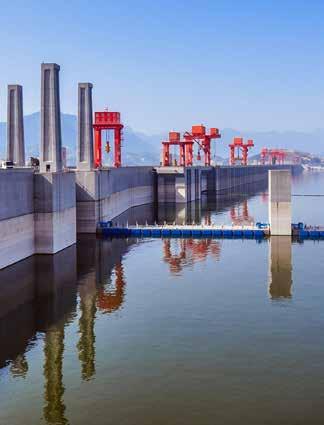
Monsoon Asia 397

Lesson 27398
Waiting for the Rains: The Effects of Monsoons in South Asia
Introduction
Every June, all of India looks to the sky. When the rains come late, people begin to worry. Indian astrologers call this time of the year rohini a time when hot, dry winds swirl dust across the parched plains. Women in rural areas might have to walk for miles in 115°F heat to the nearest water source, sometimes collapsing from heat exhaustion.
As one blazing day follows another, farmers throughout India pray for rain. Rain is critical for agriculture in India, which accounts for roughly 15 percent of the country’s economy, and employs over half of the country’s 1.3 billion population. Even animals in the region crave the rains, like the crocodiles of northern India. These animals can only lay their eggs in flooded, moist riverbanks.
Expectations build as the skies finally darken, heralding the arrival of monsoons. These strong and violent seasonal winds blow in from the ocean each summer, carrying clouds heavy with moisture. Almost all of the rain that South Asia receives each year is from these summer storms. Each year, the region celebrates as sheets of rain pound the dry land.
In this lesson, you will find out why the monsoons blow across South Asia each year, and you will explore how monsoons affect the climate of four cities in this region. Finally, you will discover how people in these cities adapt to waiting for the rains each year.
Essential Question Graphic Organizer
How does climate influence human activity in a region?
This climagraph shows average monthly temperatures and precipitation in the city of Mumbai, India. Notice the bars. They show the average precipitation for each month. Also notice the line. It shows average monthly temperatures in the city. Keep this climagraph in mind as you try to answer the Essential Question.
A woman
Kolkata.
wades through the flooded streets of
JF MA MJ JA SO ND 35 30 25 20 15 10 5 0 11 0 90 70 50 30 10 −1 0 −3 0 Mumbai, India A verage temperature (°F) Month A verage precipitation (inches) LESSON 27 399
New Delhi’s Monsoon Climate
Monsoon winds affect the climate of New Delhi, the capital of India. The city sits on the edge of the Thar Desert in northern India. From October to May, it stays mostly cold and dry. During the summer monsoon months, rain can drench the city.
1. The Geographic Setting
South Asia juts out into the Indian Ocean like a giant triangle, form ing a very large peninsula that is also known as the Indian subcontinent. The Himalaya mountain range cuts this subcontinent off from the rest of Central Asia. One out of every four people on Earth lives in South Asia. Most of them are farmers who annually anticipate the monsoons.
Changes in Atmospheric Pressure Create Monsoons Have you ever heard a weather forecaster mention areas of high or low pressure? These terms refer to high or low atmospheric pressure, which is the weight of the atmosphere pressing down upon the surface of Earth. Falling cool air creates areas of high pressure, while rising warm air cre ates areas of low pressure.
In a high-pressure area, cool air from the upper atmosphere presses down toward Earth’s surface and, in the process, causes atmospheric pressure to increase. With this downward pressure, very little surface air can rise into the upper atmosphere to form clouds. High pressure generally means sunny days and no rain. The opposite happens within a low-pressure area, where warm surface air moves easily into the upper atmosphere. If this air is moist, it forms clouds that bring rain.
Air from high-pressure areas will naturally flow into low-pressure areas. This movement of air creates wind. During the spring and sum mer months, the air over the South Asian landmass warms up faster than the air over the Indian Ocean. As this hot air rises, it creates a low-pressure area. As a result, the cool, moist air that is over the Indian Ocean flows into the area of low pressure. This movement of air creates the summer monsoons.
During the fall and winter months, the air over South Asia cools and sinks, forming an area of high pressure. This high-pressure area keeps the moist air from the summer monsoons far out to sea. From October to March, only a small amount of rain falls throughout South Asia. During this long dry period, South Asians must manage dusty fields and dwindling water sources.
Mountain Ranges Create Rain Shadows Mountains affect where summer storms will drop their moisture. A mountain slope facing upwind, or against the direction of the monsoon winds, generally receives a large amount of rain. In contrast, a slope facing downwind, or in the same direction the wind is blowing, will receive far less rain. Geographers call the impact that mountains have on rainfall patterns the orographic effect
The orographic effect works this way. When clouds blow up against mountains, the moist air rises up along the slopes of the mountains. As the air rises, it gradually cools. Since cooling air cannot hold as much moisture as warm air, the clouds release their moisture as precipita tion—either rain or snow.
After the clouds have crossed over the mountains, little moisture remains in them. Consequently, people living on the downwind side of the mountains receive very little rainfall. This dry area is called a rain shadow. People living in a rain shadow have to adapt to life with little rain.
GA_SE_27-02a_rv1 C M Y K 2nd Pr oof 9-26-20 05 JF MA MJ JA SO ND 12 10 8 6 4 2 0 90 70 50 30 10 −1 0 −3 0 New Delhi, India Month A verage temperature (°F) A verage precipitation (inches) Lesson 27400
weight
point of the surface
clouds
high-
The Orographic Effect

Monsoons and Mountains

Geoterms atmospheric pressure the
of the atmosphere pressing down on any
of Earth. Air sinks in
pressure areas, and few
form. Air rises in low-pressure areas to form clouds that produce rain. Arabian Se a INDIAN OCEAN Bay of Beng al Andaman Sea GulfofOmanPersianGulfR e d S e a INDIA BANGLADESH WESTERN GHATS HIMALAYAS DECCAN PLATEAU HIMALAYAS N S EW 0 50 0 kilometers 0 50 0 miles Eckert III projection 250 250 Mumbai (Bombay) DhakaKolkata Pune Jodhpur New Delhi Capital city City TCI17 10 0 GA_SE_27-02b.eps South Asia’s Summer Monsoons Second Proof Cyan Magenta Yellow Black GA_SE_27-02c_rv1 Western Ghats Moistair Rain shadow Upwind Cooling Dryair Downwind Indian Ocean Warming South Asia’s Summer Monsoons
Summer monsoon winds carry moist air from the Indian Ocean. These winds strike the Western Ghat mountain range in western India. As air rises, it cools and drops its moisture as rain. Cities on the upwind side of the mountains receive plenty of rainfall. Cities on the downwind side, in the rain shadow, receive relatively little.
Waiting for the Rains: The Effects of Monsoons in South Asia 401
Preparing for the Rain
The people of Dhaka expect flooding when the summer rains arrive. One way they have adapted is by raising their homes up on stilts. A raised home is not convenient most of the year, when everything has to be carried up and down stairs or ladders. During the flooding months, however, raised homes can save lives.
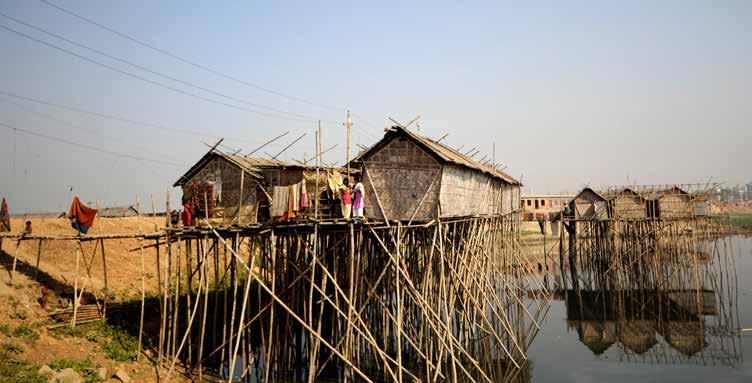
2. The Wet Months in Dhaka, Bangladesh
About 17 million people live in Dhaka, the capital city of Bangladesh. For the residents of Dhaka, the summer months can be difficult. In sum mer 1996, the homes of approximately 3 million people were flooded.
Two years later, about 1,500 people perished during summer floods. Their deaths were attributed to everything from drowning to disease. In summer 2017, severe rains left much of Dhaka under water.
One of the World’s Wettest Capitals Most of Bangladesh lies on a river delta that seldom rises more than 30 feet above sea level. Rice, a crop that grows best in warm, shallow water, thrives here. In the sum mer, monsoon rains often raise the rivers to dangerously high levels. When the rivers flood, it is difficult for rice crops to survive.
Dhaka, which is located in the center of Bangladesh, has one of the wettest climates on Earth. Up to 80 inches of rain falls there each year, with most of this rain coming during the summer months. From November to April, the weather is mostly dry.
Flooding is not Dhaka’s only problem. In addition, Bangladesh is often pounded by tropical cyclones, otherwise known as hurricanes. Because Dhaka is situated at sea level, the city is often lashed by high winds and waves during these violent storms.
Life Depends on the Rains Bangladesh’s economy depends on agri culture. Nearly half of the country’s population farms the country’s rich delta soil, relying on the monsoon rains to water their fields. When the summer rains are late, crops like rice, sugarcane, tea, and tobacco suffer. Sometimes the monsoons bring too much rain too quickly, flooding the fields. The deep water makes it impossible to plant and harvest the crops.
The city of Dhaka also suffers from too much rain. When the city’s streets flood, car and bus traffic comes to a halt. Schools and businesses close down because no one can get to work. Meanwhile, floodwaters pol lute the city’s drinking water supply, creating conditions in which disease spreads rapidly. Children growing up in Dhaka learn that the same rains that cultivate life in the fields can also end life in the city.
3. The Dry Months of Jodhpur, India
The Mehrangarh Fort rises out of the desert like a towering giant, looking down on the “Blue City” of Jodhpur, India. The city gets its nick name from the fact that most of the houses are painted blue. Some people say that this color is used to keep away mosquitoes or termites. In July 2002, nearly half of Jodhpur’s crops could not be planted because the summer monsoons were late, starting the worst drought in more than 40 years.
A City on the Edge of a Desert Jodhpur sits at the eastern edge of the Thar Desert in northern India. This region is a leading producer of cattle, spices, and grains. It has a typically semiarid climate, with hot, dry weather throughout most of the year.
The people living in and around Jodhpur are accustomed to their semiarid climate. In most years, the city receives less than 20 inches of rain. The average temperatures do not drop below 60°F, even in the winter. Summer monsoons bring much-needed rains from June to September.
Water Is a Critical Resource Approximately half of the people living in Jodhpur work in agriculture, but farming is difficult in this dry region. The desert soil requires a great amount of water to produce crops, and farmers depend on the monsoons for that water. Every year, people wonder how much rain will come and when will it arrive.
The rains come late in some years. Sometimes too little rain falls, resulting in crop failures and shortages of drinking water. Families that run out of food sometimes survive by eating samas, a wild grass. As people grow weak from hunger, disease spreads more easily.
The people of Jodhpur have learned to adapt to their semiarid cli mate. In addition to growing crops, many farmers raise livestock, which can survive on native plants when crops fail. To conserve water, some farmers have begun to use drip irrigation, in which water drips directly onto a plant’s roots. With the use of this irrigation method, little water is wasted as runoff or to evaporation. This careful use of water makes sense in Jodhpur, where every drop counts.
The Blue City Beneath the Fort
The Mehrangarh Fort was built in 1459.
It sits on a tall hill overlooking Jodhpur. Because the buildings of this city are painted blue, Jodhpur has earned the nickname the Blue City.

The Dry Plains Near Jodhpur
Water is a luxury in the area around Jodhpur. Women must sometimes walk miles in scorching heat to fetch drinking water for their families. Wind can pick up the thin dust on the arid plains, creating dust storms. These dust storms are common before the summer monsoons.

Waiting for the Rains: The Effects of Monsoons in South Asia 403
Life Continues Despite Floods
Monsoon rains often fill the streets of Kolkata. Buses and cars can’t drive through flooded streets, but rickshaws can. A rickshaw is a small cart with two or three wheels. It is pulled by someone who walks or bicycles in front of it. Rickshaw drivers are highly valued during the summer monsoon season.
4. Waiting for the Rains in Kolkata, India
Kolkata is a city of contrasts that has been described as both the “City of Joy” and the “Dying City.” Its modern skyscrapers tower over the muddy Hooghly River, which is a branch of the Ganges River. When the monsoons come during the month of June, the river floods. After a rain shower or two, Kolkata finds itself knee-deep, or even neck-deep, in water.
Wet Summers and Dry Winters Around 12 million people call Kolkata home. About one-third of the city’s residents live in slums.
The city’s winters are dry and pleasant, with moderate winds blow ing in from the north. From June to September, the winds shift direc tions, as the moist monsoon air blows in from the Indian Ocean. The monsoons can dump nearly 50 inches of rain on the city in only four months, and temperatures can soar to 100°F. In this way, these summer rains present a great challenge to the people of Kolkata.
Monsoon Rains Begin and End Life Kolkata floods easily. The city’s old canals overflow quickly when rainwater fills the streets, and buses and taxis can’t navigate the flooded roads. Children must wade to school through waist-high water and spend the day in wet clothing. Nevertheless, the monsoon rains are welcome because the farmers need the rain to water their crops. The rains also provide relief from the sticky summer heat.
Kolkata has found ways to deal with the summer floods. In the past, a system of canals drained floodwater out of the city. This system was later abandoned in favor of modern streets and sewers, but when too much rain falls, garbage clogs the old canals. Standing water in the flooded streets breeds mosquitoes. Diseases that are carried by mosquitoes, such as malaria, then spread quickly, causing people to get sick or die.
Today, officials in Kolkata are working to rebuild the city’s antiquated canals to help with the flooding. Sewer lines are being repaired so that they can carry more water during storms. The city is also working to keep the river clear of debris so that more water can drain downstream during heavy rains.
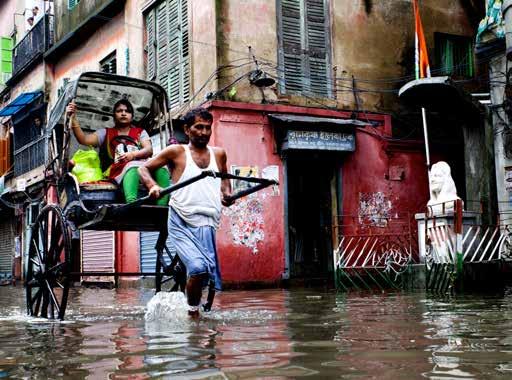
Lesson 27404
Living in the Rain Shadow: Pune, India
The city of Pune, located on the Deccan Plateau in western India, is less than 100 miles from Mumbai—a short two-hour drive. Yet, Mumbai receives at least 70 inches of rain during the summer monsoons. In contrast, precipitation in Pune often totals less than 30 inches for the entire year.
A Year-Round Dry Climate Between Mumbai and Pune lies part of a mountain range known as the Western Ghats. As the monsoon winds rise up the slopes of these mountains, the air cools and releases its moisture. By the time the monsoon winds reach the downwind side of the mountains, the air retains very little moisture.
Pune sits in a rain shadow on the opposite side of the Western Ghats from Mumbai. While the coastal city of Mumbai must prepare for heavy rain, Pune is spared from flooding. For the majority of the year, the air is dry and pleasant, and the monsoons bring welcome rains from about June to September.
Limited Rainfall Makes Water Precious The people of Pune have learned to survive with little water. Farmers here raise sugarcane, a crop that requires large quantities of water. They also plant crops that are more drought resistant, such as sugar beets.
Pune has also tried to increase its rainfall with cloud seeding, a process that involves dispersing chemicals into the air in order to cause rain. Rain falls when the water vapor in clouds condenses into droplets, which form around tiny specks of ice in the air. Under the appropriate conditions, clouds can be seeded to encourage this condensation to occur. Usually, this seeding is accomplished by spraying the clouds from the air with tiny amounts of either silver iodide or dry ice. The hope is that water droplets will form around these “seeds.”
It is difficult to determine the effectiveness of cloud seeding in the Pune region because no one knows the amount of rain that might have fallen without seeding. However, for people living in a rain shadow, the possibility for more rain makes seeding worth the expense.
Summary
In this lesson, you learned how monsoons affect the climate of South Asia. The differences in atmospheric pressure between the land and sea cause the summer monsoons, and these winds bring both welcome rain and deadly floods to coastal cities. The orographic effect also shapes the climate of this region. Cities on the downwind sides of mountains often lie in a rain shadow. Unlike their coastal cousins, the people in these cities must adapt to limited rainfall.
Other regions also have monsoons. From November to March, for example, northern Australia braces for its monsoon season. Monsoons hit the West African coast from June to September. In Arizona, monsoon rains arrive in the middle of summer, as moist air from the Gulf of Mexico blows inland.
Wherever people live, the climate will affect their activities. Think about this as you examine the variety of climates around the world in the next section.
Living in a Rain Shadow
Pune lies in a rain shadow. Farmers in the area can grow crops like rice only if monsoon rains are plentiful. In these paddy fields near Pune, people work to cultivate rice, aided by the monsoon rains.

5.
Waiting for the Rains: The Effects of Monsoons in South Asia 405
The map shows climate zones around the world. The three climagraphs show the average monthly temperatures and precipitation in three cities.
How might climate affect the type of housing people build? In hot and humid tropical climates, people build homes that will allow breezes to flow through. In dry, desert climates, home builders make windows small to keep out the sunlight. In very wet climates, people build houses that are elevated on stilts since raised houses will stay dry when the land below floods. In regions with tundra climates, houses are also raised off the ground, thereby allowing cold air to flow underneath the buildings. Otherwise, the warmth of a house could melt the permafrost, or the permanently frozen ground, below. If the permafrost were to melt, the house might sink into the mud.
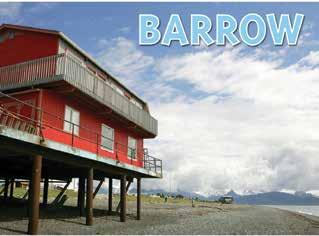
How might climate affect the type of clothing people wear? People who live in regions with arid climates often wear loose-fitting, flowing clothes. They want to cover up most of their skin to avoid being too exposed to the sun. People who reside in more temperate places like London, England, have come to expect daily downpours, so they keep umbrellas and raincoats handy.
How might climate affect what people do for fun? In Alaska, dog sledding and ice fishing are common cold-climate sports. Surfing is popular in Hawaii. People in North African and Middle Eastern countries enjoy camel racing. In Namibia, people gather at the dunes in the Namib Desert to sandboard. In a motion similar to snowboarding, sandboarding involves sliding down a slippery slope of sand on a wooden board.
Dear pen pal,
Today the thermometer is below zero and it’s snowing! But we are keeping warm. Luckily, our home is wellinsulated from the cold. It is also raised up on pilings. If we didn’t do this, our house would melt the frozen ground below. Then we would sink into the mud!

Global Connections
A TLAN TIC OCEAN A PA CIFIC OCEAN SOUTHERN OCEAN 40°N 20°N 20°S 40°S 60°N 20°W60°W80°W100°W120°W 20°W60°W80°W100°W120°W140°W160°W 0° Equator Tropic of Cancer Tropic of Capricorn 0 3,000 kilometers 0 3,0 00 miles Robinson projection 1,50 0 1,50 0
Write soon, Leah GA_SE_27_8b_rv1 C M Y K 2nd Pr oof JF MA MJ JA SO ND 6 5 4 3 2 1 0 90 70 50 30 10 −1 0 −3 0 Barrow, Alaska Month A verage temperature (°F) A verage precipitation (inches) Climate Zones Around the World Lesson 27406
Dear pen pal,
Today I am going to a camel race with my family. It will be very hot, so I’ll wear a haik. That’s a loose-fitting garment that I wrap around me to keep me as cool as possible. Camel racing is popular here, along with camel dancing. The riders make their camels move to the beat of the music.
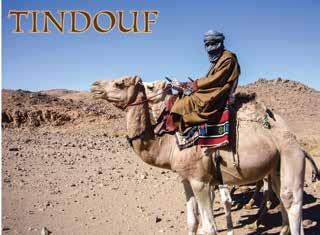
Your friend, Ezina

Dear pen pal,

It’s raining again today, but I played football anyway. I hear you call that sport soccer. Luckily for us, it doesn’t get that cold here despite all the rain. But my mum is always reminding me to take my umbrella and wear my wellies, or what you call rainboots.
Sincerely yours, William
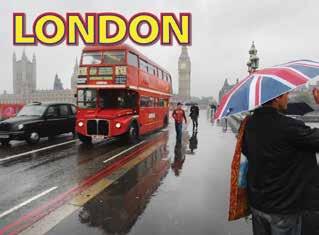
TIC ARCTIC OCEAN A TLAN TIC OCEAN INDIAN OCEAN PA CIFIC OCEAN 20°S 40°S 160°E140°E 160°E140°E120°E100°E80°E60°E40°E20°E0°20°W 40°N 60°N 0°Equator Tropic of Cancer Tropic of Capricorn N S EW Climate Ice cap Tundra Subarctic Highlands Marine west coast Humid continental Humid subtropical Mediterranean Arid Semiarid Tropical wet and dry Tropical wet GA_SE_27_8d_rv1 C M Y K 2nd Pr oof 10-1 7-20 05 JF MA MJ JA SO ND 6 5 4 3 2 1 0 90 70 50 30 10 −1 0 −3 0 Month A verage temperature (°F) A verage precipitation (inches) Tindouf, Algeria
GA_SE_27_8c_rv1 C M Y K 2nd Pr oof 10-1 7-20 05 JF MA MJ JA SO ND 6 5 4 3 2 1 0 90 70 50 30 10 −1 0 −3 0 Month London, England A verage temperature (°F) A verage precipitation (inches) Waiting for the Rains: The Effects of Monsoons in South Asia 407

Lesson 28408
Tech Workers and Time Zones: India’s Comparative Advantage
Introduction
When people lose their credit cards or have trouble with their computers, they need help fast. Usually they phone a call center, a place that handles large numbers of phone calls for a business. Often the callers may be contacting someone halfway around the world.
Call centers are a big business in India. They are part of a global revolu tion in information technology (IT), the use of technology to move, record, and process information. Computers, satellites, cell phones, and the Internet are all part of IT. This technology allows us to talk by phone to people almost anywhere on Earth and enables computers to move data around the world in an instant.
IT makes it possible for companies to outsource call center jobs. To outsource means to hire someone outside a company to do work that was once done inside the company. In recent years, American companies have outsourced many jobs to India. Indian workers now prepare tax returns, review medical records, and tutor students for U.S. companies.
India attracts these jobs because it has a comparative advantage over many other countries. This means that India can offer some services more cheaply or effectively than competing countries. As a result, companies often look to India when they want to outsource jobs. In this lesson, you will learn about some of the factors that give India this comparative advantage.
Essential Question Graphic Organizer
What factors give some countries a comparative advantage in the global IT revolution?
This illustration shows a customer in the United States communicating with a worker in India. Both are part of the global IT revolution. Information technology, such as communication satellites, allows data to move quickly and cheaply around the world. This helps people in distant countries to work together. Keep this illustration in mind as you try to answer the Essential Question.
Workers
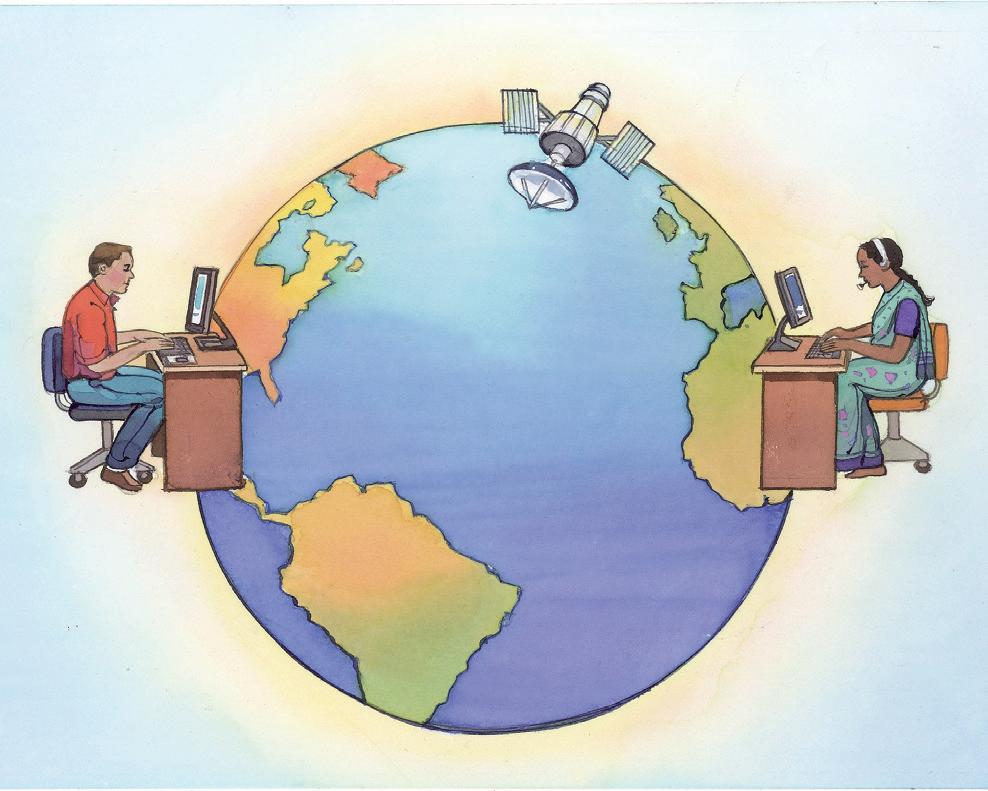
take incoming calls in a call center in Mumbai, India. LESSON 28 409
The Silicon Valley of India
The city of Bangalore has developed into a major IT center, and many foreign companies have offices there. Since the 1990s, the Whitefield neighborhood (pictured) has become a major center for India’s IT industry.
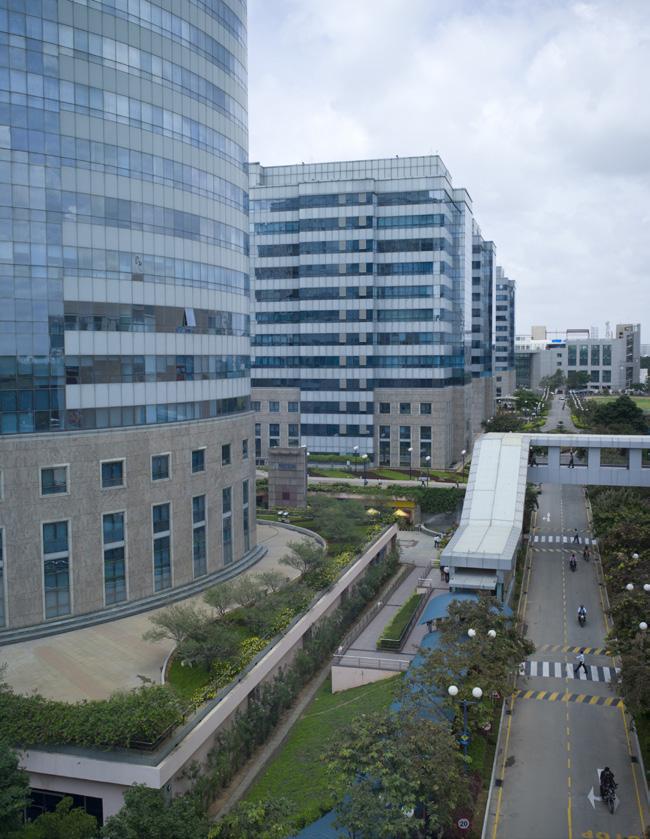
1. The Geographic Setting
India is a large and varied country in South Asia. In addition to great mountains, rainforests, and deserts, it has many large cities. India is about one-third the size of the United States, but its population is nearly four times larger. With more than one billion people, India is the second most populous country in the world. Only China has a larger population.
The World’s Largest Democracy India is ruled by an elected govern ment and is the largest democracy in the world. Under India’s constitu tion, all Indians are equal. However, Indians are not always treated equally in Indian society.
For thousands of years, Indian society has been divided into many groups called castes. Traditionally, Indian society has viewed people as being born into the same caste as their parents, and the system has determined which jobs each caste could do. Upper caste people, consist ing of priests and warriors, historically have held political and economic power in India, whereas lower caste people have worked as laborers and cleaners. Today, discrimination based on caste is illegal, and India has developed programs to provide more opportunities for people from lower castes. However, the caste system can still be a powerful force within Indian society.
India is also divided by religion, with the two main faiths being Hinduism and Islam. Around 80 percent of Indians are Hindus, but Muslims form a large minority. The two groups disagree on many issues, and at times, these religious conflicts lead to violence.
India’s Major IT Centers
A Fast-Growing Economy Economic problems also trouble India. Although it is no longer one of the world’s poorest countries, over one-fifth of all Indians—more than 250 million people—live below the poverty line. Many of the poorest people survive on less than $2 a day.
At the same time, India’s economy has been growing rapidly. One reason for this growth has been the global information technology revo lution. Indian businesses were quick to adopt this technology and offer IT services at low prices. As a result, Indian IT businesses have attracted jobs from many foreign companies.
Another attraction for American companies is India’s location on the other side of the world. There is a time difference of 10 or more hours between India and the United States. These differences in time zones mean that Indians are at work while Americans are sleeping. A time zone is an area that uses the same clock time.
Information Technology Centers
India’s IT centers attract jobs from around the globe. The main hub of IT work is the city of Bangalore. Around 11.5 million people live in this bustling IT center.
At first, American companies used call centers in India to take advantage of these time differences. However, as the call center industry developed in India, many companies began to use Indian call centers around the clock to save money. India became the top location for overseas call centers and pioneered a new industry. Today, it remains the second largest host of call centers for foreign companies.
India’s IT industry is spread across the country, but its main hub is the city of Bangalore in southern India. Like Silicon Valley, California’s IT center, Bangalore attracts highly skilled people who are interested in new ways to get work done. It is even nicknamed the Silicon Valley of India.
IT center N S EW 0 80 0 kilometers 0 80 0 miles Lambert Azimuthal Equal-Area projection 40 0 40 0 INDIAN OCEAN Arabian Sea Bay of Bengal Ganges R Mumbai New Delhi Hyderabad Chennai (Madras) Bangalore INDIA TCI5 533 GA_SE_28_02-B.eps Cyan Magenta Yellow Black Third Proof
Lesson 28410
Geoterms
comparative advantage the ability of one country to produce a good or provide a service at a lower cost or more effectively than another country
information technology (IT) the use of technology to move, record, and process information. IT includes computers, communication satellites, cell phones, and the Internet.
outsource to hire someone outside a company to do work that was once done inside the company. Information technology has made it possible to outsource jobs to businesses in other countries.
time zone an area that uses the same clock time. Earth is divided into 24 standard time zones. Clocks in each zone are set to the same hour and minute.
Time Zones Around the World
Earth’s Many Time Zones
The world has been divided into 24 standard time zones. Each zone covers about 15 degrees of longitude and represents 1 hour of the 24-hour day. The United States has six standard time zones. India has a nonstandard time zone. It is a half-hour off standard time. Note the International Date Line running through the middle of the Pacific Ocean. Travelers who cross that line going west toward Asia jump ahead one day on the calendar. When they cross the line heading east to the Americas, they lose a day.
Int er national Da te Line Pr ime Mer idian 7 P.M. 8 P.M. 9 P.M. 10 P.M. 11 P.M. 12 Midnight 12 Noon1 A.M. 2 A.M. 3 A.M. 4 A.M. 5 A.M. 6 A.M. 7 A.M. 8 A.M. 9 A.M. 10 A.M. 11 A.M. 1 P.M.6 P.M.5 P.M. 3 P.M. 4 P.M.2 P.M. 7 P.M. 8 P.M. 9 P.M. 10 P.M. 11 P.M. 12 Midnight 12 Noon1 A.M. 2 A.M. 3 A.M. 4 A.M. 5 A.M. 6 A.M. 7 A.M. 8 A.M. 9 A.M. 10 A.M. 11 A.M. 1 P.M.6 P.M.5 P.M. 3 P.M. 4 P.M.2 P.M. Diagonally shaded areas are a half hour earlier than the standard time zone. INDIA TCI5 532 GA_SE_28_2c.eps Cyan Magenta Yellow Black Third Proof
Tech Workers and Time Zones: India’s Comparative Advantage 411
IT Worker Salaries, 2017
2. Advantage Factor One: Low Wages
In 2017, a call center worker in the United States made on average $30,000 a year. A worker who did the same job in India earned merely $3,000. This tremendous difference in pay is one of the reasons why India attracts so many information technology jobs. American compa nies that outsource work to India can save money.
A Large, Fast-Growing Workforce India has a large and rapidly growing workforce. By 2030, India is expected to have the largest work force in the world.
Labor costs in India are relatively low compared to those in the Western world, giving India a comparative advantage in attracting IT jobs. American companies have found that they can cut their wage costs greatly by shifting some of their work to India.
Several factors affect how much workers in India earn. One factor is the size of its workforce. With so many people searching for work, competition for jobs can be fierce, and as a result, Indians often accept lower pay than workers in other countries.
Who Earns What
GA_SE_27-3a_rv1.eps
M Y K
P roof
This graph looks at the average pay of American and Indian IT workers in 2017. However, salaries can vary widely, with some Indian software engineers earning salaries similar to American software engineers.
09
Another factor that affects earnings is the low cost of living in India. Basic goods like food and clothing cost much less than in many other countries. The city of Bangalore, in particular, is known for its low cost of living. This low cost of living makes it possible for many Indians to enjoy a high standard of living despite compensation, or pay, that may seem low to American workers.
Indian Workers Want IT Jobs Good pay and good working condi tions make IT jobs attractive to Indians. In 2017, the average Indian earned $1,850 a year. In contrast, a computer programmer might be paid $7,300 a year or more.
Many IT company workplaces look like college campuses, featuring modern buildings in parklike settings. Some have stores, swimming pools, and gyms for their employees. A pleasant work environment helps attract Indians to IT jobs. However, once on the job, IT employees may have demanding work schedules. Moreover, the high level of stress that comes with the job could cause workers’ mental and physical health to decline.
An IT Campus in Bangalore
IT companies offer workers attractive workplaces. Around 30,000 people work at this company campus in Bangalore. The company provides them with food courts, a large gym, and a small golf course.

C
1st
5-25-20
80,000 60,000 40,000 20,000 0 Call center workers Software engineers Y early Salary (in U.S. dollars) United States India Sources: PayScale.
Lesson 28412
3. Advantage Factor Two: English Speakers
English is widely spoken in India, but Indian English differs some what from American English, much like American English differs from British English. Call center workers take classes to reduce their Indian accent so they are better understood. They must practice their pronun ciation, change how they make certain sounds, and learn to avoid using Indian-English expressions. Their skill in English is a second factor that drives India’s success in the IT business.
English Is Widely Spoken in India People in India speak around 780 languages, as well as numerous dialects. A dialect is a version of a language that is spoken in a specific geographic area. Hindi is India’s national language. More than two-fifths of Indians speak Hindi as their native language, but almost all educated Indians speak English as well.
Traders brought the English language to India during the 1600s. The United Kingdom later took over India and made it into a colony. British officials set up schools that taught Indians in English and helped train Indians to work in government jobs. The British also hoped the use of English would help to unite India’s many linguistic groups.
India gained its independence in 1947. By that time, English was widely spoken throughout India. Today, it remains the main language of business and is also used in government business. In cities, many parents send their children to schools that teach classes in English. Many college classes are also taught in English.
English Skills Are a Key Advantage About 10 percent of Indians speak English. This gives India a comparative advantage in attracting U.S. companies. India can provide IT services in English more effectively than countries where little English is spoken.
Because of India’s colonial past, Britain has influenced how Indians speak English. Local languages have also influenced Indian English. The language has its own pronunciations, expressions, and slang. This is why workers learn to speak English in a way that helps them to better communicate with people in the United States, Australia, the United Kingdom, and other places in the English-speaking world.
English in the Office
In India, speaking English is essential for business professionals, especially those working in IT. The signs in this office, the world headquarters of a large IT company, reflect the important role of English. Note that the sign on the back wall reminds workers about grammar and punctuation.

Tech Workers and Time Zones: India’s Comparative Advantage 413
Higher Education in India
India has the third largest system of higher education in the world, after the United States and China. Many schools emphasize studies in science, math, engineering, and technology. For example, five of the six institutes within Banaras Hindu University (pictured) focus on these fields.
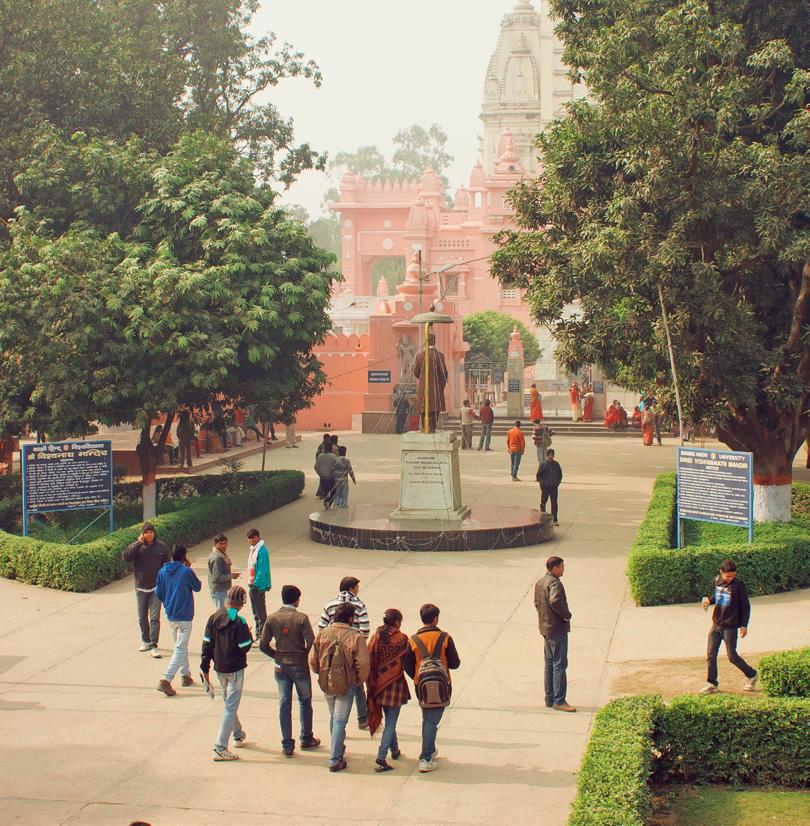
4. Advantage Factor Three: Trained Workers
Sixteen-year-old Rajiv Johri wants to study computer science at a top university in India, but first, he must pass the college entrance exam. To prepare, Rajiv attends a test prep class every day after school. He studies late into the night, and each morning he rises early to attend another test prep session before school.
Rajiv is not alone. Millions of Indians see education as their ticket to a good job. This educated workforce is a third factor in India’s compara tive advantage over countries with less-skilled workers. Companies from around the world send work to India because they know it will be done by well-trained workers.
India Is a Leader in Technical Education India’s educated workforce is no accident; the country invests a lot of money in higher education. In 2017, India had around 35 million college students, with many training in such technical fields as engineering, science, and math. By 2025, India will have the largest body of native-born college students in the world.
India has made special efforts to promote technical education. In 1951, the Indian Institute of Technology, or IIT, was founded. Today, IIT has 23 campuses in India, and several of the institution’s campuses are ranked among the best universities in the world. Some of the world’s top scientists and engineers are educated there.
Not All Indians Have Equal Access to Education Indian law says that all children up to the age of 14 are required to go to school. However, only about half of India’s children actually attend school to that age. As a result, about 25 percent of the country’s population is illiterate, meaning that around 315 million people in India cannot read and write.
Why don’t more children go to school? One reason is poverty. Many poor children have no time or energy for school because they have to work to help support their families.
Another reason is the effect of the caste system. Some Indians still link education to caste. People expect children who are born into high castes to be well educated, but they do not expect this of those born into low castes.
The Growth of Education
Since 1950, opportunities for higher education have grown in India, as shown in this graph. However, with so many graduates, many people in popular areas of study, such as engineering, have had difficulty finding jobs. The Indian government has created programs to help unemployed graduates improve their workplace skills so that they are more likely to get work.
It is difficult enough for many Indians to receive a basic education, and it is even harder to go on to college. In 2014, only about 10 percent of the young people in India were able to attend college. With its relatively young population, there will be millions more to educate in the near future. However, the Indian government continues to take steps to expand educational opportunities for its growing student population.
IT Programs in
GA_SE_28-5b C M Y K 1950 2016 0 Y ear Number of Students 10,000 20,000 30,000 40,000 40,000 500 20 799 39,000 Universities Colleges Engineering and
India
Source: Ministry of Human Resource Development Department of Higher Education Lesson 28414
India’s Brain Drain and Brain Gain
In the past, many students with technical degrees were unable to find the jobs they wanted near their homes. Some of these highly educated students left India to work in more developed countries, including the United States. The result was a serious brain drain for India.
This trend began to change after the IT industry took off in India in the 1990s. As new opportunities for people with technical degrees arose, many Indians who were working outside the country returned to join the boom. These IT professionals brought with them valuable business experience as well as special skills. For the companies they joined, the brain drain turned into a brain gain.
Some Indians also returned home with money to invest in new com panies. This investment has helped the Indian IT industry to expand. Growth at home has led some Indian companies to begin operations in other countries, such as China.
Summary
In this lesson, you read how India has become part of the global information technology revolution. You learned about three factors that have given India a comparative advantage over some other countries in attracting IT jobs from the United States and other nations. Those factors are low wages, English speakers, and an educated workforce. In addition, India is located in a time zone halfway around the world from the United States; Indians work while Americans sleep. All of these factors have led companies from around the world to outsource work to India.
Outsourcing is only one way that companies do business in other countries. Another way is through foreign investment, or investment by a person or company based in another country. For example, many people and businesses around the world invest money in the United States. This money is used to purchase U.S. companies and to start new businesses.
In the next section, you will read more about foreign-owned compa nies in the United States. You will also explore this country’s compara tive advantages in attracting business from around the world.
From Brain Drain to Brain Gain
In 2007, Naveen Tewari started InMobi, a global advertising and technology firm that now has offices in 12 countries. He started the com pany after returning to India from the United States, where he had attended graduate school and worked in business.

Tech Workers and Time Zones: India’s Comparative Advantage 415
The United States loses jobs when they are outsourced to other countries, but gains jobs when foreign companies invest here. The map shows where companies owned by foreign investors were doing business in the United States in 2017. The graph shows foreign invest ment in the United States between 1998 and 2016. The United States attracts so much foreign investment because of its many comparative advantages.
Is the number of Americans working for foreign companies rising or falling? In 1987, about 2.6 million Americans worked for foreign-owned companies. Since then, the number has more than doubled to over 6.8 million. The new jobs created by foreign invest ment help to compensate for jobs that have been lost to outsourcing.
What kinds of jobs are created by foreign-owned companies in the United States? Americans working for foreign-owned companies do all kinds of jobs. They build cars, airplanes, and medical equipment. They conduct research and develop new technologies. In general, they earn more than the average U.S. income.
What gives the United States a comparative advantage in attract ing foreign businesses? The United States is a highly developed country with many skilled workers. It has highly educated researchers, IT professionals, engineers, and businesspeople. Foreign companies invest here to take advantage of this talented workforce. This country also has a very high per capita GDP as well as more than 325 million consumers.
Three Foreign-Owned Companies in the U.S.
Dassault
Why Parent Company
• skilled workers
talented
Global Connections
TCI17 101 GA_SE_28-07c.eps Foreign Company Jobs in US, 20 08 Cyan Magenta Yellow Black Fir st Proof Foreign-Company Jobs in the United States, 2017
Falcon Jet Corporation Location of Parent Company France U.S. Locations Arkansas, Delaware, Nevada, New Jersey Business Activities • manufacturing jet airplanes • sales and service
Invested in the United States
•
engineers • close to customers in the Americas Lesson 28416
N S E W 0 30 0 kilometers 0 30 0 miles Albers Conic Equal-Area projection 150 150 Number of ForeignCompany Jobs Over 200,000 50,000–200,000 Below 50,000 Philips Healthcare American Honda Motor Company Netherlands Japan Massachusetts, Ohio, Pennsylvania, Washington Alabama, California, Colorado, Connecticut, Florida, Georgia, Indiana, Iowa, Michigan, New Jersey, North Carolina, Ohio, Oregon, South Carolina, Texas • manufacturing medical equipment • research and development of new products • sales and services • manufacturing cars, motorcycles, ATVs, boats, engines • research and development of new products • safety education • sales • skilled workers • talented engineers and medical researchers • close to North American customers • skilled workers • talented engineers and designers • close to North American customers GA_SE_27-7a_rv1.eps C M Y K 1st P roof 5-25-20 09 $525 $450 $375 $300 $225 $150 $75 $0 2006 2007 2008 2009 2010 2011 2012 2013 2014 2015 2016Amount of Foreign Investment (in billions of U.S. dollars) Year Source: Organization for International Investment. Foreign Investment into the United States N S E W 0 30 0 kilometers 0 30 0 miles Albers Conic Equal-Area projection 150 150 Number of ForeignCompany Jobs Over 200,000 50,000–200,000 Below 50,000 Tech Workers and Time Zones: India’s Comparative Advantage 417
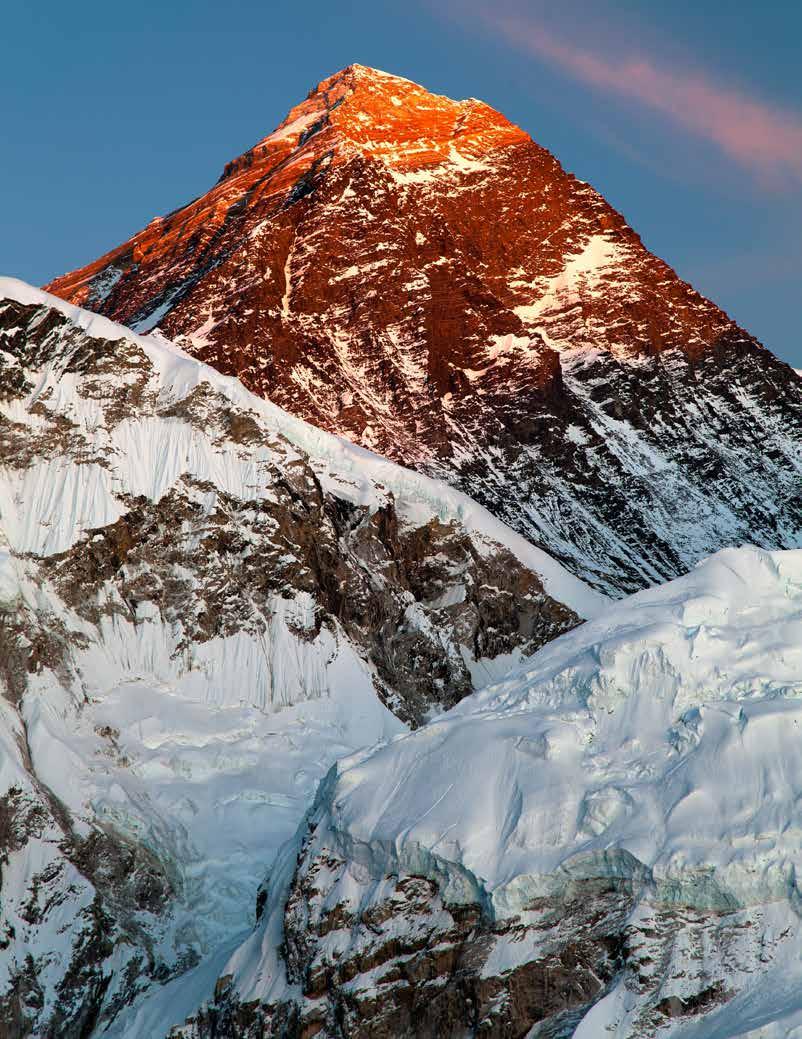
Lesson 29418
Mount
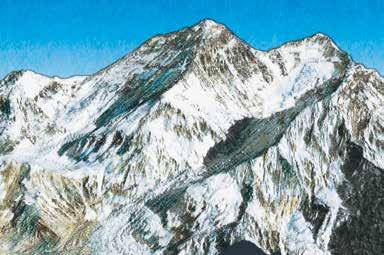
Climbing the World’s Tallest Physical Feature
Introduction
On April 25, 2015, a powerful earthquake shook Mount Everest. The powerful shaking dislodged huge portions of snow that clung to the moun tains. This snow slid quickly down a treacherous icefall before slamming into a mountaineering base camp. One climber said that the huge earthquake and ensuing avalanche forced him to flee from his tent and run for his life. In the end, 22 of the climbers died. It became the single deadliest climbing day on Mount Everest.
Despite the dangers, Mount Everest is an extraordinary place. At over 29,000 feet, it is the tallest mountain in the world. It lies within Nepal’s Sagarmatha National Park, which was named a World Heritage site in 1979. These sites are places that UNESCO, a branch of the United Nations, identifies as being of great natural or cultural value to the world. UNESCO places these sites on its World Heritage List and assists countries in preserv ing and protecting these sites.
Climbing Mount Everest is an extremely difficult feat. Even so, more people come to Nepal each year to attempt the ascent. In this lesson, you will read about the challenges these climbers encounter on their way to the summit. In addition, you will see how tourism to Mount Everest is affecting Nepal and its people, and you will discover what is being done to protect this remarkable site from overuse.
Essential Question
How can people both experience and protect the world’s special places?
This diagram shows one of the main climbing routes up Mount Everest. Notice that there are several camps along the route, each at a different elevation. Moving from camp to camp, climbers face tough physical challenges. Keep this diagram in mind as you try to answer the Essential Question.
Graphic Organizer
Everest:
This photograph shows the summit of Mount Everest, the world’s tallest mountain. GA_SE_29-01_rv2 C M Y K 3rd Pr oof Summit (29,029 ft.) Camp II (21,300 ft.) Base Camp (17,600 ft.) Camp IV (26,000 ft.) Camp III (24,500 ft.) Camp I (19,500 ft.) To Lukla (9,350 ft.) LESSON 29 419
First to the Top
In 1953, Edmund Hillary and Tenzing Norgay became the first climbers to reach the top of Mount Everest. Since then, thousands of climbers have attempted to reach Mount Everest’s summit. However, hundreds have died in the process.

1. The Geographic Setting

Mount Everest is in the Himalaya Mountains of southern Asia, along the border between Nepal and the Chinese region of Tibet. Although measurements have varied, the summit’s height is recognized as 29,029 feet. In the future, this number may change as measuring methods become more accurate. Whatever its exact elevation, Mount Everest is more than five miles high. The mountain was named Everest in 1865, after a British official in India. In Nepal, it is called Sagarmatha, which means “forehead in the sky,” whereas in Tibet, it is known as Chomol ungma, or “mother of the world.”
Many Ways to the Top The first successful ascent of Mount Everest was achieved on May 29, 1953, the day that Edmund Hillary of New Zealand and Tenzing Norgay of Nepal reached the mountain’s summit. “My first sensation was one of relief—relief that the long grind was over,” Hillary later wrote. “I turned and looked at Tenzing. Even beneath his oxygen mask and the icicles hanging from his hair, I could see his infec tious grin of sheer delight.” Thousands of people have since attempted to climb the mountain. Nearly 5,000 people have succeeded, but around 300 have died while ascending or descending Everest’s slopes.
Oxygen and Elevation
There are many routes to the top, with the two main approaches being the southeast ridge from Nepal and the northwest ridge from Tibet. Most climbers take the first route, climbing in stages stretching over a period of weeks. At each stage, they stop at camps on the side of the mountain, which allows climbers to acclimatize, or adjust to the high elevation, as they go. If climbers did not acclimatize, they would risk becoming ill from the lack of oxygen at high elevations.
Another problem for climbers is exposure, or being unprotected against extreme weather conditions, such as freezing temperatures and high winds, which can cause injuries or even death. Most summit attempts occur during April and May, when the weather is most mild. However, the temperature drops 3.5°F for every 1,000-foot increase in elevation. Therefore, conditions can be deadly even in the spring.
As altitude increases, the oxygen content in the air decreases. At the summit of Mount Everest, the air con tains only about one-third the oxygen that it contains at sea level. Because of this, climbers can suffer from oxy gen deprivation.
Protecting the Future of Mount Everest As the popularity of climbing Mount Everest has grown, so have the problems caused by overuse. One such problem is trash. In the past, many climbers left old equipment, garbage, and human waste at camps as they climbed the mountain. Much of this trash has now been removed, but keeping the mountain clean remains a concern.
Another problem is overcrowding. During the climbing season, the camps become small villages, with dozens of people. Hundreds of climb ers might reach the summit in a day, and lines can form as climbers slowly make their way to the top, endangering everyone involved.
The growing number of climbers raises questions about the moun tain’s carrying capacity, a term that refers to the number of people or animals a particular area can support. When a population grows too large, the area is likely to be damaged, which is one reason Sagarmatha National Park was declared a World Heritage site. By drawing attention to the region, UNESCO hopes to protect it for future generations.
GA_SE_29-2c_r v1.eps C M Y K 1st Pr oof 5-25-2009 A vailable Oxygen Compared to Sea Level Elevation (feet) 14,0000 29,029 100% 75% 50% 25% 0% Oxygen available at sea level Oxygen available at Everest summit
Lesson 29420
Geoterms
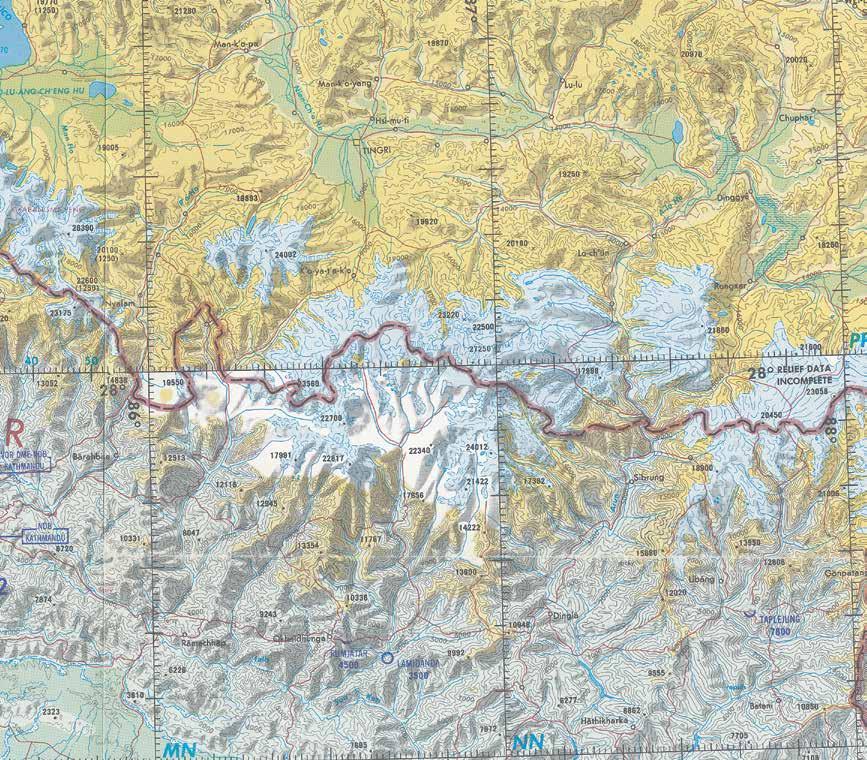
acclimatize the process of
Climbers
as
carrying capacity the number of people or animals the environment of an area can support. A place’s carrying capacity depends on the environment. exposure the harmful effects of cold, wind, or other
adjusting to lower oxygen levels at high elevation.
adjust through exercise and rest
they gradually move higher.
extreme CHINA NEPAL Mt. Everest 29029 Ama Dablam 22349 Lhotse 27940 Makalu 27766Baruntse Cho Oyu 26906 Gyachung Kang Pumori KHUMBU GLACIER SAGARMATHA NATIONAL PARK Mountain Elevation (in feet) Country border Contour lines 24,012 0 20 kilometers 0 20 miles Lambert Conformal Conic projection 10 10 N S EW TCI5 516 GA_SE_29.2b Cyan Magenta Yellow Black Third Proof The Mount Everest Region Mount Everest: Climbing the World’s Tallest Physical Feature 421
The Effects of Tourism
This sign advertises one of the many tourist hotels in Nepal. Tourism has brought lots of money to Nepal. Climbing groups have also funded schools and medical clinics. Some Nepalese have benefited from tourism, but most are still very poor.
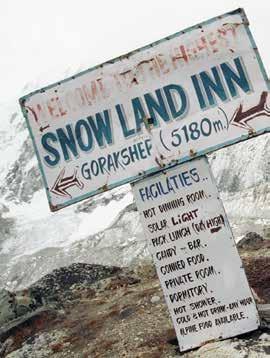
2. From Lukla to Base Camp
Expeditions to Mount Everest begin with a trek to Base Camp. Along the way, climbers can observe Everest in the distance. “I stared at the peak for perhaps 30 minutes,” recalled one climber. “The summit looked so cold, so high, so impossibly far away. I felt as though I might as well be on an expedition to the moon.”
A Slow Start Helps Climbers Acclimatize For most people, the quest to climb Mount Everest begins in Kathmandu, the capital of Nepal. From there, the adventurers fly to the town of Lukla, at 9,350 feet above sea level, where they begin their hike to Base Camp. This trek, which typically takes between six and eight days, helps hikers to acclimatize to the thinning air. By the time they reach Base Camp, they have ascended to an elevation of 17,600 feet.
Base Camp is set up every climbing season at the edge of the Khumbu Glacier. Consisting of dozens or even hundreds of tents, this “tent city” includes kitchens, dining halls, and even solar-powered lights. Most climb ers will spend several weeks at Base Camp to adjust to breathing the thin air. During this time, climbers will gradually ascend to each camp and then return to Base Camp before attempting to reach the next camp.
Climbers who do not acclimatize successfully may begin exhibiting symptoms of altitude sickness while they are at Base Camp. This illness is also called Acute Mountain Sickness, or AMS. Common symptoms of the sickness include nausea and headaches. In severe cases, AMS can cause fluid accumulation in the lungs, swelling of the brain, and even death.
The Impact of Tourism Climbing expeditions, and tourism in general, have had significant effects on the people and environment of Nepal, which is a poor developing country. On the positive side, tourism gener ates income, as tourists pay for food, lodging, and supplies. Villagers also earn wages as porters, carrying heavy loads of equipment and supplies for climbers. The porters often use yaks, a kind of longhaired ox, to help them transport goods.
At the same time, tourism has resulted in harmful effects. Porters, for example, are sometimes overworked and mistreated. Also, some of the villages have chopped down trees in the process of constructing lodging for the tourist trade. More trees may have been cut to provide fuel for cooking and heating for tourists. This loss of trees has led to deforesta tion and soil erosion in the Everest region.
What Does It Cost to Climb Everest?
The High Cost of Climbing
Climbing Mount Everest has become a big business. Private guide services charge as much as $85,000 per person. A typical climber may spend another $19,000 to $40,000 on personal gear and airfare.
Item Cost for a Team of Seven Climbers Crew (includes guides, cooks, and doctor) $175,000 Transportation and lodging en route to Base Camp $48,000 Permits and fees $79,000 Supplies (includes fuel, oxygen, batteries, tents, medical supplies, and climbing gear) $153,000
Lesson 29422
3. From Base Camp to Camp I
Just above Base Camp lies the Khumbu Icefall, which consists of giant chunks of ice known as seracs. “Imagine trying to hopscotch uphill through a field of ice boulders the size of houses and weighing some 30 tons, each of which could shift at any moment without warning,” wrote a climber about the icefall. “It’s like a jigsaw puzzle of giant blue ice puzzle pieces.”
Surviving the Khumbu Icefall Climbers reach the Khumbu Icefall during the second stage of their journey, a stage that takes them from Base Camp at around 17,600 feet to Camp I at an elevation of 19,500 feet. It usually takes one to three weeks to set up Camp I, as climbers move up and down the icefall each day, transporting supplies to the higher camp. This process also helps them to acclimatize.
The Khumbu Icefall is one of the most dangerous sections of the climb, and many have died on this part of the mountain. Some climbers have been crushed by shifting seracs. Others have died after falling into a crevasse, or a deep crack in the ice. Still others, including 16 climbers in 2014, have been swept down the mountain by an avalanche
Climbers try to reduce the risks by beginning their hikes before dawn. Their objective is to get through the Khumbu Icefall before the sun melts the ice. That is because the ice starts to shift when it melts, becoming more dangerous.
Everest’s Expert Climbers: The Sherpas On expeditions to climb Mount Everest, much of the work is performed by a Himalayan people known as Sherpas. Tenzing Norgay, one of the first two climbers to reach the summit, was a Sherpa. Many of the great climbers on Everest, includ ing a few women, have been Sherpas.
Sherpas play a critical role during Everest expeditions. They function as guides, cooks, and porters, setting up the camps and carrying most of the supplies. They go through the Khumbu Icefall before other climbers in order to set up ladders and ropes for safe passage. Many Sherpas have died doing this hazardous work.
Every climbing expedition has a head Sherpa, called a sirdar, who has authority over the other Sherpas. In some cases, an expedition will include two sirdars, with one remaining in Base Camp while the other makes the climb to the summit.
Climbing the Khumbu Icefall
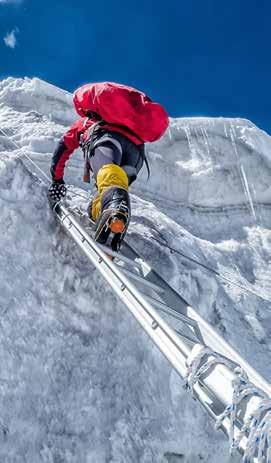
The Khumbu Icefall is one of the riski est sections of the Everest ascent. Climbers must cross deep crevasses on shaky ladders. They have to beware of falling blocks of ice. One mountain climbing guide warns that “everything you stand or climb on can fall any minute without warning.”
Sherpas Play a Key Role
Few Everest climbs would succeed without Sherpas. These natives of the Everest region work as guides and porters on most expeditions.
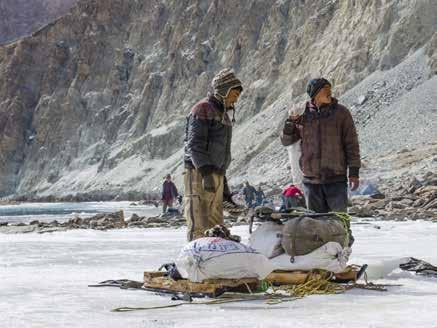
423
The Long Climb
Scaling Everest requires great skill and endurance. The risks of climbing are much greater at such high eleva tions. The lack of oxygen makes it hard to function, and as people’s thinking gets fuzzy, it is easy to make mistakes. And even a small mistake can prove fatal.
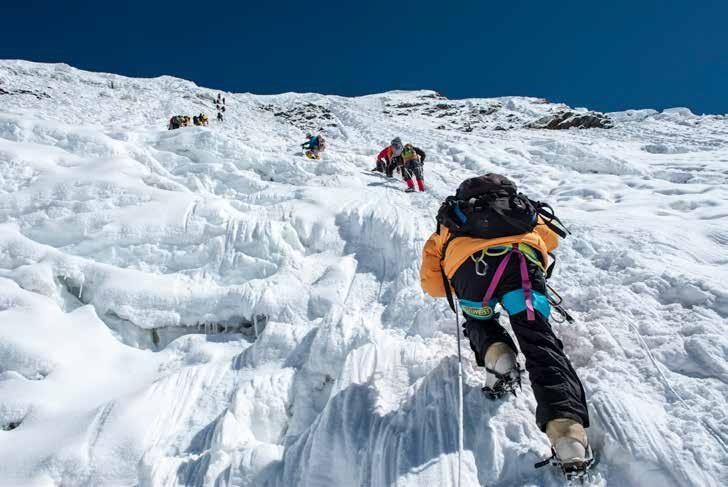
4. From Camp I to Camp IV
The third stage of the climb takes climbers from Camp I at around 19,500 feet to three additional camps. The highest is Camp IV, perched at an elevation of approximately 26,000 feet. One of the most difficult parts of the climb is the Lhotse Face, a steep rock wall covered in ice. “The wind kicked up huge swirling waves of powder snow,” a climber recalled of his climb up Lhotse. “Ice formed over my goggles, making it difficult to see. I began to lose feeling in my feet. My fingers turned to wood. It seemed increasingly unsafe to keep going.”
Through the Valley of Silence When climbers depart from Camp I, they enter a long valley called the Western Cwm (pronounced koom). The Western Cwm is also known as the “Valley of Silence,” because the ridges on either side of the valley block the wind. As a result, the most common sounds that climbers hear are their own labored breathing and the crunch of boots on ice and snow.
The hike through the Western Cwm is a long, gradual climb. On a sunny day, the valley can become extremely hot, which surprises most climbers because they expect to find freezing conditions throughout the expedition. “You literally pray for a puff of wind or a cloud to cover the sun,” one climber recalled.
Crampons and Rocks: Ascending to Camp IV Camp II lies at the base of the Lhotse Face. To ascend this ice-covered wall, which rises up 3,700 feet, climbers use crampons and ropes attached to the ice. Climbers kick the crampons, which are spikes that attach to their boots, into the ice to get a foothold, and then they pull themselves up on the rope.
Lesson 29424
Camp III is perched on a narrow ledge halfway up the Lhotse Face.
On a clear day, it offers an astounding view. “I sat with my feet hanging over the abyss, staring across at the clouds, looking down at the tops of 22,000-foot peaks,” wrote one climber. “At long last, it seemed as though I was really nearing the roof of the world.”
From Camp III, climbers ascend another 1,500 feet to the South Col. This saddle between the Lhotse Face and the summit of Mount Everest is the location of Camp IV. A saddle is a low point on a ridge that connects two peaks.
At around 26,000 feet, Camp IV is in the “Death Zone.” At this elevation, humans have difficulty breathing. The lack of oxygen places tremendous stress on the body, and climbers are at great risk of expe riencing altitude sickness. Additionally, with so little oxygen reaching their brains, they are more likely to make fatal mistakes. Most climbers breathe bottled oxygen to survive, but even then, it is a challenge to remain at this altitude for more than two or three days. If the weather turns bad, most climbers are forced to turn back down the mountain.
Cleaning Up the World’s Highest Junkyard Camp IV is the final camp before the summit. In the past, it was also a major dumping ground, littered with empty oxygen bottles, used climbing equipment, and human waste. Even dead bodies were abandoned on the mountain. All of this dumping led to the South Col being nicknamed “the world’s highest junkyard.”
Between 1953 and the mid-1990s, climbers discarded an estimated 50 tons of glass, plastic, and metal on the slopes of Mount Everest. In recent years, however, groups of climbers have scaled the mountain to bring down the trash. One Japanese team returned with 2.6 tons of garbage, including old tents, fuel bottles, and plastic. As a result of these efforts, the mountain is now much cleaner than it once was. As one climber commented, “If you want to find garbage on Everest now, you have to go looking for it.”
Partly to keep Mount Everest clean, the government of Nepal requires each climber to purchase an $11,000 permit to climb the moun tain. Some of this money helps pay for waste cleanup. Climbing groups are also required to leave a $4,000 “garbage deposit” with the govern ment. If climbers fail to carry their trash off the mountain, they lose their deposit.
Nepal’s government is also working to reduce deforestation, which is a significant environmen tal problem in this country. Moun tain climbers must now bring their own fuel with them to Everest or use solar power because cutting down trees for fires is prohibited. Tree-planting programs have been organized in many parts of Nepal, with new forests being planted and protected from overuse.
The World’s Highest Junkyard
Piles of trash were once a common sight on Everest. In recent years, climbing groups have cleaned up the mountain. This Sherpa collects garbage at an altitude of 26,000 feet as part of a Nepalese clean-up expe dition. The 20 climbers in this group picked up nearly two tons of garbage that had been left on the mountain.
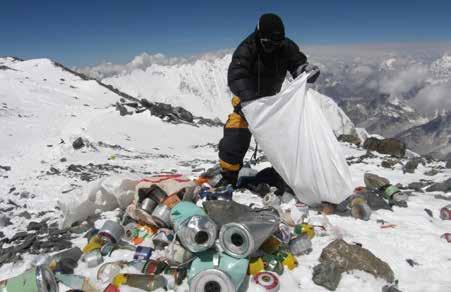
Mount Everest: Climbing the World’s Tallest Physical Feature 425
Summit Gear
Climbers who reach the top of Everest today wear special gear designed for high altitudes. Earlier climbers made the ascent with far less equipment. They wore wool sweaters, scarves, and jackets. They had heavy oxygen tanks but no radios.
5. From Camp IV to the Summit
After resting for several hours at Camp IV, climbers begin the final and most grueling stage of the climb—the journey to the summit.
Climbing in the Death Zone is a time-consuming physical test. “At those altitudes you’re going quite slowly. You take a step and you breathe six to eight times and then you take another step and then you breathe six or eight times,” a climber recalled. “You can’t look at the whole ascent. You have to break it down into small sec tions and into tiny little steps. That’s how you eventually chew your way to the summit.”
Climbing in the Death Zone It is only about 3,000 vertical feet from Camp IV at around 26,000 feet to the summit at 29,029 feet, but each step requires tremendous effort. Deep snow, steep drop-offs, and exposure to harsh weather make this part of the climb even more difficult.
It takes between 8 and 16 hours for climbers to reach the summit from Camp IV, and an additional 4 hours to make the descent back to the camp. Most climbers begin the final ascent in darkness at around 11 p.m., which usu ally gives them sufficient time to reach the top and return to Camp IV before the end of the following day.
Climbers first set their sights on the South Summit, a small dome of snow and ice just below the summit. To get here, they must ascend a long, steep ridge that is covered in unstable snow. “It took an age to climb that ridge, hour after hour,” a climber later wrote. “Each step was a monu mental effort of will, requiring a kick, and another kick, to secure a footing and ensure you didn’t slide with the soft snow down again to where you had started.”
From the South Summit, climbers have only 300 feet to go. However, they have to climb along a terrifying knife-edge ridge, where one slip can mean a fall of thousands of feet and certain death.
Climbers must also get over the Hillary Step, a rock cliff 40 feet high that lies just below the summit. The Hillary Step is one of the toughest obstacles that climbers face on Everest.
On Top of the World When climbers reach the summit, they are greeted by an extraordinary view. They see Tibet to the north and Nepal to the south, and surrounding them on all sides are other giant peaks of the Himalayas. They are truly on top of the world.
The summit itself, which is about the size of a picnic table, is covered with an assortment of flags, photographs, and other offerings from pre vious visitors, as well as used oxygen bottles and other trash. Climbers typically do not remain at the top for long because they have to return down before it grows dark or the weather changes.
By the time they reach the summit, climbers are exhausted. This fatigue makes the return to Camp IV extremely dangerous because even a small mistake can cause climbers to lose their footing and plummet down the mountain. If the weather turns bad, the mistakes can multiply.
Lesson 29426
Seeking Even Greater Challenges
Over the years, climbers have sought new challenges on Mount Everest, such as making the ascent with out oxygen or doing it very rapidly. In 2003, a Sherpa set a speed record by climbing from Base Camp to the summit in just under 11 hours. In 2001, an American became the first blind person to scale Everest. And in 2013, an 80-year-old Japanese climber became the oldest person to reach the top.
Some people come down the mountain in challenging ways. A few have skied down or descended on snowboards. One man performed his descent with the use of a paraglider, which is a device like a large kite.
For some others, the adventure of climbing Mount Everest is part of a greater challenge called the Seven Summits. To meet that challenge, a climber must scale the tallest mountain on each of the seven continents. Whatever a climber’s goals may be, reaching the summit of Mount Everest is an amazing feat.
Summary
In this lesson, you read about the challenges that climbers experience on the world’s highest mountain. You learned that climbers must accli matize as they ascend Mount Everest, and you read about the danger of exposure to extreme weather conditions. In addition, you discovered some of the effects of tourism on the Mount Everest region and saw that tourism raises questions about the carrying capacity of the mountain environment.
People come to Mount Everest because it is a very special place. However, Everest is only one of the world’s many wonders. Keep this in mind as you look at more World Heritage sites in the next section.
Summits
Mountain (C ontinent)
Elevation
Denali (N. America) 20,310 ft.
Aconcagua (S. America) 22,831 ft.
Elbrus (Europe) 18,510 ft.
Kilimanjaro (Africa) 19,340 ft.
Everest (Asia) 29,029 ft.
Kosciusko (Australia) 7,310 ft.
Vinson Massif (Antarctica) 16,050 ft.
The Lure of Summits
The Himalayas contain 9 of the world’s 10 tallest mountains. Every conti nent has its highest peak, and taken together, they make up the Seven Summits Challenge. The challenge is to climb the highest mountain on each of the world’s seven continents.

Seven
Challenge Mount Everest: Climbing the World’s Tallest Physical Feature 427
Global Connections
The map shows the location of many World Heritage sites. There are more than 1,000 of these sites spread across the globe.
How does a place become a World Heritage site? Countries can nominate special places to be included on the World Heritage List, and then a committee at UNESCO votes on the nominations. There are three types of World Heritage sites: natural, cultural, and mixed. Natural sites are areas with unique physical features, such as the Grand Canyon in Arizona. Cultural sites have great historic, artistic, or scientific value. They may be monuments, groups of buildings, or an old city. India’s Taj Mahal is a cultural World Heritage site. Mixed sites combine natural and cultural features. The Mayan ruin of Tikal in the Guatemalan rainforest is a mixed site.
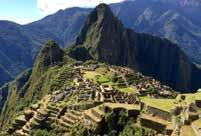
What risks do World Heritage sites face today? Many World Heritage sites are at risk of being dam aged or lost entirely. Some are threatened by ethnic conflict or war, whereas others are endangered by pollution or develop ment. Often the greatest risk is overuse, which happens when more people visit a site than its carrying capacity allows. A World Heritage site that is overused may be in danger of being “loved to death.”
Why should World Heritage sites be protected? World Heritage sites are among the greatest treasures in the world because they represent the wonders of nature or the finest expressions of human culture. People visit them to enjoy their beauty or to learn more about the history and achievements of humankind. By protecting these special places, we are preserving them not only for ourselves but also for future generations to enjoy.
CIFIC OCEAN
OCEAN
AMERICA
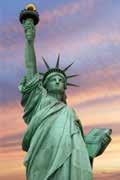
OCEAN
TLAN TIC OCEAN
A
PA
SOUTHERN
ARCTIC
NORTH
SOUTH AMERICA Cultural Natural Both cultural and natural World Heritage sites TCI17 10 GA_SE_29-8a World Heritage Fir st proof cyan magenta World Heritage Sites, 2016 Statue of Liberty, United States
Machu Picchu,
Peru Lesson 29428
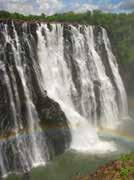
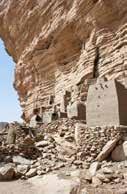


ARCTIC OCEAN A TLAN TIC OCEAN INDIAN OCEAN PA CIFIC OCEAN ARCTIC OCEAN AFRICA ASIAEUROPE AUSTRALIA ANTARCTICA N S EW 0 3,0 00 kilometers 0 3,0 00 miles Robinson projection 1,50 0 1,50 0 Dorset, United Kingdom Victoria Falls, Zimbabwe Bandiagara, Mali Emperor Qin’s Tomb, China Great Barrier Reef, Australia Mount Everest: Climbing the World’s Tallest Physical Feature 429

Lesson 30430
China: The World’s Most Populous Country
Introduction

During the 1870s, a drought of terrible magnitude occurred throughout China. As crops failed and many people began to starve, one witness to the suffering wrote,
They wait for death in their houses, stripped of everything.
The cold winds pierce through their bones. They have no rice to cook, and the cravings of hunger are most painful.
This was not the first time that the people of China had faced a terrible famine, for there had been severe food shortages many times before. How ever, this famine was made worse by a rise in China’s population. By the time the famine was over, it had claimed almost 10 million lives.
This story of population growth and famine is a part of the story of China because the country has experienced both since ancient times. Despite its hardships, China today is the world’s most populous country, home to nearly one-fifth of the world’s 7.6 billion people.
Feeding such an immense population is a tremendous challenge. To help meet that challenge, China has worked for many years to achieve zero population growth, a condition that is met when a country’s population stops growing. With zero population growth in a country, the number of people who are born each year roughly equals the number who die. In this lesson, you will learn how China has addressed the challenges created by its enormous and still growing population.
Essential Question Graphic Organizer
How does a country meet the challenges created by a large and growing population?
This graph shows the population of China from 1950 to 2050. The data after 2010 are estimates. Note how fast China’s population grew between 1950 and 1990. Today, China has nearly 1.4 billion people. Keep this graph in mind as you try to answer the Essential Question.
Crowds walk along the Great Wall of China. GA_SE_30-1_rv1.eps C M Y K 1st P roof 5-25-20 09 estimated 1,600 1,400 1,200 1,000 800 600 400 200 0 1950 1960 1970 1980 1990 2000 2010 2020 2030 2040 2050 Population (in millions) Year Source: United Nations Population Division. LESSON 30 431
Rate
Population Math
This table shows the relationship between the rate of natural increase and doubling time. A rate of natural increase that is greater than 2 percent a year is considered high. At that rate, a country’s population will double in 35 years. The rate of natural increase varies widely around the world.
1. The Geographic Setting
The ancient Chinese believed that China stood at the center of the world and that there were no other civilized societies on Earth. This idea was understandable because China was geographically isolated from the rest of the world. To the west, deserts and mountains cut China off from the rest of Asia, and to the east lies the vast Pacific Ocean. Even today, the Chinese people refer to their country as Zhong Guo, “the Middle Kingdom.”
A Diverse Landscape If China could be picked up and placed on top of the United States, the two countries would match up pretty well. They are nearly equal in shape and size, although China is slightly larger and has a very different landscape Geographers sometimes describe China as a giant slope that stretches from the towering mountains of Central Asia in the west to the Pacific Ocean in the east. If you stood at the top of the slope, you would look down on the mountains, plateaus, and basins that make up western China. If you took a giant step down the slope, you would be in central China, where you would find lower mountains, hills, and plateaus, as well as the Gobi Desert.
A final giant step down would take you to eastern China, an area with low hills, fertile river valleys, and plains. You would see vast floodplains covered with rice fields. Eastern China is where most of the country’s 1.4 billion residents live.
Population Growth in China
The First Billion-Person Country China has been the world’s most populous country for hundreds of years. In the 1980s, it became the first country to reach a population of 1 billion people.
A population grows when its yearly birth rate is higher than its yearly death rate. These rates, which are often shown as a percentage, are determined by the average number of births or deaths per 1,000 people. To calculate a country’s birth rate, start with the number of births in the country for every 1,000 people. For example, if there are 30 births for every 1,000 people in a year, the birth rate is calculated as 3 percent. Similarly, if there are 20 deaths per 1,000 people, the death rate would be 2 percent.
China’s Doubling Time
As this bar graph shows, China’s population more than doubled between 1950 and 1990. For a population to grow so rapidly, it must have a rate of natural increase about 2 percent.
To find out how fast a country’s population is growing, subtract the death rate from the birth rate. In the example just described, a 3 percent birth rate minus a 2 percent death rate equals a 1 percent growth rate. This means that the population of that country is growing by 1 percent each year. This annual growth rate is also referred to as the rate of natural increase.
China’s population grew substantially during the second half of the 20th century. In 1950, China had almost 555 million people, but only 40 years later, in 1990, it had twice as many people. The population had doubled to about 1.2 billion. The time it takes for a population to double like this is called its doubling time.
The rate of natural increase and the doubling time are tied to each other. The higher the rate of natural increase, the shorter the doubling time. Looking ahead from 1990, the Chinese could anticipate that if nothing changed, their population would likely double again in just another 40 years.
of Natural Increase Doubling Time (years) 3% 23 2% 35 1% 70 0% no doubling time Natural Increase and Doubling Time
GA_SE_30-02b C M Y K 1st Pr oof 9-19-20 05 1,600 1,400 1,200 1,000 800 600 400 200 0 1950 1990 Population (in millions) Year
Lesson 30432
Geoterms
doubling time the length of time it takes for a population to double
a severe shortage of food that results in widespread hunger
rate of natural increase the annual rate of population growth. This percentage is calculated by subtracting the death rate from the birth rate. It does not include people moving into or out of a country.
zero population growth a condition in which the population of a country does not grow but remains stable. This condition comes about when the birth rate plus immigration equals the death rate plus emigration.
mi.
Density
Where the Chinese Live
The purple areas
part of
country.
across
for food and water for irrigation.
also used
famine
on this map indicate a population density of more than 2,000 people per square mile. Notice that the majority of Chinese live in the eastern
the
Rivers flowing
this lowland region provide fish
They are
as transportation routes. Per sq. km Over 100 50–100 10–50 1–10 Under 1 Population
Per sq.
Over 250 125–250 25–125 2–25 Under 2 N S EW Lambert Azimuthal Equal-Area projection 0 1,000 kilometers 0 1,000 miles 500 500 MekongR . Yangtze R. Xi R. Brahmaputra R. SonghuaR. Yello w R. Amur R . H I M A L A Y A S GOBI DESERT Plateau of Tibet Taklamakan Desert Hainan T i a n S h a n Kun l un Shan South China Sea PACIFIC OCEAN East China Sea Yellow Sea Population Distribution in China China: The World’s Most Populous Country 433
The Use of Posters in China
China uses posters to promote government policies. This poster supports the one-child policy. Traditionally, boys are favored. The government, however, is trying to change this way of thinking. This poster shows parents who are happy with their one daughter.

2. Plan One: Slow Population Growth
Great Teacher. Great Leader. Great Supreme Commander. Great Helmsman. These names were used to describe one of China’s most important leaders, Mao Zedong. Mao led a revolution that brought a communist government to power in China in 1949. During his long rule of the new People’s Republic of China until his death in 1976, Mao brought considerable change to China.
The Challenge: Rapid Population Growth Mao believed that large families would make China strong. Under his rule, China’s population grew rapidly. With women, on average, giving birth to four or five chil dren, the natural rate of increase rose to about 3 percent.
In 1958, Mao launched a program called the Great Leap Forward, which was a plan to help China become a modern industrial country. In other countries, such modernization has been achieved through the use of new technology, such as factory machines and computers. However, Mao thought that China could “leap forward” by getting more work out of its huge population.
One goal of the Great Leap Forward was to increase the production of steel. Across the country, small “backyard furnaces” were set up, and people were told to melt down their metal possessions. Bicycles, cooking pans, iron bed frames, and even doorknobs were melted to make steel. Another goal was to increase food production, and small farms were lumped together to create large factory farms.
Despite people’s hard work, the Great Leap Forward did not turn China into an industrial giant. Production did not increase as Mao had anticipated. At the same time, severe droughts across China resulted in famine, and more than 20 million people died of starvation between 1958 and 1962. Those deaths were a tragic reminder that China could no longer support its rapidly growing population.
Lesson 30434
The Proposed Solution: The One-Child Policy After Mao’s death in 1976, the Chinese government took steps to control population growth. In 1979, the government began a family-planning program known as the one-child policy. This program limited most married couples to just one child. However, in some rural areas, couples were allowed to have a second child. The government rewarded couples who followed the policy and punished those who did not.
Over time, the Chinese government made changes to the one-child policy and focused more on rewards than on punishments. Families received benefits, such as cash, for having just one child. Punishments for having more children than allowed became less severe than in the past.
The one-child policy remained in effect in China until the end of 2015. It was then replaced by the two-child policy in January 2016. However, families still must request government permission to have a second child.
The Benefits: Slower Population Growth China has not yet reached zero population growth, but the restrictions on having children have been effective in moving the country toward that goal. However, China’s population continues to grow, and its birth rate increased in 2016. Yet the birth rate remains much lower than before the one-child policy.
Slower population growth has had many benefits for China. It has reduced the strain on food and water supplies, and it has lessened the problem of having too many workers for too few jobs.
Families have benefited in other ways as well. Mothers and babies tend to be healthier in small families. With fewer children to support, parents have more money to spend on other things, and women have more time for a career because they have fewer children to care for.
The Costs: Less Choice, an Aging Population, and Natural Disasters The restrictions on having children have not been completely successful. Many people do not want to be told how many children they can have, especially in rural areas where large families are a tradition.
The one-child policy, in particular, clashed with other traditions, too. Chinese families prefer having sons because sons continue the family name, and they are expected to care for aging parents. Regardless, there are fewer children overall to care for older family members. This change has dramatically affected the dependency ratio, which is one of the main reasons China introduced the two-child policy.
Because boys are still preferred, some couples choose to end a pregnancy rather than have a girl. Although China has outlawed these practices, not everyone follows the law. Today about 113.5 boys are born for every 100 girls in China; the natural sex ratio is 105 boys for every 100 girls. This imbalance has led to a “marriage crisis” in China because there are far more men than women of marrying age.
There is another cost as well. The loss of a child in a natural disaster is always tragic, but the restrictions on having children can make the impact even more terrible. For example, in 2008, an earthquake killed more than 5,000 children in one Chinese province. As a result, many par ents lost their only child—the only child they were allowed to have under the one-child policy. The government decided to permit these parents to have another child if they could. However, many were too old or other wise unable to have children, making the disaster even more painful.
2050 (Estimated)
Magenta Yellow Black China,
Population Changes in
Cyan Magenta Yellow Black China, 2050
st Proof
Introduced in 1979, the one-child policy changed the population distribution in China. Compare the two population pyramids. If the rate of growth continues under the current two-child policy, China’s population distribution
eventually look like the pyramid
China
will
on the bottom. Population (in millions) 0–4 0102030405060102030405060 Male Female 5–9 10–14 15–19 20–24 25–29 30–34 35–39 40–44 45–49 50–54 55–59 60–64 65–69 70–74 75–79 80+ Age TCI17 10 3 GA_SE_30_3-b.eps Cyan
20 08 Fir st Proof Population (in millions) 0–4 0102030405060102030405060 Male Female 5–9 10–14 15–19 20–24 25–29 30–34 35–39 40–44 45–49 50–54 55–59 60–64 65–69 70–74 75–79 80+ Age TCI17 10 4 GA_SE_30_3-c.eps
Fir
Source: United Nations Population Division. China, 2017 China,
China: The World’s Most Populous Country 435
The Three Gorges Dam
The Three Gorges Dam was built to generate clean energy. As the lake behind the dam was filled, much of the beautiful scenery in the Three Gorges area was lost.
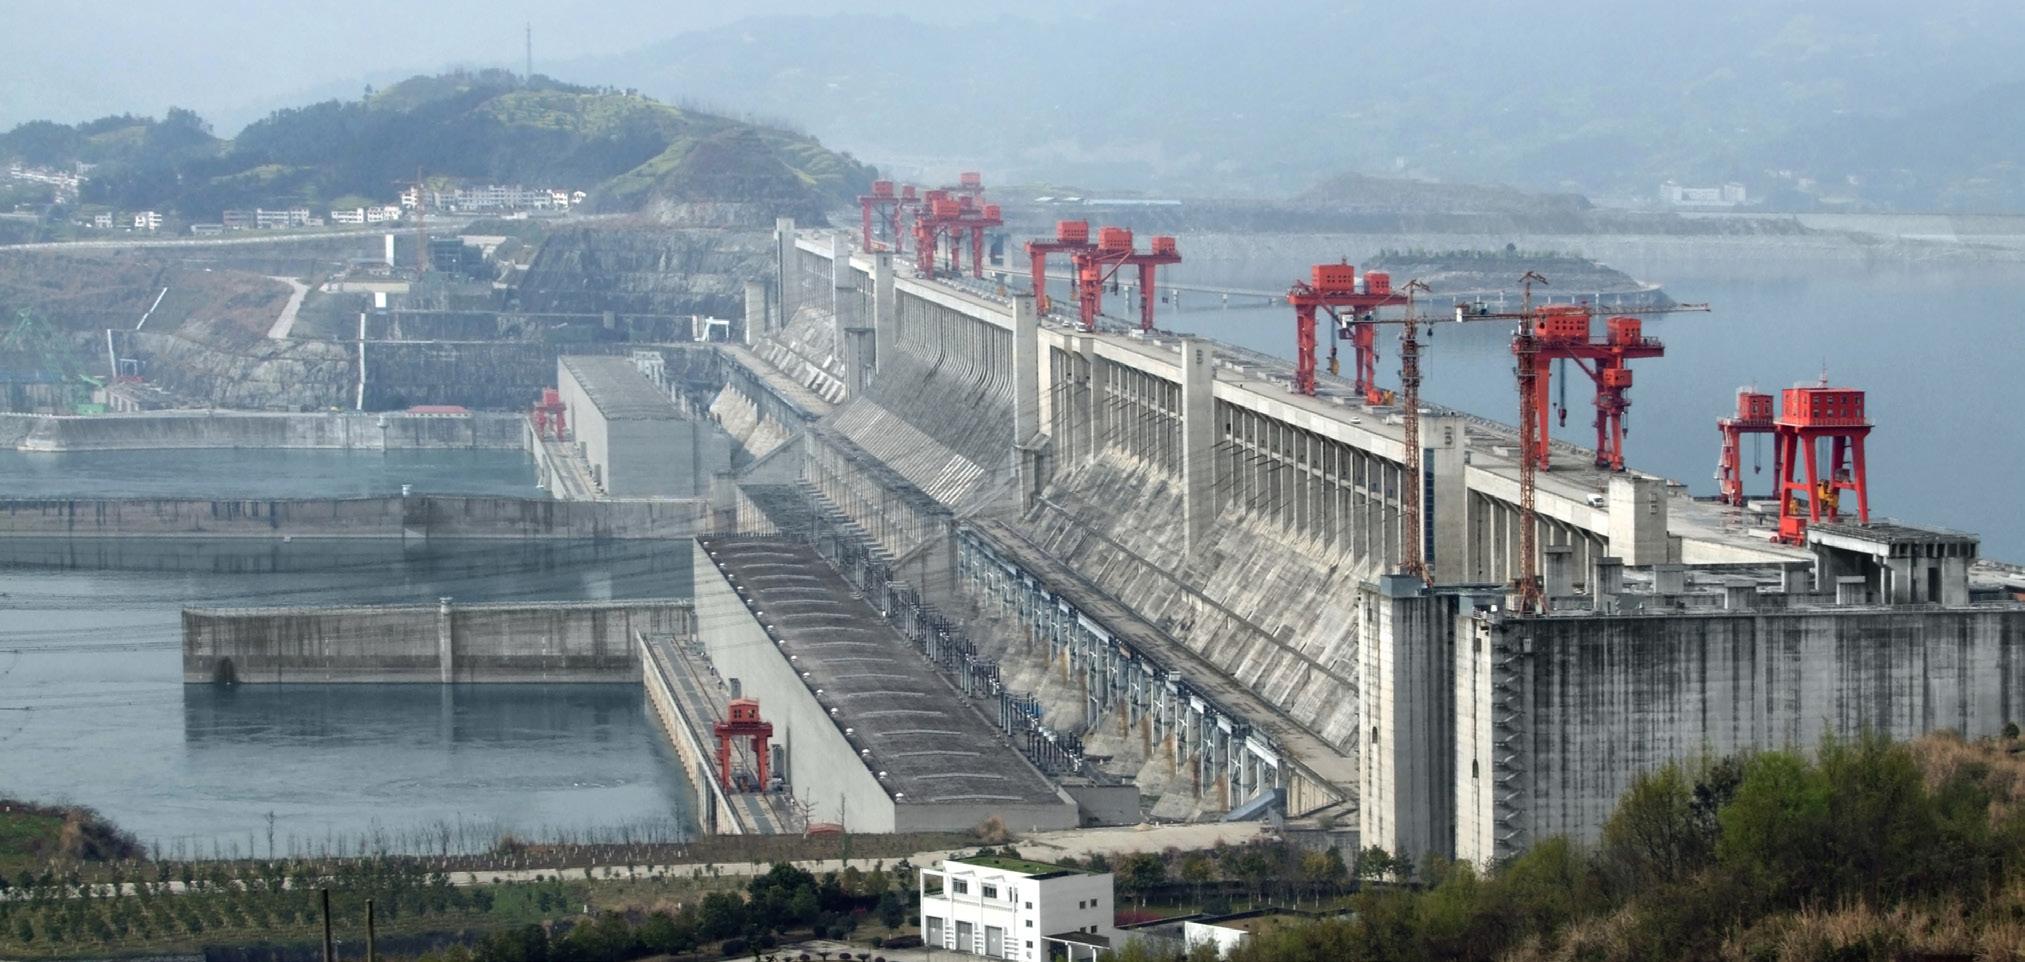
3. Plan Two: Provide More Clean Energy
Huge populations require huge amounts of energy. Most of the elec tricity the Chinese people need is supplied by power plants that burn coal. Smoke containing toxic chemicals such as mercury and sulfur dioxide pours out of China’s power plants and factories, and high winds transport the poisonous plumes around the world. In the United States, air pollu tion from China has been observed from coast to coast, and pollution from Asia is considered the biggest contributor to smog in the West.
The Challenge: Meeting Rising Energy Demands China has the largest consumption of energy in the world, and as its population grows, so do its energy needs. In 2016, the nation used coal to meet 62 percent of its energy needs, burning more coal than any other country.
China possesses large deposits of coal, but coal is not a clean fuel. When burned, it pollutes the air, and diseases related to air pollution have become leading causes of death in China. One study even linked one-third of deaths in the country to pollution. To improve the environ ment, the Chinese government aims to reduce the country’s dependence on coal for energy consumption. In 2020, coal made up 56.8 percent of energy consumption.
The Proposed Solution: Generate More Hydroelectric Power
To meet its growing energy needs without increasing pollution, China has looked for cleaner sources of energy. One of the cleanest sources is hydroelectric power, which is power that is generated by water flowing through power plants in dams.
In 1993, China began construction of the world’s largest dam. The immense dam spans the Chang Jiang (Yangtze River), the longest river in Asia. Flowing more than 3,700 miles through China, the Chang Jiang has been relied on for thousands of years to transport people and cargo and to provide fresh water for homes and crops. The dam, completed in 2009, provides as much as one-ninth of China’s electricity as well.
The dam across the Chang Jiang was built in a beautiful canyon area called the Three Gorges. The Three Gorges Dam is around 600 feet high and more than 1.5 miles wide. The reservoir behind the dam stretches upstream for about 400 miles.
Lesson 30436
The Benefits: Clean Energy, Flood Control, and Shipping Hydro electric dams provide many benefits, including clean energy from a renewable resource. The power plant at the Three Gorges Dam has 34 electric generators, which can produce more electricity than any other hydroelectric plant in the world. And they do so without polluting the air.
A second benefit is flood control. Historically, the Chang Jiang has flooded about every 10 years, resulting in widespread death and destruc tion. The dam is supposed to reduce flooding by holding back the extra water that flows downstream during heavy rains. However, floods in recent years have led many to question whether the dam can actually stop flooding. Moreover, silt and other debris have become stuck in the dam.
In addition, the dam has helped river shipping. Before the dam was built, the Three Gorges area was difficult to navigate by boat. The reservoir behind the dam is much safer for river travel. A ship elevator lifts boats from the river below the dam up to the level of the lake, and locks move larger ships. With the completion of the dam, elevator, and locks, shipping capacity has already reached government targets set for 2030, and shipping costs have dropped by about one-third.
The Costs: Lost Cities and Habitat Although the Three Gorges Dam has benefitted China, it has come at a cost. The Three Gorges area contained hundreds of ancient settlement sites. When water backed up behind the dam, these archeological sites disappeared, and all that they could have revealed to historians about China’s distant past is now lost.
The reservoir covers up more than history. It has drowned 13 cit ies, 140 towns, hundreds of villages, and tens of thousands of acres of farmland. More than a million people were forced to relocate as their homes disappeared under water. The Chinese government promised to help these people start new lives elsewhere, but such assurances have not made up for what they lost.
The dam also altered the Chang Jiang ecosystem. As the lake filled, hundreds of plant and animal species lost their habitats. For example, since construction of the dam began, the Chinese river dolphin and the Chinese paddlefish, species that live only in the Chang Jiang, have become critically endangered and may already be extinct.
Finally, the dam sits along an earthquake fault. Some scientists worry that the weight of the dam and the water it holds may make a major earthquake more likely to occur. If such a quake damaged the dam, a wall of water from the reservoir could rush downstream, causing a disaster worse than any previous Chang Jiang flood. In fact, the deadly 2008 earthquake in China occurred only 3.5 miles from a dam that had been com pleted in 2006.
Lost Cities and Historic Sites
The damming of the Chang Jiang has affected the landscape for hundreds of miles along the river. Because of this, some people call the dam
“China’s new Great Wall.” This map shows the cities and historic sites that have been lost under the reservoir’s waters. Some of these sites date back to before 2000 b c e
Cities and Historic Sites of the Three Gorges Area
GORGES
N S EW 0 80 kilometers 0 80 miles Albers Conic Equal-Area projection 40 40 City Historic site Flooded area CHINA Chongqing Fuling Nanchong Wanxian Daxian ZhichengLichuan Changde Yichang Zigui Zhang Fei Temple Shibaozhai Baidicheng Temple Qu Yuan Memorial Three Gorges Dam White Crane Rock Dingfang Temple Towers City of Ghosts THREE
Chang Jiang ChangJiang Jialing TCI5 522 GA_SE_30_4-B.eps Second Proof
China: The World’s Most Populous Country 437
Special Economic Zones
CHINA
China’s “Open” Areas
The map shows some of China’s special economic zones (SEZs) along with the cities around which they developed. It also shows “open cities,” which operate like SEZs. In these “open” zones, businesses are not as tightly controlled as in other parts of China.
4. Plan Three: Promote Economic Growth
A virtual reality theme park that immerses users in games and activ ities. An intelligent camera that recognizes people based on their walk. A flexible, curved display screen that is less than 0.1 mm thick. These were just a few of the inventions displayed in 2017 at the China Hi-Tech Fair in the city of Shenzhen. This fair is held every year to promote Chinese technology to visitors from around the world. This is just one way China is working to promote economic growth.
The Challenge: Increasing Jobs and Wealth China was not always open to interactions with businesspeople from other countries. Under the rule of Mao Zedong, the country had looked inward because Mao’s goal was to make China economically self-sufficient. His government controlled the economy, with government officials deciding what goods should be produced and at what price. The government also controlled who should do what job and for what pay.
You have read about the failure of the Great Leap Forward, Mao’s effort to transform China into a modern industrialized country. Just as China’s economy began to recover from that experiment, Mao launched a new one. In 1966, he called for a “cultural revolution,” with the goal of creating a new society in which everyone in China would follow his ideas and work for the common good.
Like the Great Leap Forward, the Cultural Revolution was a disaster. Many people who were suspected of not being loyal to Mao were sent to prison. Schools were closed as students joined the revolution. Meanwhile, factory and farm production dropped because there were not enough workers. The country was in chaos.
The Proposed Solution: Special Economic Zones After Mao’s death, new leaders took control of China. These leaders were more interested in economic growth than in changing society. They gave up the goal of creat ing a self-sufficient China and instead made plans to open China’s economy to the rest of the world. They hoped that foreign companies would start businesses, create jobs, and bring modern technology to China.
From Farmland to Financial Center
Before 1990, Pudong was boggy farmland on the outskirts of Shanghai. Today, the Pudong New Area receives special economic and development support from the government. Like SEZs and open cities, Pudong has attracted many foreign businesses.
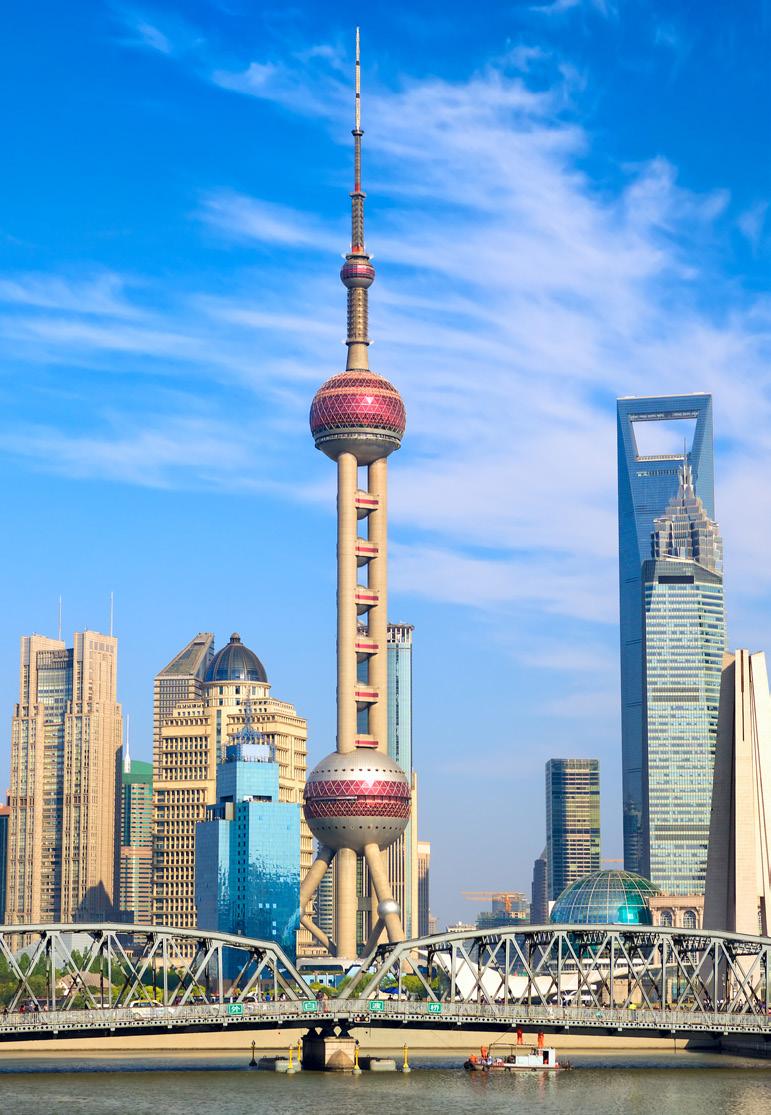

HAINAN Qinhuangdao DalianTianjin Yantai Qingdao Lianyungang Nantong PudongShanghai Ningbo Wenzhou Fuzhou Xiamen ShantouGuangzhou ShenzhenZhuhai Haikou Beihai Zhanjiang PACIFIC OCEAN Special economic zone SEZ Capital Open city TCI5 523 GA_SE_30_5-A.eps Cyan Magenta Yellow Black Fir st Proof Lesson 30438
There was just one problem with this new policy. Foreigners were not willing to come to China if the government planned to control their businesses. Foreign companies demanded far more freedom than the government was willing to give to Chinese businesses.
China addressed this problem by setting up special economic zones (SEZs), special areas with laws that differ from those in the rest of the country. In China’s SEZs, businesses have the freedom to determine what goods to produce and at what prices to sell them. Most of the goods that are produced in SEZs are for export to other countries.
The first four SEZs opened on China’s south coast in 1980, including the one that developed around the city Shenzhen. More SEZs have been created since then, and the government has also established open cities and new areas, both of which are similar to SEZs.
The Benefits: More Jobs and Better Standard of Living Special economic zones have brought economic growth to China. Shenzhen went from a sleepy town of perhaps 12,000 people in 1980 to an international trade center with around 12 million today. Other SEZs have experienced similar growth.
China’s SEZs, open cities, and new areas have created millions of new jobs. These jobs are often filled by migrant workers from rural areas. Although wages are not high, most SEZ factory workers earn more than they could in their home villages. Many of these migrant workers are making enough money both to support themselves and to send some money back home to their families. With this extra money, their families are able to improve their own standard of living.
The Cost: Income Gaps Special economic zones have created problems as well. One problem is a widening income gap between rich and poor. China’s booming SEZs have created a lot of wealth, but that wealth has not been spread evenly throughout the country. There is a major divide between urban and rural populations, and the average urban income is nearly three times the average rural income. Also, the top-earning 1 percent owns one-third of the nation’s wealth.
Another problem has been the creation of a “floating population” of rootless migrant workers who drift back and forth between their villages and jobs in the SEZs, open cities, and new areas. These migrant workers often find only low-paying, part-time jobs, but sometimes they are unable to find work at all and must return to their native villages.
Summary
In this lesson, you read about the most populous country on Earth. You learned about the roles that population growth and famine have played in China’s history. You discovered how a population’s rate of natural increase and doubling time are related. You also looked at how China is working to achieve three goals: zero population growth, clean energy, and economic growth.
China is not the only country attempting to deal with population growth. By 2050, the number of people in the world is expected to increase by over 2 billion, and most of this growth will happen in devel oping countries. Think about the problems these countries will face as you examine rates of natural increase in the next section.
HDI Rank by Province,
HDI Rank
Top third
Middle third
Bottom third
Source: United Nations Development Programme.
Varied Living Standards
TCI17 10 5
GA_SE_30_5-c.eps
Cyan Magenta Yellow Black
HDI Rank by Pr ovince, 20 05
Fir st Proof
The Human Development Index (HDI) measures the well-being of a people. Rankings are based on per capita GDP, education levels, life expectancy, and other variables. As this map shows, some parts of China rank higher than others on this index.
2010
China: The World’s Most Populous Country 439
The map shows rates of natural increase in countries around the world. At these rates, the populations of the 50 poorest countries will more than double by the year 2050. The tables display information about education for women and spending on health care in countries with various rates of growth.
How might money spent on health care affect a country’s rate of natural increase? With better health care, a country’s infant mortality rate declines, while life expectancy rises. Parents worry less that their children will not survive childhood, and as a result, they may have fewer children. Better health care also means improved access to modern family-planning meth ods, which help couples plan how many children they will have.
How might education for women affect a country’s rate of natural increase? Women who are educated generally have more control over the number of children they have. In addi tion, educated women often marry later in life and may put off having children to focus first on a career. When these women do have children, they usually have fewer than women who lack an education.
How might a country with rapid population growth benefit by slowing its rate of natural increase? Countries that are able to slow their rates of natural increase will generally grow wealthier. With fewer children, they are better able to educate each child. These countries also have more money to spend on providing health care. A healthy, educated popula tion will attract increased trade and busi ness, often leading to economic growth and thus a rise in living standards.
Rate of Natural Increase
Rapid
Moderate (1.0%
Slow (0% to 0.9%)
1.9%)
Negative (less than 0%)
World average = 1.2%
Global Connections
60°S 40°S 20°S 80°S 40°W60°W80°W100°W120°W140°W160°W 20°N 40°N 60°N 80°N 0° Equator Annual
(2% or higher)
to
TCI17 106 GA_SE_30_07-a.eps Cyan Magenta Yellow Black Rat e o f Natura l Increase Se con d Proof Rate of Natural Increase Around the World, 2013 Source: United Nations Development Programme. Note: Data are for the appropriate age group (for example, 14 to 18 years of age). Females Enrolled in Secondary Schools, 2016 Laos Uganda Mexico 50% 58% Turkey 85% Iceland 84% New Zealand 99% Lithuania 96% Germany 97% 22% Lesson 30440
180°∞140°E 160°E120°E80°E 100°E60°E20°E 40°E0°20°W40°W60°W N S EW 0 2,0 0 0 kilometers 0 2,00 0 miles Robinson projection 1,0 00 1,000 Source: Population Reference Bureau. Sources: Population Reference Bureau. World Bank. Central Intelligence Agency. *Amounts are in U.S. dollars. Rate of Natural Increase Rapid Moderate Slow Negative Country/ Rate, 2015 Laos 2.0% Uganda 3.4% Mexico 1.3% Turkey 1.1% Iceland 0.8% New Zealand 0.8% Lithuania –0.1% Germany –0.1% Per Person Spending on Health Care*, 2014 $33 $52 $677 $568 $4,662 $4,896 $1,063 $3,703 Per Capita GDP*, 2016 $6,900 $2,300 $18,900 $25,000 $49,200 $37,300 $30,000 $41,200 Health Care Spending and GDP in Eight Countries China: The World’s Most Populous Country 441
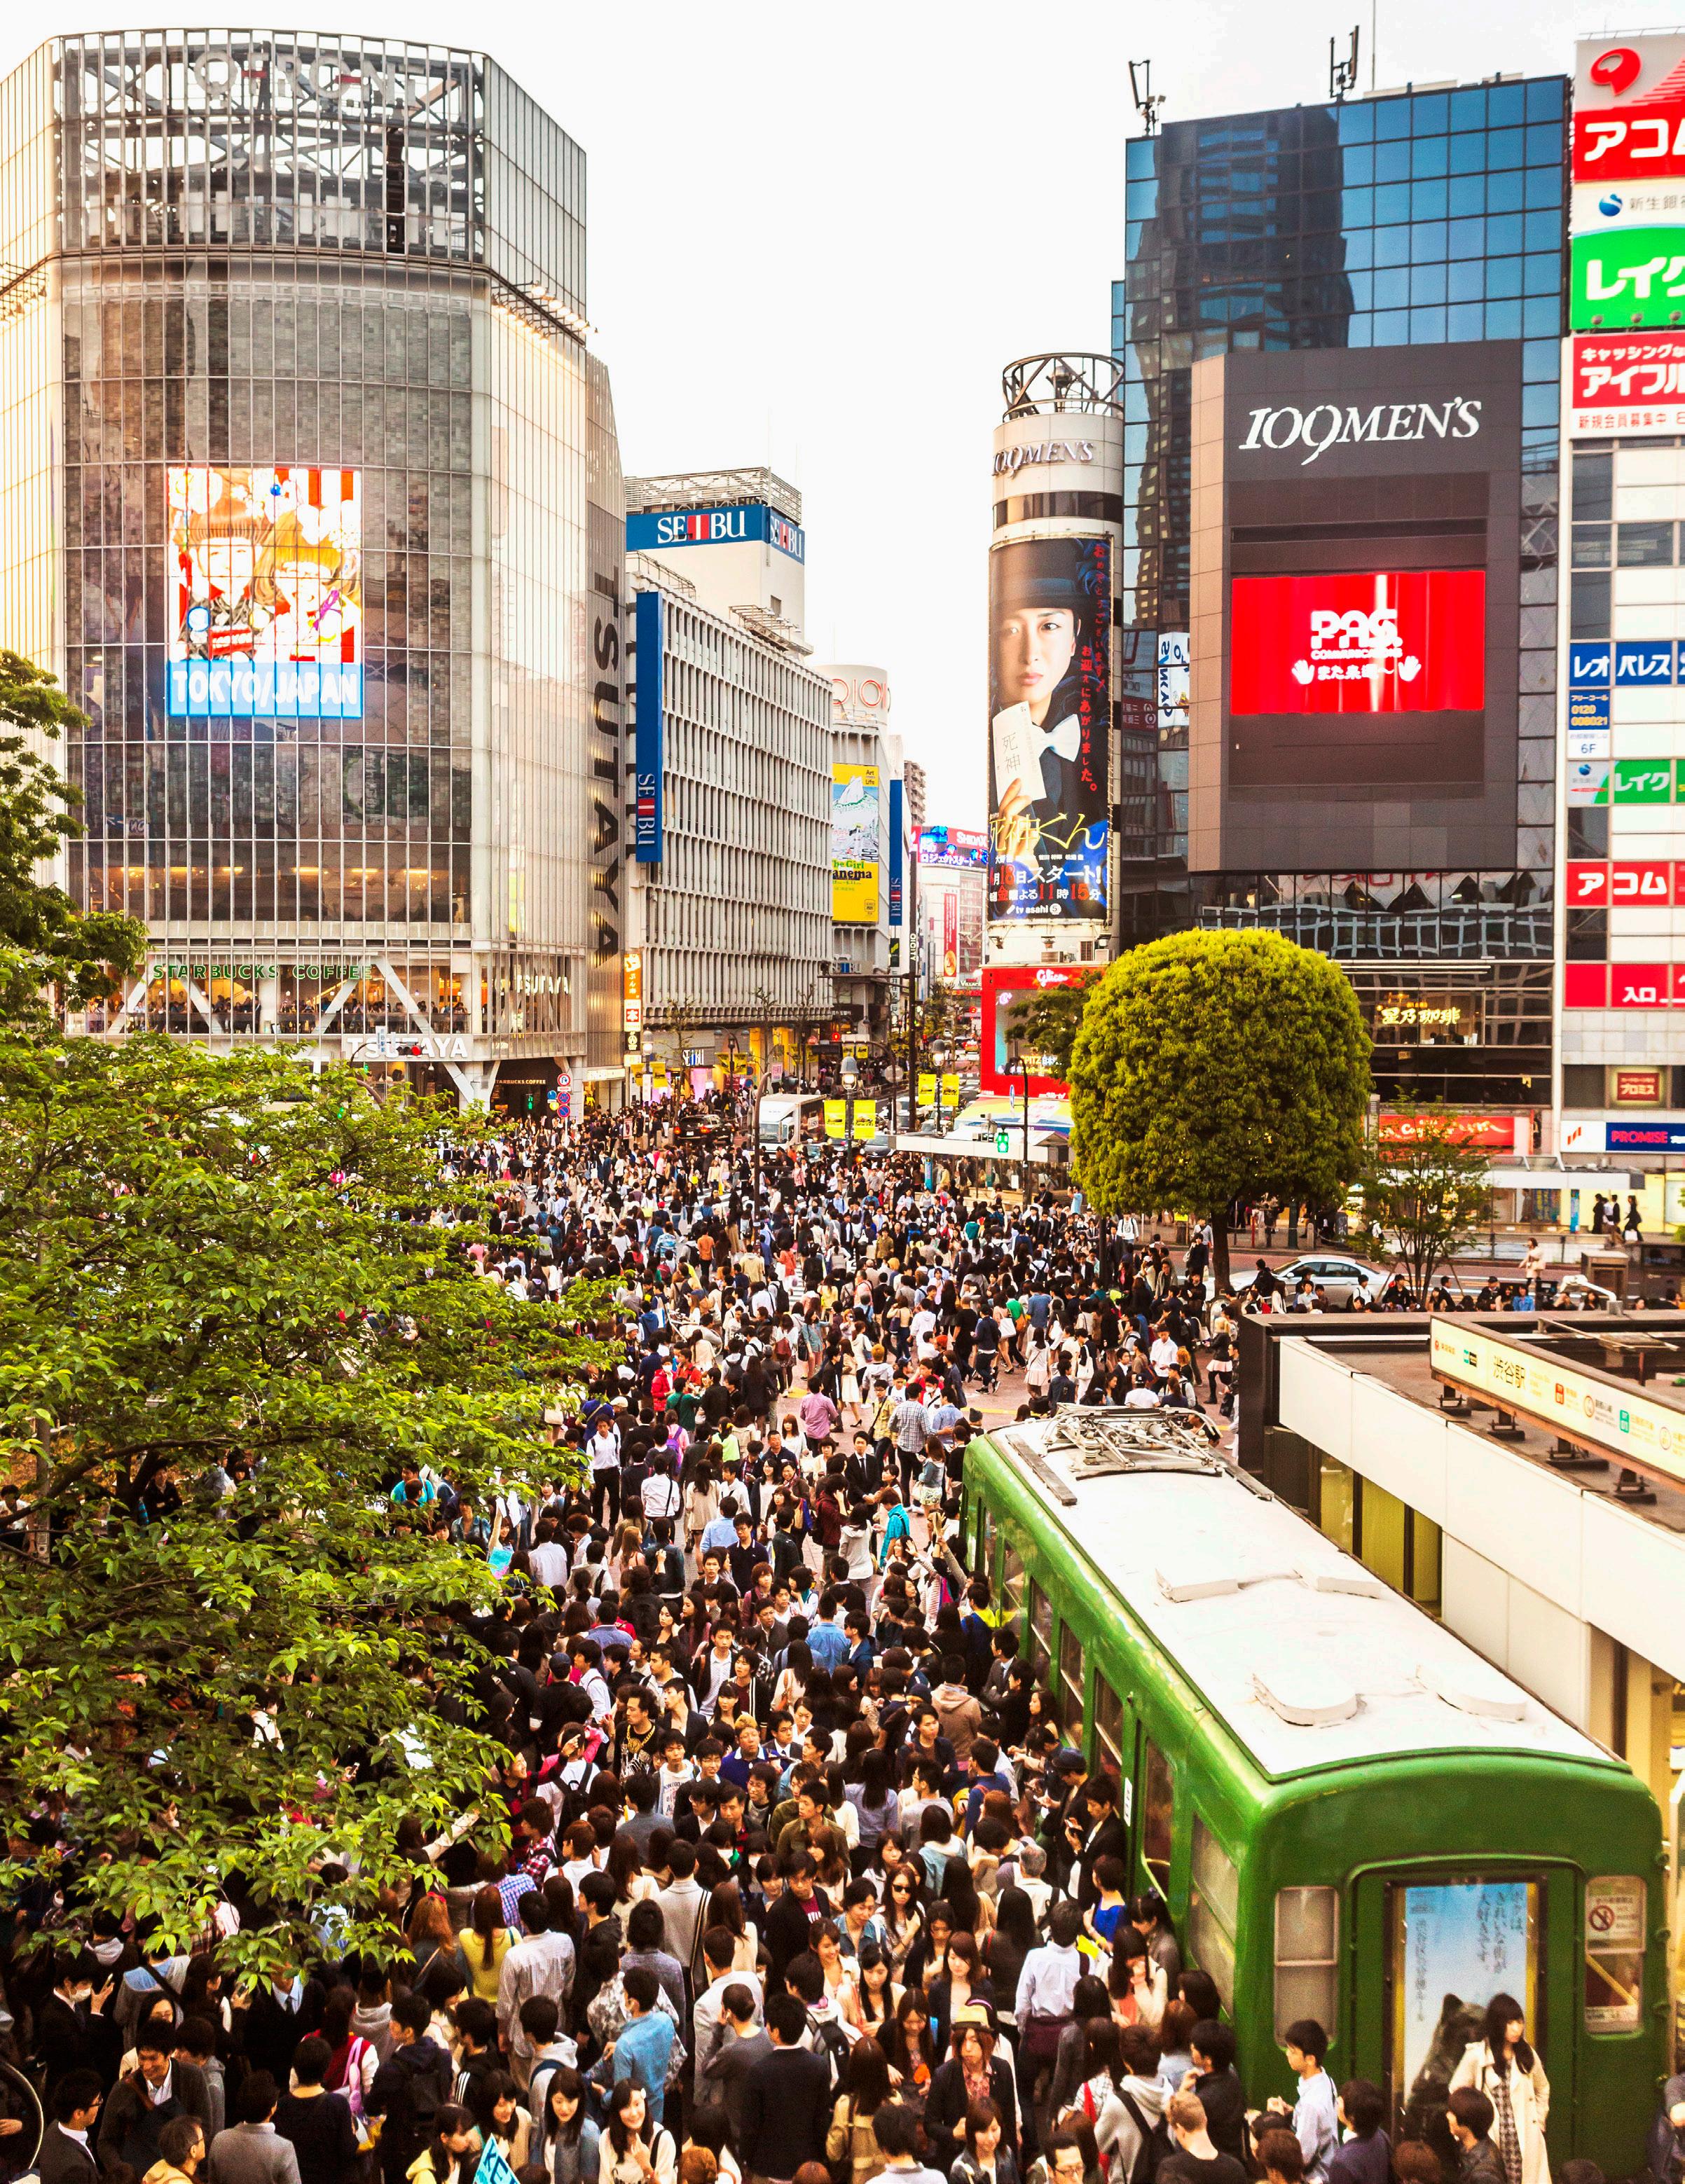
Lesson 31442
Population Density in Japan: Life in a Crowded Country
Introduction
Imagine standing on a subway platform in Tokyo, Japan, during rush hour. The station is so crammed with people that it is nearly impossible to move. Your train thunders into the station and lurches to a stop. As the car doors open, the crowd on the platform surges forward, and in the crush, the person behind you steps on your heel, causing your shoe to come off. You reach down to pick it up, but there are too many people even to bend over. You are swept into the train without your shoe. Luckily, a station attendant will pick up your shoe and hold it for you to claim on your return trip. This is hardly the first time someone has lost a shoe during the Tokyo rush hour. And it certainly will not be the last.
Tokyo is the most populous urban center in the world. It is also the capital of the densely populated country of Japan. A country’s population density is the average number of persons in a unit of area, such as a square mile or square kilometer. Population density is calculated by dividing the total number of people in a country by its total land area. The higher the result of that calculation, the more crowded the country.
In 2017, the population density of Japan was 899 persons per square mile. In comparison, the United States had a population density of 92 persons per square mile. This means that Japan is nearly 10 times as densely populated as the United States. In this lesson, you will learn how Japan’s high population density affects how people live and die in that crowded country.
How does population density affect the way people live?
The map in the center of this diagram shows where people live in Japan. The areas in red are the most densely populated parts of the country. Around the map are four symbols. They represent aspects of life that are affected by population density. Keep this diagram in mind as you try to answer the Essential Question.
Crowds move through the
area of Tokyo.
Shibuya
Essential Question GA_SE_31 -01b C M Y K 1st P roof 10-7-20 05 GA_SE_31 -01e_rv1 C M Y K 2nd P roof 10-24-20 05 Transportation Land Use Housing Graphic Organizer Health LESSON 31 443
Mount Fuji over Tokyo Bay Japan’s mountains limit the amount of land that is suitable for living. Many of these mountains, like Mount Fuji, are volcanoes. Mount Fuji was once thought to be a sacred place. Today, this beautiful volcano attracts weekend hikers eager to escape crowded cities.
1. The Geographic Setting
Japan occupies an archipelago, or chain of islands, that lies off the East Asian mainland. On a map, the Japanese archipelago forms the shape of a thin crescent moon. The land area of Japan consists of four large islands and about 6,900 smaller ones that together form a country about the size of the state of Montana. To the west, the Sea of Japan (East Sea) separates Japan from its nearest neighbors, Korea and China. To the east lies the vast Pacific Ocean.
Japan enjoys a temperate climate, with warm, humid summers and relatively mild winters. Heavy snowfall is limited to high elevations and the most northern of Japan’s islands. Abundant summer rainfall makes Japan an ideal place for growing rice and other crops.
A Mountainous Landscape
The Japanese archipelago was formed millions of years ago by mountains welling up from the sea. The mountains arose when tectonic plates collided deep beneath the Pacific Ocean. Volcanoes welled up in the cracks between the plates. Over millions of years, liquid rock flowing from the volcanoes built up into mountains that eventually emerged from the sea.
Today, a chain of volcanic mountains forms the backbone of Japan. Many volcanoes are still active, although no one knows just when they might erupt again. The highest and most famous Japanese volcano is Mount Fuji, whose snowcapped cone towers above the city of Tokyo.

The tectonic plates that gave birth to Japan continue to grind against each other beneath the sea, and occasionally one of them slips, causing an earthquake to rattle the islands. Small tremors occur on an almost daily basis in Japan. Major earthquakes are less frequent but can cause extensive damage and loss of life. Undersea earthquakes can also trigger huge sea waves known as tsunamis. When one of these destructive waves hits the Japanese coast, entire villages can be washed out to sea.
Limited Land for Living Only about an eighth of Japan is arable land, or land suitable for agriculture. The remaining land is too steep to plow and plant or too mountainous to support large towns and cities.
The amount of arable land affects population distribution, or where people live. The majority of Japan’s more than 126 million people live on the four main islands of Hokkaido, Honshu, Shikoku, and Kyushu. But they are not evenly distributed; most people live on limited flat land near the coast or in narrow river valleys.
Because people tend to clump on arable land, geographers have developed two ways of measuring how crowded a country is. The first is by looking at a country’s arithmetic population density. This measure is calculated by dividing the number of people in a country by its total land area. As you read in the introduction, Japan’s arithmetic population density is about 899 persons per square mile.
The second way of measuring crowding is by looking at a country’s physiologic population density. This measure is calculated by dividing the number of people in a country by the amount of arable land. With such limited land for living, Japan’s physiologic population density is 7,695 persons per square mile. The United States, in comparison, has a physiologic population density of 512 persons per square mile. Both population density measures tell us that Japan is a crowded country.
Lesson 31444
Geoterms
arable land land
population density the population of a country divided by its total land area
physiologic population density the population of a country divided by its arable land area population distribution where people live in a country, whether crowded together in cities or spread out across the countryside
Hokkaido
ea of J apan (East S ea)
Honshu
CIFIC OCEAN
Features of
ea of J apan (East S ea)
Honshu
CIFIC OCEAN
When Two Plates Collide
Earth’s
Earth’s
under
below
these two tectonic plates rub against each other, Japan is hit with an earthquake. This map shows some of the earthquakes that have occurred in this area.
A Mountainous Landscape

percent of Japan is covered with mountains.
rivers flowing out of these mountains are too short and steep for boat travel, but they do provide
power to Japan.
suitable for growing crops arithmetic
About 70
The
hydroelectric
crust below the Pacific Ocean is called the Pacific Plate. It slides
the Eurasian Plate, which is
crust
the continents of Europe and Asia. When
Kyushu Shikoku
S
PA
Lambert Conformal Conic projection N S EW 0 30 0 kilometers 0 30 0 miles 150 150 8.0 and above 7.5–7.9 7.0–7.4 6.5–6.9 6.0–6.4 Magnitude Seoul Tokyo Osaka
Nagoya Yokohama
Sapporo Kyushu Shikoku
Hokkaido S
PA
Lambert Conformal Conic projection N S EW 0 30 0 kilometers 0 30 0 miles 150 150 Feet 5,001–10,000 2,001–5,000 1,001–2,000 0–1,000 Below sea level Meters 1,526–3,050 611–1,525 306–610 0–305 Below sea level Elevation JAPAN Eurasian Plate Pacific Plate Sea of Japan Sea Level PACIFIC OCEAN Earthquakes in Japan Physical
Japan Population Density in Japan: Life in a Crowded Country 445
Limited Space
Because space is limited in Tokyo, many parking lots reach upward. To save space, cars are lifted into place on elevators. No space is needed for people to walk to their cars or for cars to drive to parking spots.

2. How Population Density Affects Transportation
What happens when millions of people in a densely populated meg alopolis all leave for work at around the same time in the morning? It takes most of them a very long time to get there! The average commute time in Tokyo is more than an hour and a half each day. This adds up to a whopping 425 hours or more a year, which is enough time to watch around 200 movies or take 40 flights from Tokyo to San Francisco.
Public Transportation The Japanese have adapted to busy rush hours by creating an extensive and efficient public transit system. Underground subways whisk commuters from one part of a city to another, while passenger trains rush travelers from town to town. Japanese subways and trains run often and are almost always on time to the minute. You can set your watch by them.
Rush hour in a Tokyo subway station is an amazing sight. Mobs of commuters bound for work mix with large groups of uniformed students heading for school. During times with heavy subway traffic, whitegloved subway workers stand on subway platforms and shove as many passengers as possible into the waiting cars before the doors close.
The Japanese have developed some of the fastest passenger trains in the world. Bullet trains—so named for their shape and speed—called Shinkansen travel between many cities. The Shinkansen race across the Japanese countryside at speeds of up to 200 miles per hour. That’s more than three times as fast as cars, which travel about 60 miles per hour on highways in those rare moments when there is no traffic congestion.
Private Cars and Parking Problems Despite their excel lent public transit system, many Japanese own their own cars and love to drive them. As car ownership has increased, traffic congestion has become part of daily life in Japan.
Cars create problems even when they are not moving. Finding a place to park in many places is such a headache that Japan instituted strict regulations about car ownership. Residents in most places cannot own a car unless they can prove they have a place off the street to park it. With parking space so limited, the use of high-rise parking lots that resemble giant shoe cabinets is common in Tokyo and other cit ies. These garages use computercontrolled elevators to stack cars on top of one another in narrow parking slots.
Lesson 31446
High-tech Graves
At this facility at Tokyo temple, the ashes of people are stored behind each small LED-lit Buddha statue. When family members arrive, they swipe an access card that causes the Buddha located by their loved one to change colors. This makes it easy to find their relative.
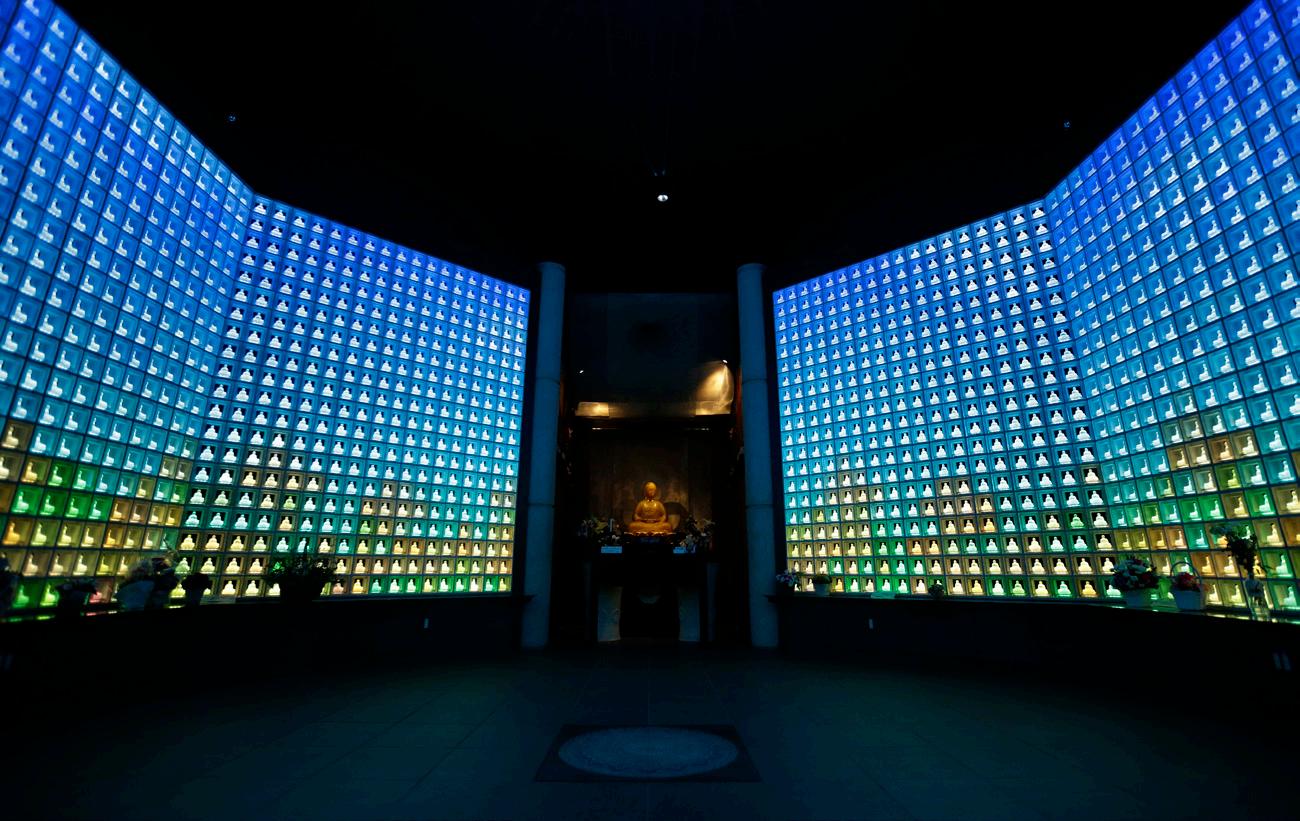
3. How Population Density Affects Housing
Because flat land for building is scarce in Japan, housing is expen sive. Most homes in Japan are smaller than those in the United States, and many people live in apartments that are no larger than the typical family room in an American home.
From the Country to the City The Japanese did not always live crowded into small homes. Before the mid-20th century, when Japan was largely rural, most people lived in spacious one-story homes. They also lived in extended families, with grandparents, parents, and children together under one roof.
In the 1950s, this pattern began to change. Many Japanese left the countryside to pursue educational or job opportunities in Japan’s growing cities. The houses and apartments available in urban areas were cramped compared to rural homes. With space so tight, the number of people living in extended families began to shrink. Today, most Japanese families are nuclear families, or families with just parents and their children.
Making the Most of Limited Space
The Japanese have developed a number of clever ways to make the most of their limited living space. One is to use rooms for more than one purpose. Many homes in Japan do not have separate bedrooms. At bedtime, mattresses called futons are taken from closets and spread on the floor of living rooms. In the morn ing, the futons are put away again.
The Japanese also make good use of limited space by shrinking almost everything that goes into a home. Japanese appliance makers produce small stoves and refrigerators to fit in tiny apartment kitchens. Gardeners who lack garden plots grow flowers and vegetables wherever there is dirt—for example, along the side of the road or even in a sidewalk crack. They also decorate their limited outdoor space with greenery, lining the sidewalks outside their homes with potted plants.
Japan’s population density even affects where people rest after death. Although almost all Japanese people are cremated after death, their ashes are often still buried. Most cemeteries in Japan are a jumble of family graves filling every inch of available space. Moreover, cemetery plots are expensive, especially in urban areas. For these reasons, alternatives to cemeteries, such as multi-story buildings and converted warehouses, have been established to store the ashes of the deceased.
Homes in the United States and Japan
GA_SE_31 -XX_rv2
M Y K
Japanese homes are smaller than those in the United States. A typical person in Tokyo has about 170 square feet of living space. A typical person in Washington, D.C., has about 740 square feet of living space.
Pr oof 10-4-20 05
C
3rd
740 square feet per person 170 square feet per person Population Density in Japan: Life in a Crowded Country 447
Terraced Rice Fields in Japan
The Japanese have claimed new land for farming by building terraces into hillsides. Working these rice fields on steep slopes is hard work.
4. How Population Density Affects Land Use
While land use may seem like a dull topic to most people, it is a vital issue for the neighbors of Tokyo’s bustling Narita Airport. For years, plans to expand Narita were blocked by local homeowners. When the government offered to relocate the homeowners to another area, neighbors threatened to burn down the new home of anybody who agreed to move.
Conflicts over land use are common in Japan because there is simply not enough land to meet everyone’s needs. This has forced the Japanese to find better ways to use the land they have and to create new land.
Building Up and Down One way to make more efficient use of land is to construct taller buildings. However, building skyward creates severe construction challenges in an active earthquake zone. Until 1963, build ing heights were limited in Japan for safety reasons.
The development of earthquake-resistant construction techniques has allowed the Japanese to raise that height limit. Using these techniques, the Japanese are able to erect lofty towers that can withstand severe shaking.
Another way to make more efficient use of land is to build under ground. Under many Japanese cities lie subterranean shopping centers filled with shops and restaurants. In Osaka, even the National Museum of Art is underground!
Creating New Land
The Japanese have created new land by filling in shallow wetlands with dirt and rubble. Much of Tokyo, for example, is built on filled-in bays and marshes. Filling wetlands saves precious farmland from urban development, but at the same time, it also destroys valuable fish and wildlife habitat.
Filled land is also unstable in earthquakes. In 1995, a massive earth quake hit the port city of Kobe, killing some 6,400 people and damaging $100 billion worth of property. Much of that property was on filled land.
Like the Incas of South America, the Japanese have created new land for farming by cutting terraces into hillsides. Terracing has made it possible to grow rice—Japan’s most important crop—on the islands’ mountain slopes.
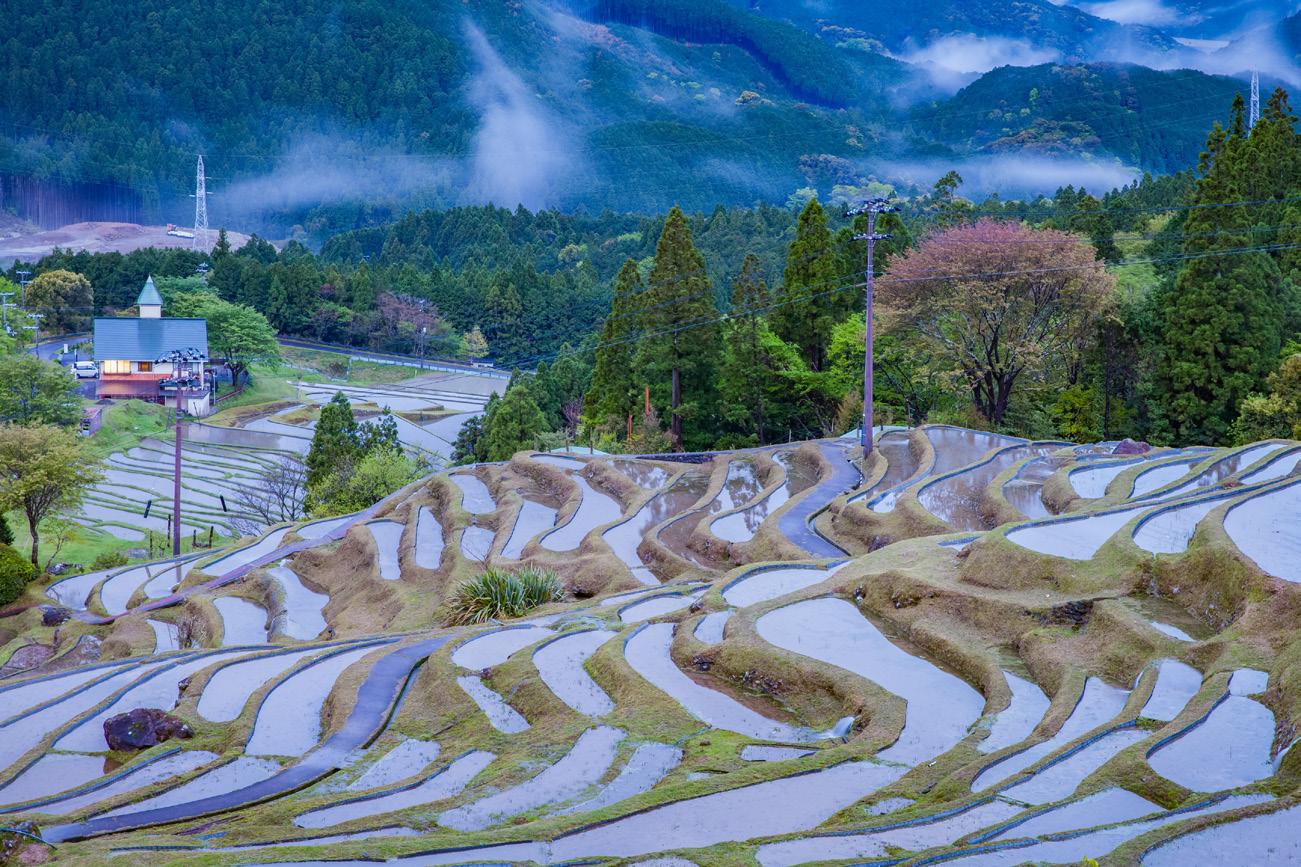
Lesson 31448
Land Use in a Japanese City
By building both up and down, the Japanese make efficient use of limited city land.
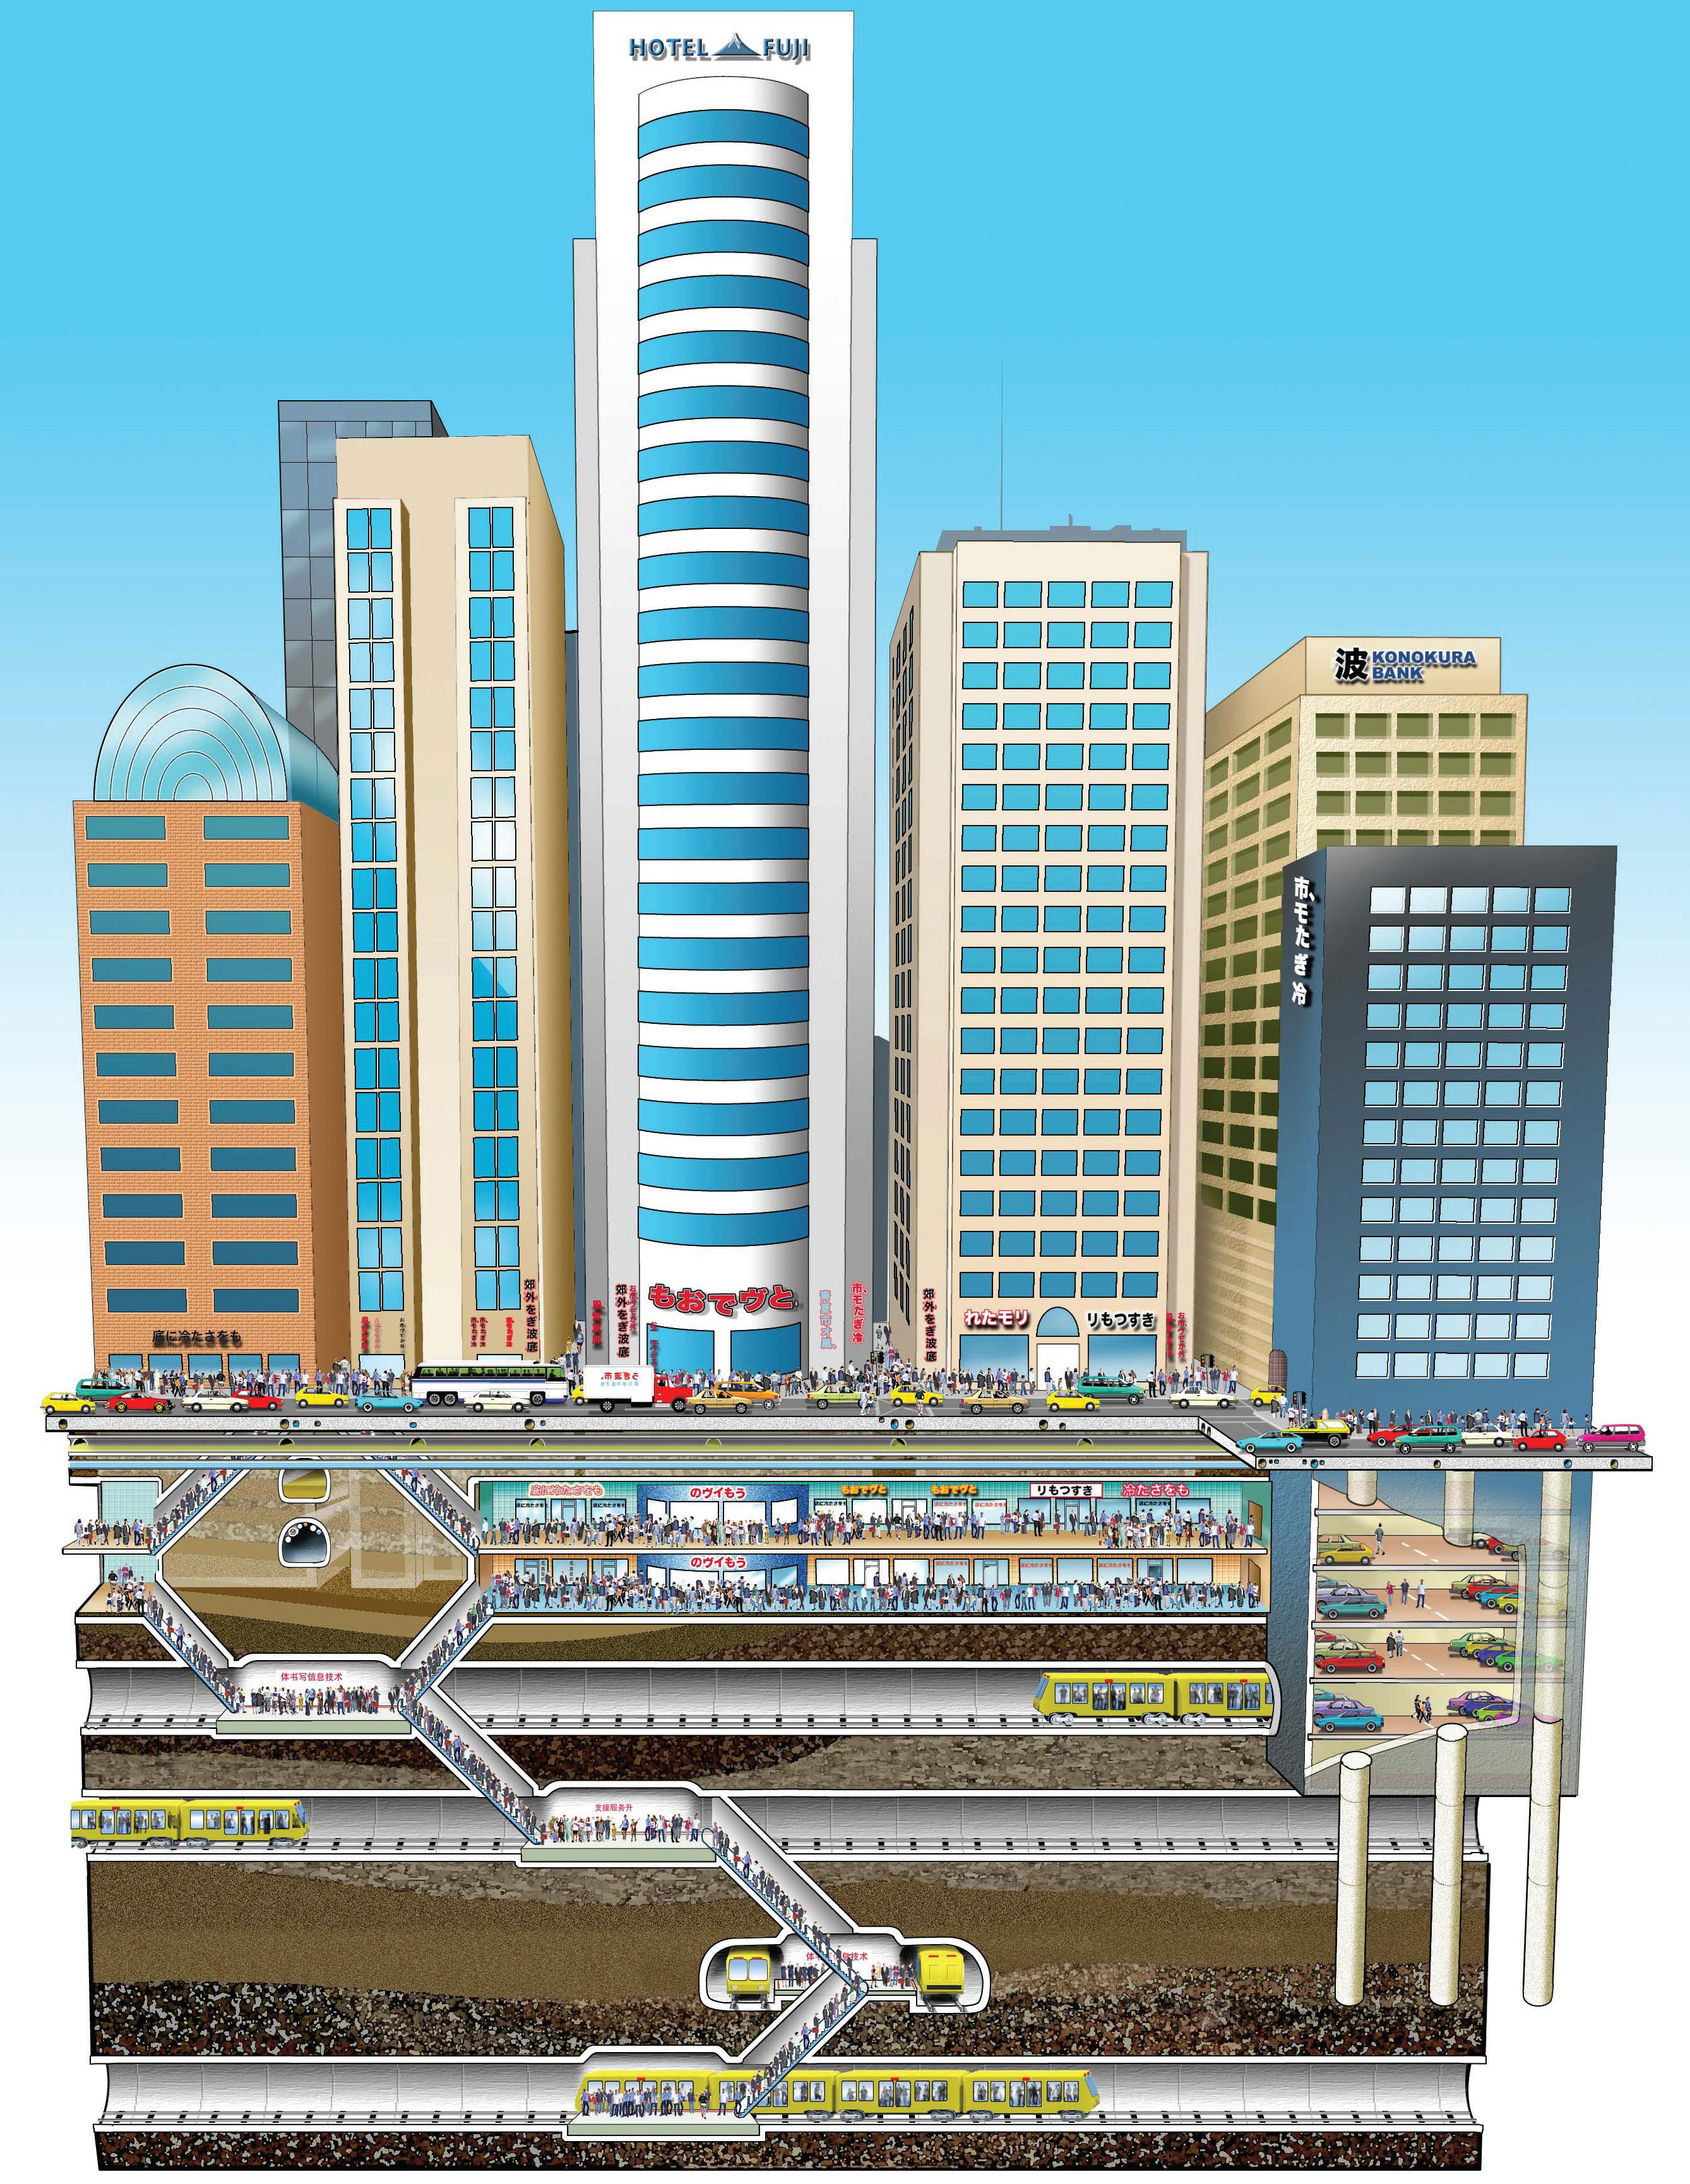
Population Density in Japan: Life in a Crowded Country 449
Long Life Spans
The Japanese enjoy one of the world’s longest life expectancies. A person born in Japan can expect to live to be almost 85 years old. There is even a public holiday, Respect for the Aged Day, to honor the country’s elderly citizens.

5. How Population Density Affects Health
Given Japan’s limited space, the Japanese have built upward and underground to meet their needs. In Tokyo, they have come up with similar solutions to deal with the nearly 2 pounds of garbage produced daily by each resident. Although this may seem like a lot, it is less than the global average of 2.5 pounds and half the U.S. average of almost 4.5 pounds. However, Tokyo lacks the space to dispose of so much trash. To reduce the risk of being left with a mountain of trash that can turn into breeding grounds for rats, flies, and disease, Tokyo has used its garbage to create new space. Islands made of garbage now dot Tokyo Bay.
Pollution Problems
Garbage is not the only waste product that builds up as population density increases. Whenever people crowd into cities, pollution problems follow. Factory and car emissions pollute the air and cause breathing problems for many people. Sewage and wastewater poison rivers and streams, killing fish and harming water supplies.
No country seems cleaner than Japan with its daily-swept streets. However, like most other industrial countries, Japan has faced severe pollution problems. One ongoing problem is acid rain, which can poison lakes, kill trees, and corrode human structures.
The Japanese have also had serious water pollution problems. In the past, toxic chemicals, such as cadmium and mercury, were dumped into oceans, lakes, and streams. Such chemicals can poison fish and the people and other animals that consume contaminated fish.
One of the most severe pollution problems emerged in the 1950s. People living on Minamata Bay became ill with a “strange disease” caused by mercury that had been dumped into the bay by local factories. People who ate contaminated fish suffered slurred speech, seizures, and blurred vision. Mothers gave birth to babies with twisted limbs. Over a thousand people died from mercury poisoning before the bay was cleaned up.
More recently, an earthquake and tsunami caused the Fukushima Daiichi nuclear plant to release radiation. More than 400,000 people were forced to evacuate. Radiation exposure will affect local plants and wildlife for decades to come, and cancer rates are expected to climb.
Long Lives High population density can impact people’s health in still other ways. For example, automobile accidents are more likely to occur on city streets than rural roads, and disease spreads more quickly in crowded cities than in the country side. Even so, the Japanese enjoy a life expectancy that is among the highest in the world. A person born in Japan in 2018 can expect to live 84 years.
The Japanese have clearly found ways to overcome the health hazards of crowding. Stand on any street corner in Tokyo and you will see one of them. People who are sick wear face masks to avoid spreading disease. More important, the Japanese have passed many environmental laws over the years to clean up the air and water. As a result, the air is safer to breathe, and fish from the sea no longer poison people and their pets.
Lesson 31450
Garbage remains a problem, but the Japanese have made efforts to reduce, reuse, and recycle waste. Recycling and waste disposal in Japan can be somewhat complex, and each city has its own system. To help residents, many cities produce recycling and waste disposal guides that can be more than 20 pages long.
Generally, people must sort their waste into four categories: burn able trash, non-burnable trash, oversized trash such as appliances, and recyclables. However, it is often necessary to further subdivide items for recycling, and these subcategories differ based on local laws. Each category uses a different colored garbage bag and has a separate pickup schedule. Those who put out the wrong type of material on recycling day will find their garbage left behind with a rejection notice.
Summary
In this lesson, you have seen how population density affects several aspects of life in Japan, including transportation, housing, land use, and health. You learned that despite their crowded cities and pollution problems, the Japanese enjoy long and healthy lives. Japan today enjoys a high life expectancy.
Japan is a wealthy, industrialized country. It can afford to build tall, earthquake-proof apartment and office buildings that make efficient use of limited city land. It can maintain an efficient public transit system to move people around quickly. It can also fund the costs of cleaning up dirty air and polluted water.
Other densely populated countries are not so fortunate. India, for example, has a population density that is slightly higher than Japan’s. It has more than four times as much arable land and is far richer in natural resources, such as coal, minerals, and natural gas. Even so, India is a much poorer country, and its per capita GDP is less than one-sixth that of Japan. Life expectancy there is just 69 years compared to 84 years in Japan. Think about this contrast as you examine population density around the world in the next section.
Life Expectancy in Japan and the United States, 2017
Japan United States
Women
Men
Recycling
Recycling bins appear all over Japanese cities. As required by law, people must sort their garbage into the appropriate can. In this image, the recycling bins include (from left) ones for newspapers and magazines, other items, cans, bottles, and polyethylene terephthalate (PET) plastic bottles.
87.2 81.8
80.7 77.3 Population Density in Japan: Life in a Crowded Country 451
How does population density affect the way people live around the world? The map shows how people are spread out across Earth. As you study the map, look for population patterns. One thing you may notice is that people are not evenly distributed around the world. Around 90 percent of people live north of the equator, while nearly 55 percent live in urban areas. You might also notice that people tend to live in temper ate climate zones and relatively near coastlines. Why might this be so?
Can a place have too many people? The answer is yes and no. For example, consider Bangladesh, a South Asian nation that is around 3.5 times as densely populated as Japan. Half of its people are farmers with a life expectancy of 73 years. In contrast, nearby Singapore is just over 23 times as densely populated as Japan. Its people are relatively well-off city dwellers with a life expectancy as high as in Japan.
What other factors contribute to the well-being of crowded countries? Resources and location are both important factors. The Netherlands, for example, is a small, densely populated country in Western Europe. It has no significant mineral or energy resources, but the Dutch have learned to make the most of their fertile soil and coastal location. They produce high-quality agricultural and industrial products, which they then trade around the world for resources they lack.
How does population density affect a nation? Population density does not make a nation rich or poor. However, it can lead to land use prob lems, put extra pressure on resources, and affect how government serves the people.
Global Connections
Denver Vancouver Montevideo Córdoba Asunción Guatemala City Puebla Managua La Paz Conakry Dakar Havana Santo Domingo Medellín Guayaquil Quito Maracaibo San Juan Recife Fortaleza Manaus Belém Salvador Brasília Lisbon Caracas Belo Horizonte Santiago San Francisco Philadelphia Toronto Atlanta Miami Phoenix Porto Alegre Casablanca Dallas Guadalajara Houston Monterrey MontréalSeattle São Paulo Río de Janeiro Buenos Aires Mexico City Los Angeles New York Washington Bogotá Chicago Lima A TLA N T I C OC E A N P A C I FI C OCEA N SO U THERN OC E A N 40°N 20°N 20°S 40°S 60°S 60°N 40°W 20°W60°W80°W100°W120°W140°W160°W 40°W 20°W60°W80°W100°W120°W140°W160°W 0° Equator Tropic of Cancer Tropic of Capricorn W 0 3,0 0 0 kilometers 0 3,0 0 0 miles Eckert IV projection 1,50 0 1,50 0 G A S E_ BM _03-4a.ep s Populatio n D ensit y o f th e Wo r l d Fi r s t p roo f Population Density Around the World, 2015 Arithmetic Population Density, 2017 Country People per Square Mile of Land Australia 8 Bangladesh 3,140 Colombia 119 Egypt 252 Japan 899 Netherlands 1,306 Nigeria 542 Singapore 21,107 United States 92 Sources: Population Reference Bureau. Central Intelligence Agency. The World Bank. Lesson 31452
Changchun Brisbane Perth Addis Ababa Maputo Harare Lusaka Durban Conakry Yaoundé Dakar Palembang Lisbon Katowice Kiev Minsk Nizhniy Novgorod Stockholm Tripoli Athens Bucharest Novosibirsk Ürümqi Almaty Esfahan RawalpindiKabul Tashkent Mashhad Baku Hanoi Sapporo Algiers Shenyang Harbin Berlin Milan Madrid St. Petersburg Alexandria Yangon Ahmedabad Busan Alegre Luanda Cape Town Nairobi Singapore Kuala Lumpur Xi’an Pune Riyadh Abidjan Accra Amman Bandung Casablanca Dar es Salaam Jeddah Jinan Melbourne Sydney Baghdad Hong Kong Khartoum Jakarta Lagos Beijing Paris Moscow Istanbul Cairo Mumbai Delhi Karachi Kolkata Dhaka Manila Tokyo Osaka Seoul Shanghai Kinshasa Bangkok Taipei Tehran London Ho Chi Minh City Bengaluru Chengdu Chennai Guangzhou Hyderabad Johannesburg Lahore Tianjin Wuhan Hangzhou ARTIC OC E A N A T LA N T I C O C E A N SO U TH E R N O CEA N I NDIA N O C E A N P A CI F I C O C E A N 20°N 20°S 40°S 60°S 160°E140°E120°E100°E80°E60°E40°E20°E0°40°W 20°W60°W 160°E140°E120°E100°E80°E60°E40°E20°E0°40°W 20°W60°W 40°N 60°N 0°Equator Tropic of Cancer Tropic of Capricorn N S EW Life Expectancy, 2017 Per Capita Income, 2016 Country Average Life Expectancy (years) Australia 83 Bangladesh 73 Colombia 75 Egypt 72 Japan 84 Netherlands 82 Nigeria 54 Singapore 83 United States 80 Country Average Income per Person* Australia $49,928 Bangladesh 1,359 Colombia 5,806 Egypt 3,514 Japan 38,894 Netherlands 45,295 Nigeria 2,178 Singapore 52,961 United States 57,467 *Amounts are in U.S. dollars. Per sq. km Over 100 50–100 10–50 1–10 Under 1 Population Density Urban Population Number of People Over 8,000,000 4,000,000–8,000,000 1,000,000–4,000,000 Per sq. mi. Over 250 125–250 25–125 2–25 Under 2 Population Density in Japan: Life in a Crowded Country 453
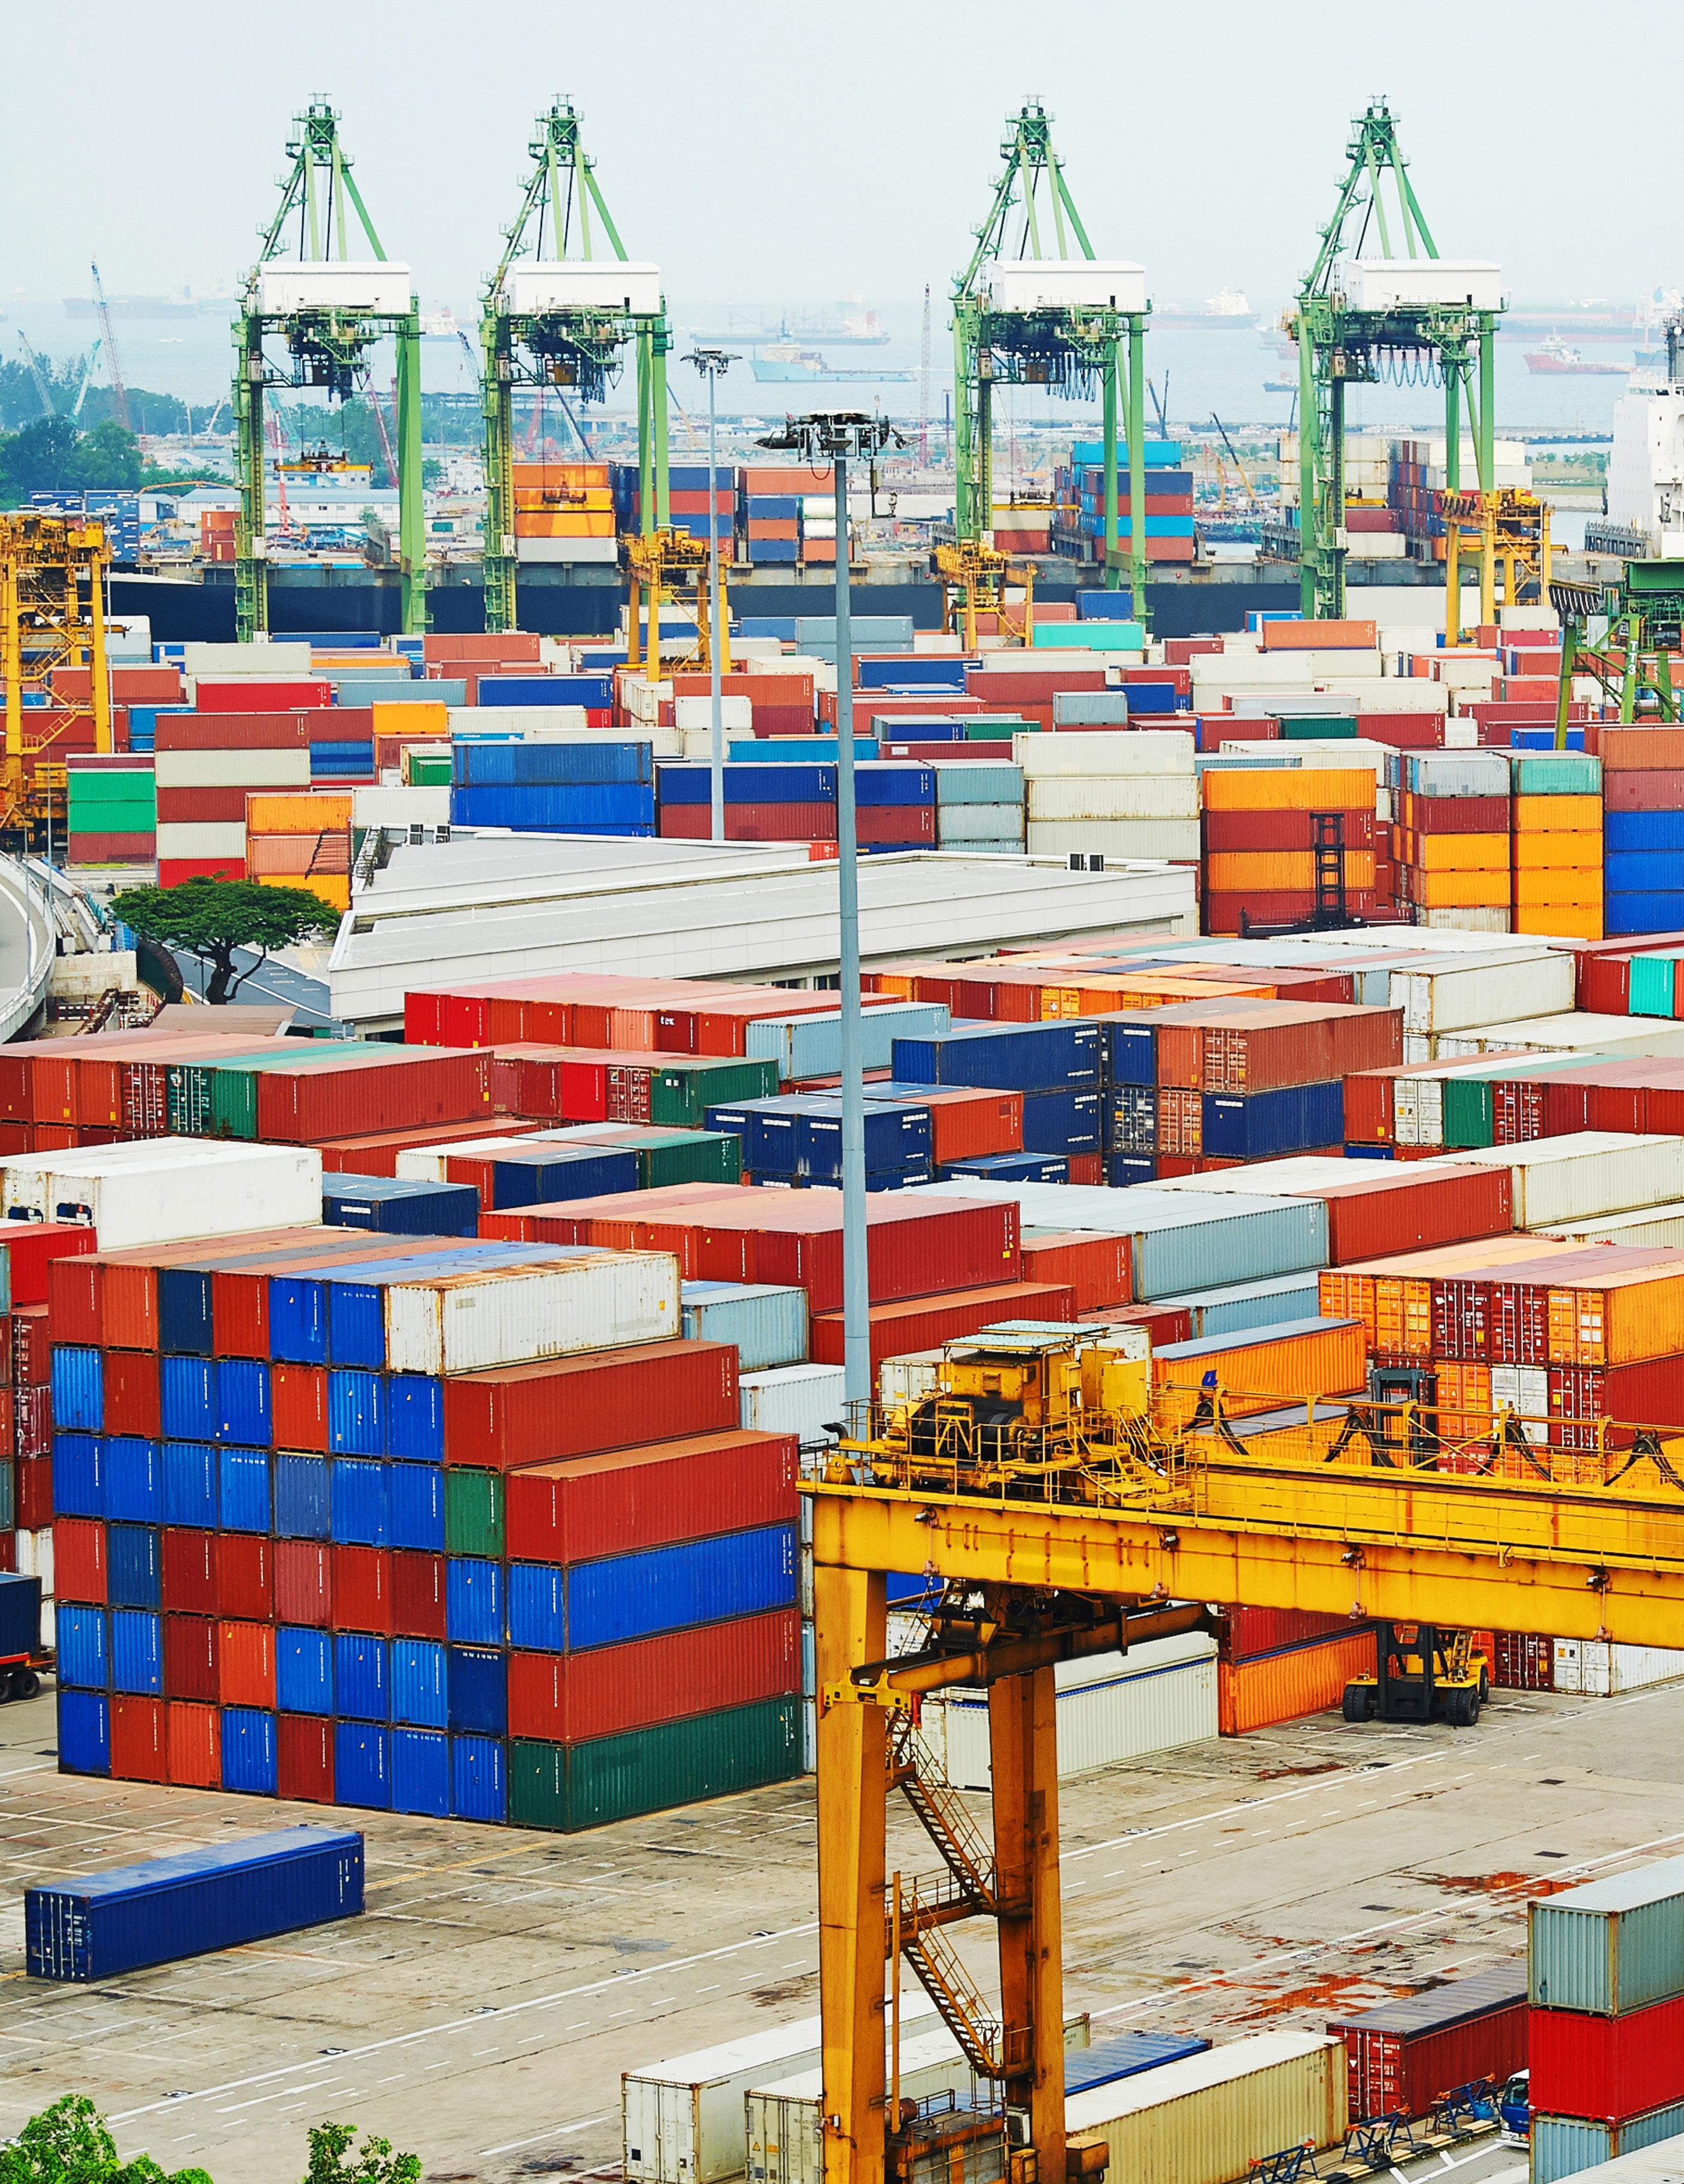
Lesson 32454
The Global Sneaker: From Asia to Everywhere
Introduction
We live in a global marketplace, in which many of the things that we wear, use, and eat every day come from other countries. Our cell phones might be manufactured in China. Our clothes might be produced in Malaysia, Mexico, or Madagascar. The gas in our cars might have been refined from oil pumped in Saudi Arabia or Venezuela. Americans drink cof fee from Colombia and tea grown in Kenya. The grapes we eat in winter may have traveled to us from Chile. The tuna in a tuna fish sandwich might have been imported from Indonesia or Ecuador.
Americans buy goods from all over the world through the process of globalization, or the development of a global, or worldwide, society. In a global society, people, money, information, and goods flow fairly and freely across national borders.
It was not always like this. Most of the products that your grandparents used when they were growing up were probably made in their own country. However, a boom in world trade transformed the economy. The globalization of the world economy has had an enormous impact on workers, consumers, business, and the environment.
In this lesson, you will learn about one common manufactured product that has become globalized: the sneaker. Historically, most of the sneakers worn by Americans were produced in the United States, but today, most sneakers are made in Asia. You will read about the steps that are included in the making of a sneaker, and you will learn how the globalization of the sneaker affects people and places around the world.
Essential Question Graphic Organizer
What is globalization, and how does it affect people and places?
The sneaker is a good example of the growth and impact of globalization. The making of a pair of sneakers involves several steps and various countries. This map shows some of the places that play a role in sneaker production. Keep this map in mind as you try to answer the Essential Question.
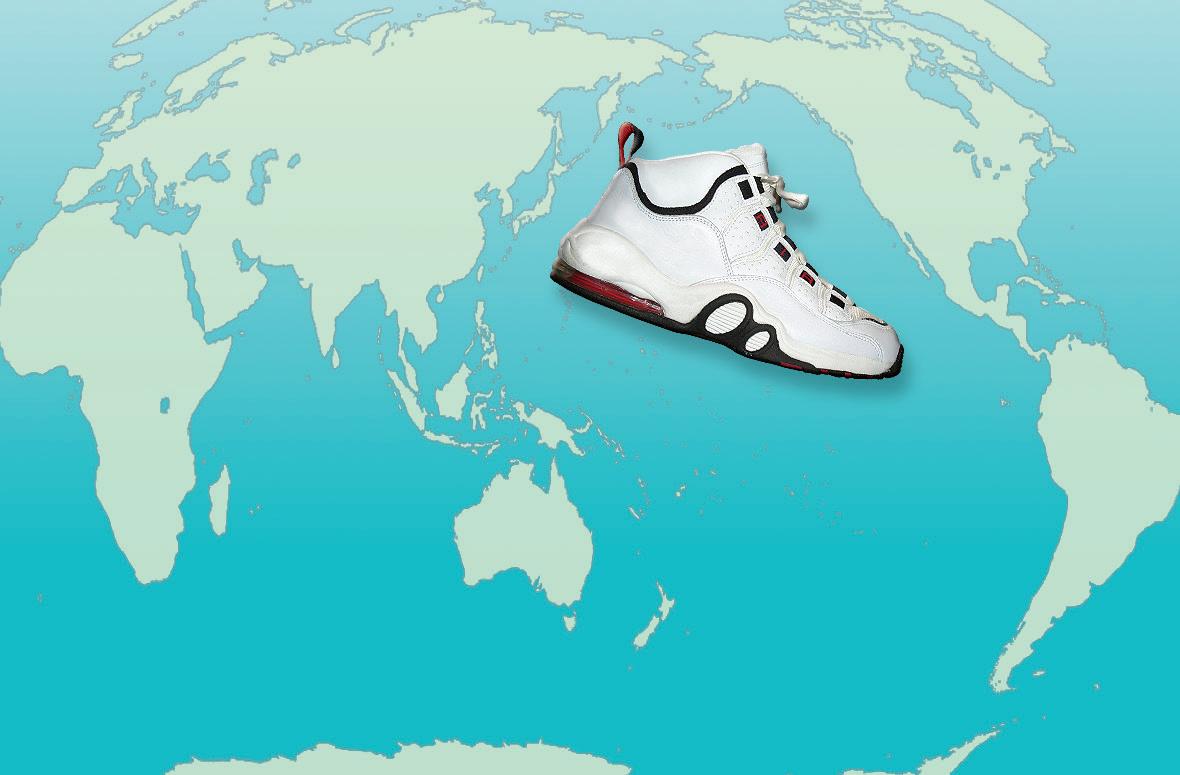
Shipping containers are stacked on the docks of Singapore’s commercial port, awaiting transport.
GA_SE_32-01_rv1 C M Y K 2nd Pr oo f Designing Locating materials Manufacturing Distributing Stages in the Making of a Sneaker LESSON 32 455
What’s the Difference?
One of the shoes above was made in the United States. In 2001, the last pair of U.S. Converse came off an assembly line in North Carolina. Now, these shoes are made in Asia. Look carefully at the labels to identify which is which.
1. The Geographic Setting
Globalization affects every country in the world, but no region has been more impacted than Asia. Countries such as China, South Korea, and Japan have played a major role in the global spread of manufactur ing and trade. These and other Asian countries continue to be critical to the global economy.
The Growth of Globalization Globalization is the result of a number of factors. Advances in communication and transportation have fur thered globalization. Another important factor is the movement toward free trade, or the flow of goods and services across national borders with few government controls.
Support for free trade has grown over the past 60 years. In 1947, the United States and 22 other countries signed the General Agreement on Tariffs and Trade (GATT). These countries agreed to reduce tariffs and other barriers to trade. A tariff is a tax on goods imported from another country. The agreement led to the creation of the World Trade Organization (WTO), which works to reduce trade barriers. By 2016, the WTO had 164 member countries.
Globalization has also been supported by the rise of multinational corporations, which are large firms that operate in more than one country. Multinational corporations have become key players in the global economy, producing and selling goods and services throughout the world.
Globalization has catalyzed economic growth in many developing countries, resulting in the creation of jobs for millions of people. This economic growth has also increased the economic interdependence among countries, as countries rely on one another for resources, technol ogy, and trade.
Trade between China and the United States is a good example of economic interdependence. Factories in China produce a wide variety of goods for export to the United States. When the U.S. economy is boom ing, Americans have plenty of money to spend on Chinese products. When the economy is not doing as well, Americans spend less on goods. Therefore, the jobs of many factory workers in China depend on the economic health of the United States.
Athletic Shoe Production: Sneaking Away from the U.S. The his tory of sneaker production demonstrates the process of globalization. For years, the sneakers that Americans wore were made in the United States. But over time, most companies moved their production to Asia. By doing so, they were able to spend less on labor and materials. This reduction in production costs made it possible for companies to sell sneakers for lower prices and still make a profit.
Look at your own shoes. The label probably says “Made in China” or another Asian country. This is true even for a well-known American sneaker: the Converse Chuck Taylor All Star. This shoe’s label once read “Made in U.S.A.” But now these shoes, too, are made in Asia.

Behind every sneaker is a complex process that involves design, raw materials, manufacturing, and distribution. In this lesson, you will learn what is done where and why.

Lesson 32456
economic
economic ties
which countries
depend on
technology, trade, and investment
other
free trade the flow of goods and services across national borders, with little or no government control globalization the development of a global, or worldwide, society in which people, money, information, and goods flow fairly freely across national borders
multinational corporation a large company that has operations in more than one country
Locations of a Multinational Corporation
From South Korea to the World
Europe
a large company based in
expand
makes
and other
countries shown in
facilities
Geoterms
interdependence a condition in
have strong
and
each
for resources,
A TLAN TIC OCEAN SOUTHERN OCEAN A TLAN TIC OCEAN PA CIFIC OCEAN INDIAN OCEAN PA CIFIC OCEAN ARCTIC OCEAN N S EW 0 3,00 0 kilometers 0 3,00 0 miles Robinson projection 1,50 0 1,50 0 Country with LG Electronics facility World headquarters Manufacturing plant Sales and service facility Research and development facility LG Electronics Primary Locations TCI5 585 GA_SE_32.02b LG Electronics Fourth proof cyan magenta yellow black
Although most multinational corporations are based in Western
or the United States, Asia has its share as well. LG Electronics is
South Korea. It
televisions, computers,
products. It began to
overseas in the 1970s. The
color on this map all have LG Electronics
today.
The Global Sneaker: From Asia to Everywhere 457
Shoes for All Kinds of Feet
Designing shoes for various types of feet and activities is a complicated process. Designers get help from scientists who study foot motion and materials. They also talk to athletes. Using their creativity, designers make drawings and models. Sample shoes are then tested in the lab and on the street. If the design is approved, the shoe goes into production.
2. Designing a Global Sneaker
In Britain, they are called trainers. In Australia, they are known as sand shoes. Their most common name, however, is sneakers. This name was first created by an American who noticed how quietly people walked when they wore them. Until the late 1960s, sneakers were relatively simple shoes. Today, they are far from simple.
Design Then: A Simple Sports Shoe Sneakers were first made during the mid-1800s for use in sports like tennis, croquet, and running. Later, they became popular for basketball.
Over the next one hundred years, sneaker designs changed very little. The upper part of the shoe was fashioned from cotton canvas, and the sole was made of rubber. Buyers could choose from only a few brands and styles. They could choose between high tops or low cuts, usually available in black or white. Most consumers considered sneakers as shoes meant purely for athletic use.
In the 1950s, people began to change their view of sneakers. The shoes were not just for sports any longer. Instead, they became casual shoes for everyday use. Men, women, and children began wearing them as fashion items.
Design Now: A Complex Fashion Statement Today’s sneakers are designed for a wide variety of purposes. While athletes still wear them, so does almost everyone else. There are sneakers for all types of different activities, including but not limited to running, rock climbing, playing tennis, and even walking.
Sneaker companies have created innovative new designs and materi als for their shoes, improving both performance and comfort. Today, companies face intense competition to design the “latest and greatest” sneaker for the market.
New designs and colors have also given sneakers more fashion appeal. To increase this appeal, athletic shoe companies often hire ath letes and musicians to promote their sneakers as “cool.” They know that many people will pay more to wear articles of clothing that their favorite stars are wearing.

New Looks Begin Here
This map shows where most sneakers are designed. Much of shoe design work takes place in the United States. Designers often work closely with the sports stars who will wear and promote the shoes that they design.
Where Sneakers Are Designed
N S EW 0 3,00 0 kilometers 0 3,00 0 miles Robinson projection 1,50 0 1,50 0 UNITED STATES GERMANY ITALY JA PA N TCI5 586 GA_SE_32.03b Sneak er World Map Fourth proof cyan magenta yellow black
Lesson 32458
3. Locating Global Sneaker Materials
Look at the soles of your sneakers. They are made of rubber. But sneakers are made of many other materials, too. Some of these materials are found in only a few places in the world. All of these materials come together in factories to create a shoe with three main parts: the upper, the midsole, and the outer sole.
The Complex Upper: Mesh Fabric, Leather, and More The upper is the top part of a sneaker. Some uppers are made of natural materials like cotton or leather. Leather used in sneakers comes from the hides of cattle that are raised in Texas, Venezuela, and other livestock centers. The cowhides are usually shipped to South Korea, where they are pre pared for manufacturing use.
Other uppers are made of synthetic, or human-made, materials like nylon. Nylon fabric is light and dries easily.
The Squishy Midsole: Foam Padding and Air Bags The midsole is the part of the shoe that cushions the bottom of your foot. It is made of plastic, a material that is produced from oil found in Saudi Arabia and other oil-rich countries.
The midsole may also contain foam padding, which is often pro duced in South Korean factories. Chemicals are poured into molds and then baked. In the process, these chemicals form millions of tiny gas bubbles that give the foam a cushiony feel. Some midsoles also contain small “air bags” filled with pressurized gas.
The Tough Outer Sole: Synthetic and Natural Rubber Treads
The tread, or outer sole, of a sneaker needs to be stiff yet flexible enough to put a spring in your step as you move. Sneakers used to be manufac tured with natural rubber soles. The rubber came from the sap of rubber trees grown and harvested in tropical countries like Brazil, Indonesia, Thailand, and Malaysia.
Today, most soles are formed from synthetic rubber, which is made from coal and oil. Much of the synthetic rubber used in sneaker produc tion comes from factories in Asian countries.
Where Sneaker Materials Come From
STATES
Inside the Sneaker
GA_SE_32-04B C M Y K
1st P roof
10-3-20 05
The three main parts of a sneaker are the upper, the midsole, and the tread. Many of the materials in each part are synthetic. These synthetic materials are made from oil and coal.

Global Sources
The materials used to make sneakers come from countries around the world. This map includes some of the sources of these materials. Some places supply raw materials, such as leather and oil. Others supply manufactured materials, like nylon and foam padding.
UNITED
MALAYSIA THAILAND SOUTH KOREA INDONESIA SAUDI ARABIA Taiwan VENEZUELA BRAZIL N S EW 0 3,00 0 kilometers 0 3,00 0 miles Robinson projection 1,50 0 1,50 0 TCI5 587 GA_SE_32.04a Sneak er Materials Fourth proof cyan magenta yellow black
Upper Midsole
Tread (outer sole)
The Global Sneaker: From Asia to Everywhere 459
South Korean Production
In the 1980s, South Korean workers made many of the world’s sneakers. South Korean factories were able to hire many workers for low wages. As South Korean wages rose over time, shoe companies moved production to countries where pay was still low. Now, South Korean shoe companies “offshore” their work like American companies do.

4. Manufacturing the Global Sneaker
By now, you know that sneakers are not simple shoes. A lot of labor goes into creating designs and materials for sneakers. But that’s not all. Manufacturing sneakers is also a complex job. A single sneaker may have more than 50 pieces. It can require the work of 120 people to assemble one pair of shoes.
“Made in U.S.A.” Becomes too Expensive Most sneakers used to be made in the countries where they were sold. Through the 1960s, simple canvas and rubber sneakers were produced in the United States, Britain, and Germany.
Beginning in the 1970s, sneakers became more complicated. The number of styles increased, and the designs became more complex. As a result, more labor was needed to assemble these shoes. Also, as production costs began to rise, it became very expensive to make shoes in high-wage countries like the United States.
Production Moves to Low-Wage Countries Faced with high costs, sneaker companies began to move production offshore, or to other coun tries. At first, sneaker production moved mainly to South Korea, which offered several advantages. South Korea had a large pool of low-wage workers and also had factories that could be used to make shoes. In addi tion, South Korea had ports for shipping raw materials into the country, and then shipping the finished sneakers out.
By the 1990s, however, wages in South Korea had risen significantly. These rising domestic labor costs resulted in less profit for shoe manu facturing companies. These companies began to move their production offshore just as the American and European companies had done 20 years earlier.
After this move, sneaker production was being done in China, Indonesia, and Vietnam. All three of these countries offered the same advantages that were once found in South Korea. Today, sneakers continue to be produced in East and Southeast Asian countries, however, shoe manufacturers can also be found in India.
Moving Offshore
This map shows how sneaker production has moved over time. In the 1970s, it shifted from the United States and Europe to South Korea, Taiwan, and Japan. By the 1990s, production had moved to China and Southeast Asia. Lower labor costs have been the reason for these moves. Sneaker production may move again, perhaps to low-wage Africa.
Where Sneakers Are Manufactured
UNITED STATES ENGLAND CHINA INDIA INDONESIA VIETNAM SOUTH KOREA GERMANY Taiwan JA PA N N S EW 0 3,00 0 kilometers 0 3,00 0 miles Robinson projection 1,50 0 1,50 01800s to 1960s 1970s to 1980s 1990s to present Manufacturing Sites TCI5 588 GA_SE_32.05b Sneak er World Map F th oof
Lesson 32460
5. Distributing the Global Sneaker
In 1990, a ship carrying sneakers from South Korea to the United States was hit by a fierce storm. About 80,000 pairs of shoes spilled into the Pacific Ocean. A year later, the shoes were still washing up on American shores. Normally, sneakers have a smoother journey to the United States from Asia. Companies use several methods of transporta tion to move their shoes from factories to stores.
Across the Globe by Ship Typically, sneakers are transported by container ship from Asia. This is the least expensive way to move goods over such long distances.
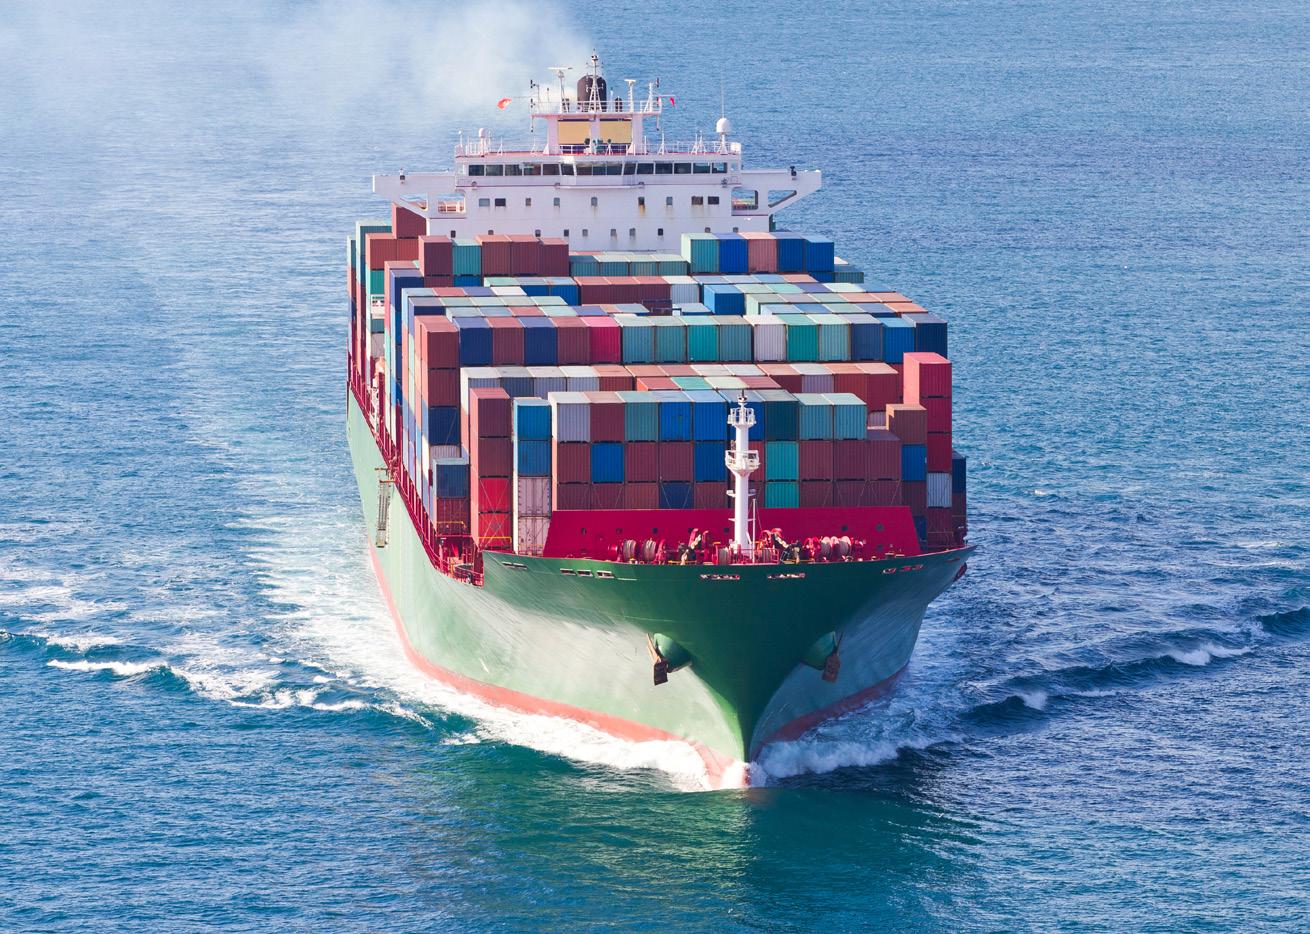
The trip to the United States usually takes between two weeks and a month. The sneakers make this journey in freight containers, which are large, weatherproof steel boxes that are easy to stack on the deck of a ship. Huge container ships can accommodate up to 18,000 20-foot containers.
Across the Country by Train and Truck When a ship arrives on the west coast of the United States, the containers are unloaded onto trains or trucks. In some ports, train tracks run right up to the docks to make unloading easier.
Train or truck transport across the United States can take a week or longer. Most of the sneakers end up in Memphis, Tennessee, which is a major distribution center where rail lines and highways meet. The sneakers are stored in Memphis warehouses before they are delivered by truck to retail stores around the country. A truck leaving Memphis in the morning can reach approximately 70 percent of the nation’s population by the following day.
From the Store to Your Home Sneakers are distributed to tens of thousands of stores throughout the United States. You probably shop at some of them. By the time a pair of sneakers makes the trek from an Asian factory to your home, it may have traveled more than 7,000 miles.
In 2013, Americans bought about 2.38 billion pairs of shoes. That is roughly seven and a half pairs for every man, woman, and child in the United States that year. Athletic shoe sales totaled more than $17 billion in 2016 —and that doesn’t include sales in the rest of the world. Clearly, the global sneaker industry is a booming business.
A Container Ship
Sneakers travel from Asia in shipping containers. Each container can carry thousands of pairs of sneakers. This makes shipping containers very efficient for moving goods. These containers can be transferred easily from ships to trains and trucks. By lowering the cost of shipping, containers have become a key factor in globalization.
Travel Time Around the World,
Our Shrinking World
This graph shows the time it took to travel around the world at different points in history. Around 1500, it took a sailing ship two, even three, years to circle the globe. Jet planes decreased that time to two days. In the 21st century, a space shuttle can travel the world in less than two hours. As travel time has decreased, our world has seemed to shrink.
GA_SE_32-06B_rv1 C M Y K 2nd P roof 10-21 -20 05 17,500 hours (2 years) 1.5 hours Year Hours 1500 0 5,000 10,000 15,000 20,000 1600 1700 1800 1900 2000
1500–2000
The Global Sneaker: From Asia to Everywhere 461
Closed Factories, Lost Jobs
Globalization has brought new factories and jobs to developing countries. But as production has moved overseas, some U.S. factories have closed their doors. Factory closings hurt workers, who lose their jobs, as well as local towns, which suffer from the loss of jobs and business.
Summary
In this lesson, you read about globalization and the worldwide making of sneakers. You learned that free trade plays a major role in the global economy, and read how shoe companies have been transformed into multinational corporations. In addition, you learned that globaliza tion has increased economic interdependence between certain countries.
Globalization is changing the world. These changes may be either good or bad, depending on your point of view.
The Case for Globalization Globalization can benefit both rich and poor countries. When companies in wealthy countries set up factories in poor countries, they create new jobs. The workers who fill these jobs often improve their standard of living, and the money they earn boosts economic growth in their countries.
Companies that move production offshore do so to keep their costs low. Lower production costs help companies keep prices low as well, benefitting consumers in both rich and poor countries. Many working people today can buy products that were once considered luxuries only the rich could afford.
Globalization has other benefits. Countries that trade with each other want to maintain good relations. In this way, globalization and economic interdependence may diminish conflict among nations, creat ing a more peaceful world.
A global society also unites the world’s people in ways never before possible. It gives us a glimpse into how people live and work in other regions. Furthermore, it allows us to share and exchange ideas, technol ogy, music, and art across vast distances. As we learn more about one another, we can grow to understand and respect other ways of life.
The Case Against Globalization Yet increased global trade can bring harm as well as good. Some developing countries lack environmental protection laws. Factories that are set up in these countries often dump toxic waste into rivers and streams, and also release deadly fumes into the air. Such polluting practices would be illegal in developed countries
Many poor countries also lack worker protection laws. Without such laws, factories can require workers to work long hours for low wages. For example, a sneaker factory worker in a developing country in Asia might earn around $3 for a 12-hour workday. A factory could also hire children, who are paid even less. Factories that abuse workers are called sweatshops. Working conditions in sweatshops are often unsafe and unhealthy.
Lesson 32462
Globalization can harm workers in developed countries as well. When companies send work offshore, they often close factories at home. Many Americans have lost their jobs because of factory closings. Towns and cities may also suffer when unemployed residents move to other places to find work.
Finally, globalization can upset traditional cultures. National iden tity may be weakened when a country is flooded by foreign foods, mov ies, television shows, fashion, and music. Traditional arts and languages may be lost. Globalization can also cause nations to become dangerously interdependent. A country that depends on another for a crucial trade good, such as oil, may become less self-sufficient. That country may also become involved in wars in order to maintain its supply of resources.
The Future of Globalization People often disagree about the impact of globalization. Some people believe that its benefits outweigh its drawbacks. Others think that it does more harm than good. In any case, one thing seems certain: globalization is here to stay. And it is likely to increase.
One reason for the increase in globalization is that many develop ing countries consider it a path out of poverty. These poor countries observed how countries like South Korea and Singapore prospered from global trade. South Korea and Singapore both welcomed foreign com panies, and both countries saw their economies grow rapidly as a result. Now, other countries want to follow their example.
Another reason for the increase in globalization is that money moves freely around the world. Money coming into a country from investors in another country is called foreign investment. Every year, billions of dol lars of foreign investment move around the world. This money is used to build new factories or to invest in businesses. Think about this as you examine the map and graphs of foreign investment in the next section.
Fast Food in the Philippines
Globalization sometimes kills off local businesses. But some businesses survive by borrowing foreign ideas. Although this fast-food chain restaurant in the Philippines looks like an American chain, it’s locally owned. This chain competes successfully with other large fast-food chains worldwide.

The Global Sneaker: From Asia to Everywhere 463
Foreign investment is an important factor in globalization. It is the main way that multinational corporations expand offshore. The line and circle graphs illustrate changes in foreign investment between 1914 and 2016. The map shows foreign investment flowing to the developing world in 2016.
How has foreign investment changed since 1914? Foreign invest ment has gone up since 1914. Most of this increase came in the years following 1960. This was a period of rapid growth throughout the global economy. The first circle graph shows that in 1914, the majority of foreign investment went to countries in Latin America. The second graph shows that by 2016, the percentage of investment going to this region had decreased. Even so, the total dollar amount was much greater in 2016 than in 1914.
Which developing country attracted the most investment money in 2016? China received more foreign investment than any other developing country in 2016. Most of this money was used to start new busi nesses in urban areas. These businesses attracted workers from rural areas. As a result, China is growing more urban year by year.
Which parts of the world attracted the least investment money? Most countries in Africa, West Asia, and Central Asia attracted little investment. As a result, their economies have grown slowly or not at all. Most of their people still depend on agriculture to make a living. Other job opportunities are frequently quite limited.
Foreign Investment in Developing
PA CIFIC
Global Connections
Year Investment (billions of U.S. dollars) 1914 1960 1980 20162000 2,000 1,500 1,000 500 0 Cumulative Worldwide Foreign Investment, 1914–2016 A TLAN TIC OCEAN
OCEAN Less than $100 million $100 million to $1 billion $1 billion to $10 billion $10 billion to $25 billion $25 billion to $60 billion Over $100 billion No data Developed country Foreign Investment (in U.S. dollars) TCI17 10 8 GA_SE_32-8a Foreign Investment Second proof cyan magenta yellow black
Countries, 2016 Lesson 32464




United States, 10% Rest of the world, 6% Latin America, 33% Asia, 21% Africa, 6% Europe, 18% Canada, 6% Rest of the world, 13% United States, 22% Europe, 25% Canada, 2% Asia, 24% Latin America, 12% Africa, 2% 20161914 Where Foreign Investment Went 1914 2016 Source: United Nations Conference on Trade and Development. N S EW 0 3,0 00 kilometers 0 3,0 00 miles Robinson projection 1,50 0 1,50 0 A TLAN TIC OCEAN INDIAN OCEAN PA CIFIC OCEAN ARCTIC OCEAN The Global Sneaker: From Asia to Everywhere 465
TCI offers programs for elementary, middle, and high school classrooms. Bring Science Alive! Social Studies Alive! History Alive! Geography Alive! Government Alive! Econ Alive! www.teachtci.com 800-497-6138 Bring Learning Alive!
Interactive Student Notebook
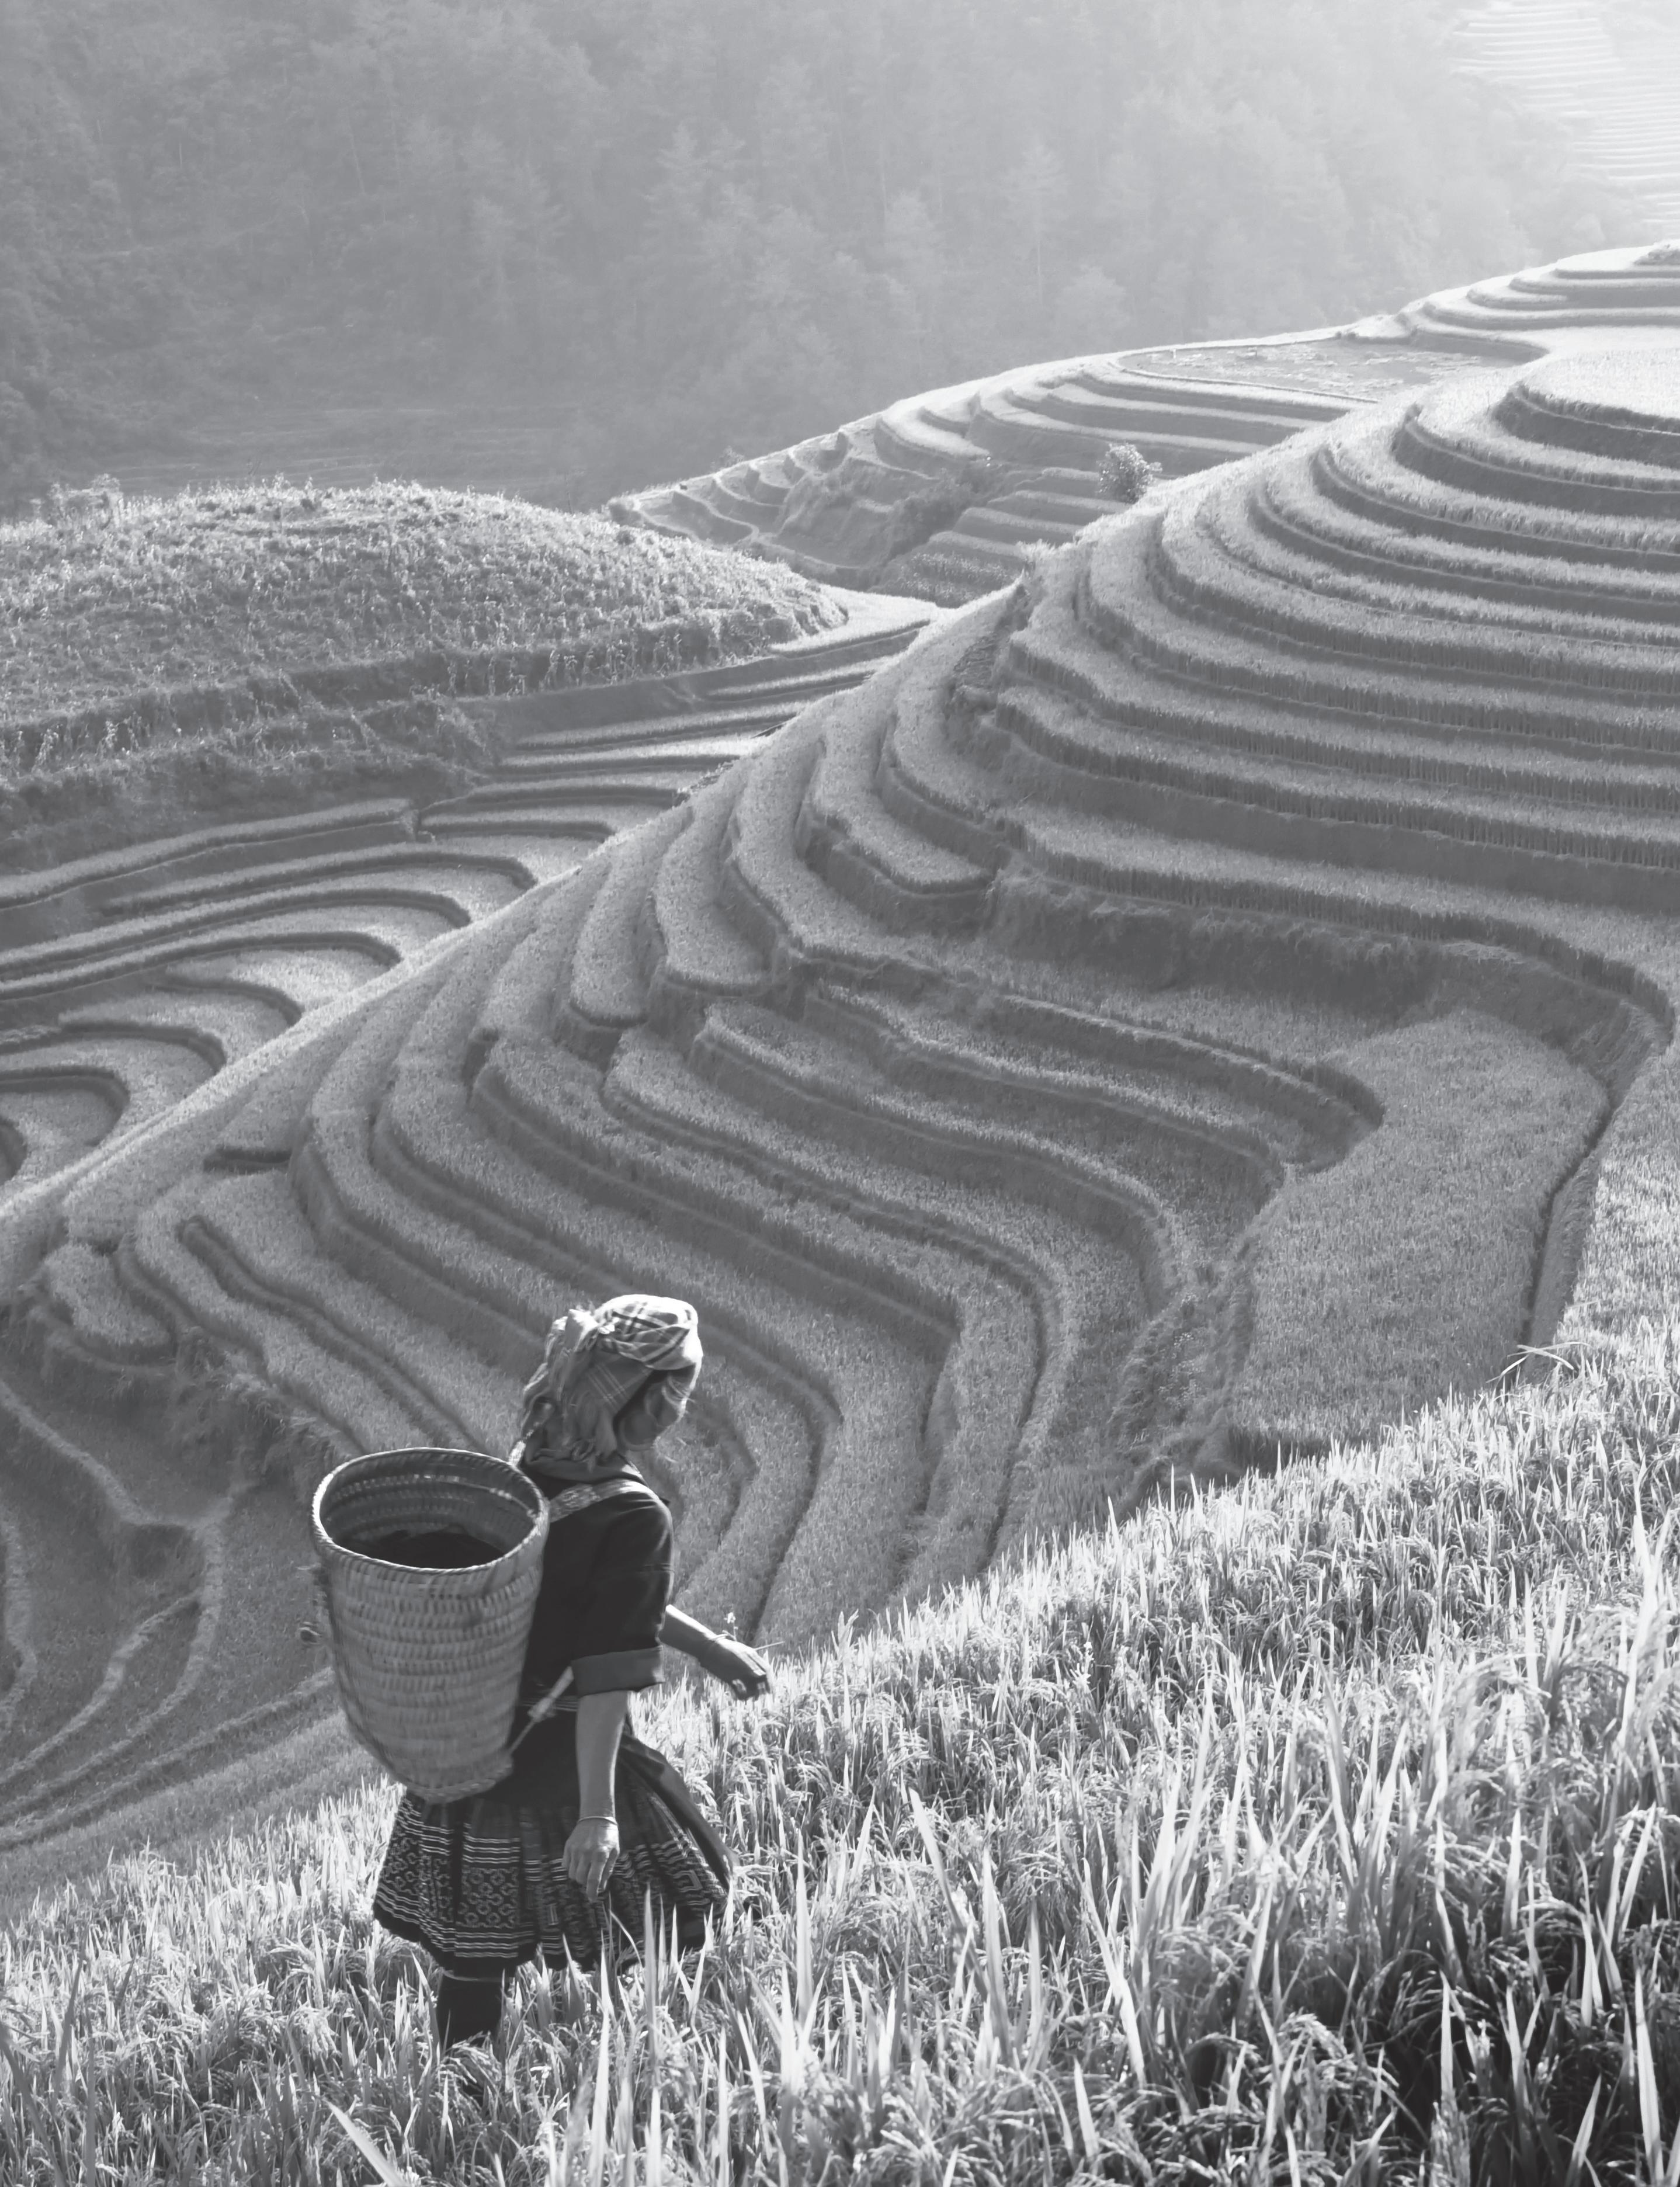
Regions and People
The Tools of Geography
How do geographers show information on maps?
Preview
With your partner, discuss and answer the following questions. Make sure you write down answers for both roles.
Cartographer:
What methods did you use to map the site?
Did you use the numbers on the walls? If so, did those numbers help the Geologist?
What other helpful components did you include on your maps?
If you had to draw another map of the site, what would you do differently?
The Tools of Geography 1© Teachers’ Curriculum Institute NOTEBOOK
THE GEOGRAPHER’S WORLD
Geologist:
How did it feel to rely on a map that someone else drew?
What was helpful about the map?
How could the map have been improved?
2 The Tools of Geography © Teachers’ Curriculum Institute NOTEBOOK
Section 1 - The Geographic Setting
Read the Introduction and Section 1. Then, create an illustrated dictionary of the Geoterms by completing these tasks:
• Create a symbol or an illustration to represent each term.
• Write a definition of each term in your own words.
• Write a sentence that includes the term and the word map.
Geoterm and Symbol Definition
Sentence absolute location distortion map projection relative location
The Tools of Geography 3© Teachers’ Curriculum Institute NOTEBOOK
4 The Tools of Geography © Teachers’ Curriculum Institute NOTEBOOK Label the map. Follow the directions on the cards your teacher gives you. Section 2 - Map Titles and Symbols SouthFork American R . Mt.MurphyRd. BridgeSt. Monument Rd. Paved road Footpath Picnic area Historical monument Park building MainSt . Hwy . 49 Church St C lo d Sp r ing s Rd. Hwy 49 HighSt. BackSt. Brewery St. 1 A B C D E F G H I J 23 456 78
OCEAN
OCEAN


The Tools of Geography 5© Teachers’ Curriculum Institute NOTEBOOK Section 3 - The Global Grid: Longitude and Latitude Label the map. Follow the directions on the cards your teacher gives you. N S E W International Date Line 0 3,0 00 kilometer s 1,50 0 0 3, 000 miles Mercator projection1,50 0 150ºW 75ºN 60ºN66 ºN 45ºN 30ºN 15ºN 0º 15ºS 30ºS 45ºS 60ºS 135ºW 120ºW 105ºW 90ºW 75ºW 60ºW 45ºW 30ºW 15ºW 0º 15ºE 30ºE 45ºE 60ºE 75ºE 90ºE 105ºE 120ºE 135ºE 150ºE 165ºE 180º 66 ºS 1 2 ARCTIC OCEAN ATLANTIC
PACIFIC OCEAN PACIFIC OCEAN INDIAN
¡ ¡ ¡ ¡ ¡ ¡ ¡ ¡ ¡ ¡ ¡ 23 ºN 1 2 1 2 23 ºS 1 2 Antarctic Circle
Section 4 - Dealing with Distances: Map Scale
D.C.
Downtown Washington, D.C.
NEW YORK AVE.MASSACHUSETTS
I "EYE" ST. H ST. F ST.
The Ellipse
ST. 10TH ST.
9TH
7TH ST.L ST. K ST. 13TH ST. 12TH ST. 11TH
ST. 8TH ST.
ST.NEW YORK AVE.
Nat'l. Portrait
11TH 395
Center
E ST.
PENNSYLVANIA AVE.
AVE.
MADISON DR.
INDEPENDENCE AVE.
AVE. 1ST
K ST. NEW JERSEY AVE.
ST. N CAPITOL ST.
4TH
ST.


ST. 3RD
MARYLANDAVE.
U.S.
6 The Tools of Geography © Teachers’ Curriculum Institute NOTEBOOK Label the maps. Follow the directions on the cards your teacher gives you. WASHINGTON,
0 10 kilometer s5 0 10 miles5 N S EW Potomac Bethesda MARYLAND VIRGINIA College Park Silver Spring Camp Springs Arlington McLean Falls Church Annandale Alexandria Suitland Hyattsville 270 P o t o m a c R . New Carrollton Suitland • • • • • • • • • • • • • Washington, D.C., and Surrounding Areas 0 0.5 kilometer0.25 0 0.5 mile0.25 N S EW Holocaust Museum The Mall Washington Monument Smithsonian Institution Washington Conv. Ctr.
GalleryWhite House
Capitol Verizon
6TH
CONSTITUTION
The Tools of Geography 7© Teachers’ Curriculum Institute NOTEBOOK Label the map. Follow the directions on the cards your teacher gives you. 0 3,0 00 kilometer s 0 3,0 00 miles R obinson projection1,50 0 N S E W 0 º 40 º W 40 º E 80 º E 120 º E 160 º E 80 º W 120 º W 160 º W 60 º S 80 º S 40 º S 20 º S 20 º N 40 º N 60 º N 80 º N 0 º Equator PrimeMeridian The World Section 5 - Hemispheres, Continents, and Oceans
PACIFIC OCEAN
OCEAN


PACIFIC OCEAN


INDIAN OCEAN

8 The Tools of Geography © Teachers’ Curriculum Institute NOTEBOOK Label the map. Follow the directions on the cards your teacher gives you. 0 3,0 00 kilometer s 1,50 0 0 3, 000 miles Mercator projection1,50 0 N S E W Los Angeles Mexico City Lima Santiago Rio de Janeiro Dakar Cape Town Mombasa St. Petersburg Istanbul Tehran Jakarta Shanghai Tokyo Melbourne International Date Line 150ºW 75ºN 60ºN Arctic Circle Antarctic Circle Tropic of Cancer Equator Tropic of Capricorn 45ºN 30ºN 15ºN 0º 15ºS 30ºS 45ºS 60ºS 135ºW 120ºW 105ºW 90ºW 75ºW 60ºW 45ºW 30ºW 15ºW 0º 15ºE 30ºE 45ºE 60ºE 75ºE 90ºE 105ºE 120ºE 135ºE 150ºE 165ºE 180º 66 ºN 1 2 23 ºN 1 2 23 ºS 1 2 66 ºS 1 2 ARCTIC OCEAN ATLANTIC
Quebec City London (Bombay)Mumbai • • • • • • • • • • • • • • • • • • Cities Around the World Section 6 - Earth and the Sun
World
The World
The Tools of Geography 9© Teachers’ Curriculum Institute NOTEBOOK Label the maps. Follow the directions on the cards your teacher gives you. N S EW 0 2,0 00 kilometers 0 2,0 00 miles 040W 40E 80E 120E 160E80W120W160W 60S 80S 40S 20S 20N 40N 60N 80N 0 Equator Prime Meridian0 3,00 0 kilometers 0 3,00 0 miles1,50 0 N S EW 0 3,0 00 kilometers 0 3,000 miles N S EW 0 3,0 00 Kilometers 0 3,000 Miles1,50 0 N S EW 3,0 00 kilometers The World The World
The
Section 7 - Showing a Round World on a Flat Map
Processing
Create a map of your classroom. Include these things on your map:
• an appropriate title
• a legend with symbols that represent the furniture and other objects in the room
• a compass rose
• a grid
• an accurate scale
10 The Tools of Geography © Teachers’ Curriculum Institute NOTEBOOK
A Spatial Way of Thinking
Why do geographers use a variety of maps to represent the world?
Preview
Design an advertisement that encourages people to move to your town or city. Include these things in your ad:
• a memorable slogan
• a map that shows where your town or city is located in your state
• an illustration and brief caption for each of the following: landscape, average weather conditions, plant life, the estimated number of people living in your town or city, jobs
• creative touches to make the ad eye-catching and attractive
• writing that has correct grammar and spelling
A Spatial Way of Thinking 1© Teachers’ Curriculum Institute NOTEBOOK
THE GEOGRAPHER’S WORLD
Section 1 - The Geographic Setting
Read the Introduction and Section 1. Then, create an illustrated dictionary of the Geoterms by completing these tasks:
• Create a symbol or an illustration to represent each term.
• Write a definition of each term in your own words.
• Write a sentence that includes the term and the word map.
Geoterm and Symbol Definition
climate economic activity landform physical feature
Sentence
2 A Spatial Way of Thinking © Teachers’ Curriculum Institute NOTEBOOK
Geoterm and Symbol Definition Sentence
population density region thematic map
vegetation
A Spatial Way of Thinking 3© Teachers’ Curriculum Institute NOTEBOOK
Section 2 - Mapping Earth’s Physical Features
Read Section 2. Write one or two sentences describing the type of thematic map you read about. Then, match the physical features in the Word Bank to their correct locations on the illustration. An example is done for you.
A world physical features map shows information about
Physical Features
canyon
Word Bank
basin bay delta gulf isthmus lake
mountain range peninsula plain plateau river strait

4 A Spatial Way of Thinking © Teachers’ Curriculum Institute NOTEBOOK
Read Sections 3-6. Write one or two sentences describing the type of thematic map you read about in each section.
Section 3 - Hot, Cold, Wet, Dry: Earth’s Climates
A world climate map shows information about
Choose three of the climate zones that you read about. Complete the table by creating a definition for each zone in your own words. Also include an example of a place that is in this climate zone.
Climate Zone Definition Example
A Spatial Way of Thinking 5© Teachers’ Curriculum Institute NOTEBOOK
Section 4 - Trees and Other Plants: Earth’s Vegetation
A world vegetation map shows information about
Choose three of the vegetation zones that you read about. Complete the table by creating a definition for each zone in your own words. Also include an example of a place that is in this vegetation zone.
Vegetation Zone Definition Example
6 A Spatial Way of Thinking © Teachers’ Curriculum Institute NOTEBOOK
Section 5 - Where People Live: Population Density
A world population density map shows information about
Choose three of the population density regions that you read about. Complete the table by creating a definition for each region in your own words. Also include an example of a place that has this population density.
Population Zone Definition Example
A Spatial Way of Thinking 7© Teachers’ Curriculum Institute NOTEBOOK
Section 6 - Economic Activity: Land and Resources
A world economic map shows information about
Choose three of the economic regions that you read about. Complete the table by creating a definition for each region in your own words. Also include an example of a place that is in this economic region.
Economic Activity Definition Example
8 A Spatial Way of Thinking © Teachers’ Curriculum Institute NOTEBOOK
Read
A Spatial Way of Thinking 9© Teachers’ Curriculum Institute NOTEBOOK
Section 7. Write one or two sentences describing the type of thematic map you read about. Then, color and label each of the seven world regions. A world regions map shows information about Section 7 - Organizing Earth’s Surface: Regions 0 3,00 0 kilometers 0 3,00 0 miles Robinson projection 1,50 0 N S EW ATLANTIC OCEAN PACIFIC OCEAN PACIFIC OCEAN INDIAN OCEAN ARCTIC OCEAN
Processing
Create a seven-line poem about a country of your choice. Choose any country you like. Follow the format given below to write your poem. Use all six thematic maps in this lesson to help you.
Line 1 Country name
Line 2 One physical feature located in your country
Line 3 Two adjectives describing your country’s climate
Line 4 One detail about your country’s vegetation
Line 5 Two adjectives describing your country’s population density
Line 6 One detail about land use or resources in your country
Line 7 Region name
Add colorful and creative touches to decorate your poem.
10 A Spatial Way of Thinking © Teachers’ Curriculum Institute NOTEBOOK
Mapping Lab: Monsoon Asia
MAKING A MENTAL MAP
1. Look at the outline map of Monsoon Asia on the next page. Then draw and label these features where you think they are located:
• the equator
• the other regions and bodies of water that lie to the north, south, east, and west
• the missing islands of Sri Lanka, Taiwan, and Japan
• the area(s) that have a tropical wet climate
• the area(s) that have a dry (arid or semiarid) climate
• the area(s) that have the greatest population
• the area(s) that have the least population
2. Revise this mental map at the end of the Mapping Lab. Follow these steps to analyze your mental map:
• Use one color to highlight or circle at least three details that were correct or fairly accurate.
• Use another to highlight or circle at least three details that were inaccurate. Correct those items.
• Use a third to add at least three new items.
• At least one item should represent information about physical geography, and at least one should represent information about human geography.
Monsoon Asia 1© Teachers’ Curriculum Institute NOTEBOOK
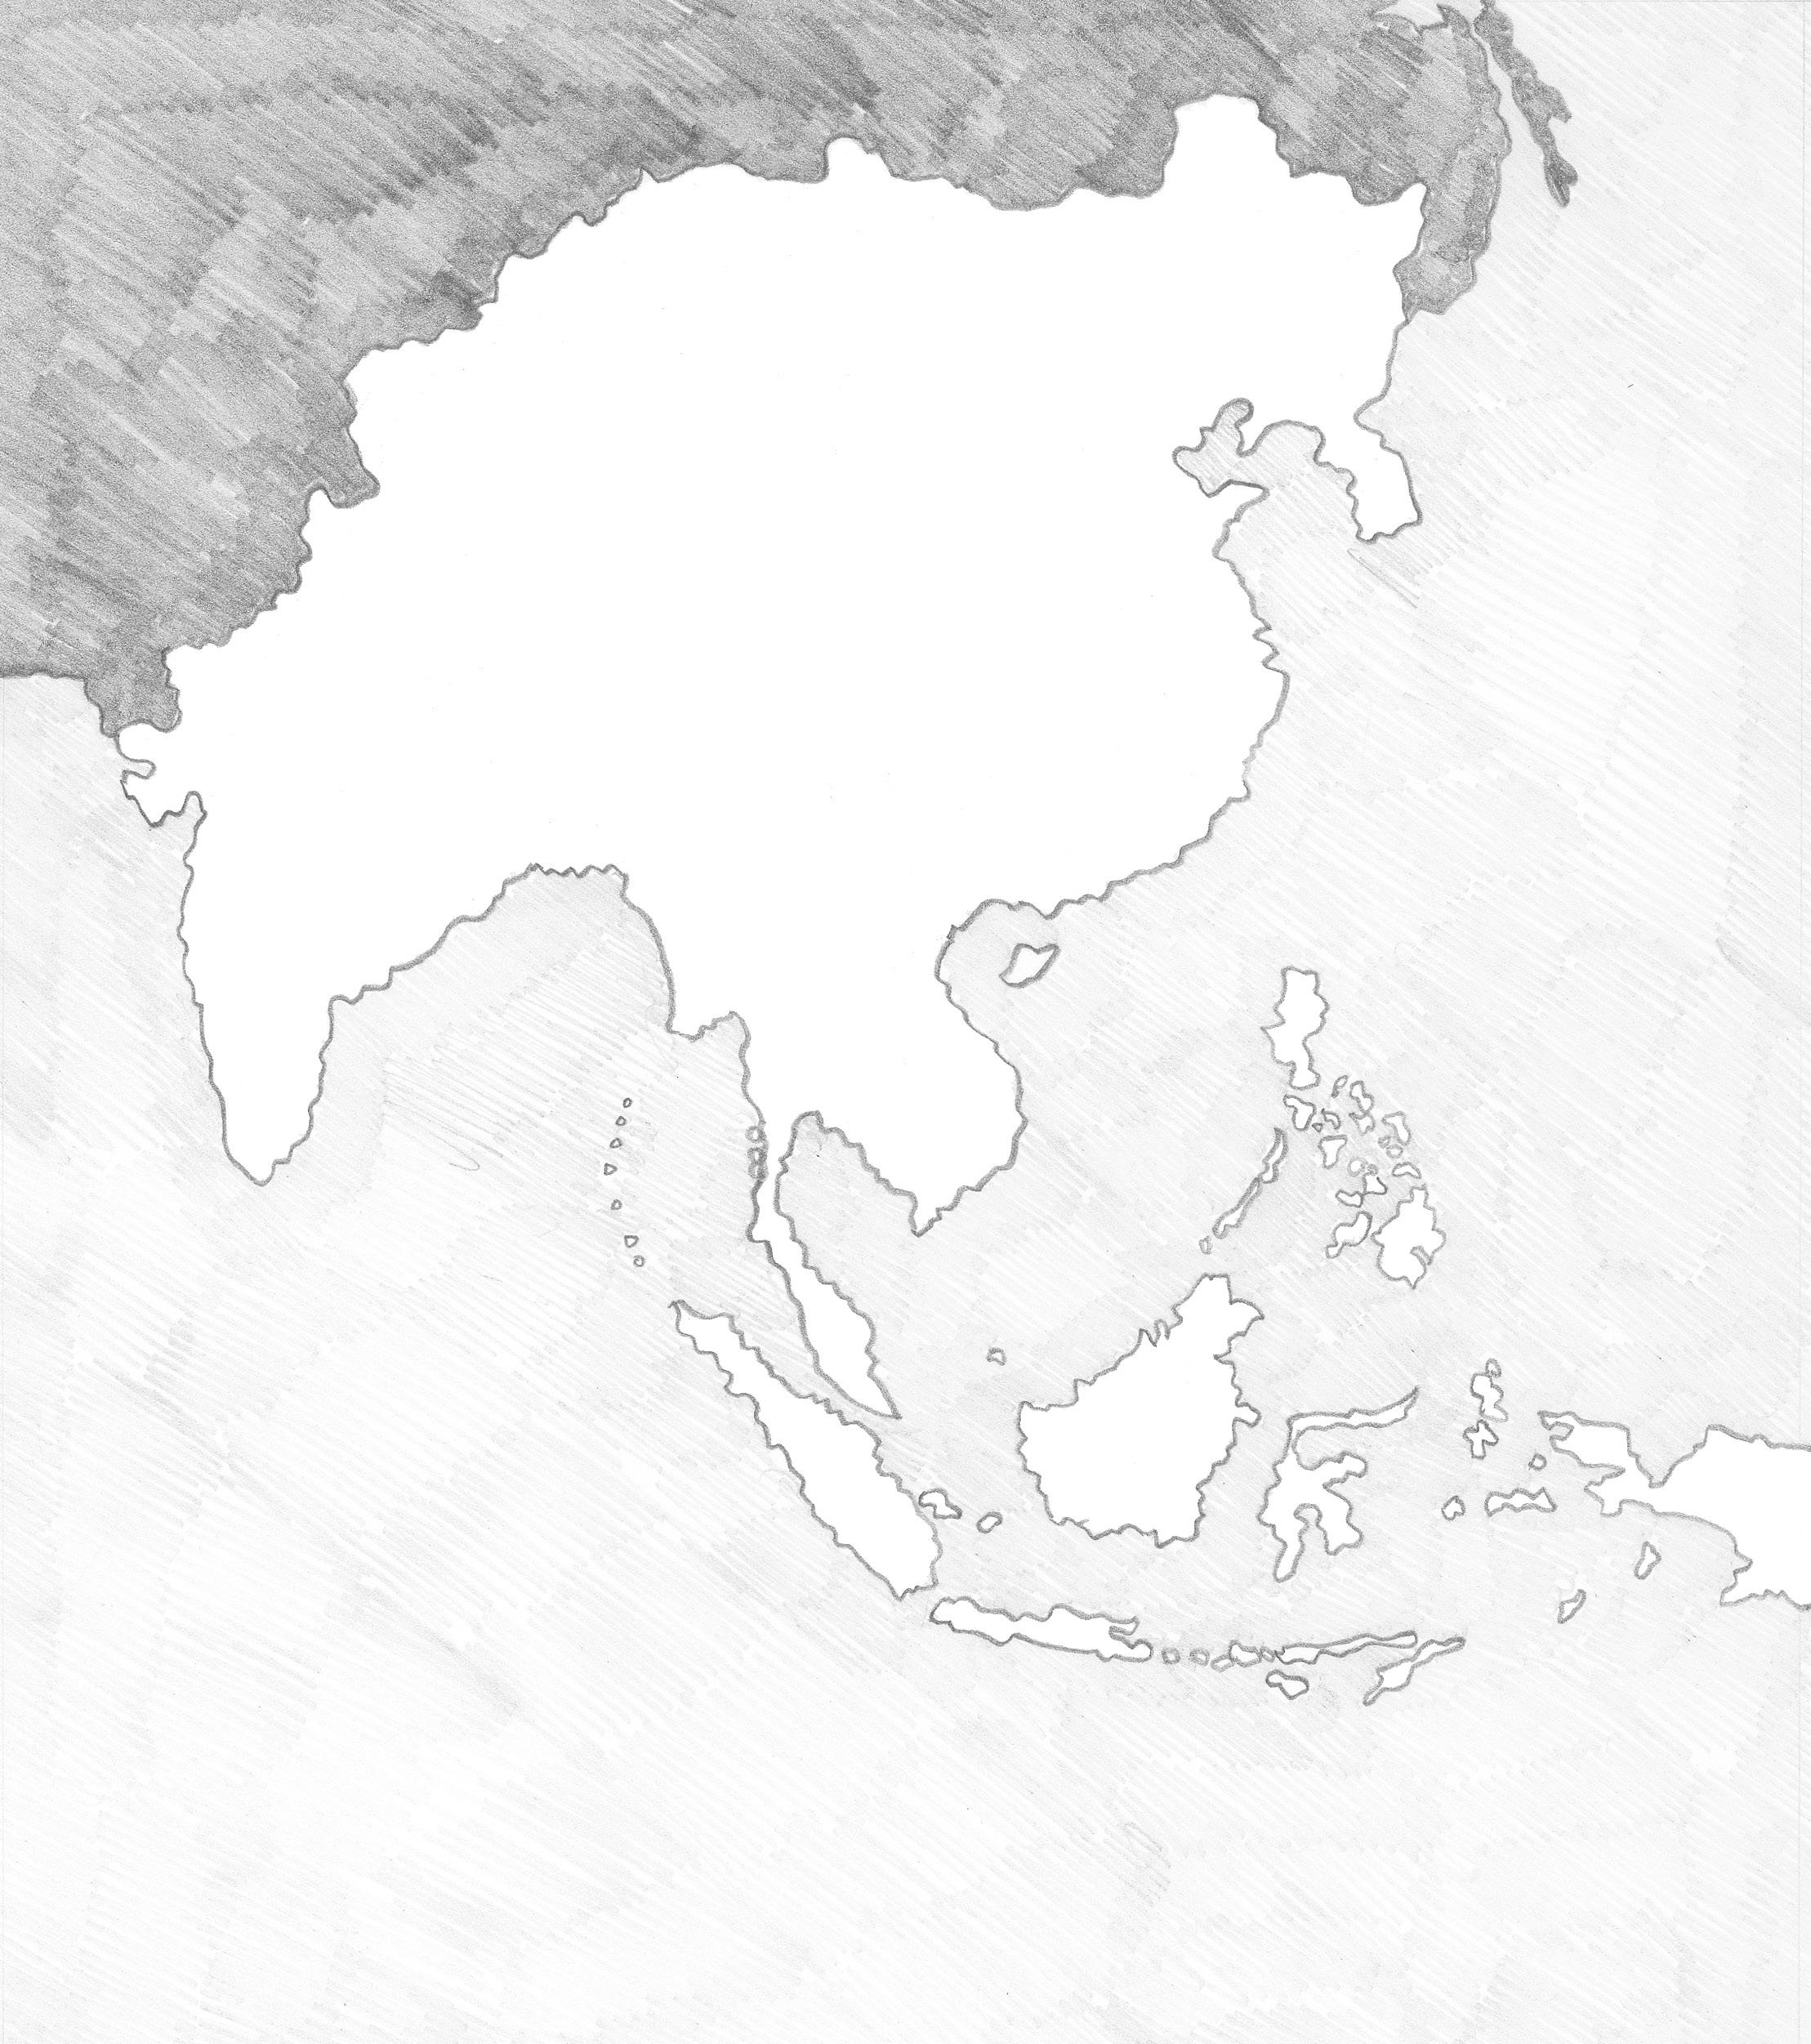
2 Monsoon Asia © Teachers’ Curriculum Institute NOTEBOOK Monsoon Asia
1. Read the Introduction to Physical Geography of the region.
Write some questions you have about physical geography of this region. As you read through the sections on the physical geography, come back here to add more questions.
2. Read the sections on physical geography. After you read each section:
• find the matching thematic map in the table.
• write two or more sentences in the reading with information represented in the map.
Section Map Two or more sentences graphically represented on the map
Physical Features Physical Geography Map
Climate Climate Map
Vegetation
Vegetation Map
Monsoon Asia 3© Teachers’ Curriculum Institute NOTEBOOK
PHYSICAL GEOGRAPHY
1. Read the Introduction to Human Geography of the region.
Write some questions you have about human geography of this region. As you read through the sections on the human geography, come back here to add more questions.
2. Read the sections on human geography. After you read each section:
• find the matching thematic map or graphic in the table.
• write two or more sentences in the reading with information represented in the map.
Section Map/Graphic Two or more sentences graphically represented on the map
History Timeline
Population Population Density Map
Economic Activity Economic Activity Map
4 Monsoon Asia © Teachers’ Curriculum Institute NOTEBOOK
HUMAN GEOGRAPHY
Part A: Locate Physical Features of Monsoon Asia
Bay of Bengal (15°N, 90°E)
Deccan Plateau (18°N, 78°E)
Ganges River (27°N, 80°E)
Gobi Desert (42°N, 110°E)
(30°N, 82°E)
Malay Peninsula (5°N, 102°E)
Mekong River (15°N, 106°E)
Philippine Sea (20°N, 130°E)

Taklamakan Desert (40°N, 84°E)
Chang Jiang (Yangtze River) (32°N, 120°E)
NOTEBOOK GEOGRAPHY CHALLENGE 1
Use the coordinates to locate and label each feature. Make sure it is clear where each feature is. 1.
2.
3.
4.
5. Himalayas
6.
7.
8.
9.
10.
TropicofCancer Tropic of Capricorn 20°N 30°N 40°N 50°N 60°N 10°N 0° Equator 20°S 10°S Tropic of Cancer Tropic of Capricorn 20°N 30°N 40°N 50°N 10°N 0° Equator 20°S 30°S 10°S 30°S 80°E70°E 90°E 100°E 110°E 120°E 130°E 140°E 130°E 140°E 150°E 150°E 160°E 120°E110°E100°E90°E80°E70°E60°E 60°E N S EW Lambert Azimuthal Equal-Area projection 0 1,000 kilometers 0 1,000 miles 50 0 50 0 INDIAN OCEAN PA CIFIC OCEAN
Part B: Locate Countries of
China (35°N, 105°E)
East Timor (9°S, 126°E)
India (20°N, 77°E)
Japan (35°N, 135°E)
Laos (18°N, 105°E)
Asia
Mongolia (46°N, 105°E)
Singapore (1°N, 104°E)
South Korea (37°N, 127°E)
Sri Lanka (8°N, 81°E)
Thailand (15°N, 100°E)
PA CIFIC OCEAN
6 Monsoon Asia © Teachers’ Curriculum Institute NOTEBOOK
Monsoon
Use the coordinates to locate and label each place. Make sure it is clear where each country is. 1.
2.
3.
4.
5.
6.
7.
8.
9.
10.
Tropic of Capricorn 20°N 30°N 40°N 50°N 60°N 10°N 0° Equator 20°S 10°S Tropic of Cancer Tropic of Capricorn 20°N 30°N 40°N 50°N 10°N 0° Equator 20°S 30°S 10°S 30°S 80°E70°E 90°E 100°E 110°E 120°E 130°E 140°E 130°E 140°E 150°E 150°E 160°E 120°E110°E100°E90°E80°E70°E60°E 60°E INDIAN OCEAN
BRUNEI Taiwan CAMBODIA MALAYSIA MALDIVES NORTH KOREA MYANMAR (BURMA) BHUTAN Hong Kong (China) Macau (China) N S EWLambert Azimuthal Equal-Area projection 0 1,000 kilometers 0 1,000 miles 50 0 50 0
Use the thematic maps to answer the questions. For each question,
• write your answer.
• record the thematic maps you used.
Question Answer Maps Used
1. What is the most common type of vegetation in the southern parts of Monsoon Asia? Which four countries in the northern part of the region do not have this vegetation?
2. If you sailed east from Vietnam along 15° latitude, you would come to what island country? What are four types of land use in this country and just offshore?
3. Which four countries in Monsoon Asia have some land in an ice cap vegetation zone?
4. Which island country in Monsoon Asia contains three cities with a population of more than 8 million people? What are those cities?
5. Find a country in Monsoon Asia that lies entirely south of the Tropic of Cancer. Its resources include coal, hydroelectric power, natural gas, and petroleum, but not precious metals. What is the country?
Monsoon Asia 7© Teachers’ Curriculum Institute NOTEBOOK GEOGRAPHY CHALLENGE 2
Question Answer Maps Used
6. One of the longest rivers in the world flows from the Plateau of Tibet to the East China Sea. What is the name of this river? Through which country does it flow?
7. Which country in Monsoon Asia has the lowest population density? What is its overall population density?
8. In which country do the people use their land for almost nothing but nomadic herding? How does the vegetation zone help to explain why?
9. What type of vegetation is found in Bangladesh? How might climate help to explain why?
10. Compare the population densities in the western and eastern halves of China. How do physical features and climate help to explain why they are so different?
8 Monsoon Asia © Teachers’ Curriculum Institute NOTEBOOK

NOTEBOOK GEOGRAPHY CHALLENGE 3 1. Mark locations A, B, and C on the map. • Location A (40° north, 85° east) • Location B (4° south, 138° east) • Location C (19° north, 73° east) TropicofCancer Tropic of Capricorn 20°N 30°N 40°N 50°N 60°N 10°N 0° Equator 20°S 10°S Tropic of Cancer Tropic of Capricorn 20°N 30°N 40°N 50°N 10°N 0° Equator 20°S 30°S 10°S 30°S 80°E70°E 90°E 100°E 110°E 120°E 130°E 140°E 130°E 140°E 150°E 150°E 160°E 120°E110°E100°E90°E80°E70°E60°E 60°E N S EW Lambert Azimuthal Equal-Area projection 0 1,000 kilometers 0 1,000 miles 50 0 50 0 TCI5 562 GA_LM_07-CH-1.eps Fir st proof INDIAN OCEAN PA CIFIC OCEAN
2. Use the thematic maps to write as much information as possible about the three locations.
Thematic Map Location A (40° north, 85° east)
Location B (4° south, 138° east)
Location C (19° north, 73° east)
Physical Features Climate Zones
Vegetation Zones
Population Density Economic Activity
10 Monsoon Asia © Teachers’ Curriculum Institute NOTEBOOK
Waiting for the Rains: The Effects of
in South
How
Preview
Look
climagraph
the
Waiting for the Rains: The Effects of Monsoons in South Asia 1© Teachers’ Curriculum Institute NOTEBOOK
Monsoons
Asia
does climate influence human activity in a region? MONSOON ASIA
carefully at the
of Mumbai, India. What is the wettest month (or months) in Mumbai? What is
driest month (or months) in Mumbai? What effects might this city’s climate have on the people who live here? GA_ISN_27_P re_rv1 B/W 2nd Pr oo f 10-26-20 05 JF MA MJ JA SO ND 35 30 25 20 15 10 5 0 11 0 90 70 50 30 10 –1 0 –3 0 Month Av er ag e t emper at ur e (°F) Av er ag e pr ecipitation (inc hes) Mumbai, India
Look carefully at the table of climate zones below. Which of these climate zones do you think Mumbai might be in? Why?
World Climate Zones
Climate Zone Definition
ice cap tundra subarctic highlands marine west coast humid continental Mediterranean humid subtropical semiarid arid tropical wet and dry tropical wet
very cold all year with permanent ice and snow very cold winters, cold summers, and little rain or snow cold, snowy winters and cool, rainy summers temperature and precipitation vary with latitude and elevation warm summers, cool winters, and rainfall all year warm, rainy summers and cool, snowy winters warm all year with dry summers and short, rainy winters hot, rainy summers and mild winters with some rain hot, dry summers and cool, dry winters hot and dry all year with very little rain hot all year with rainy and dry seasons hot and rainy all year
2 Waiting for the Rains: The Effects of Monsoons in South Asia © Teachers’ Curriculum Institute NOTEBOOK
Section 1 - The Geographic Setting
Read the Introduction and Section 1. Then, create an illustrated dictionary of the Geoterms by completing these tasks:
• Create a symbol or an illustration to represent each term.
• Write a definition of each term in your own words.
• Write a sentence that includes the term.
Geoterm and Symbol Definition
effect
shadow
Sentence
Waiting for the Rains: The Effects of Monsoons in South Asia 3© Teachers’ Curriculum Institute NOTEBOOK
atmospheric pressure monsoon orographic
rain
Section 2 - The Wet Months in Dhaka, Bangladesh (24°N, 90°E)
Complete the puzzle on Handout C. What are some advantages and disadvantages of living in Dhaka, Bangladesh? List at least two examples of each.
Section 3 - The Dry Months of Jodhpur, India (26°N, 73°E)
Complete the puzzle on Handout D. What are some advantages and disadvantages of living in Jodhpur, India? List at least two examples of each.
Advantages Disadvantages Advantages Disadvantages
4 Waiting for the Rains: The Effects of Monsoons in South Asia © Teachers’ Curriculum Institute NOTEBOOK
Section 4 - Waiting for the Rains in Kolkata, India (23°N, 88°E)
Complete the puzzle on Handout E. What are some advantages and disadvantages of living in Kolkata, India? List at least two examples of each.
Section 5 - Living in the Rain Shadow: Pune, India (19°N, 74°E)
Complete the puzzle on Handout F. What are some advantages and disadvantages of living in Pune, India? List at least two examples of each.
Advantages Disadvantages Advantages Disadvantages
the Rains: The Effects of Monsoons
South
Waiting for
in
Asia 5© Teachers’ Curriculum Institute NOTEBOOK
Processing
What Effect Does Climate Have on Your Life?
Step 1: Fill in the table with monthly rainfall amounts and temperatures for your town or a city near you. Use the data your teacher gives you, or research your own.
Feb Mar Apr
Sep Oct Nov Dec
Step 2: Create a climagraph for your hometown or a city near you.
• Using the axis on the right side of the graph, plot the average rainfall for January. Draw a bar above the first “J” up to the amount of rainfall for that month. Do the same for the next 11 months.
• Using the axis on the left side of the graph, plot the average temperature for January. Place a dot over the “J” at the average temperature for that month. Do the same for the next 11 months. Then connect the dots.
6 Waiting for the Rains: The Effects of Monsoons in South Asia © Teachers’ Curriculum Institute NOTEBOOK
Jan
May Jun Jul Aug
Average Rainfall (inches) Average Temperature (°F) GA_ISN_27_P ro B/W 1st Pr oof 9-26-20 05 JF MAM JJ AS ON D 30 25 20 15 10 5 0 90 70 50 30 10 –1 0 –3 0 Month Av er ag e t emper at ur e (°F) Av er ag e pr ecipitation (inc hes)
Step 3: Answer these questions:
• What are the warmest months in your town? Circle them on the climagraph.
• What are the coolest months in your town? Draw a square around them on the climagraph.
• What are the wettest months in your town? Draw a triangle around them.
• What are two effects that climate has on human activity in your town?
• What is one way people in your town have adapted to this climate?
Waiting for the Rains: The Effects of Monsoons in South Asia 7© Teachers’ Curriculum Institute NOTEBOOK
Tech Workers and Time Zones: India’s Comparative Advantage
What factors give some countries a comparative advantage in the global IT revolution?
Preview
With your partner, follow these steps:
1. Quickly review the information in the table below. Make sure you understand what each heading means.
Workers Around the World, 2017
Country
Total Number of Workers Average Level of English Skill
Average Annual Salary of IT Programmers (in U.S. dollars)
Canada 19.5 million good $40,800
China 806.7 million poor $28,800
India 521.9 million good $7,300
Ireland 2.2 million good $46,200
Israel 4.0 million good $66,800
Pakistan 63.9 million poor $12,211
Philippines 44.5 million good $4,500
Romania 9.0 million good $25,000
Russia 73.5 million poor $13,400
Thailand 38.4 million poor $14,700
Ukraine 18.0 million poor $24,800
Sources: CIA World Factbook. World Economic Forum. PayScale.
2. Fill in the map key below. Use one color for the top item in each category. Use a second color for the bottom item in the each category.
Total Number of Workers
50 million and up below 50 million
Average Level of English Skill
good poor
Average Annual Salary of IT Programmers
under $20,000 $20,000 and up
Tech Workers and Time Zones: India’s Comparative Advantage 1© Teachers’ Curriculum Institute NOTEBOOK
MONSOON ASIA
3. Follow the directions next to each map. Then, answer this question: In recent years, American companies have sent many IT jobs to other countries. Analyze your three maps. To which countries do you think many of these jobs are being sent? Why?
Workers Around the World
Color the countries with 50 million workers or more. Then, color those with fewer than 50 million workers. Use the colors from the key on the previous page.
Color the countries that have workers with a good level of English skill. Then, color those that have a poor level of English skill. Use the colors from the key on the previous page.
Color the countries in which the average salary for IT workers is less than $20,000. Then, color those in which the average salary is $20,000 or more. Use the colors from the key on the previous page.
TCI5 535 GA_ISN_28_pre.eps Fir st Proof
UKRAINE
IRELAND ROMANIA
RUSSIA CANADA CHINA INDIA
ISRAEL
PAKISTAN THAILAND
Average English Skill of Workers
UKRAINE
IRELAND ROMANIA
RUSSIA CANADA CHINA INDIA
ISRAEL
PAKISTAN THAILAND
PHILIPPINES
Average Annual Salaries of IT Programmers
TCI5 535 GA_ISN_28_pre.eps Fir st Proof
UKRAINE
RUSSIA
IRELAND ROMANIA
INDIA
PAKISTAN
2 Tech Workers and Time Zones: India’s Comparative Advantage © Teachers’ Curriculum Institute NOTEBOOK
PHILIPPINES
PHILIPPINES
THAILAND
ISRAEL
CANADA CHINA
Section 1 - The Geographic Setting
Read the Introduction and Section 1. Then, create an illustrated dictionary of the Geoterms by completing these tasks:
• Create a symbol or an illustration to represent each term.
• Write a definition of each term in your own words.
• Write a sentence that includes the term and the word India.
Geoterm and Symbol Definition Sentence comparative advantage information technology outsource time zone
Tech Workers and Time Zones: India’s Comparative Advantage 3© Teachers’ Curriculum Institute NOTEBOOK
Section 2 - Advantage Factor One: Low Wages
Step 1: Read Section 2, and answer these questions:
• What are two reasons that wages for workers in India are lower than in many other countries?
Step 2: Visit an Internet search station.
Search for information about the first person you will interview (read the handout on the wall). Take notes below.
Internet Search Notes
Name of worker: Occupation: Salary: Interesting facts about this worker:
• Why do Indian workers want IT jobs?
• List one interesting statistic about low wages in India.
Step 3: Attend the online meeting, and take notes below.
Online Meeting Notes
U.S. time of meeting: ____ a.m./p.m.
Question for this worker: How has the IT revolution affected you and other people who work in the IT industry?
List three ways the IT revolution has affected Meena and other Indian workers.
4 Tech Workers and Time Zones: India’s Comparative Advantage © Teachers’ Curriculum Institute NOTEBOOK
Section 3 - Advantage Factor Two: English Speakers
Step 1: Read Section 3, and answer these questions:
• Why is English widely spoken in India?
Step 2: Visit an Internet search station. Search for information about the second person you will interview. Take notes below.
Internet Search Notes
• How do English skills give Indians an advantage in the IT industry?
Name of worker: Occupation: Salary: Interesting facts about this worker:
• List one interesting statistic about English speakers in India.
Step 3: Attend the online meeting, and take notes below.
Online Meeting Notes
U.S. time of meeting: ____ a.m./p.m. Question for this worker: How has the IT revolution affected you and other people who work outside of the IT industry?
List three ways the IT revolution has affected this worker and others.
Tech Workers and Time Zones: India’s Comparative Advantage 5© Teachers’ Curriculum Institute NOTEBOOK
Section 4 - Advantage Factor Three: Trained Workers
Step 1: Read Section 4, and answer these questions:
• Why does India lead in technical education?
Step 2: Visit an Internet search station.
Search for information about the third person you will interview. Take notes below.
Internet Search Notes
• Why don’t all Indians have an equal opportunity for education?
Name of worker: Occupation: Salary: Interesting facts about this worker:
• List one interesting statistic about India’s trained workers.
Step 3: Attend the online meeting, and take notes below.
Online Meeting Notes
U.S. time of meeting: ____ a.m./p.m.
Question for this worker: How has the IT revolution affected you and other highly educated people in the IT industry?
List three ways the IT revolution has affected this worker and others.
6 Tech Workers and Time Zones: India’s Comparative Advantage © Teachers’ Curriculum Institute NOTEBOOK
Processing
Write a feature article for a magazine that highlights India and the global IT revolution. Your article should address these questions:
• What factors give India a comparative advantage in the global IT revolution?
• How have people in Bangalore been affected by the IT revolution?
Use information from your reading, Internet searches, and online meetings. Your article must have these things:
• A short, catchy title.
• An introductory paragraph that tells about India’s geography and history. It should also state your purpose for writing.
• A second paragraph that explains why India has become a leader in the IT revolution. Include at least two factors.
• A third paragraph that describes how the IT revolution has affected people from Bangalore. Give at least two examples.
• Two images (photographs, maps, or graphs) that show something you wrote about. These can be drawings you make or images from a book or the Internet. For Internet searches, use any of these key phrases: Bangalore India, information technology, India outsourcing. Give each image a short caption.
• Correct grammar and spelling.
Use these terms in your article: comparative advantage, information technology, outsource, and time zone. Add clever and creative touches to make your article more realistic.
Tech Workers and Time Zones: India’s Comparative Advantage 7© Teachers’ Curriculum Institute NOTEBOOK
Mount Everest: Climbing the World’s Tallest Physical Feature
Preview
If you were given the opportunity to visit any place in the world, where would you visit?
Why would you like to visit this place?
What clothing and supplies would you need to be prepared to visit this place? In the backpack, draw and label three of the most important items you would need.
Mount Everest: Climbing the World’s Tallest Physical Feature 1© Teachers’ Curriculum Institute NOTEBOOK
How can people both experience and protect the world’s special places?
MONSOON ASIA
Section 1 - The Geographic Setting
Read the Introduction and Section 1. Then, create an illustrated dictionary of the Geoterms by completing these tasks:
• Create a symbol or an illustration to represent each term.
• Write a definition of each term in your own words.
• Write a sentence that includes the term and the words Mount Everest.
Geoterm and Symbol Definition Sentence
capacity exposure
World Heritage site
2 Mount Everest: Climbing the World’s Tallest Physical Feature © Teachers’ Curriculum Institute NOTEBOOK
acclimatize carrying
Section 2 - From Lukla to Base Camp
1. On the map, color the route from Lukla to Base Camp. Also fill in the elevations.

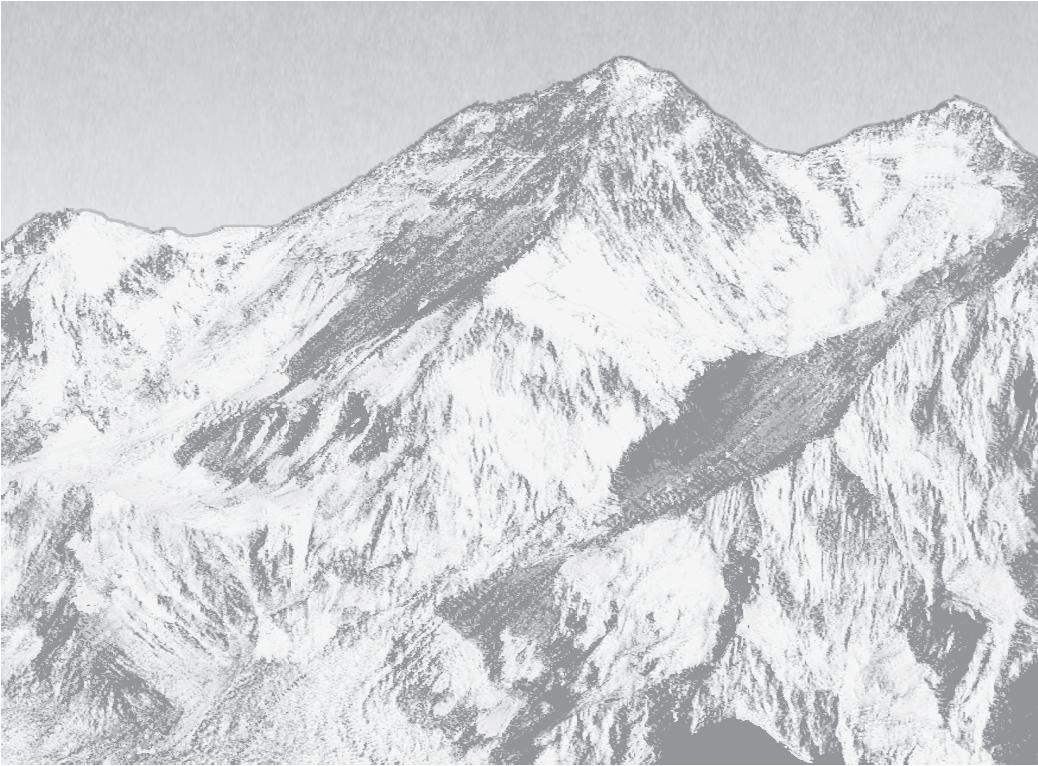
Starting elevation: _________ feet
Ending elevation: __________ feet
2. Why is it important for climbers to acclimatize?
Summit (29,035 ft.)
Camp II (21,300 ft.)
Base Camp (17,600 ft.)
To Lukla (9,350 ft.)
Camp I (19,500 ft.)
Camp IV (26,000 ft.)
Camp III (24,500 ft.)
3. What positive effects have climbing expeditions and tourism had on Nepal? What negative effects have they had?
4. Compare what you just read to your classroom experience. List at least two similarities and two differences.
Similarities Differences
Mount Everest: Climbing the World’s Tallest Physical Feature 3© Teachers’ Curriculum Institute NOTEBOOK
Section 3 - From Base Camp to Camp I
1. Color the route from Base Camp to Camp I, and fill in the elevations.
Starting elevation: _________ feet
Ending elevation: __________ feet
2. Why is the Khumbu Icefall the most dangerous part of the climb up Everest?

Base Camp (17,600 ft.)
Summit (29,035 ft.)

Camp II (21,300 ft.)
Camp I (19,500 ft.)
Camp IV (26,000 ft.)
Camp III (24,500 ft.)
3. What role do Sherpas play on Everest expeditions?
To Lukla (9,350 ft.)
4. Compare what you just read to your classroom experience. List at least two similarities and two differences.
Similarities Differences
4 Mount Everest: Climbing the World’s Tallest Physical Feature © Teachers’ Curriculum Institute NOTEBOOK
Section 4 - From Camp I to Camp IV
1. Color the route from Camp I to Camp IV, and fill in the elevations.
Starting elevation: _________ feet
Ending elevation: __________ feet
2. Describe how the physical geography changes from Camp I to Camp IV.

Summit (29,035 ft.)

Base Camp (17,600 ft.)
Camp II (21,300 ft.)
Camp I (19,500 ft.)
Camp IV (26,000 ft.)
Camp III (24,500 ft.)
3. What is being done to clean up Mount Everest?
To Lukla (9,350 ft.)
4. Compare what you just read to your classroom experience. List at least two similarities and two differences.
Similarities Differences
Mount Everest: Climbing the World’s Tallest Physical Feature 5© Teachers’ Curriculum Institute NOTEBOOK
Section 5 - From Camp IV to Summit

1. Color the route from Camp IV to the summit, and fill in the elevations.

Starting elevation: _________ feet
Ending elevation: __________ feet
2. What difficulties do climbers face in trying to reach the summit?
Summit (29,035 ft.)
Base Camp (17,600 ft.)
Camp II (21,300 ft.)
Camp I (19,500 ft.)
Camp IV (26,000 ft.)
Camp III (24,500 ft.)
3. Over the years, how have climbers sought new challenges?
To Lukla (9,350 ft.)
4. Compare what you just read to your classroom experience. List at least two similarities and two differences.
Similarities Differences
6 Mount Everest: Climbing the World’s Tallest Physical Feature © Teachers’ Curriculum Institute NOTEBOOK
Processing
Suppose you have just successfully climbed to Mount Everest’s summit. Reflect on your climb by completing four journal entries. Follow these steps:
• For each section of your climb, write a short paragraph describing your experience.
• Draw a sketch to illustrate each journal entry. Add a short caption to each sketch. Each caption should describe the sketch and how it relates to that part of the climb.


• Include these Geoterms at least once in your entries: acclimatize, carrying capacity, exposure, World Heritage site
• Use correct grammar and spelling.
• Add clever and creative touches to make your journal entries realistic.
From Lukla to Base Camp
From Base Camp to Camp I
Mount Everest: Climbing the World’s Tallest Physical Feature 7© Teachers’ Curriculum Institute NOTEBOOK
From Camp I to Camp IV
From Camp IV to the Summit


8 Mount Everest: Climbing the World’s Tallest Physical Feature © Teachers’ Curriculum Institute NOTEBOOK
Population Density in Japan: Life in a Crowded Country
density
the way people
Preview
Population Density in Japan: Life in a Crowded Country 1© Teachers’ Curriculum Institute NOTEBOOK
How does population
affect
live? MONSOON ASIA
1. Examine the map of Japan your teacher has projected. With a partner, list five facts about Japan that can be determined from the map. Fact 1: Fact 2: Fact 3: Fact 4: Fact 5: 2. Fill in the map to show where Japan’s mountains and lowlands are located. Use the symbols from the key. 3. Look again at the projected map of Japan. On the map above, mark five X’s where you think Japan’s five largest cities might be located. Give two reasons for why you chose those locations. Reason 1: Reason 2: Hokkaido Honshu Shikoku Kyushu Se a of J apan (East Sea) PA C IFIC OCEAN Mountains Lowlands Lambert Conformal Conic projection N S EW 0 20 0 kilometers 0 20 0 miles 10 0 10 0 TCI5 47 GA_ISN_32_Pre BW Japan Third proof 1/13/05
Section 1 - The Geographic Setting
Read the Introduction and Section 1. Then, create an illustrated dictionary of the Geoterms by completing these tasks:
• Create a symbol or an illustration to represent each term.
• Write a definition of each term in your own words.
• Write a sentence that includes the term and the word Japan.
Geoterm and Symbol Definition
arable land arithmetic population density physiologic population density population distribution
Sentence
2 Population Density in Japan: Life in a Crowded Country © Teachers’ Curriculum Institute NOTEBOOK
After reading each of Sections 2 to 5, complete the corresponding questions.
Section 2 - How Population Density Affects Transportation
1. How does Japan’s high population density affect transportation? Read the three statements below. One of them is false. Circle the two you think are true.
• The average employee in Tokyo commutes (travels) 90 minutes to work.
• No car can be registered in Tokyo without proof that the owner has a place to park it.
• The Japanese train and subway system is so advanced that the Japanese buy fewer cars today than in 1960.
2. Read Section 2. Put a check mark next to each true statement above.
3. Write a summary of the ways population density affects transportation in Japan. Include at least three details from the reading.
Section 3 - How Population Density Affects Housing
1. How does Japan’s high population density affect housing? Read the three statements below. One of them is false. Circle the two you think are true.
• The average home in Japan is smaller than the average home in the United States.
• Space limitations have not changed family life in Japan.
• Many Japanese homes do not have separate bedrooms.
2. Read Section 3. Put a check mark next to each true statement above.
3. Write a summary of the ways population density affects housing in Japan. Include at least three details from the reading.
Population Density in Japan: Life in a Crowded Country 3© Teachers’ Curriculum Institute NOTEBOOK
Section 4 - How Population Density Affects Land Use
1. How does Japan’s high population density affect the ways land is used in Japan? Read the three statements below. One of them is false. Circle the two you think are true.
• The Japanese have always built very tall buildings because of limited land.

• The Japanese grow rice on terraces cut into steep mountainsides.
• The Japanese have built underground parks and zoos.
2. Read Section 4. Put a check mark next to each true statement above.
3. Write a summary of the ways population density affects land use in Japan. Include at least three details from the reading.
Section 5 - How Population Density Affects Health
1. How does Japan’s high population density affect the environment and people’s health?
Read the three statements below. One of them is false. Circle the two you think are true.
• Because of crowding in Japan, the Japanese live shorter lives than most people in the world.
• Some Japanese wear face masks to avoid making others ill.
• The Japanese recycle cookie wrappers to reduce trash.
2. Read Section 5. Put a check mark next to each true statement above.
3. Write a summary of the ways population density affects the environment and health in Japan. Include at least three details from the reading.
4 Population Density in Japan: Life in a Crowded Country © Teachers’ Curriculum Institute NOTEBOOK
Processing
Conduct a study of how population density affects life in your state and community.
Draw a map of your state.
Look at the U.S. population density map below. Shade in the most densely populated areas on the map of your state.
Use an atlas to find the five largest cities in your state. Label them on your state map.
Shade your map to show the population density of the area where you live, if you didn’t shade it in Step 2.
Somewhere on your map, draw two ways that you believe population density affects life in your state. Then, draw two ways that it affects life in your neighborhood. Write a caption for each of your drawings.
Population Density of the United States
Population Density in Japan: Life in a Crowded Country 5© Teachers’ Curriculum Institute NOTEBOOK
1.
2.
3.
4.
5.
One dot equals 10,000 people. Albers Conic Equal-Area projection N S EW 0 50 0 kilometers 0 50 0 miles 250 250
The Global Sneaker: From Asia to Everywhere
What is globalization, and how does it affect people and places?
Preview
Step 1: Your teacher will start a timer. With a partner, inspect the labels on your clothes and other items (backpacks, watches, and so on). In the table below, list each item and the country where it was made. Do this for as many items as you can.
Step 2: Your teacher will stop the timer and ask you to state an item and a country from your list.
Item Country
The Global Sneaker: From Asia to Everywhere 1© Teachers’ Curriculum Institute NOTEBOOK
MONSOON ASIA
Section 1 - The Geographic Setting
Read the Introduction and Section 1. Then, create an illustrated dictionary of the Geoterms by completing these tasks:
• Create a symbol or an illustration to represent each term.
• Write a definition of each term in your own words.
• Write a sentence that includes the term and the word Asia.
Geoterm and Symbol Definition
Sentence economic interdependence free trade globalization multinational corporation
2 The Global Sneaker: From Asia to Everywhere © Teachers’ Curriculum Institute NOTEBOOK
Section 2 - Designing a Global Sneaker
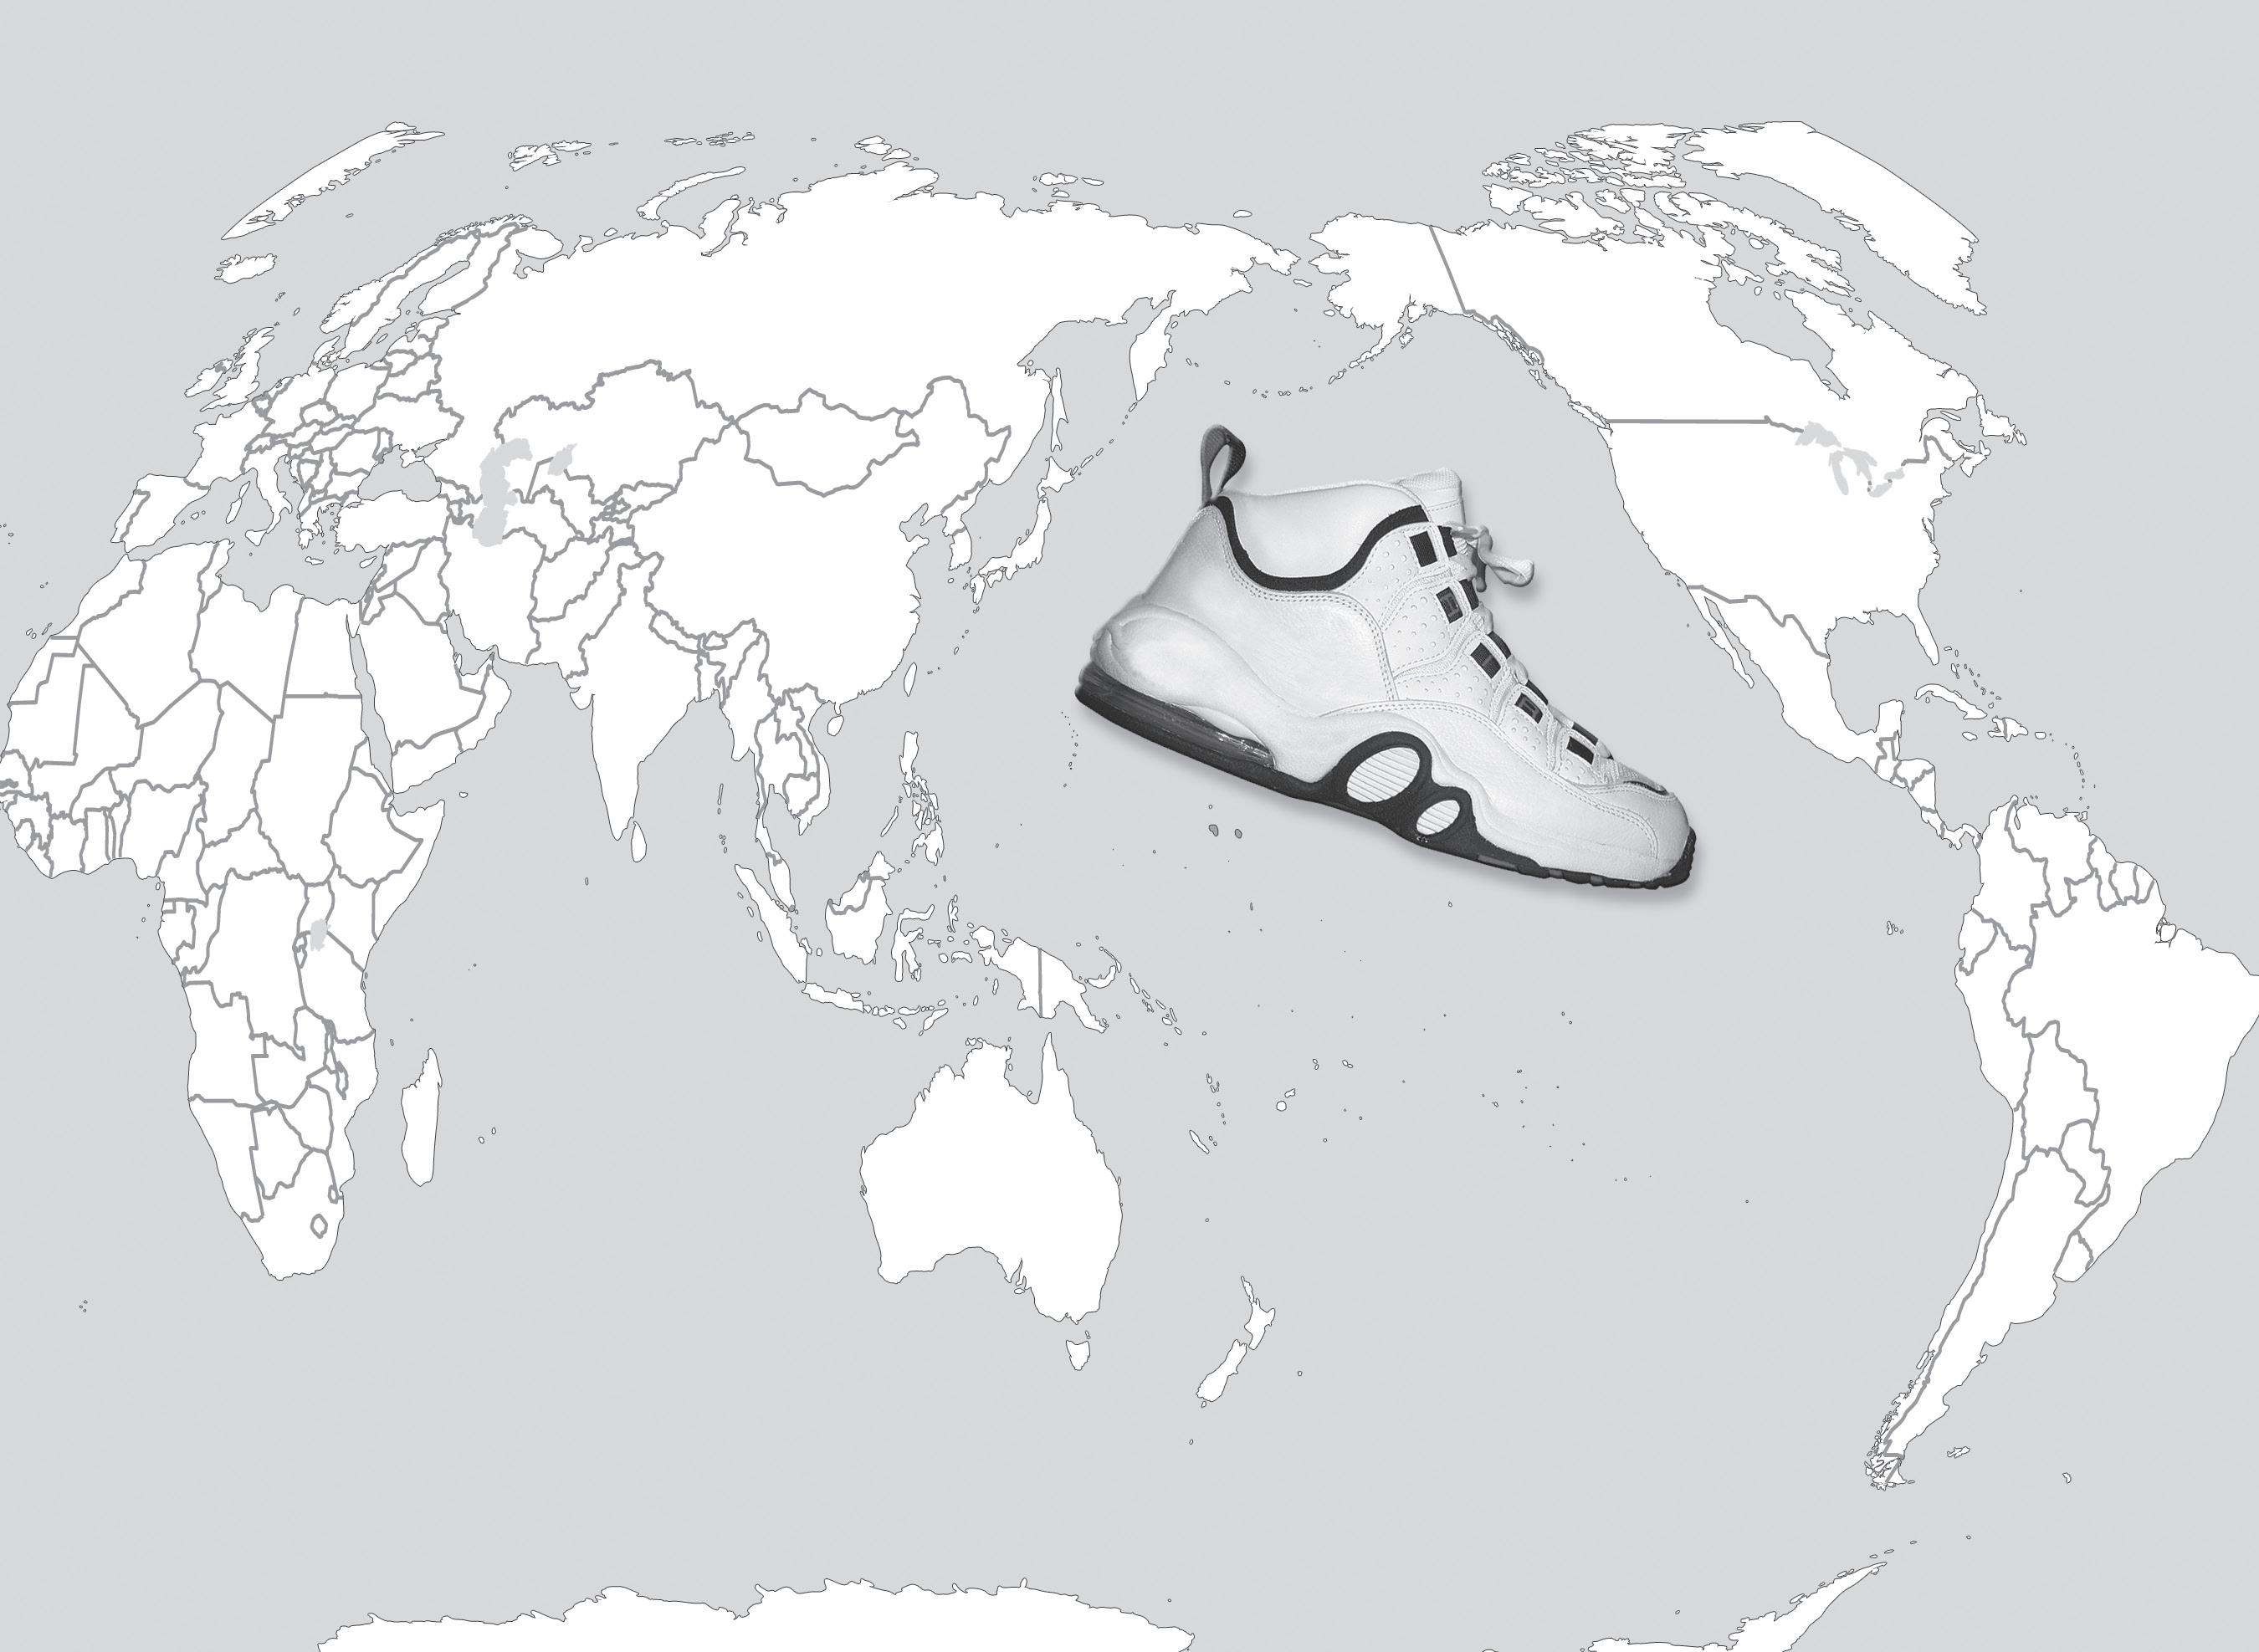
The Global Sneaker: From Asia to Everywhere 3© Teachers’ Curriculum Institute NOTEBOOK 1. On the map, draw a blue dot in each country involved in this step of producing a global sneaker. 2. List three ways the design of sneakers has changed since the 1950s. Read each section, and complete the corresponding notes.
GA_ISN_32_RN B/W 1st Pr oof 10-21 -20 05
Section 3 - Locating Global Sneaker Materials
1. On the map, draw a red dot in each country involved in this step of producing a global sneaker.
2. What are the three parts of the sneaker? What materials is each part made of?
3. List a reason each sneaker material might come from the locations listed.
• leather from Texas and Venezuela:
• foam padding from Saudi Arabia:
• synthetic rubber from Taiwan:
Section 4 - Manufacturing the Global Sneaker
1. On the map, draw a green dot in each country currently involved in this step of producing a global sneaker.
2. Where were sneakers manufactured until the 1960s? What changes occurred in the 1970s that caused sneaker companies to no longer make shoes at home?
3. List three reasons sneaker companies moved their production offshore to Asian countries.
Section 5 - Distributing the Global Sneaker
1. On the map, draw a typical sneaker distribution route from Asia to your state.
2. What three modes of transportation are used to move sneakers from Asia to stores in the United States? How is each mode used?
3. What are three advantages of using freight containers to transport products?
4 The Global Sneaker: From Asia to Everywhere © Teachers’ Curriculum Institute NOTEBOOK
Processing
Step 1: Gather 20 different items at home. In the table below, list each item and the country where it was made.
Step 2: Create a choropleth map of the items on your list. Count the number of items from each country you listed. Shade each country on the map using these colors:
• 1 or 2 items: yellow
• 3 or 4 items: orange
• 5 or more items: blue
Step 3: Analyze the colors on your map. Create two “Why?” or “Where?” questions that relate to it.
Item Country
The Global Sneaker: From Asia to Everywhere 5© Teachers’ Curriculum Institute NOTEBOOK
6 The Global Sneaker: From Asia to Everywhere © Teachers’ Curriculum Institute NOTEBOOK 0 1, 000 2, 000 kilometer s 0 2, 000 miles R obinson projection1, 000 N S E W TCI1 7 11 6 GA_ISN_32_PRO .eps Fir st Pr oof The World
Regions and People
The Interactive Student Notebook will help you remember what you learn.
•
•
notes from
• write down key takeaways
each lesson.
you have your own study guide
help you do well
geography!
Your notebook gives you a place to:
take
your reading.
record discoveries from activities.
of
Now
to
in
www.teachtci.com 800-497-6138


