6 minute read
Carbon footprinting


Measuring the carbon performance of your farm
By Becky Wilson
Advertisement
The old adage of you can’t manage what you can’t measure is certainly true of carbon accounting. But when it comes to agriculture, measuring carbon isn’t as simple as it may first seem.
Carbon accounting systems were designed to measure industrial processes; when measuring the emissions associated with a product manufactured in a factory, we are able quite simply to understand how the inputs lead to the outputs and everything tends to all be neatly contained within a building.
This is not the case when we use these metrics to measure farming systems. On-farm we are trying to measure biological systems, which are impacted by climate, soil type, topography and vegetation, as well as what we as farmers are doing in terms of our management. Which can make the whole thing a little tricky! However, undaunted by this complexity, carbon metrics are an essential tool that farmers can use to not just identify climate solutions, but also to baseline the farm’s emissions and drive technological change. Identifying the carbon footprint of a farm business is the first vital step in being able to quantify the contribution that the farm is making to climate change. A carbon footprint calculation in its simplest form identifies the quantity and source of carbon dioxide, methane and nitrous oxide emitted from the farm (the emissions) and subtracts from the emissions the carbon that is being sequestered onfarm (sequestration) to provide your carbon balance.
This balance is the starting point which should then highlight areas where improvements or changes can be made to reduce emissions and improve sequestration potential.
Reducing carbon emissions in a farming business makes sense on many levels. High carbon emissions tend to be linked to high use of resources, and / or wastage, so reducing emissions also tends to reduce costs. This makes the farm more efficient and should improve profitability. As well as the business opportunities that come from reducing emissions, farmers and landowners are in the unique position to being able to sequester carbon both in trees, hedgerows and margins and within the soil.
Before being able to reduce emissions, you need to know where the emissions are coming from. Are the largest emissions coming from livestock, soils, fuels, or fertilisers? It is vital to get a picture of your business which is made possible by carbon footprinting.
Choosing a tool to use
There are various carbon footprinting tools that have been designed for use by individual farmers (or groups of farmers) who are interested in understanding the carbon balance of farms.
Tools include the Cool Farm Tool, AgreCalc and the Farm Carbon Calculator. The golden rule is, once you have decided which tool to use, stick
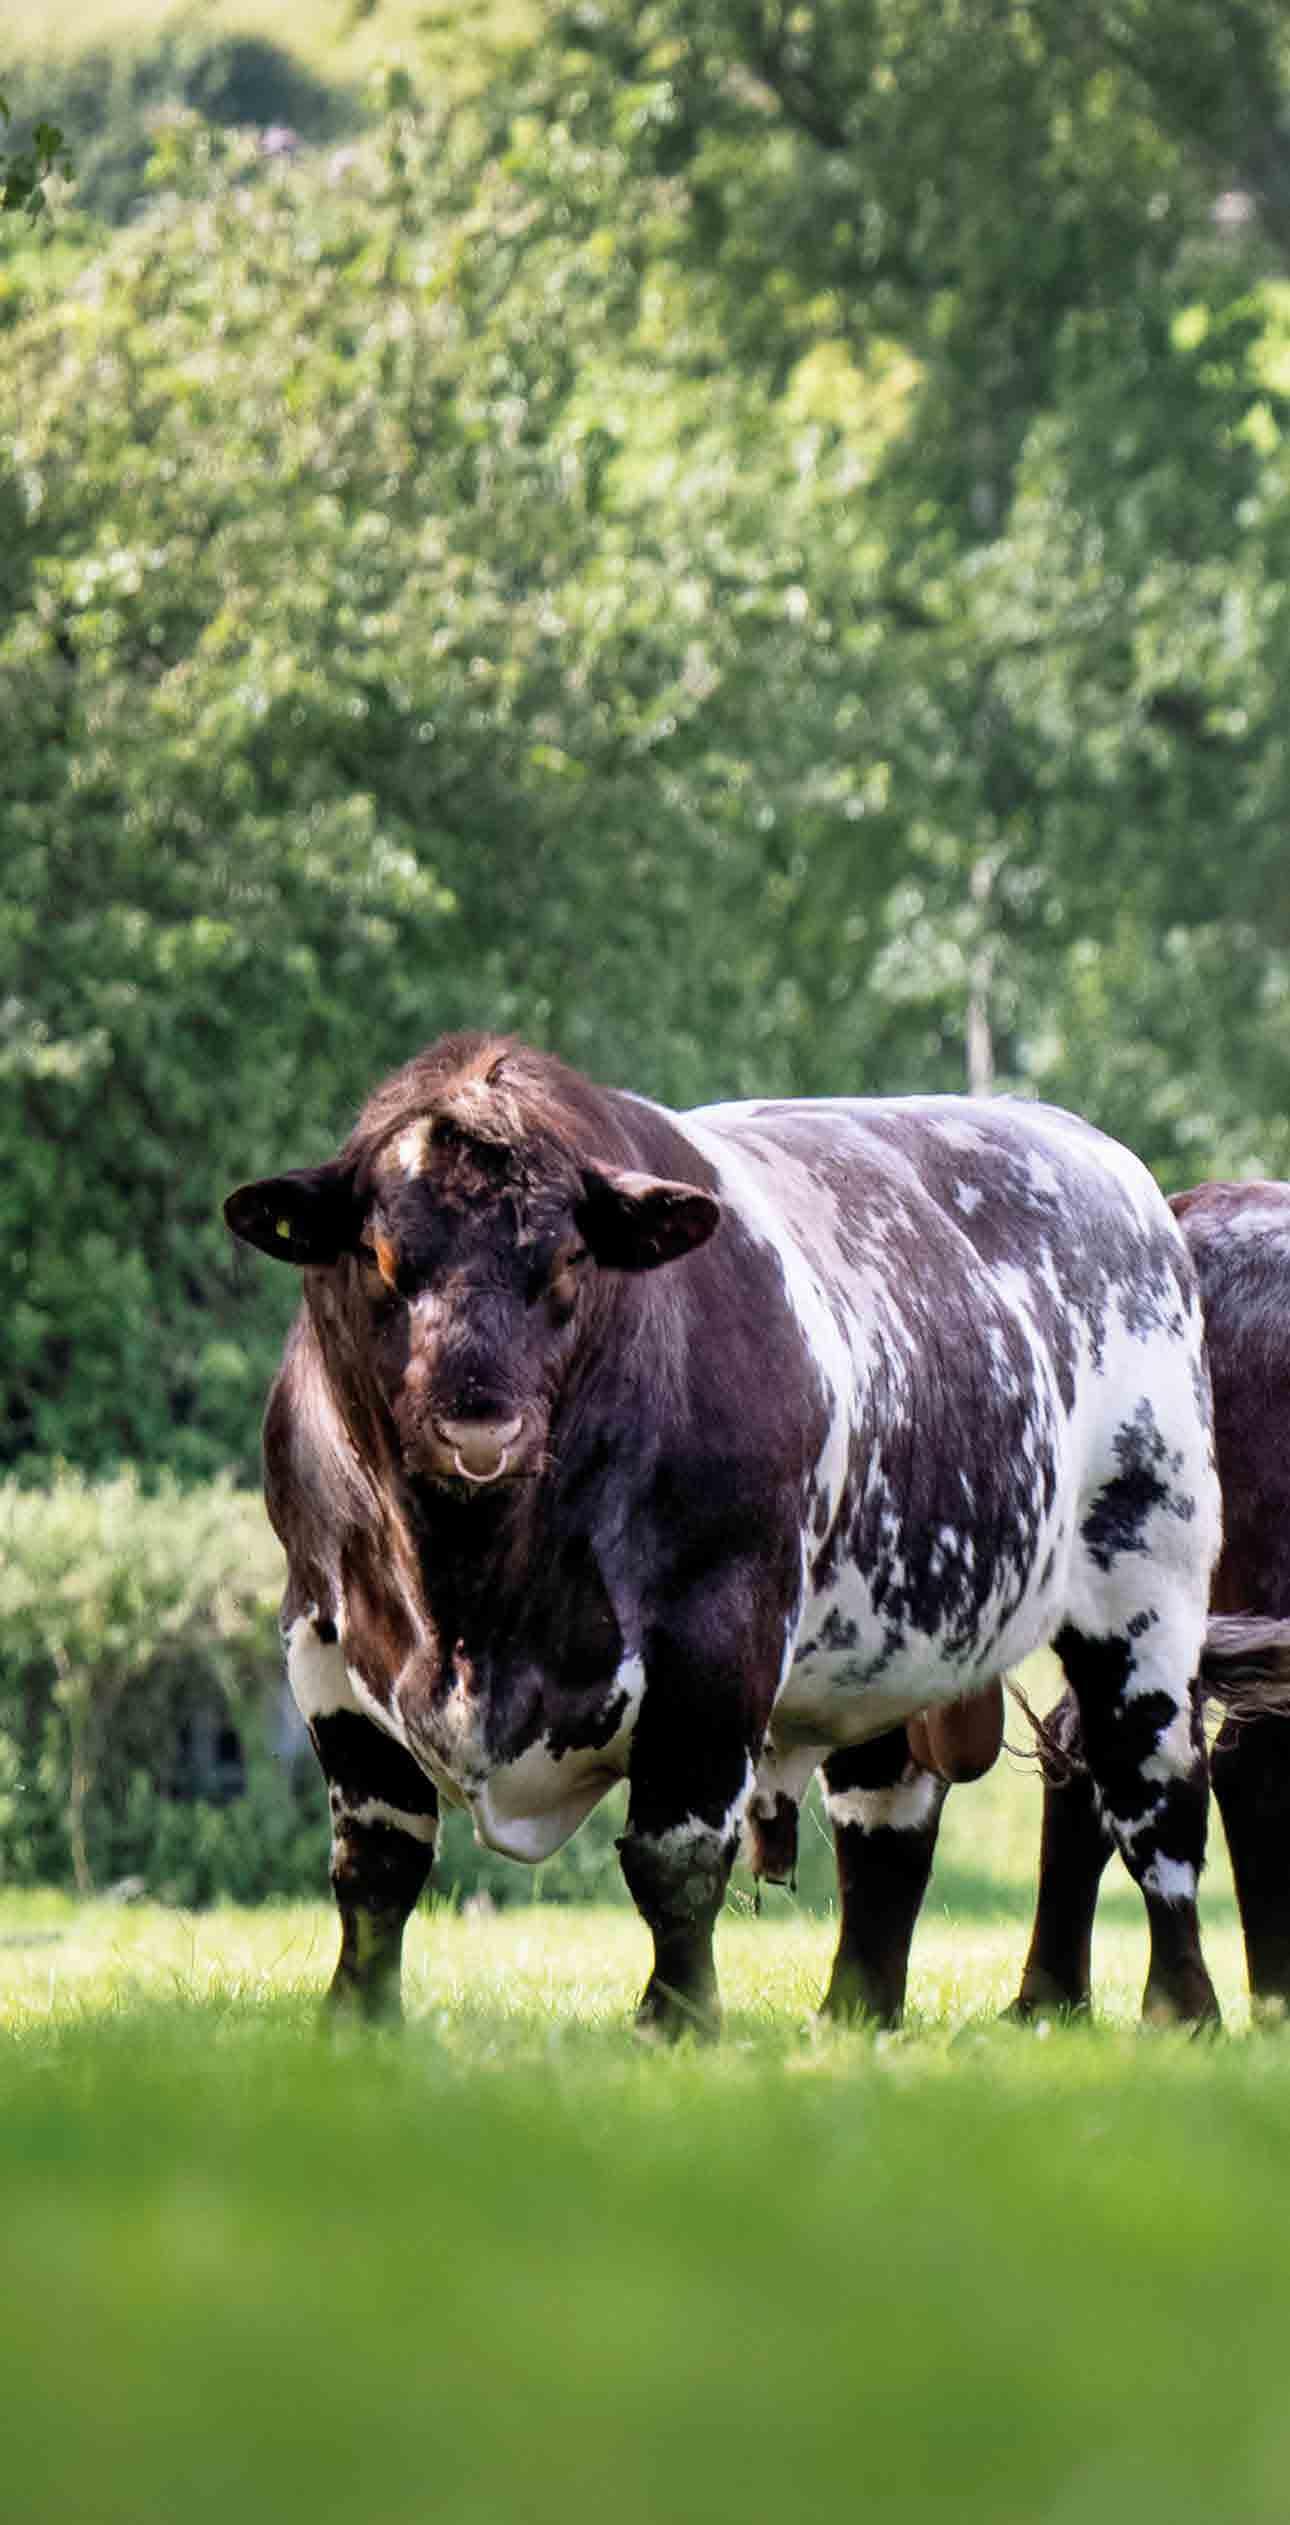
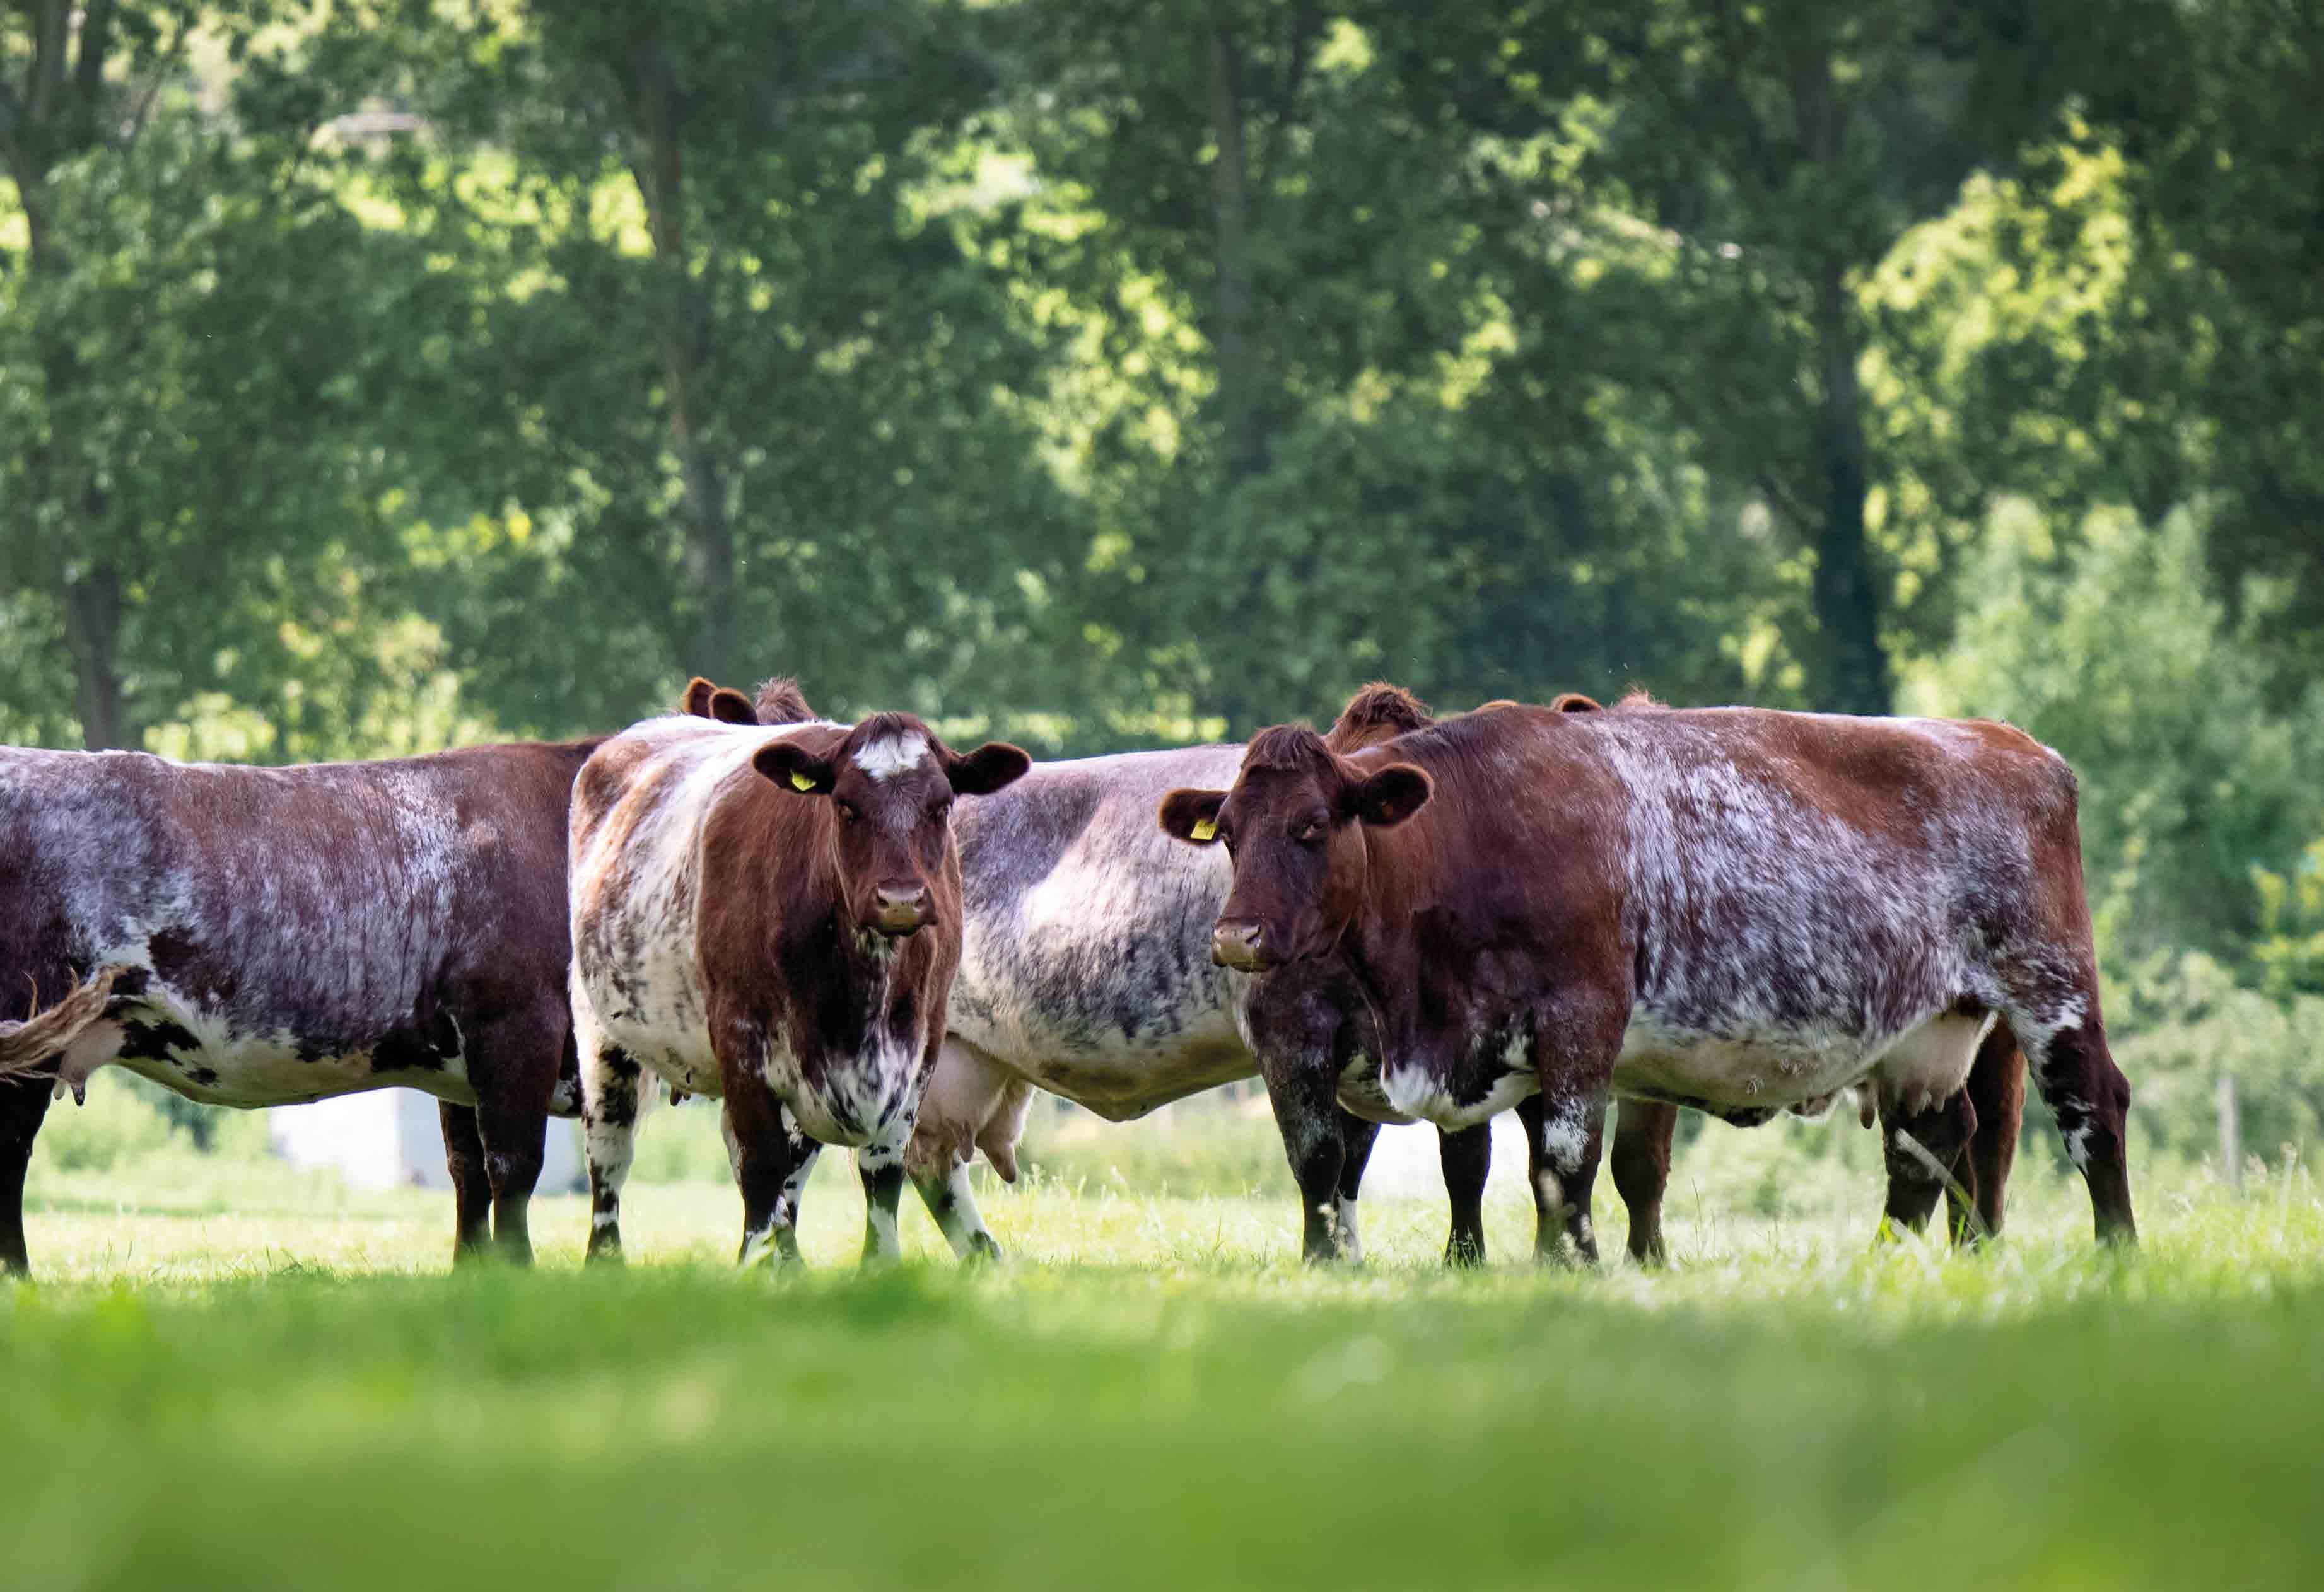
Beef Shorthorns’ ability to thrive off grass-based systems can help significantly reduce a farm’s carbon footprint.
with it, as there are differences within the methods used in each calculator, so comparing results between calculators is meaningless.
Although the simple principle of completing a carbon footprint assessment is the same, there remains variation between what scope and boundaries the tools use to calculate the results. It is important to understand this before you undertake a carbon footprint.
Boundaries are an important factor to consider (or understand with the tool that you are using) as it makes a difference on the data that you need to collect and also the results.
Put simply, boundaries refers to where you are drawing the line around what is included in your calculation and what isn’t.
For example, do you want to calculate the emissions associated with one farm enterprise or the whole farm, or just what is happening within the farm gate or further afield? Making sure this is clear before you start makes the whole process easier.
Also, it is important to understand the scope of the calculations – which relates to the level of processes which are included in the calculation. For example, is the tool including emissions associated with electricity production?
This is important if you are producing your own renewable energy on-farm or are using a renewable tariff.
It also deals with how the emissions associated with fertiliser production are assigned.
A key part of deciding which tool to use centres around what you want to use the footprint for.
Marketing; If you want to use the results for marketing purposes, it is a good idea to choose one that has a clear method attached to it and which sets out what is included and excluded from the calculations. That way you can be completely transparent about your carbon credentials.
A management tool; If you are planning on using the results and the data as a management tool, perhaps to highlight areas to improve in the future, then you will want to use a tool which allows you to evaluate the impact of changing your management. These tools tend to need more data added in at the start so that the impact can truly be seen.
Is sequestration in or out? A key question to look at when footprinting is whether carbon sequestration is included in the calculation. Carbon captured within trees, hedgerows and field margins as well as the carbon held in soil is an important part of the footprint and shouldn’t be overlooked. If the tool doesn’t include sequestration then the footprint will be looking at the negative without the positive.
Getting started
Once you have decided which tool you are going to use, the first step is to gather all the input data. This includes information on fuel use, livestock numbers, fertiliser inputs, use of materials, waste produced etc.
The list can look daunting at first, but if your record keeping is reasonable then this process should be achievable in a couple of hours. One you’ve done it, the next time will be quicker.
Once you have the data, it’s just a case of entering it into the calculator, which shouldn’t take more than an hour, after which you should have a breakdown of carbon emissions by sector, both in amounts (kg or tonnes of CO2) and percentages of the total footprint by category.
Armed with this data you are then ready to think about how to reduce emissions and increase sequestration.
Although there is value in completing a carbon footprint calculation as a oneoff exercise, the really interesting part comes when the process is repeated at regular intervals, usually annually. When you do this you can start to see what direction the farm is moving in and whether the actions you’re taking are working.
Although each farm will vary in its carbon footprint, the chart which follows shows the average breakdown of emissions across a typical livestock farm.
Ruminant livestock farms
Power and fuel use 10%
Imported feedstu s 10%
Fertiliser use 10%
Methane fermentation 50%
Manures 20%
Next steps
So, once you have the results, deciding what to do is the interesting part. The results will be reflected as a carbon dioxide equivalent, but should also show you how that breaks down into the three GHGs.
Key areas to focus on are the management of soils, fertilisers, manures, livestock, cropping, energy and fuel. There are numerous opportunities to reduce emissions and costs as well, leading to improved resilience and profitability, as well as opportunities to improve carbon sequestration and soil health, the ultimate resilient business model. Absorbing more carbon than the farm emits is a goal that all farmers could work towards and understanding the farm’s current carbon position by footprinting is the first key step.
The spotlight is being well and truly shone on agriculture’s carbon credentials at the moment. Carbon footprinting offers an opportunity for us to take the first step and understand what is happening on our individual farms and what we can do to improve profits, reduce emissions and build soil health and sequestration. Carbon offers a fresh lens through which to evaluate our busineses and build resilience for the future.
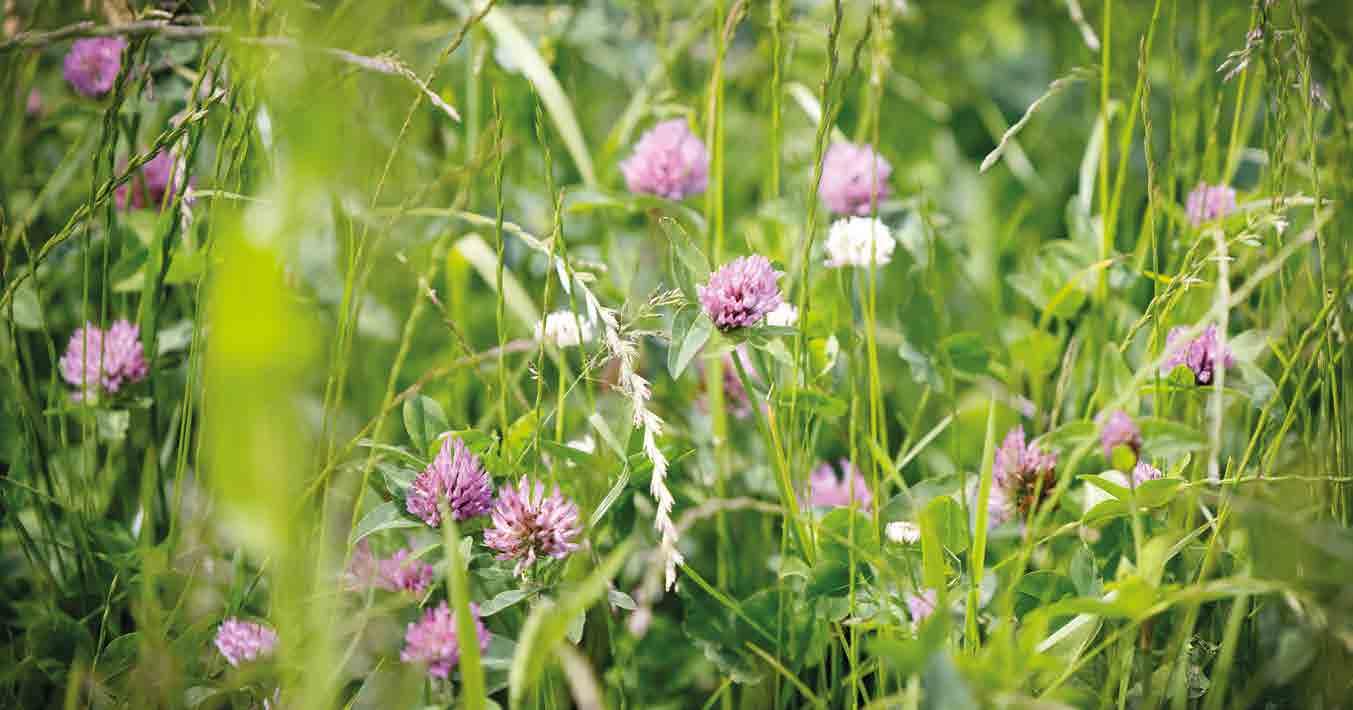
Higher clover content in leys can help reduce carbon emissions, through lowering the need for artificial fertilizer.


