ANNUAL MARKET STUDY BEND OREGON REAL ESTATE
Skjersaa Group | DukeWarner Realty
1
1033 NW Newport Ave, Bend, OR 97703
|
|
541.383.1426
541.382.8262Skjersaa | www.SkjersaaGroup.com Group | DukeWarner Realty | 541.383.1426
DUKE WARNER REALTY
Duke Warner Realty was established in 1967 by Duke and Kitty Warner. Their philosophy was to establish a first-rate real estate company sensitive to their customers’ needs. They felt that if they treated the customers fair and square, they would keep coming back and bring others with them. That is exactly what happned. Duke Warner Realty’s brokers share this philosophy, and today the firm is widely-known for its personalized service and reliability. Unlike many real estate firms, Duke Warner Realty has little turnover in personnel. Years after a transaction is complete, a client, their relative or friend can return knowing that he or she will find the same personal care – and most likely, the same broker! With this kind of reputation, Duke Warner Realty’s success has endured through good times and bad. The company is here to stay, and its brokers are interested and actively involved in our wonderful community.
Skjersaa Group | DukeWarner Realty | 541.383.1426
2
Skjersaa Group The Skjersaa Group’s success is the result of hard work and commitment to customer service. The right combination of talent, personality, and the combined knowledge of our team allows us to offer the highest level of quality and service. Our team of professionals Terry, Jason, Greg and Natasha can provide you with the best quality of service and are committed to exceeding your expectations.
3
Skjersaa Group | DukeWarner Realty | 541.383.1426
THE SKJERSAA GROUP
Terry Skjersaa | Principal Broker, CRS Few families have stronger roots in Bend than Terry Skjersaa. His grandparents Olaf and Grace opened Bend’s first ski shop in 1939. With more than 20 years of experience in the ski and outdoor industry, Terry knows the area from the top of Mount Bachelor to the canyons of the Deschutes River, and all points in between. Terry enjoys spending time with his daughters Ellie and Jade, and his wife Renee. Some of his favorite leisure activities include skiing, cycling, camping and enjoying all that Central Oregon has to offer.
Jason Boone | Principal Broker, CRIS, RENE, SRS, PSA Jason and his wife relocated to Central Oregon from Seattle in 2003. Like Terry, Jason migrated to Real Estate from the Ski & Outdoor Industry. In fact, Terry and Jason worked together in the Ski industry for over 11 years. Their partnership in Real Estate is based on many years of respect and trust. Jason’s background is a diverse mix of sales, marketing, customer service and technology. His uncompromising attention to detail will ensure that you receive the most thorough representation possible. He enjoys spending time with his wife, Karin, daughter, Ashley and son, Eli.
Greg Millikan | Broker After growing up in a rural area north of Seattle, Greg has since lived in every state on the west coast and a stint abroad becoming fluent in the rigors of relocating. After undergrad at the University of Washington where he met and married Ali, graduate studies in Canada and a doctorate in Scotland, their family continued to grow to include Sam, Anna, Eli and Joy - it was time to settle down permanently and make Bend home. Greg’s background is in organizational management and teaching primarily in professional church leadership before leveraging his experience with transition to advocate for others in their own process of buying and selling a home.
Natasha Smith | Broker/Transaction Manager Natasha has long been fascinated with the real estate business. Having been in positions of management in customer service-based businesses and title & escrow, her focus on customer service and ensuring that everything runs smoothly in a transaction is second to none. She enjoys working with the clients to explain the process and guide each of our clients along the way. She is passionate about providing the best experience for our clients through her attention to detail and effective communication. In her free time, she enjoys spending time with her husband and child.
Skjersaa Group | DukeWarner Realty | 541.383.1426
4
ABOUT THE SKJERSAA GROUP
Deep Roots Deep Commitment in the Community
to Your Real Estate Needs
BUSINESS PHILOSOPHY Hard Work
To identify the best solutions consistent with your goals.
Customer Service Integrity
To provide the highest level of service and exceed your expectations.
Committed to representing your best interests and catering to your needs.
Communication Desire to listen and work together to accomplish your goals.
ACCOLADES & ACCOMPLISHMENTS
RESULTS & STATISTICS
Over 1500 transactions closed since 2004
MLS Member Production Ranking For Residential Real Estate Skjersaa Group #9 Total Members 2542
Duke Warner Realty 2nd Top Producing Team for 2006-2007 Duke’s Diamond Award Top Producing Team for 2008 - 2023
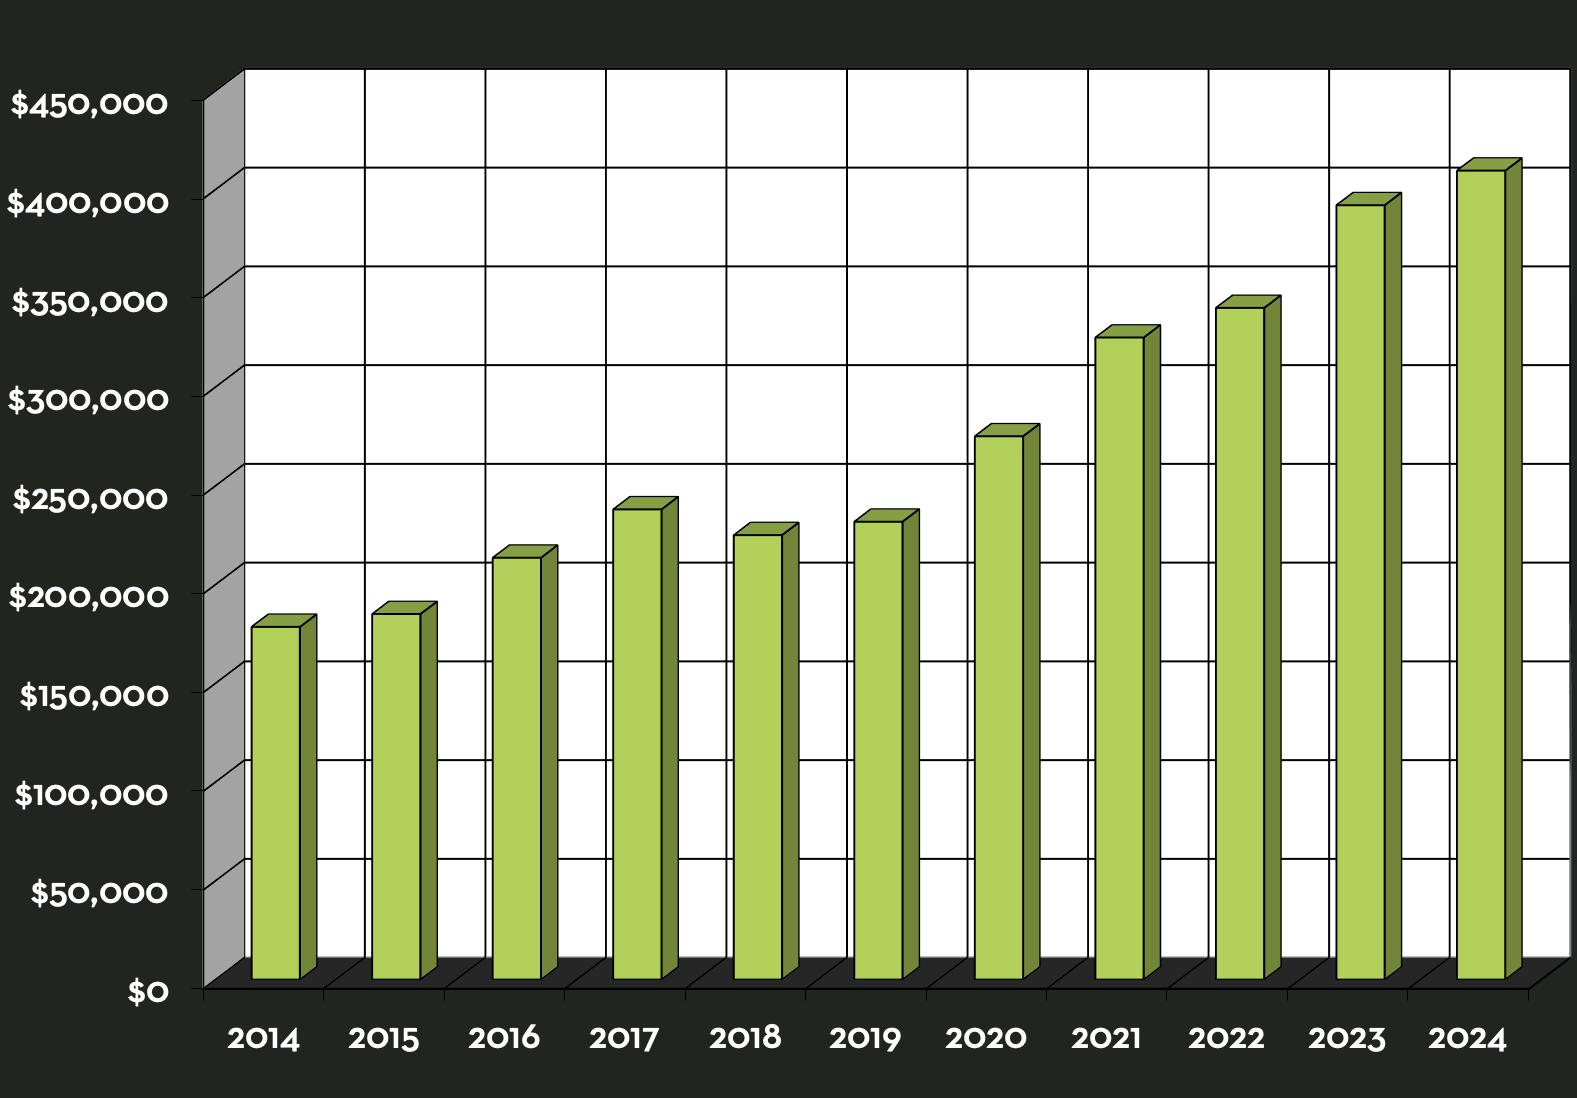
Average Listing to Sales Price Skjersaa Group 100% MLS Member Average 98%
5
Skjersaa Group | DukeWarner Realty | 541.383.1426
DATA SUMMARY DATA SOURCE: This market study was compiled from information provided by the Multiple Listing Service (MLS) of Central Oregon. Although not all property exchanges and transactions take place as a part of the MLS system, it does include a significant majority. AREA: This report includes properties within the Bend Urban area and closely surrounding areas. It does not include any other areas of Central Oregon. Redmond, Sunriver, Sisters or other communities are not included. TIME: This report was prepared in January of 2024 and includes sales figures and data from 2013 through 2023. REPORT INCLUDES: This report is divides into sections by property type, including: Bend Homes, Homes on Acreage, Condominiums and Townhomes, Residential Lots, Lots on Acreage and Multi-Family Units.
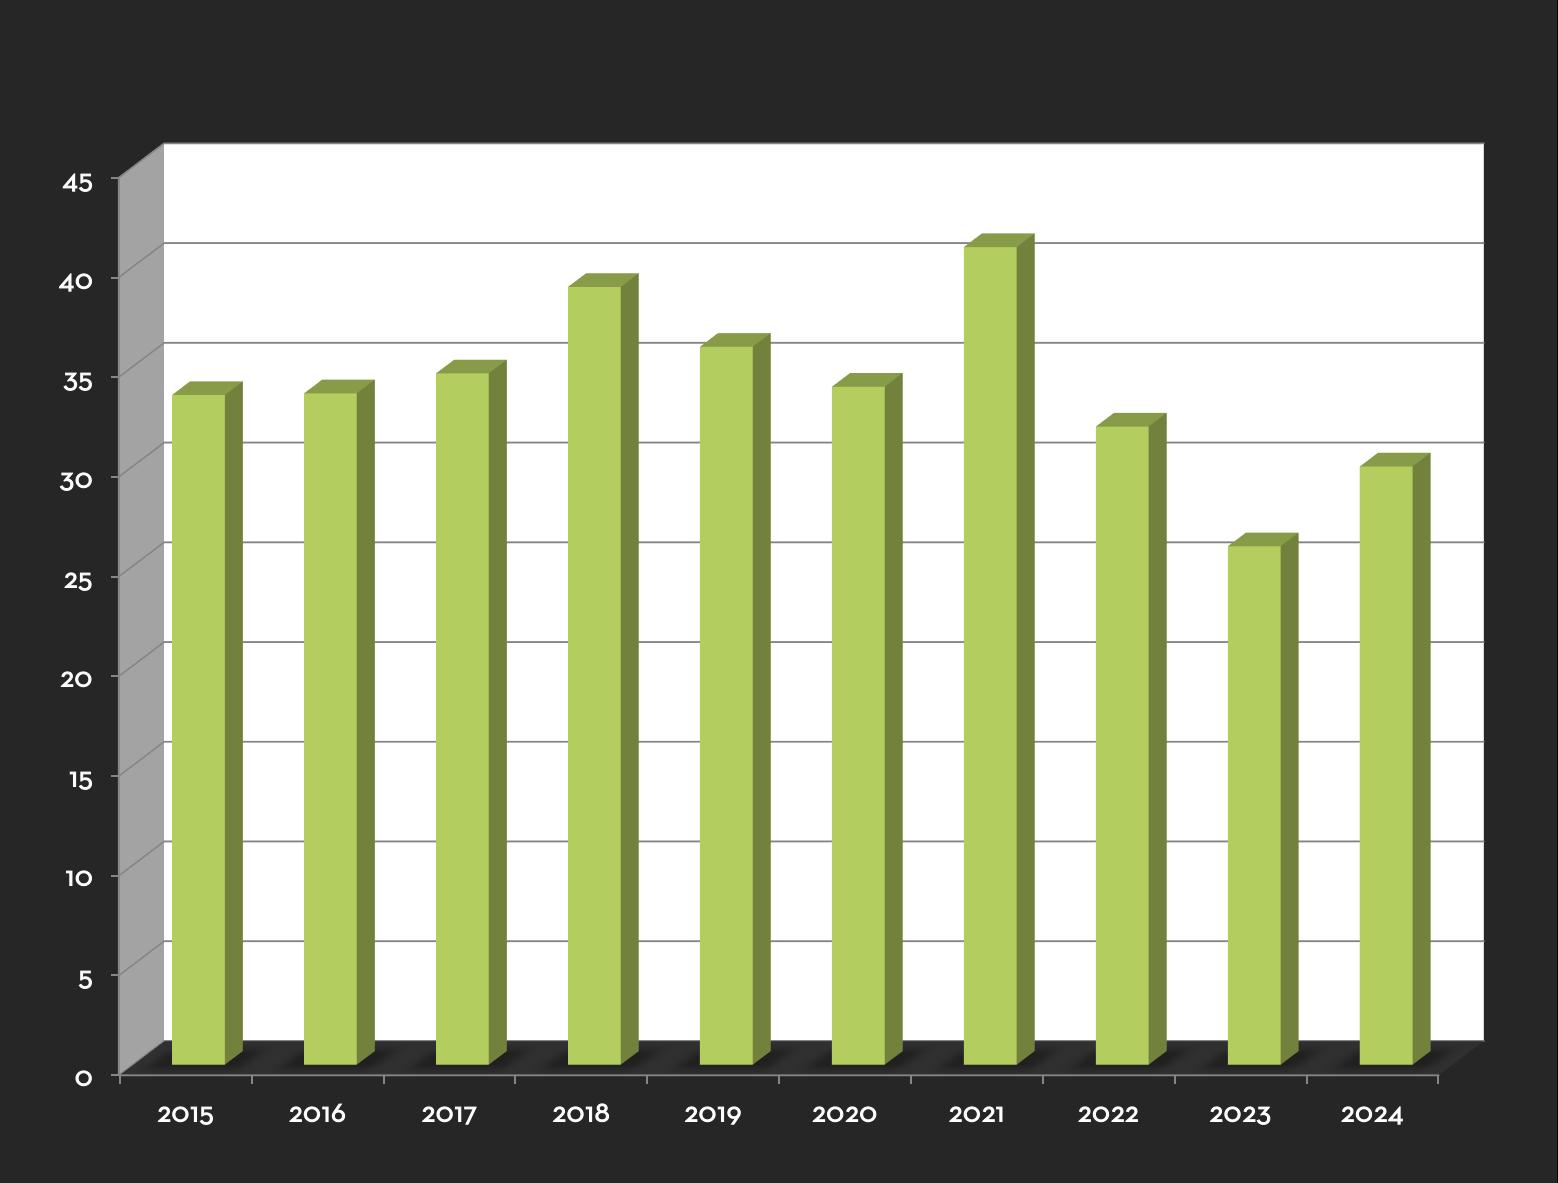
 DAYS ON THE MARKET: Number of days from the listing date to the close of escrow, excluding the escrow period. In 2020, the MLS of Central Oregon changed software/database providers. The former provider calculated days on market (DOM) including the escrow period. The new provider excludes the escrow period. As a result some of the historical data is different; however we have retroactively extracted the data through 2015. ZIP CODE AVERAGE VS ALL AREA AVERAGE: These charts compare the data from each of the three zip codes in the Bend Urban area, including: 97701, 97702 and 97703 to the data that includes all three zip codes. To faciliate the interpretation of the graph, a blue bar representing the value for all three zip codes is included next to each bar indicating the specific area being reported. In prior years we reported the four compass quadrants in Bend (NW, SW, NE & SE), however as of 2020 this information is no longer a required MLS database field and we were forced to find another way to look at the data.
Skjersaa Group | DukeWarner Realty | 541.383.1426
6
HOUSING TYPES SINGLE FAMILY HOMES: Single family homes predominantly within the Urban area and situated on sites of approximately one acre or less.
HOMES ON ACREAGE: Single family homes within and outside of the Bend Urban area on sites larger than one acre.
CONDOMINIUMS & TOWNHOMES: Attached and/or zero lot line detached dwellings primarily within the Urban area.
RESIDENTIAL LOTS: Bare residential building sites of one acre or less.
RESIDENTIAL LOTS ON ACREAGE: Bare residential building sites of two acres or more. For this data set, individual transactions were reviewed for accuacy. In some cases individual transactions were eliminated from the data pool to more reliably relfect the market trend of residential building sites. Listings that were entered into MLS for comparable purposes, and/or transactions that appeared to include large parcels of developable land not sold as residential land on acreage were excluded.
MULTI-FAMILY RESIDENTIAL: Residential duplexes up to large apartment buildings. Primarily duplexes, triplexes and quadplexes.
7
Skjersaa Group | DukeWarner Realty | 541.383.1426
SINGLE FAMILY HOMES # of Sales
2013
2014
2015
2016
2017
2018
2019
2020
2021
2022
2023
2265
2245
2459
2540
2481
2456
2356
2625
2526
2060
1592
MEDIAN SALES PRICE
NUMBER OF SALES
Median List $269,900 $299,975 $329,900 $364,900 $399,900 $429,950 $458,950 $499,900 $629,945 $728,750 $725,000 Price Median $269,000 $289,900 $327,500 $360,000 $399,000 $426,200 $450,000 $505,000 $648,000 $729,900 $724,118 Sales Price % Change 21.17% 7.77% 12.97% 9.92% 10.83% 6.82% 5.58% 12.22% 28.32% 12.64% -0.79% vs Prior Yr Highest $2,000,000 $2,050,000 $2,100,000 $1,875,565 $2,200,000 $2,850,000 $3,925,000 $3,200,000 $4,600,000 $6,500,000 $4,100,000 Sales Price Avg Days on 112 117 115 114 106 104 103 42 16 23 40 Market
Skjersaa Group | DukeWarner Realty | 541.383.1426 Statistics compiled by the Skjersaa Group from data owned and copyrighted by MLS. Information deemed reliable but not guaranteed.
8
SINGLE FAMILY HOMES 2023
97701
97702
97703
2022
97701
97702
97703
# of Sales
404
725
463
# of Sales
601
904
555
Median List $625,000 $688,750 $1,050,000 Price Median $630,000 $691,750 $1,068,095 Sales Price % Change 14.55% 8.92% 13.03% vs 2021 Highest $2,500,000 $6,500,000 $3,700,000 Sales Price Avg Days on 18 23 30 Market
PERCENT CHANGE VS ALL AREAS
MEDIAN SALES PRICE VS ALL AREAS
Median List $599,900 $684,000 $1,050,000 Price Median $597,668 $680,000 $1,030,206 Sales Price % Change -5.13% -1.70% -3.55% vs 2022 Highest $2,180,000 $4,100,000 $4,050,000 Sales Price Avg Days on 35 40 45 Market
ZIP CODE
9
ALL AREAS Skjersaa Group | DukeWarner Realty | 541.383.1426
Statistics compiled by the Skjersaa Group from data owned and copyrighted by MLS. Information deemed reliable but not guaranteed.
MONTHLY AVERAGE | ACTIVE LISTINGS SINGLE FAMILY HOMES
2014
2015
2016
2017
2018
2019
2020
2021
2022
2023
556
491
449
443
475
442
284
166
289
289
Skjersaa Group | DukeWarner Realty | 541.383.1426 Statistics compiled by the Skjersaa Group from data owned and copyrighted by MLS. Information deemed reliable but not guaranteed.
10
MONTHLY AVERAGE | NEW LISTINGS SINGLE FAMILY HOMES
11
2014
2015
2016
2017
2018
2019
2020
2021
2022
2023
212
243
236
246
228
224
217
220
202
153
Skjersaa Group | DukeWarner Realty | 541.383.1426 Statistics compiled by the Skjersaa Group from data owned and copyrighted by MLS. Information deemed reliable but not guaranteed.
MONTHLY AVERAGE | PENDING LISTINGS SINGLE FAMILY HOMES
2014
2015
2016
2017
2018
2019
2020
2021
2022
2023
202
240
239
222
222
219
244
224
182
149
Skjersaa Group | DukeWarner Realty | 541.383.1426 Statistics compiled by the Skjersaa Group from data owned and copyrighted by MLS. Information deemed reliable but not guaranteed.
12
MONTHLY AVERAGE | REDUCED LISTINGS SINGLE FAMILY HOMES
2014
2015
2016
2017
2018
2019
2020
2021
2022
2023
119
-3.77%
-4.52%
-4.70%
-5.18%
-5.12%
-3.07%
-3.43%
-5.73%
-4.85%
In 2020, the MLS of Central Oregon changed MLS database/software providers. The former provider calculated the total number of price reductions. The new provider calculates the average price adjustment (increase or decrease) as a percentage of value. As a result some of the historical data is different; however we have retroactively extracted the data through 2015.
13
Skjersaa Group | DukeWarner Realty | 541.383.1426 Statistics compiled by the Skjersaa Group from data owned and copyrighted by MLS. Information deemed reliable but not guaranteed.
MONTHLY AVERAGE | SOLD LISTINGS SINGLE FAMILY HOMES
2014
2015
2016
2017
2018
2019
2020
2021
2022
2023
179
198
210
202
202
193
215
206
168
130
Skjersaa Group | DukeWarner Realty | 541.383.1426 Statistics compiled by the Skjersaa Group from data owned and copyrighted by MLS. Information deemed reliable but not guaranteed.
14
MONTHLY AVERAGE | DAYS ON MARKET SINGLE FAMILY HOMES
2014
2015
2016
2017
2018
2019
2020
2021
2022
2023
130
62
54
54
57
59
49
18
27
36
In 2020, the MLS of Central Oregon changed software/database providers. The former provider calculated days on market (DOM) including the escrow period. The new provider excludes the escrow period. As a result some of the historical data is different; however we have retroactively extracted the data through 2015.
15
Skjersaa Group | DukeWarner Realty | 541.383.1426 Statistics compiled by the Skjersaa Group from data owned and copyrighted by MLS. Information deemed reliable but not guaranteed.
MONTHLY AVERAGE | MONTHS OF INV. SINGLE FAMILY HOMES
2014
2015
2016
2017
2018
2019
2020
2021
2022
2023
5
3
3
4
4
4
2
1
2
2
Skjersaa Group | DukeWarner Realty | 541.383.1426 Statistics compiled by the Skjersaa Group from data owned and copyrighted by MLS. Information deemed reliable but not guaranteed.
16
3-YEAR REVIEW | ACTIVE LISTINGS SINGLE FAMILY HOMES
Jan
Feb
Mar
Apr
May
Jun
Jul
Aug
Sep
Oct
Nov
Dec
2021
92
75
89
108
123
156
237
242
291
249
183
143
2022
110
99
127
187
269
357
461
437
419
389
347
271
2023
220
209
222
222
291
312
374
354
343
341
309
273
17
Skjersaa Group | DukeWarner Realty | 541.383.1426 Statistics compiled by the Skjersaa Group from data owned and copyrighted by MLS. Information deemed reliable but not guaranteed.
3-YEAR REVIEW | PENDING LISTINGS SINGLE FAMILY HOMES
Jan
Feb
Mar
Apr
May
Jun
Jul
Aug
Sep
Oct
Nov
Dec
2021
161
166
258
240
250
289
243
263
233
215
204
168
2022
177
213
244
226
245
181
185
218
163
126
129
76
2023
123
164
174
181
185
182
195
146
125
121
96
99
Skjersaa Group | DukeWarner Realty | 541.383.1426 Statistics compiled by the Skjersaa Group from data owned and copyrighted by MLS. Information deemed reliable but not guaranteed.
18
3-YEAR REVIEW | REDUCED LISTINGS SINGLE FAMILY HOMES
Jan
Feb
Mar
Apr
May
Jun
Jul
Aug
Sep
Oct
Nov
Dec
2021
-3.17%
3.62%
-1.59%
-2.56%
-3.03%
-6.36%
-5.64%
-7.21%
-4.55%
-4.51%
-3.60%
-2.54%
2022
-1.42%
-2.17%
-2.71%
-3.80%
-5.78%
-6.16%
-6.48%
-6.80%
-8.31%
-7.48%
-9.49%
-8.20%
2023
-5.32%
-4.70%
-4.87%
-2.75%
-4.61%
-3.39%
-3.94%
-5.14%
-6.18%
-6.03%
-6.32%
-4.98%
In 2020, the MLS of Central Oregon changed MLS database/software providers. The former provider calculated the total number of price reductions. The new provider calculates the average price adjustment (increase or decrease) as a percentage of value. As a result some of the historical data is different; however we have retroactively extracted the data through 2015.
19
Skjersaa Group | DukeWarner Realty | 541.383.1426 Statistics compiled by the Skjersaa Group from data owned and copyrighted by MLS. Information deemed reliable but not guaranteed.
3-YEAR REVIEW | SOLD LISTINGS SINGLE FAMILY HOMES
Jan
Feb
Mar
Apr
May
Jun
Jul
Aug
Sep
Oct
Nov
Dec
2021
154
118
181
242
227
255
250
231
235
212
199
172
2022
131
132
209
185
218
197
179
188
182
159
139
98
2023
84
112
125
129
161
180
140
162
137
127
105
92
Skjersaa Group | DukeWarner Realty | 541.383.1426 Statistics compiled by the Skjersaa Group from data owned and copyrighted by MLS. Information deemed reliable but not guaranteed.
20
3-YEAR REVIEW | MEDIAN PRICE SINGLE FAMILY HOMES
Jan
Feb
Mar
Apr
May
Jun
Jul
Aug
Sep
Oct
Nov
Dec
2021 $577,500 $595,000 $597,500 $652,000 $628,250 $654,500 $675,000 $636,282 $650,000 $645,000 $684,000 $675,000 2022 $686,000 $773,000 $770,000 $769,900 $740,000 $720,000 $770,500 $717,000 $724,900 $679,950 $695,900 $677,500 2023 $684,950 $659,450 $680,000 $669,100 $747,500
21
$770,194
$799,950 $738,389 $750,000 $734,000 $710,000 $737,000
Skjersaa Group | DukeWarner Realty | 541.383.1426 Statistics compiled by the Skjersaa Group from data owned and copyrighted by MLS. Information deemed reliable but not guaranteed.
HOMES ON ACREAGE # of Sales
2013
2014
2015
2016
2017
2018
2019
2020
2021
2022
2023
293
259
325
318
289
318
304
367
400
286
202
MEDIAN SALES PRICE
NUMBER OF SALES
Median List $399,900 $474,900 $479,000 $560,000 $628,000 $699,250 $654,500 $800,000 $995,000 $1,122,500 $997,000 Price Median $389,000 $460,000 $477,000 $549,000 $610,000 $655,450 $645,000 $798,500 $999,999 $1,100,000 $975,000 Sales Price % Change 14.50% 11.11% 7.45% -1.59% 23.80% 25.23% 10.00% -11.36% 21.56% 18.25% 3.70% vs Prior Yr Highest $2,500,000 $1,900,000 $2,150,000 $3,061,083 $2,775,000 $4,200,000 $3,750,000 $12,000,000 $7,500,000 $4,650,000 $6,750,000 Sales Price Avg Days on 143 143 133 133 91 35 43 60 154 160 143 Market
Skjersaa Group | DukeWarner Realty | 541.383.1426 Statistics compiled by the Skjersaa Group from data owned and copyrighted by MLS. Information deemed reliable but not guaranteed.
22
HOMES ON ACREAGE 2023
97701
97702
97703
2022
97701
97702
97703
# of Sales
60
53
89
# of Sales
80
97
109
Median List $953,450 $1,100,000 $1,250,000 Price Median $953,500 $1,091,000 $1,264,424 Sales Price % Change 9.60% 9.32% 14,95% vs 2021 Highest $2,783,705 $4,588,000 $4,650,000 Sales Price Avg Days on 43 42 43 Market
PERCENT CHANGE VS ALL AREAS
MEDIAN SALES PRICE VS ALL AREAS
Median List $854,450 $1,025,000 $1,150,000 Price Median $822,500 $1,000,000 $1,100,000 Sales Price % Change -13.74% -8.34% -13.00% vs 2022 Highest $2,325,000 $6,750,000 $5,500,000 Sales Price Avg Days on 62 61 57 Market
ZIP CODE
23
ALL AREAS Skjersaa Group | DukeWarner Realty | 541.383.1426
Statistics compiled by the Skjersaa Group from data owned and copyrighted by MLS. Information deemed reliable but not guaranteed.
MONTHLY AVERAGE | ACTIVE LISTINGS RESIDENTIAL HOMES ON ACREAGE
2014
2015
2016
2017
2018
2019
2020
2021
2022
2023
151
141
123
101
140
131
91
71
82
89
Skjersaa Group | DukeWarner Realty | 541.383.1426 Statistics compiled by the Skjersaa Group from data owned and copyrighted by MLS. Information deemed reliable but not guaranteed.
24
MONTHLY AVERAGE | NEW LISTINGS RESIDENTIAL HOMES ON ACREAGE
25
2014
2015
2016
2017
2018
2019
2020
2021
2022
2023
30
34
34
35
39
36
34
41
32
26
Skjersaa Group | DukeWarner Realty | 541.383.1426 Statistics compiled by the Skjersaa Group from data owned and copyrighted by MLS. Information deemed reliable but not guaranteed.
MONTHLY AVERAGE | PENDING LISTINGS RESIDENTIAL HOMES ON ACREAGE
2014
2015
2016
2017
2018
2019
2020
2021
2022
2023
22
26
31
28
30
31
36
39
26
22
Skjersaa Group | DukeWarner Realty | 541.383.1426 Statistics compiled by the Skjersaa Group from data owned and copyrighted by MLS. Information deemed reliable but not guaranteed.
26
MONTHLY AVERAGE | REDUCED LISTINGS RESIDENTIAL HOMES ON ACREAGE
2014
2015
2016
2017
2018
2019
2020
2021
2022
2023
25
-9.09%
-9.30%
-9.58%
-9.77%
-9.88%
-8.41%
-8.48%
-8.21%
-8.61%
In 2020, the MLS of Central Oregon changed MLS database/software providers. The former provider calculated the total number of price reductions. The new provider calculates the average price adjustment (increase or decrease) as a percentage of value. As a result some of the historical data is different; however we have retroactively extracted the data through 2015.
27
Skjersaa Group | DukeWarner Realty | 541.383.1426 Statistics compiled by the Skjersaa Group from data owned and copyrighted by MLS. Information deemed reliable but not guaranteed.
MONTHLY AVERAGE | SOLD LISTINGS RESIDENTIAL HOMES ON ACREAGE
2014
2015
2016
2017
2018
2019
2020
2021
2022
2023
17
22
24
24
27
26
31
33
24
17
Skjersaa Group | DukeWarner Realty | 541.383.1426 Statistics compiled by the Skjersaa Group from data owned and copyrighted by MLS. Information deemed reliable but not guaranteed.
28
MONTHLY AVERAGE | DAYS ON MARKET RESIDENTIAL HOMES ON ACREAGE
2014
2015
2016
2017
2018
2019
2020
2021
2022
2023
179
94
97
91
84
99
94
32
44
54
In 2020, the MLS of Central Oregon changed software/database providers. The former provider calculated days on market (DOM) including the escrow period. The new provider excludes the escrow period. As a result some of the historical data is different; however we have retroactively extracted the data through 2015.
29
Skjersaa Group | DukeWarner Realty | 541.383.1426 Statistics compiled by the Skjersaa Group from data owned and copyrighted by MLS. Information deemed reliable but not guaranteed.
MONTHLY AVERAGE | MONTHS OF INV. RESIDENTIAL HOMES ON ACREAGE
2014
2015
2016
2017
2018
2019
2020
2021
2022
2023
10
11
7
5
7
6
4
2
4
5
Skjersaa Group | DukeWarner Realty | 541.383.1426 Statistics compiled by the Skjersaa Group from data owned and copyrighted by MLS. Information deemed reliable but not guaranteed.
30
3-YEAR REVIEW | ACTIVE LISTINGS RESIDENTIAL HOMES ON ACREAGE
Jan
Feb
Mar
Apr
May
Jun
Jul
Aug
Sep
Oct
Nov
Dec
2021
102
34
34
40
47
55
73
89
114
108
91
63
2022
37
30
36
57
75
94
117
127
122
117
90
83
2023
66
70
63
66
78
97
108
117
119
102
100
79
31
Skjersaa Group | DukeWarner Realty | 541.383.1426 Statistics compiled by the Skjersaa Group from data owned and copyrighted by MLS. Information deemed reliable but not guaranteed.
3-YEAR REVIEW | PENDING LISTINGS RESIDENTIAL HOMES ON ACREAGE
Jan
Feb
Mar
Apr
May
Jun
Jul
Aug
Sep
Oct
Nov
Dec
2021
33
21
26
35
50
47
47
45
51
36
23
18
2022
31
28
18
51
31
28
15
31
25
17
20
14
2023
24
14
23
19
30
28
24
24
27
20
11
20
Skjersaa Group | DukeWarner Realty | 541.383.1426 Statistics compiled by the Skjersaa Group from data owned and copyrighted by MLS. Information deemed reliable but not guaranteed.
32
3-YEAR REVIEW | REDUCED LISTINGS RESIDENTIAL HOMES ON ACREAGE
Jan
Feb
Mar
Apr
May
Jun
Jul
Aug
Sep
Oct
Nov
Dec
2021
-6.81%
-11.20%
-6.15%
-4.80%
-9.46%
-8.21%
-9.51%
-9.76%
-8.92%
-9.54%
-8.31%
-9.11%
2022
-6.18%
-6.65%
-7.75%
-6.09%
-3.35%
-6.38%
-10.89%
-10.62%
-10.65%
-13.10%
-9.20%
-7.64%
2023
-7.89%
-8.97%
-7.71%
-14.44%
-7.91%
-6.46%
-9.87%
-8.75%
-7.17%
-11.11%
-7.88%
-5.24%
In 2020, the MLS of Central Oregon changed MLS database/software providers. The former provider calculated the total number of price reductions. The new provider calculates the average price adjustment (increase or decrease) as a percentage of value. As a result some of the historical data is different; however we have retroactively extracted the data through 2015.
33
Skjersaa Group | DukeWarner Realty | 541.383.1426 Statistics compiled by the Skjersaa Group from data owned and copyrighted by MLS. Information deemed reliable but not guaranteed.
3-YEAR REVIEW | SOLD LISTINGS RESIDENTIAL HOMES ON ACREAGE
Jan
Feb
Mar
Apr
May
Jun
Jul
Aug
Sep
Oct
Nov
Dec
2021
24
26
32
26
30
39
47
38
34
44
45
39
2022
30
24
23
31
33
17
27
24
21
22
17
18
2023
12
12
16
17
22
21
27
20
17
17
16
9
Skjersaa Group | DukeWarner Realty | 541.383.1426 Statistics compiled by the Skjersaa Group from data owned and copyrighted by MLS. Information deemed reliable but not guaranteed.
34
3-YEAR REVIEW | MEDIAN PRICE RESIDENTIAL HOMES ON ACREAGE
Jan
Feb
Mar
Apr
May
Jun
Jul
Aug
Sep
Oct
Nov
Dec
2021 $904,950 $791,250 $1,097,000 $880,000 $885,000 $1,071,500 $1,049,000 $915,000 $1,200,000 $1,125,000 $1,100,000 $934,000 2022 $1,037,500 $1,004,950 $1,263,000 $1,175,000 $1,000,000 $999,750 $1,215,000 $1,262,500 $1,265,000 $1,077,500 $1,018,750 $1,150,000 2023 $1,018,000 $874,900 $912,000 $925,000 $1,000,000 $977,500 $999,000 $1,055,000 $810,000 $1,085,000 $1,197,250 $895,000
35
Skjersaa Group | DukeWarner Realty | 541.383.1426 Statistics compiled by the Skjersaa Group from data owned and copyrighted by MLS. Information deemed reliable but not guaranteed.
CONDOMINIUMS & TOWNHOMES # of Sales
2013
2014
2015
2016
2017
2018
2019
2020
2021
2022
2023
208
260
257
282
258
278
299
329
374
232
196
MEDIAN SALES PRICE
NUMBER OF SALES
Median List $239,950 $259,950 $299,900 $309,450 $329,700 $357,000 $385,000 $399,900 $482,450 $559,900 $592,500 Price Median $236,750 $259,250 $297,500 $306,475 $326,250 $350,000 $375,000 $400,000 $485,250 $559,950 $582,500 Sales Price % Change 3.02% 6.45% 7.28% 7.14% 6.67% 21.31% 15.39% 4.03% 9.48% 9.50% 14.75% vs Prior Yr Highest $964,250 $1,325,000 $923,574 $1,130,000$1,500,000$1,350,000$1,800,000 $1,811,385 $2,260,000 $2,600,000 $2,350,000 Sales Price Avg Days on 157 127 125 148 67 47 24 56 150 150 146 Market
Skjersaa Group | DukeWarner Realty | 541.383.1426 Statistics compiled by the Skjersaa Group from data owned and copyrighted by MLS. Information deemed reliable but not guaranteed.
36
CONDOMINIUMS & TOWNHOMES 2023
97701
97702
97703
2022
97701
97702
97703
# of Sales
32
108
56
# of Sales
65
121
46
Median List $500,000 $739,900 $699,000 Price Median $499,900 $750,000 $702,500 Sales Price % Change 11.11% 42.10% 8.09% vs 2021 Highest $1,100,000 $2,600,000 $1,850,000 Sales Price Avg Days on 30 24 18 Market
PERCENT CHANGE VS ALL AREAS
MEDIAN SALES PRICE VS ALL AREAS
Median List $504,950 $662,500 $694,000 Price Median $497,000 $645,000 $690,750 Sales Price % Change -0.58% -14.0% -1.67% vs 2022 Highest $1,500,000 $2,350,000 $1,600,000 Sales Price Avg Days on 56 58 51 Market
ZIP CODE
37
ALL AREAS Skjersaa Group | DukeWarner Realty | 541.383.1426
Statistics compiled by the Skjersaa Group from data owned and copyrighted by MLS. Information deemed reliable but not guaranteed.
RESIDENTIAL LOTS # of Sales
2013
2014
2015
2016
2017
2018
2019
2020
2021
2022
2023
261
214
183
172
160
187
162
209
145
119
89
MEDIAN SALES PRICE
NUMBER OF SALES
Median List $149,000 $179,500 $194,000 $220,500 $246,500 $234,950 $245,000 $275,000 $328,000 $350,000 $392,000 Price Median $140,000 $178,500 $185,000 $213,500 $238,000 $224,950 $231,750 $275,000 $325,000 $340,000 $392,000 Sales Price % Change 15.41% 11.48% 5.48% 3.02% 18.66% 18.18% 4.62% 15.29% 55.56% 27.50% 3.64% vs Prior Yr Highest $675,000 $550,000 $530,000 $1,110,000 $700,000 $601,000 $825,000 $865,000 $1,300,000 $1,750,000 $1,700,000 Sales Price Avg Days on 196 208 193 197 142 107 138 84 185 165 184 Market
Skjersaa Group | DukeWarner Realty | 541.383.1426 Statistics compiled by the Skjersaa Group from data owned and copyrighted by MLS. Information deemed reliable but not guaranteed.
38
RESIDENTIAL LOTS 2023
97701
97702
97703
2022
97701
97702
97703
# of Sales
13
24
52
# of Sales
35
31
53
Median List $205,000 $309,900 $408,800 Price Median $189,500 $290,000 $408,800 Sales Price % Change -18.49% -19.33% 16.80% vs 2021 Highest $464,800 $1,055,000 $1,750,000 Sales Price Avg Days on 173 74 152 Market
PERCENT CHANGE VS ALL AREAS
MEDIAN SALES PRICE VS ALL AREAS
Median List $246,000 $312,000 $410,000 Price Median $220.000 $282,500 $400,800 Sales Price % Change 16.09% -2.59% -1.96% vs 2022 Highest $370,000 $850,000 $1,700,000 Sales Price Avg Days on 121 89 72 Market
ZIP CODE
39
ALL AREAS Skjersaa Group | DukeWarner Realty | 541.383.1426
Statistics compiled by the Skjersaa Group from data owned and copyrighted by MLS. Information deemed reliable but not guaranteed.
MONTHLY AVERAGE | ACTIVE LISTINGS BARE LAND/LOTS < ONE ACRE
2014
2015
2016
2017
2018
2019
2020
2021
2022
2023
191
201
205
188
187
178
118
101
86
99
Skjersaa Group | DukeWarner Realty | 541.383.1426 Statistics compiled by the Skjersaa Group from data owned and copyrighted by MLS. Information deemed reliable but not guaranteed.
40
MONTHLY AVERAGE | NEW LISTINGS BARE LAND/LOTS < ONE ACRE
41
2014
2015
2016
2017
2018
2019
2020
2021
2022
2023
29
29
25
27
30
22
19
18
12
15
Skjersaa Group | DukeWarner Realty | 541.383.1426 Statistics compiled by the Skjersaa Group from data owned and copyrighted by MLS. Information deemed reliable but not guaranteed.
MONTHLY AVERAGE | PENDING LISTINGS BARE LAND/LOTS < ONE ACRE
2014
2015
2016
2017
2018
2019
2020
2021
2022
2023
20
19
16
16
17
16
22
14
11
10
Skjersaa Group | DukeWarner Realty | 541.383.1426 Statistics compiled by the Skjersaa Group from data owned and copyrighted by MLS. Information deemed reliable but not guaranteed.
42
MONTHLY AVERAGE | REDUCED LISTINGS BARE LAND/LOTS < ONE ACRE
2014
2015
2016
2017
2018
2019
2020
2021
2022
2023
10
-9.30%
-9.42%
-9.99%
-11.83%
-9.68%
-9.94%
-4.17%
-9.91%
-10.78%
In 2020, the MLS of Central Oregon changed MLS database/software providers. The former provider calculated the total number of price reductions. The new provider calculates the average price adjustment (increase or decrease) as a percentage of value. As a result some of the historical data is different; however we have retroactively extracted the data through 2015.
43
Skjersaa Group | DukeWarner Realty | 541.383.1426 Statistics compiled by the Skjersaa Group from data owned and copyrighted by MLS. Information deemed reliable but not guaranteed.
MONTHLY AVERAGE | SOLD LISTINGS BARE LAND/LOTS < ONE ACRE
2014
2015
2016
2017
2018
2019
2020
2021
2022
2023
17
15
14
13
15
13
17
12
10
7
Skjersaa Group | DukeWarner Realty | 541.383.1426 Statistics compiled by the Skjersaa Group from data owned and copyrighted by MLS. Information deemed reliable but not guaranteed.
44
MONTHLY AVERAGE | DAYS ON MARKET BARE LAND/LOTS < ONE ACRE
2014
2015
2016
2017
2018
2019
2020
2021
2022
2023
151
139
159
166
156
163
145
86
105
86
In 2020, the MLS of Central Oregon changed software/database providers. The former provider calculated days on market (DOM) including the escrow period. The new provider excludes the escrow period. As a result some of the historical data is different; however we have retroactively extracted the data through 2015.
45
Skjersaa Group | DukeWarner Realty | 541.383.1426 Statistics compiled by the Skjersaa Group from data owned and copyrighted by MLS. Information deemed reliable but not guaranteed.
MONTHLY AVERAGE | MONTHS OF INV. BARE LAND/LOTS < ONE ACRE
2014
2015
2016
2017
2018
2019
2020
2021
2022
2023
14
13
18
16
14
15
10
13.4
12.6
18.3
Skjersaa Group | DukeWarner Realty | 541.383.1426 Statistics compiled by the Skjersaa Group from data owned and copyrighted by MLS. Information deemed reliable but not guaranteed.
46
3-YEAR REVIEW | ACTIVE LISTINGS BARE LAND/LOTS < ONE ACRE
Jan
Feb
Mar
Apr
May
Jun
Jul
Aug
Sep
Oct
Nov
Dec
2021
78
65
73
115
115
114
115
113
113
111
101
97
2022
100
87
90
76
80
74
84
91
87
86
82
94
2023
84
89
94
91
98
94
113
117
108
102
104
93
47
Skjersaa Group | DukeWarner Realty | 541.383.1426 Statistics compiled by the Skjersaa Group from data owned and copyrighted by MLS. Information deemed reliable but not guaranteed.
3-YEAR REVIEW | PENDING LISTINGS BARE LAND/LOTS < ONE ACRE
Jan
Feb
Mar
Apr
May
Jun
Jul
Aug
Sep
Oct
Nov
Dec
2021
19
16
13
18
25
13
11
4
10
10
23
4
2022
20
19
13
14
23
9
4
9
7
4
4
3
2023
9
10
13
6
6
12
21
10
8
4
9
7
Skjersaa Group | DukeWarner Realty | 541.383.1426 Statistics compiled by the Skjersaa Group from data owned and copyrighted by MLS. Information deemed reliable but not guaranteed.
48
3-YEAR REVIEW | REDUCED LISTINGS BARE LAND/LOTS < ONE ACRE
Jan
Feb
Mar
Apr
May
Jun
Jul
Aug
Sep
Oct
Nov
Dec
2021
-8.37%
-6.03%
-5.79%
-4.54%
-4.26%
-3.23%
-4.44%
-7.18%
-2.88%
-4.92%
0.35%
1.28%
2022
-5.73%
-6.43%
-6.34%
-1.41%
-4.10%
-10.90%
-11.85%
-13.09%
-14.52%
-16.21%
-15.66%
-12.72%
2023
-9.56%
-10.42%
-4.64%
-7.00%
-12.62%
-10.28%
-15.17%
-7.72%
-8.92%
-9.67%
-14.18%
-19.17%
In 2020, the MLS of Central Oregon changed MLS database/software providers. The former provider calculated the total number of price reductions. The new provider calculates the average price adjustment (increase or decrease) as a percentage of value. As a result some of the historical data is different; however we have retroactively extracted the data through 2015.
49
Skjersaa Group | DukeWarner Realty | 541.383.1426 Statistics compiled by the Skjersaa Group from data owned and copyrighted by MLS. Information deemed reliable but not guaranteed.
3-YEAR REVIEW | SOLD LISTINGS BARE LAND/LOTS < ONE ACRE
Jan
Feb
Mar
Apr
May
Jun
Jul
Aug
Sep
Oct
Nov
Dec
2021
8
20
15
17
13
20
9
7
2
6
11
12
2022
13
9
19
11
12
17
8
4
9
5
3
4
2023
3
5
11
5
8
9
7
8
18
5
2
6
Skjersaa Group | DukeWarner Realty | 541.383.1426 Statistics compiled by the Skjersaa Group from data owned and copyrighted by MLS. Information deemed reliable but not guaranteed.
50
3-YEAR REVIEW | MEDIAN PRICE BARE LAND/LOTS < ONE ACRE
Jan
Feb
Mar
Apr
May
Jun
Jul
Aug
Sep
Oct
Nov
Dec
2021 $317,500 $299,500 $349,000 $285,000 $264,000 $320,000 $325,000 $377,500 $432,500 $341,100 $424,000 $392,000 2022 $340,000 $299,000 $408,800 $340,000 $182,000 $290,000 $305,000 $230,000 $250,000 $400,400 $475,000 $470,000 2023 $250,000 $370,000 $399,600 $317,500 $359,950 $273,000 $392,000 $385,000 $435,000 $260,000 $297,500 $410,000
51
Skjersaa Group | DukeWarner Realty | 541.383.1426 Statistics compiled by the Skjersaa Group from data owned and copyrighted by MLS. Information deemed reliable but not guaranteed.
BARE RESIDENTIAL ACREAGE # of Sales
2013
2014
2015
2016
2017
2018
2019
2020
2021
2022
2023
86
79
90
100
82
90
65
115
102
45
42
MEDIAN SALES PRICE
NUMBER OF SALES
Median List $197,000 $200,000 $204,750 $294,000 $299,975 $300,000 $299,000 $469,000 $677,000 $675,000 $682,000 Price Median $176,500 $200,000 $195,000 $281,950 $297,450 $293,250 $280,000 $450,000 $673,194 $675,000 $644,500 Sales Price % Change 0.86% 13.31% -2.50% 44.59% 5.50% -1.41% -4.52% 60.71% 49.60% 0.27% -4.52% vs Prior Yr Highest $625,000 $625,000 $989,000 $907,000 $1,800,000 $4,000,000 $2,170,000 $1,400,000 $1,620,000 $2,100,000 $2,275,000 Sales Price Avg Days on 202 216 142 108 82 164 233 221 214 150 212 Market
Skjersaa Group | DukeWarner Realty | 541.383.1426 Statistics compiled by the Skjersaa Group from data owned and copyrighted by MLS. Information deemed reliable but not guaranteed.
52
BARE RESIDENTIAL ACREAGE 2023
97701
97702
97703
2022
97701
97702
97703
# of Sales
6
4
32
# of Sales
9
8
28
Median List $300,000 $499,450 $829,000 Price Median $270,000 $499,500 $829,000 Sales Price % Change -56.63% -2.54% 18.60% vs 2021 Highest $970,125 $1,470,000 $2,100,000 Sales Price Avg Days on 183 43 61 Market
PERCENT CHANGE VS ALL AREAS
MEDIAN SALES PRICE VS ALL AREAS
Median List $550,000 $487,000 $785,000 Price Median $550,000 $475,000 $751,250 Sales Price % Change 103.7% -4.90% -9.38% vs 2022 Highest $677,625 $1,850,000 $2,275,000 Sales Price Avg Days on 130 105 178 Market
ZIP CODE
53
ALL AREAS Skjersaa Group | DukeWarner Realty | 541.383.1426
Statistics compiled by the Skjersaa Group from data owned and copyrighted by MLS. Information deemed reliable but not guaranteed.
MULTI-FAMILY RESIDENTIAL # of Sales
2013
2014
2015
2016
2017
2018
2019
2020
2021
2022
2023
77
72
66
79
69
59
50
50
70
49
38
MEDIAN SALES PRICE
NUMBER OF SALES
Median List $319,900 $336,023 $324,900 $399,000 $439,000 $519,000 $481,450 $497,000 $667,500 $787,500 $849,950 Price Median $298,375 $287,900 $319,950 $395,000 $430,000 $519,000 $477,750 $498,500 $683,250 $761,070 $849,000 Sales Price % Change 29.64% -3.51% 11.13% 23.46% 8.86% 20.70% -7.95% 4.34% 37.06% 11.39% 11.55% vs Prior Yr Highest $2,800,000 $2,220,000 $20,875,000 $2,399,000 $2,150,000 $7,340,000 $979,000 $1,035,000 $1,900,000 $2,450,000 $4,250,000 Sales Price Avg Days on 115 125 124 97 75 89 73 40 22 31 38 Market
Skjersaa Group | DukeWarner Realty | 541.383.1426 Statistics compiled by the Skjersaa Group from data owned and copyrighted by MLS. Information deemed reliable but not guaranteed.
54
MULTI-FAMILY RESIDENTIAL 2023
97701
97702
97703
2022
97701
97702
97703
# of Sales
16
16
6
# of Sales
20
22
7
Median List $797,000 $746,950 $1,399,900 Price Median $738,000 $746,950 $1,400,000 Sales Price % Change 11.82% 21.46% 7.08% vs 2021 Highest $1,625,000 $1,599,000 $2,450,000 Sales Price Avg Days on 16 41 41 Market
PERCENT CHANGE VS ALL AREAS
MEDIAN SALES PRICE VS ALL AREAS
Median List $814,940 $847,000 $1,372,500 Price Median $782,500 $848,630 $1,271,625 Sales Price % Change 6.03% 13.61% -9.17% vs 2022 Highest $1,275,000 $4,250,000 $3,900,000 Sales Price Avg Days on 39 29 58 Market
ZIP CODE
55
ALL AREAS Skjersaa Group | DukeWarner Realty | 541.383.1426
Statistics compiled by the Skjersaa Group from data owned and copyrighted by MLS. Information deemed reliable but not guaranteed.
Skjersaa Group | DukeWarner Realty 1033 NW Newport Ave, Bend, OR 97703
Skjersaa Group | DukeWarner Realty | 541.383.1426
|
|
541.383.1426
541.382.8262
|
www.SkjersaaGroup.com
56