Bartlett School of Architecture, UCL


Developing an analogue apparatus that exhibits physical change to improve the transparency and communication of a building’s flooding history, allowing residents to selfassess a building’s flood risk by recording the number of events it has endured.
Ben Smallwood
SN: 22185286
Bartlett School of Architecture, UCL
MArch Architecture
BARC0011
Advanced Architectural Thesis 2023/2024
Thesis Supervisor: Hector Altamirano
Design Tutors: Yeoryia Manolopoulou
Nasios Varnavas
Tamsin Hanke
Module Co-Ordinators: Oliver Wilton
Robin Wilson
Word count: 9,764

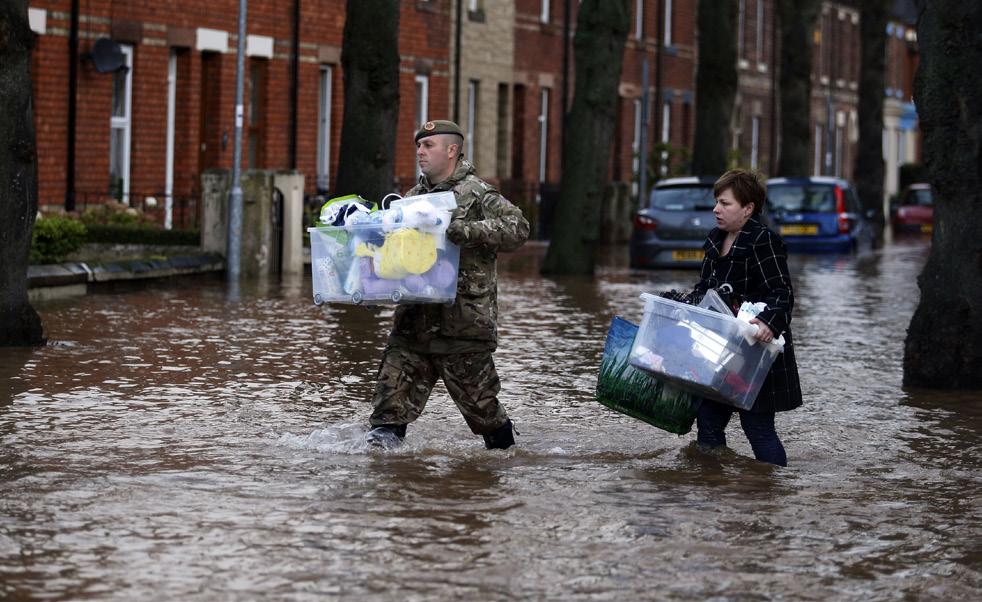
“Flooding is an extremely traumatic event which has a devastating impact on a person’s life, both physically and mentally.” 1
| Martin Millner, GI Claims Director, LV=
Climate change caused by the human species is severely threatening our natural environment. These overwhelming forces cause visible and measurable change within individual organisms and broader landscapes.
Nature keeps its own analogue records of climate change. Tree rings reflect precipitation changes, while the strata of ice caps show atmospheric pollution and rising temperatures.
To understand the possibility of this proposition, this research experiments with materials that manifest a physical reaction to flooding. Flooding is synonymous with climate change and a catastrophic event deserving of a comprehensive record to inform the most at-risk residents.
The outcome is an accessible and lasting tool that enables people to self-assess the risk of flooding without relying on expensive or fragile electronics or mechanical apparatus with short lifespans. This aids in the preparation and implementation of procedures to reduce post-traumatic issues.

Analogue:
Analogue technology involves measuring, storing, or recording an infinitely variable amount of information by using physical quantities such as voltage. 2
Flood Risk Assessments (FRA’s):
The planning industry uses FRAs to determine if a new development is sustainable concerning flood risk.3
As defined by Herefordshire Council, an FRA must “demonstrate that the development will be safe over its lifetime, including the impacts of climate change, and will not act to increase flood risk elsewhere.”4
Flood Re Insurance Scheme:
An agreement between the government and insurers to cover homes at severe risk of flooding.5
Anthocyanin
The chemical found in red cabbage that gives it its colour and naturally changes depending on PH.6 2
5
3
Abstract
Glossary
Contents
Introduction (1135)
Methodology
Flooding in detail (1750)
Prototype Design (1705)
Precedents of change
Creating change (4,099)
Objectives for testing
Design Rationale for the Prototype Testing
Apparatus
Method
General testing & analysis
Detailed Testing Sample 03
Detailed Testing Sample 07
Conclusion & further work (739)
Notifier & manual (336)
Bibliography
Table of Figures
Appendices
Experiment result
Contact sheets
Rebecca Watson Interview
Joel
Andrew Fall Interview
The research question’s motivation began with a fascination with how the climate impacts our supposedly indestructible built environment. Our built environments are stained by leachates from pollution, painted with efflorescence seeping up through walls, and infested with plants and algae growing within the cracks of our flush and geometric constructs. These stains have become both consequences and measures of the conditions of our surrounding climate.
Flooding, however, is potentially the most evident. It is the most common natural disaster, estimated to have affected over two billion people globally between 1998 and 2017.7 These direct and indirect effects impact our physical and mental health and are economically costly, as they cause damage and disruption to vital infrastructure.
As climate change worsens and the population grows, the number of those impacted is expected to increase, making this research appropriate to the current situation. The warming atmosphere increases the capacity of water held in the air and, therefore, the potential intensity of storms, likely making them longer-lived and swell in size.8
In 2015, this greater intensity was witnessed through Storm Desmond, which broke national rainfall records. Cumbria endured an unparalleled 341 millimetres within twentyfour hours. To put this into perspective, the average rainfall in December since 1998 is 4.2mm per day across the UK. In December 2015, it rose by 40%, with a rainfall of 7mm per day.9 Research by Oxford University and the Royal Meteorological Institute predicted climate change will make devastating weather events such as this 59% more likely.10
Within England, one in six properties is at direct risk of flooding, while four in six households are at risk of indirect impact from disruption of vital infrastructure, including schools, hospitals, and service plants.11 Based on the number of flood alerts and warnings received over the past five years, the most likely areas to be affected include the West Midlands, Wessex, and Yorkshire.
7 Jane Bracher, ‘This Is How Flooding Can
https://wellcome.org/news/how-flooding-can-impact-ourhealth.
8 Anon, ‘13. How Does Climate Change Affect the Strength and Frequency of Floods, Droughts, Hurricanes, and Tornadoes?’, Royal Society, March 2020, accessed 18 March 2024, https://royalsociety.org/topics-policy/projects/climate-change-evidence-causes/ question-13/#:~:text=A%20warming%20atmosphere%20is%20also.
9 Met Office, ‘Monthly, Seasonal and Annual Total Precipitation Amount for UK’, Metoffice (Met Office National Climate Information Centre, 1 April 2024), accessed 17 April 2024, https://www.metoffice.gov.uk/pub/data/weather/uk/climate/datasets/Rainfall/date/UK.txt.
10 Richard Black, ‘Flood Risk and the UK’, Energy & Climate Intelligence Unit, 11 February 2022, accessed 4 March 2024, https://eciu.net/analysis/briefings/climate-impacts/floodrisk-and-the-uk.
11 Sir James Bevan, ‘Defusing the “Weather Bomb”: The Future of Flood Defence’, editorial, Gov.uk, 25 February 2020, accessed 26 February 2024, https://www.gov.uk/government/ speeches/defusing-the-weather-bomb-the-future-of-flood-defence.
Flooding causes “the highest death rate among natural disasters”12 but, more commonly, results in health repercussions ranging from physical injuries, infections, and illnesses13 to lesser-acknowledged mental health impacts. Research funded by the Department for the Environment in 2006 found that flood victims were between 4 and 8.7 times more likely to suffer long-term mental health issues. According to the study, insufficient warning significantly contributed to the high score,14 suggesting that improving an individual’s ability to prepare and increasing awareness of their flood risk will help reduce lasting post-event trauma.
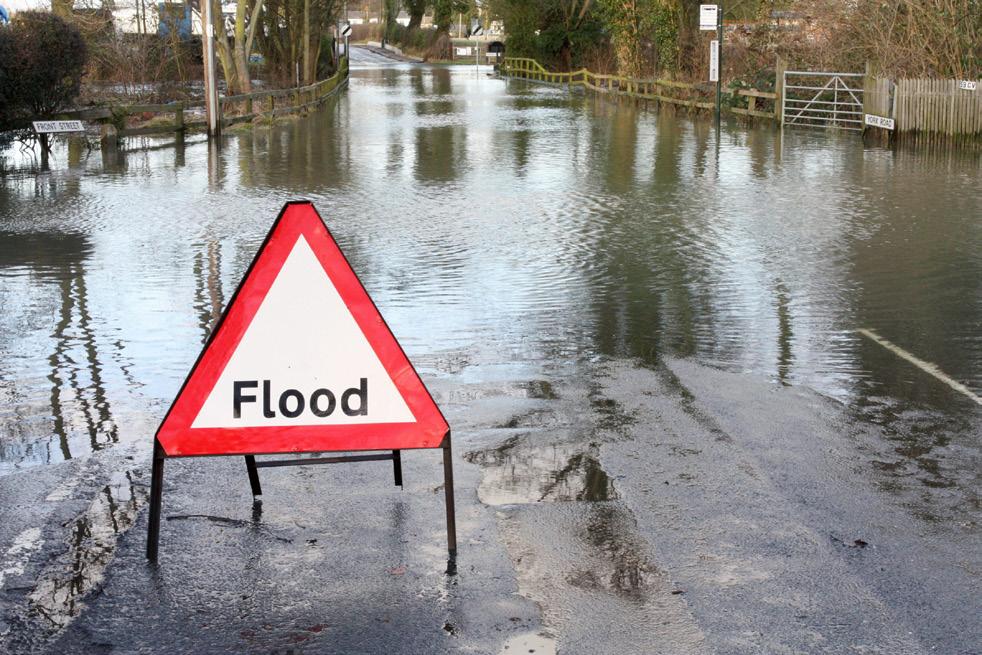
Professor of Hydrology at the University of Reading, Hannah Cloke, suggests we should be improving the public’s awareness of their properties’ flood risk in the same way as earthquake risk by using signage and educating the public on how to stay safe.15 Therefore, the proposed research question aims to develop a method of recording a building’s number of flood events, helping everyone to “know their flood risk,”16 as Sir James Bevan, Chief Executive of the EA, suggests. Allowing people to easily understand and take responsibility for their properties’ risk of flooding can help prevent any consequential and potentially unnecessary dangers and improve the mental health conditions of those living in areas at risk of flooding by giving them the tools to become fully aware of their situation.
Therefore, this research questions how we develop a method to improve the transparency and communication of a building’s risk of flooding?
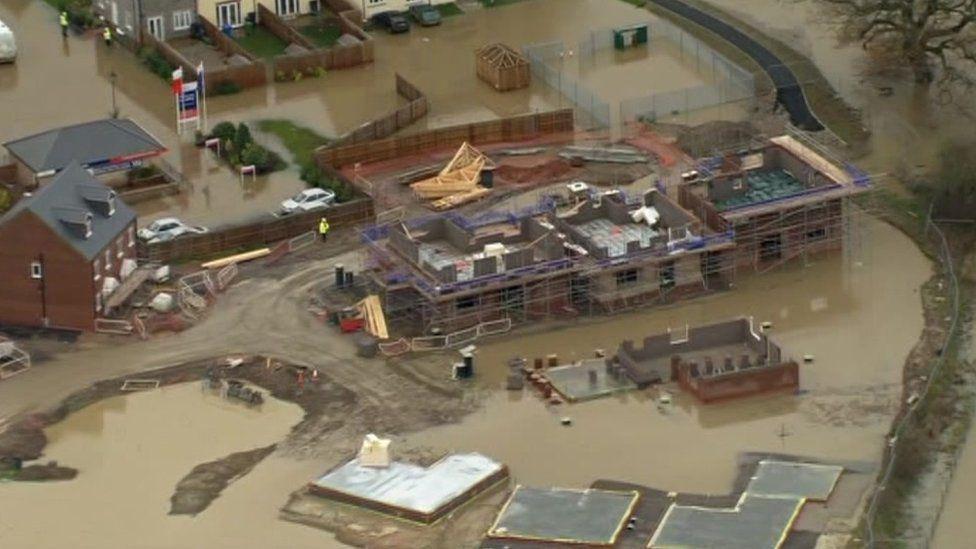
The project’s ambition is to create a product that could be installed at properties across the UK. It would record any flooding in anticipation of a property being sold, providing the buyer or insurance provider with concrete evidence of a property’s individual risk of flooding. This could lead to more informed decisions, better risk management, and ultimately, a safer and more resilient built environment.
This research project supports the Design Studio Portfolio by investigating the overarching research questions regarding how natural forces impact the built landscape and how architecture, itself a product of human intervention, could serve as an instrument for recording and notifying climate change.


12 Arezoo Yari et al., ‘Risk Factors of Death from Flood: Findings of a Systematic Review’, Journal of Environmental Health Science and Engineering 18, no. 2 (24 July 2020): 1643–53, accessed 19 March 2024, doi:https://doi.org/10.1007/s40201-020-00511-x.
13 BBC Wales, ‘Storm Dennis: How Dangerous Is Floodwater?’, editorial, BBC News, 18 February 2020, sec. Wales, accessed 19 March 2024, https://www.bbc.co.uk/news/ukwales-51537884.
14 Joana Cruz et al., ‘Effect of Extreme Weather Events on Mental Health: A Narrative Synthesis and Meta-Analysis for the UK’, International Journal of Environmental Research and Public Health, 17, no. 22 (1 November 2020): 8581, accessed 19 March 2024, doi:https:// doi.org/10.3390/ijerph17228581.
15 Hannah Cloke, ‘Housebuilding Ban on Floodplains Isn’t Enough – Flood-Prone Communities Should Take Back Control’, The Conversation, 27 February 2020, accessed 26 February 2024, https://theconversation.com/housebuilding-ban-on-floodplains-isntenough-flood-prone-communities-should-take-back-control-132468.
16 Bevan, “Defusing the “Weather Bomb”: The Future of Flood Defence.”
This thesis investigates the research question in six parts. Firstly, discussing the UK’s context of flooding by analysing quantitative and qualitative information collected through statistics and views of industry professionals and people affected by flooding. In this analysis, a mixed methods approach is explored to conduct literature reviews and interdisciplinary analysis of journals such as The International Journal of Environmental Research and Public Health and recent news articles from the Guardian and the BBC to discuss the broader political and climatic situation and the controversial topic of developers building in active flood plains. This section culminates with the initial scope for The Notifier, stating the timeliness of the research towards current climate events and the need for a universal tool to improve the transparency and communication of a building’s predisposition to the risk of flooding.
The second section discusses the design research for The Notifier prototype. The first half of part two uses case study analysis of people’s experiences with flooding to develop the concept of a prototype which can improve the transparency of communication towards flooding. The concept is developed through primary source collection via organised interviews with professionals who work in the built environment and have experience with flooding. The interviewees selected for the research include Joel Day, a Lead Architect at Anderson Orr Architects who has recently completed a residential project within a functional floodplain; Andrew Fall, a Claims Specialist at LV= insurance; and Rebecca Watson, the General Manager of Charlecote Park, a National Trust Property, which has experienced five flood events in 2024 to date. The interviewees’ accounts enabled the understanding of how flooding affects people and the likely experiences and procedures victims may encounter before, during, and after the flood. This aided in the formation of objectives in part 3 of the testing of a method to help reduce consequential post-traumatic effects. The second half of part 2 highlights case studies of existing analogue recording methods to understand how the prototype would function to notify.
Part 3 identifies the objectives for the prototype’s scope, defined in Part 1, and its design, which responds to the interviewee’s responses and case studies of Part 2. The following sections of Part 3 outline the design of the tests, including the method and apparatus selected.
Part 4 describes and analyses the prototype testing, using descriptive, observational, and photographic analysis to describe the tests and outcomes. From a matrix of tests conducted, the two most successful tests were deemed by the objectives outlined in part 3.
Part 5 evaluates the outcomes of the tests and the success of the prototype. Crucially, it outlines the constraints faced during the testing phase. However, it also presents a proof of concept, opening the possibility of further development and distribution of The Notifier.
Part 6 recognises the Notifier in the real-world context, explains its application and outlines a user manual for the analogue device.
Human activities, including burning fossil fuels, have emitted increasing levels of CO2 since the beginning of the Industrial Revolution in 1850. These greenhouse gases trap heat within the Earth’s atmosphere, causing global temperatures to rise.17 Land-Ocean Temperature Index records from NASA span from 1880 to the present day and show an increase of 1.36oC from the preindustrial average.18 Already, floods comprise 43% of natural disasters,19 but as this warmer atmosphere “increases [...] the air’s capacity to hold moisture,” increasing rainfall. This is affecting new areas, with possibly larger, more frequent, and longerlived storms20 causing inland flooding. 21 This was put into perspective later by data published in 2024 by the Environment Agency (EA), painting a stark picture that the total flood alerts issued in England have become 2.9 times more common since 2006. 22 Underscored by Professor Bentley, Chief Executive of the Royal Meteorological Society, explains that what was considered a one-in-100year storm has become a one-in-5-year occurrence, and “that frequency will probably continue to increase”23 going forward. This correlation means floods are not only a consequence of climate change but are also a notifier of the worsening atmospheric conditions.
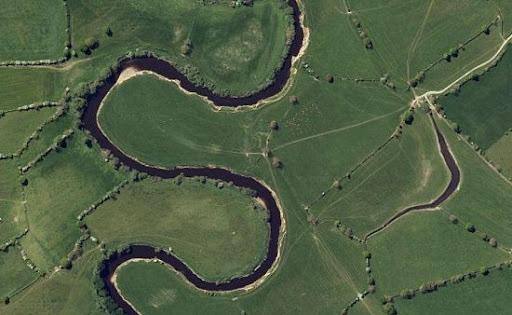
Flooding is not an unnatural occurrence but has become more damaging due to humans’ intervention in the landscape. Waterways typically meandered, (Figure 05) having longer lengths and, therefore, surface area, for the water to slow and absorb into the flood plains, often agricultural fields. However, many rivers have historically been dredged and “straightened to improve navigability”24 and to “hurry rainwater off fields”25 (Figure 06) to reduce disruption to farming. 26 This water then quickly reaches urban areas in high quantities and volumes, where the confined drainage systems become overwhelmed and spill out above the street level, impacting buildings and people. 27
17 Anon, ‘How Do We Know Climate Change Is Happening?’, Imperial College London (Grantham Institute – Climate Change and the Environment), accessed 1 April 2024, https:// www.imperial.ac.uk/grantham/publications/climate-change-faqs/how-do-we-knowclimate-change-is-happening/#:~:text=Human%20activities%20have%20emitted%20 increasing.
18 NASA, ‘Global Surface Temperature | NASA Global Climate Change’, NASA (NASA’s Goddard Institute for Space Studies (GISS), 2023), accessed 2 April 2024, https://climate. nasa.gov/vital-signs/global-temperature/?intent=121.
19 Melissa Davey, ed., ‘Floods Linked to Increased Deaths from Heart and Lung Disease, Australian-Led Research Shows’, editorial, The Guardian, 4 October 2023, sec. Australia news, accessed 4 April 2024, https://www.theguardian.com/australia-news/2023/oct/05/ floods-linked-to-increased-deaths-from-heart-and-lung-disease-australian-led-researchshows.
20 Anon, “13. How Does Climate Change Affect the Strength and Frequency of Floods, Droughts, Hurricanes, and Tornadoes?”.
21 BBC, ‘Storm Franklin: How Do Flood Prevention Schemes Work?’, editorial, BBC News, 22 February 2022, accessed, 4 March 2024, https://www.bbc.co.uk/news/uk-25929644.
22 Environment Agency, ‘Historic Flood Warnings’, Gov.uk (Environment Agency, 5 April 2024), accessed April 2024, https://www.data.gov.uk/dataset/d4fb2591-f4dd-4e7f-9aaf49af94437b36/historic-flood-warnings.
23 BBC Wales, ‘Flooding: Storm Dennis Is “a Taste of Things to Come” for Wales’, editorial, BBC News, 2 March 2020, sec. Wales, accessed4 April 2024https://www.bbc.co.uk/news/ uk-wales-51631480.
24 Katie Grant, ‘10 Measures That Must Be Taken to Prevent More Flooding in the Future’, The Independent, 29 December 2015, accessed 31 March 2024, https://www.independent. co.uk/climate-change/news/10-measures-that-must-be-taken-to-prevent-more-floodingin-the-future-a6788866.html.
25 BBC, ‘Farmers Urged by WWF to Do More to Prevent Flooding’, editorial, BBC News, 29 January 2014, sec. Science & Environment, accessed 4 April 2024, https://www.bbc.co.uk/ news/science-environment-25931847.
26 Bracher, “This Is How Flooding Can Impact Our Health”. 27 BBC, “Storm Franklin: How Do Flood Prevention Schemes Work?”
Over time, these urban areas have been sprawling into green spaces and, crucially, floodplains. According to data from the EA, “nearly 20% of properties across the country are at risk of flooding, with 2.4 million buildings actually standing on floodplains.”28 The UK has a specific system of categorising land based on its flood risk. Zone 1 is the lowest risk, whilst 3 has the highest probability (1 in 100 chance or greater). The latter has a subset, where 3B is defined as a functional flood plain. 29 These designations play a vital role in conveying risk and informing the planning of the land. Paragraph 165 of The National Planning Policy Framework firmly states:
“Inappropriate development in areas at risk of flooding should be avoided by directing development away from areas at highest risk (whether existing or future). Where development is necessary in such areas, the development should be made safe for its lifetime without increasing flood risk elsewhere.”30
This message has been consistently in planning policy since at least 2012.31 Despite this, an analysis by Aviva, the UK’s largest home insurer, has found that in the last decade (since 2013/14), at least 109,017 homes have been built in flood zone 3. This equates to 1 in 13 new homes built in England32 following the coalition government’s relaxing of specific flood risk-related planning rules in 2011.33 Similar research by LV= and independent think tank Localis, published in 2021, found that planning applications for 5,283 new homes on flood plains in England had been granted permission in just the first ten months of that year. Of this data, “In the top five local authorities for flood risk, 31% of approved planning permissions for new residential buildings on floodplains did not come with a [mandatory] Flood Risk Assessment.”34 According to an Environment Department (Defra) survey, over half of local planning authorities rarely or never check whether a new development complies with flood risk measures.35

28 Millner, “Plans to Build over 5000 New Homes in Areas with High Flood Risk Approved”.
29 Sally Dray, ‘Housing Developments on Functional Flood Plains’ (Lords Library, 21 June 2021), accessed 26 February 2024, https://lordslibrary.parliament.uk/housingdevelopments-on-functional-flood-plains/.
30 Department for Levelling Up, Housing and Communities National Planning Policy Framework Gov.uk (Department for Levelling Up, Housing and Communities 20 December 2023), accessed 4 April 2024, https://www.gov.uk/government/publications/ national-planning-policy-framework--2.
31 Department for Communities and Local Government, National Planning Policy Framework, The National Archives (Department for Communities and Local Government, 27 March 2012), accessed 5 April 2024, https://webarchive.nationalarchives.gov.uk/ ukgwa/20180608095821/https://www.gov.uk/government/publications/national-planningpolicy-framework--2.
32 Liz Kennett, ‘One in Thirteen New Homes Built in Flood Zone’ (Aviva, 17 January 2024), accessed 26 February 2024, https://www.aviva.com/newsroom/news-releases/2024/01/ one-in-thirteen-new-homes-built-in-flood-zone/.
33 David Crichton, Flood Plain Speaking, 3rd ed. (2012; repr., Chartered Insurance Institute, 2012), 11, accessed 5 April 2024, https://www.cii.co.uk/media/2233858/flood plain speaking 3rd ed.pdf.
34 Grace Newcombe, Plain dealing Building For Flood Resilience, Localis (Localis, 22 November 2021), accessed 5 April 2024, https://www.localis.org.uk/wp-content/ uploads/2021/11/042 Floodplains WebAWK.pdf.
35 Victoria Seabrook, ‘Flood Risk Increased with New Housing Built without Defences in Vulnerable Areas, MPs Warn’, Sky News, 17 January 2024, accessed 24 April 2024, https:// news.sky.com/story/flood-risk-increased-with-new-housing-built-without-defences-invulnerable-areas-mps-warn-13049616.
Taken from the same timescale (2006-2024) the LandOcean Temperature Index is a global measurement of global warming in oC. From the existing data set the measurement for 2024 is estimated
The upwards trend in the line of best fit shows the increasing regularity of flood alerts within the past 18 years. From approximately 8 to 16 alerts: days.
According to the data set from 2006 - 2024 the winter months between October and March receive the most flood alerts.
Top 10 worst affected areas in the UK by flooding based on number of flood alerts in the past 5 years.
A new system of flood warning designations were adopted in 2011 hence the data range included.
Opportunity Area, SHLAA, Site Allocations, Housing Zones.
London Flood zones
Already, findings from Aviva have uncovered that one in eight new-build residents say their home has been flooded internally, “crucially, these homes are not covered by the Flood Re Insurance scheme,”36 a governmentaided initiative to cover existing houses in flood zones constructed before 2009, subjecting them to further consequential costs and financial stress. Not only does building in high-risk areas put new-build residents at risk, but existing residents in surrounding areas are made more vulnerable. Overlooking the need for accurate FRAs puts pressure on existing properties’ drainage systems37 and directs water further away from flood plains, now with reduced absorption capacity due to development.
Ms. Howard Boyd, previous chair of the EA, warned that this trend is expected to continue, predicting that properties built on floodplains will double over the next 50 years.38 Reinforced by the 2017 Climate Change Risk Assessment published by the Climate Change Committee, the UK’s independent advisor on tackling climate change, by the 2050s, the UK population living in areas at a greater risk than 1 in 75 chance of flooding (flood zone 3) is expected to rise to 2.6 million, where the Earth’s temperature rises by 2°C, or 3.3 million under a 4°C scenario.39
A 2020 Speech by Bevan at the World Water-Tech Innovation Summit claimed that it is unrealistic to “ban all development in the flood plain: it is where most of our towns and cities are, and because our country has so many rivers much of England is a flood plain.”40 Regardless of constraints and pressures, the council, government and developers must ensure that workarounds are not being taken when considering people’s safety against floods. MP Anne Marie Morris from Devon, however, explained the “desperate rush to ensure that housing targets are met” meant that “land which shouldn’t be used” is being built on with “workarounds.”41 Urban planner Benoit Moritz stresses the responsibility of those who define how land is developed, that if they “don’t take care ... there are people who can die from our mistakes.”42
36 Kennett, “One in Thirteen New Homes Built in Flood Zone”.
37 LV, ‘How Can You Protect Your Home from Flooding?’, LV, 8 November 2023, accessed 26 February 2024, https://www.lv.com/home-insurance/how-to-protect-your-home-andprepare-for-flooding.
38 BBC, ‘Climate Change: England Flood Planners “Must Prepare for Worst”’, editorial, BBC News, 9 May 2019, sec. Science & Environment, accessed 4 March 2024, https://www.bbc. co.uk/news/science-environment-48206325.
39 Jon Ayres et al., UK Climate Change Risk Assessment 2017: Evidence Report Chapter 5: People and the built environment, Climate Change Committee (London: Climate Change Committee, 2016), accessed 4 March 2024, https://www.theccc.org.uk/wp-content/ uploads/2016/07/UK-CCRA-2017-Chapter-5-People-and-the-built-environment.pdf.
40 Bevan, “Defusing the “Weather Bomb”: The Future of Flood Defence.”
41 Seabrook, “Flood Risk Increased with New Housing Built without Defences in Vulnerable Areas, MPs Warn”.
42 Joanna Gill, ‘Belgium: Floods Haunt Town as Rebuild Seeks to Stop Repeat Disaster | PreventionWeb’, Preventionweb, 11 July 2022, accessed 5 April 2024, https://www. preventionweb.net/news/floods-haunt-belgian-town-rebuild-seeks-stop-repeat-disaster.
The EA claimed that, between 2017 and 2018, 99.4% of planning applications involving new homes were decided following its advice on flood risk. It clarified that if newbuild properties constructed according to their guidance are being flooded, then their guidance is insufficient in protecting people.
The consequences of flooding can be felt through both direct and indirect impacts on physical and mental health, personal and national financial burden, and damage to physical possessions, surroundings and infrastructure. In 2005, Jonkman and Kelman estimated that between 1975 and 2001, flooding affected 2.2 billion people worldwide.43 In England, this is a majority of people, with over two-thirds of people directly or indirectly affected by flooding.44
Apart from the obvious safety concerns that floods inflict, the mental toll on householders is heavy. In 2021, amongst some of the worst flooding in Western Europe, public health advice issued by the Centre for Disaster Philanthropy highlighted mental health as a top priority for those affected.45 Flood victims in the UK were found to be up to 8.7 times more at risk of long-term mental health problems,46 including “anxiety, depression, post-traumatic stress disorder or PTSD, psychosis and insomnia,”47 with a quarter of people flooded still living with these issues at least two years later.48 According to The English National Study of Flooding and Health published by Public Health England, people who received no warning before flooding “were significantly more likely to report symptoms of probable depression and PTSD.”49 This suggests that information and data can help people properly prepare for the flood and its aftermath and allow them to recover better mentally.
Crucially, the Flood Re scheme cut-off was in 2009 to prevent new housing developments in areas at risk of flooding.50 Therefore, new-build residents living within these high-risk areas “are finding it virtually impossible to get household insurance.”51 As shown earlier in this research, this situation is predicted only to worsen. These impacts will mainly be felt by low-income households who struggle “to meet typical insurable losses, with 73% unable to meet an unexpected bill of £500 without help.52
43 Yari et al., “Risk Factors of Death from Flood: Findings of a Systematic Review”.
44 Bevan, “Defusing the “Weather Bomb”: The Future of Flood Defence.”
45 Tracy Rotton, ‘Western European Flooding’, Center for Disaster Philanthropy, 31 August 2021, accessed 5 April 2024, https://disasterphilanthropy.org/disasters/western-europeanflooding/./
46 Cruz et al., “Effect of Extreme Weather Events on Mental Health: A Narrative Synthesis and Meta-Analysis for the UK”.
47 Bracher, “This Is How Flooding Can Impact Our Health”.
48 Black, ‘Flood Risk and the UK’,
49 Isabel Oliver, The English National Study of Flooding and Health Summary of the evidence generated to date, Gov.uk (London: Public Health England March 2020), accessed 3 April 2024, https://assets.publishing.service.gov.uk/ media/5e6bb75fd3bf7f2695546ba8/Summary of findings NSFH January 2020 Final for DsPH 3 .pdf.
50 Millner, “Plans to Build over 5000 New Homes in Areas with High Flood Risk Approved”.
51 Matt Lloyd, ‘Flooding: Calls to Stop Building Homes on Flood Plains’, editorial, BBC News, 10 March 2020, accessed 31 March 2024, https://www.bbc.co.uk/news/uk-wales-51712267.
52 Environment Agency and Department for Environment, Food & Rural Affairs, ‘Prepare for Flooding to Reduce Impacts on Mental Health’, GOV.UK, 21 January 2020, accessed 4 March 2024, https://www.gov.uk/government/news/prepare-for-flooding-to-reduce-impacts-onmental-health.
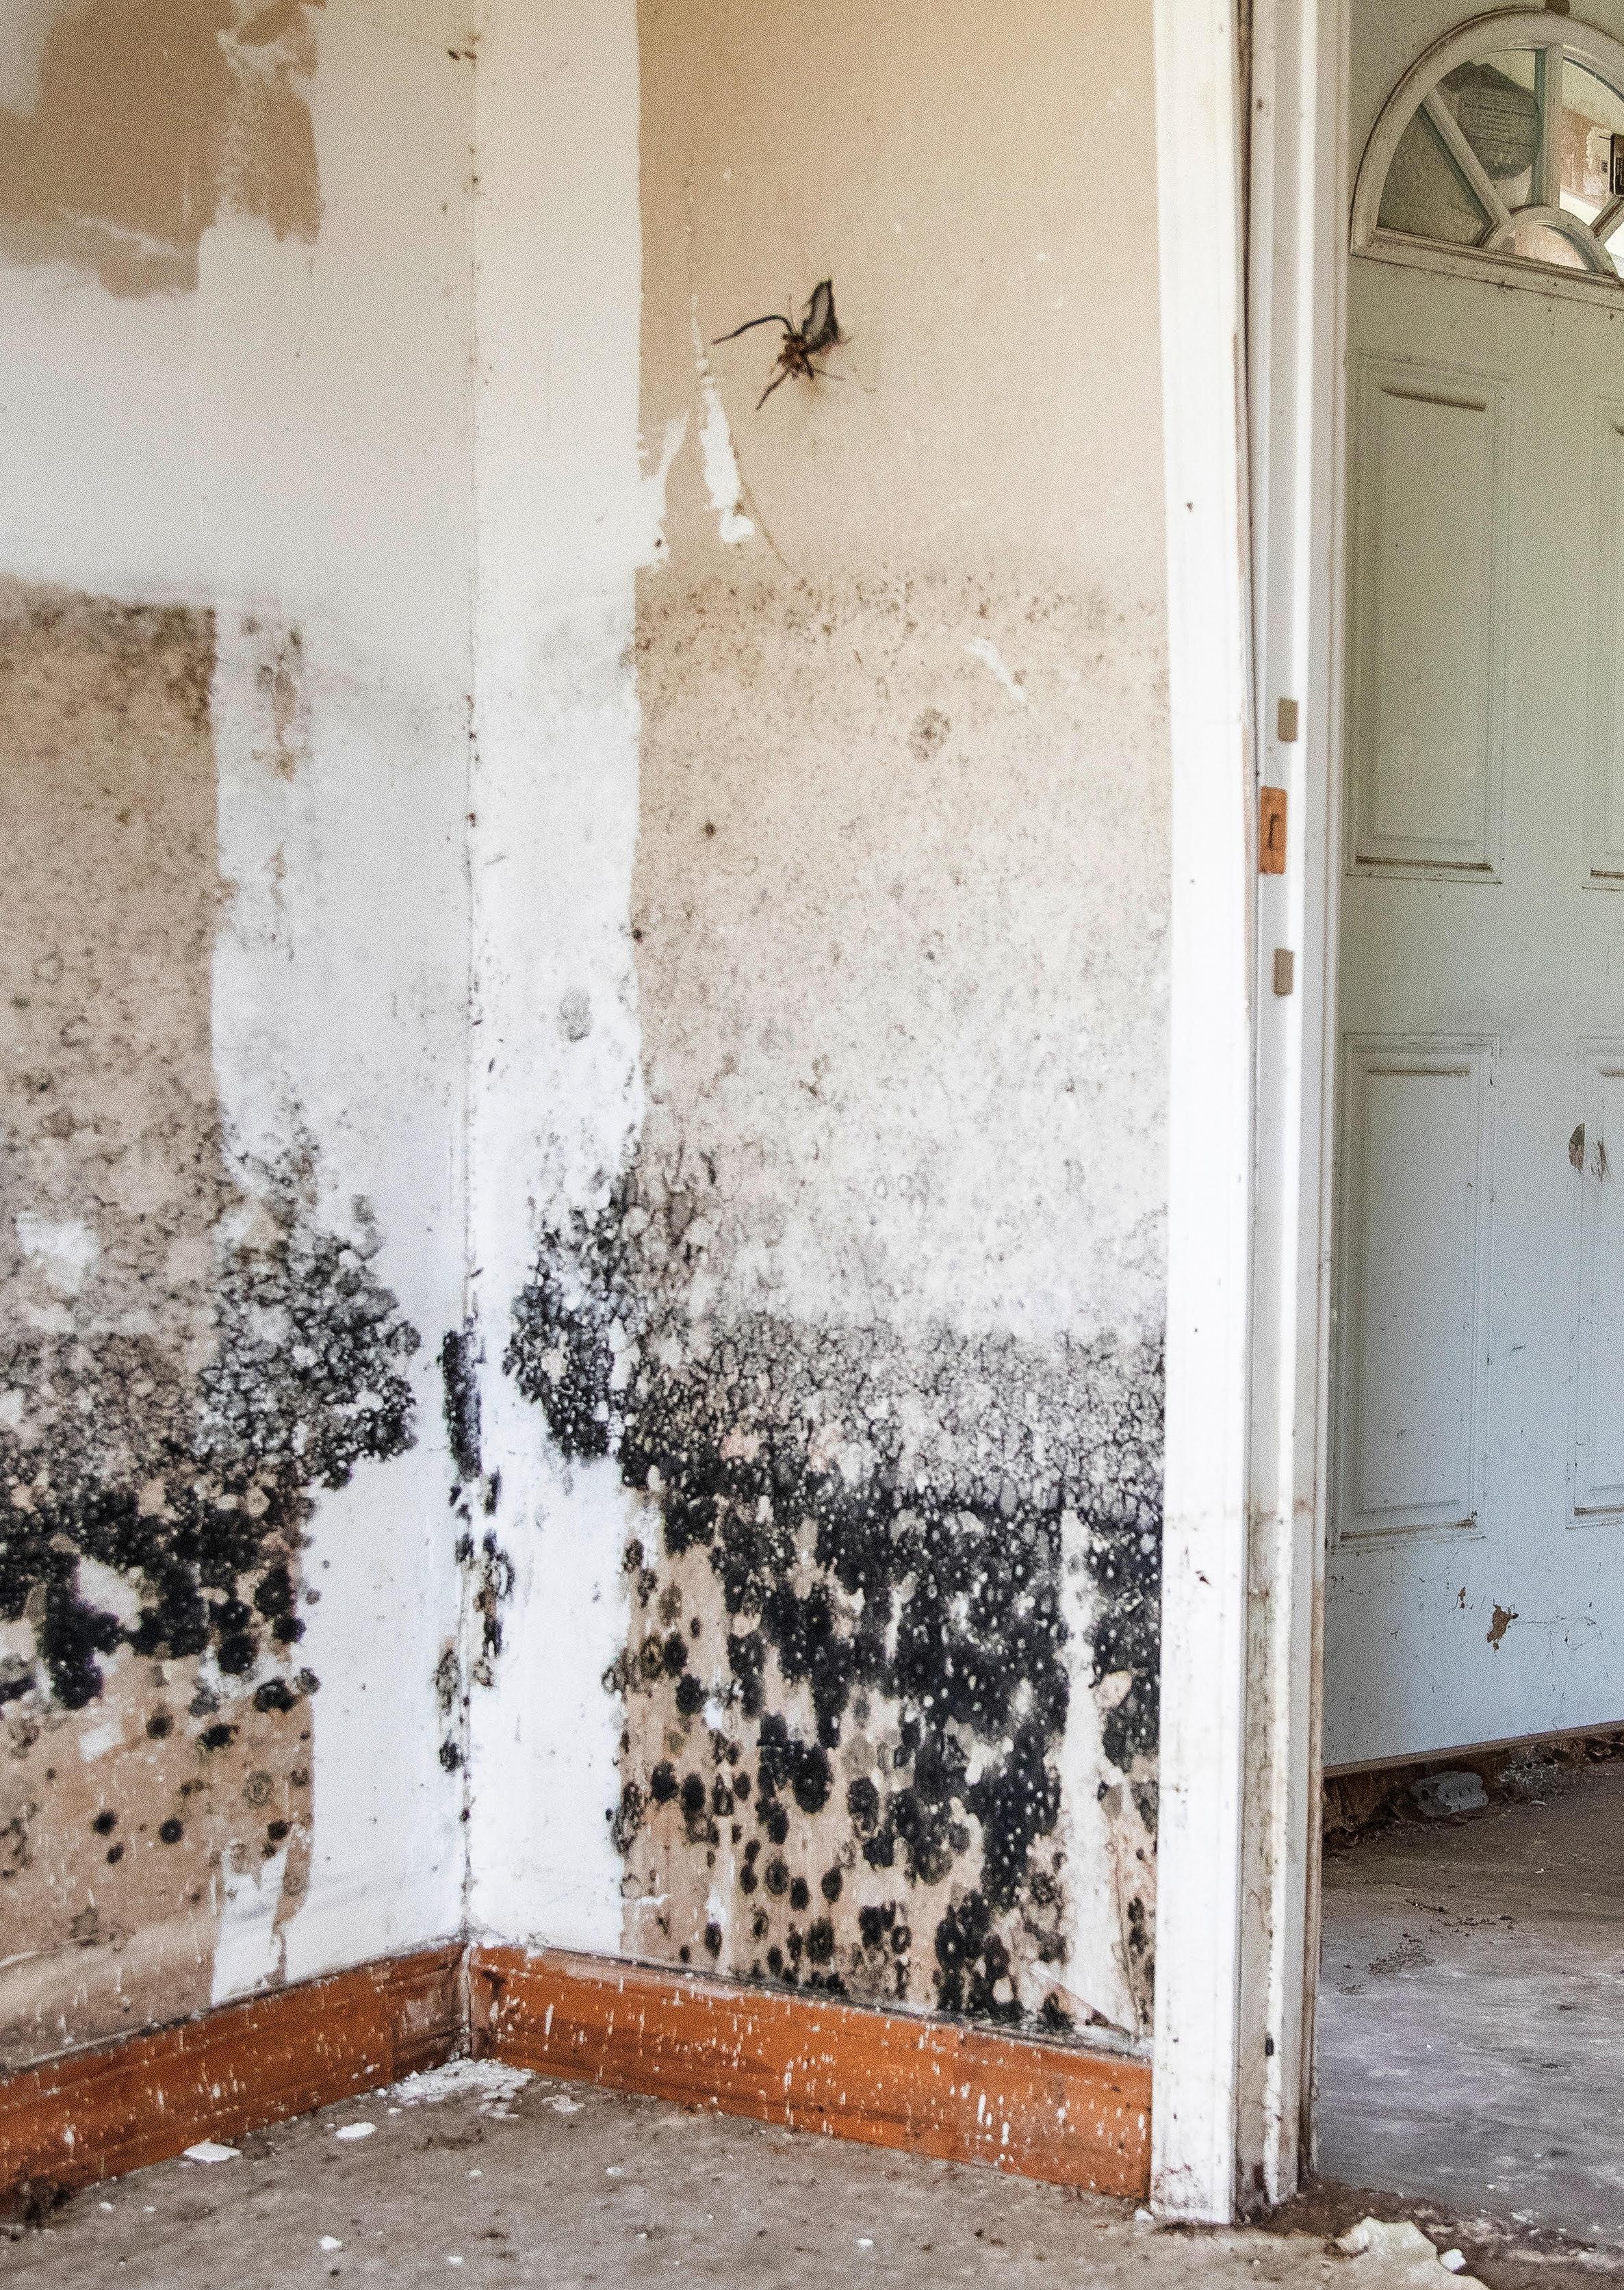
These modern homes are designed to become increasingly more sealed, intended to keep water out. However, with the increasing regularity of floods, in the unfortunate event that water enters the home, buildings are now sitting in water for longer.53 According to the National Severe Storms Laboratory, flood waters can last “days, weeks or longer.”54 These prolonged damp environments promote the growth of mould,55 (Figure 15) and the saturation of materials can lead to weakened structural integrity and deterioration or erosion of elements, including stone, brick, and mortar. These effects often worsen during freezing or frost,56 or in coastal areas where saltwater crystalises when drying.57
With the known dangers and predicted worsening issues, what do affected people need to be protected next time it floods? Moritz explains that it is known that continuing to build higher flood defence walls “won’t solve the problem.”58 Therefore, a focused approach towards individual homes and communities may be a more realistic approach. In an ideal world, people’s homes would be built better and updated to accommodate this worsening climate. Using property flood resilience measures to reduce the amount of water entering the home,59 including elevating them,60 and adding external barriers.61 But realistically, these changes are often insufficient, inappropriate for the situation, or financially impossible for those affected. Therefore, Bevan suggests it “may be better for communities to choose to relocate out of harm’s way.”62 But where does he suggest people move to when, in the same 2020 speech, he explained that it was unrealistic to ban all development in flood plains due to a lack of alternative available and suitable land?
53 Lila Angelaka, ‘Engine Shed Guidance for Owners and Occupiers of Traditional Buildings’, Engine Shed, 30 September 2021, accessed 6 April 2024, https://blog. engineshed.scot/2021/09/30/storm-proof-your-historic-home/.
54 Anon, ‘Flood Basics’, NOAA National Severe Storms Laboratory, accessed 17 March 2024, https://www.nssl.noaa.gov/education/svrwx101/floods/#:~:text=Floods%20can%20 occur%20within%20minutes.
55 Alan James, ‘How Long Does It Take to Dry out Water Damage?’, Dantherm Group, 30 August 2023, accessed6 April 2024https://www.danthermgroup.com/en-gb/ aerial/how-long-does-it-take-to-dry-out-water-damage#:~:text=Increased%20 ventilation&text=Anything%20from%20opening%20windows%20in.
56 The Construction Centre, ‘Repairing Flood Damaged Property | Flood Advice’, The Construction Centre, accessed 6 April 2024, https://www.theconstructioncentre.co.uk/ flood-advice/repairing-flood-damaged-property.html#:~:text=Wet%20brickwork%20is%20 susceptible%20to.
57 Meaghan O’Neill, ‘In the Venice Floods, a Lesson in Protecting Heritage Places’, Architectural Digest, 19 November 2019, accessed6 April 2024https://www. architecturaldigest.com/story/venice-flood-implications.
58 Joanna Gill, ‘Belgium: Floods Haunt Town as Rebuild Seeks to Stop Repeat Disaster | PreventionWeb’, Preventionweb, 11 July 2022, accessed 5 April 2024, https://www. preventionweb.net/news/floods-haunt-belgian-town-rebuild-seeks-stop-repeat-disaster.
59 Historic England, ‘Protecting Your Home from Flooding and Flood Damage’, Historic England, 23 August 2023, accessed 24 April 2024, https://historicengland.org.uk/advice/ your-home/flooding-and-older-homes/being-prepared-for-flooding/.
60 Anon, ‘5 Tips for Designing a Home in a Flood Plain’, Integrata Architecture + Construction, 22 January 2020, accessed 6 April 2024, https://www.integrata-ac.com/ news/5-tips-for-designing-a-home-in-flood-plain.
61 Jeremy Williams, ‘Five Ways to Build a Flood Proof Home’, The Earthbound Report, 8 January 2016, accessed6 April 2024https://earthbound.report/2016/01/08/five-ways-tobuild-a-flood-proof-home/.
62 Bevan, “Defusing the “Weather Bomb”: The Future of Flood Defence.”
This disjointed advice is not uncommon, as seen with UK governments expressing their concerns at local authorities’ “willingness” to grant permission for residential development in areas at risk of flooding,63 whilst others, including Greenpeace’s Chief Scientist Doug Parr64 and Ms Bennett, the leader of the Green Party, believe that the onus is on the government themselves to take responsibility following “its disastrous environmental policy-making.”65 Ultimately, the blame passing and unwillingness to make an actual intervention in the mismanagement of high-risk flood areas means the responsibility has fallen to the individual homeowners to take responsibility for understanding their risk and making informed decisions to prepare for floods based on this knowledge.
Sadly, there is little in terms of property or communityspecific records that allow people to understand and, therefore, prepare for flood events if they are not already familiar with prior knowledge of the area or property. Therefore, to help residents navigate their properties’ individual risk, the prototype concept explores the development of a tool that increases people’s awareness of a properties risk of flooding in hopes of improving the transparency and communication of flood risk to people with no prior knowledge of their property, i.e. potential house buyers, or those who work in property management.
63 Matt Lloyd, ‘Flooding: Calls to Stop Building Homes on Flood Plains’, editorial, BBC News, 10 March 2020, accessed 31 March 2024, https://www.bbc.co.uk/news/ukwales-51712267.
64 Justin Rowlatt, ‘Thousands of Homes to Be Built in Flood Zones’, editorial, BBC News, 15 November 2019, accessed31 March 2024https://www.bbc.co.uk/news/scienceenvironment-50419925.
65 Grant, “10 Measures That Must Be Taken to Prevent More Flooding in the Future”.
This section discusses the design logistics and principles for the prototype—The Notifier—through interviews with Joel Day, Rebecca Watson, and Andrew Fall, who work with properties associated with flood risk or suffering from flooding.
CRITERIA 1: THE DEMAND FOR A RECORDING DEVICE THAT RECORDS FLOODING ON AN INDIVIDUAL PROPERTY SCALE THAT IS UNIVERSAL TO ALL PROPERTIES.
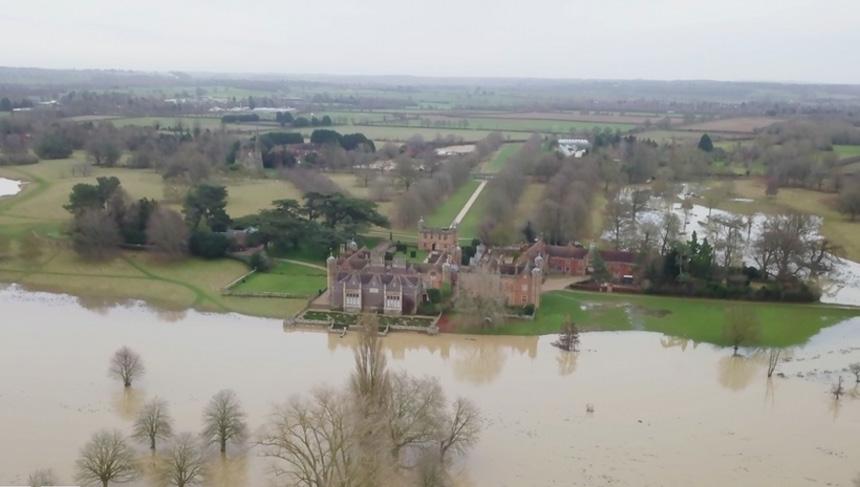
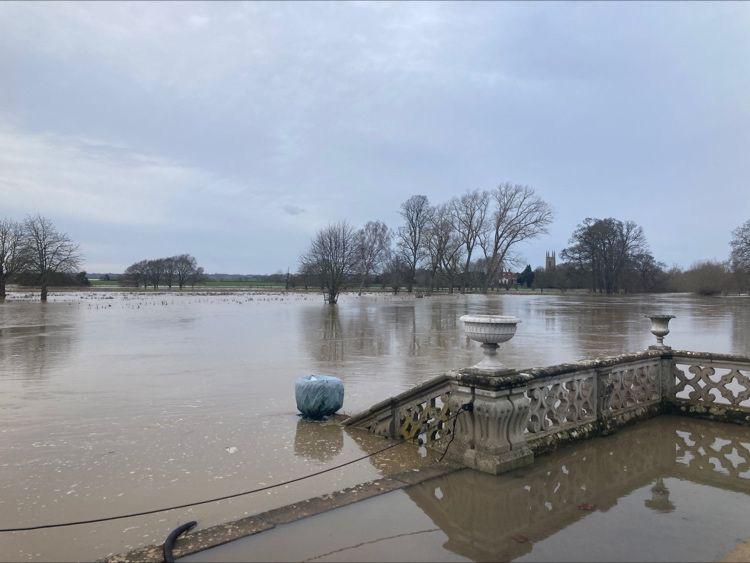
The research initially aimed to create a visible change, potentially notifying when a building had returned to dry, as discussed with Andrew Fall from LV insurance, or of incoming weather systems to give people an early warning of potential floods proven to significantly reduce postevent mental health problems in flood victims.66 However, from speaking to Day67 and Watson,68 two professionals who have had recent and direct interactions with floods, I understood that early warning systems reduce these mental health impacts by improving the ability to prepare. For them this would be best achieved through a more extensive data set for historical flood events on the site that would allow them to understand and self-assess risk and develop and prepare procedures for flood mitigation and the consequential fallout. Watson, the General Manager of Charlecote Park, a National Trust property, has experienced five flood events to date in 2024 and explained that she is compiling any data and information she can on any previous flood events at Charlecote Park. The information she hopes to accumulate from historical and future events would allow them to identify patterns in the sequences of events to plan any flood procedures better. This would hopefully reduce the stress of her team and damage to the site and be a vital tool in advocating for support or funding from organisations such as The EA and Historic England.
Watson explained that it became apparent there was a need for records and information to improve preparedness and resilience. In 2024, the year of this paper’s writing, the property was severely hit by several flood events. Watson, expressed that when she was handed over the property two years ago, she “certainly wasn’t told that [flood water in the basement] had ever come up higher than [wellington boot] height before”69 and, therefore, wouldn’t have installed the new heating system in the basement. With little in the way of historical flood records, Watson often uses the steps down to the riverside garden “rightly or wrongly” as a flood marker and relies heavily on the memory of her longest-serving member of staff, who started employment at the country mansion at sixteen in 1998. Therefore, when the mansion’s basement flooded deeper than anyone had ever seen, “there was no record of any kind of procedure.” The frustration at the lack of records or established procedures became clear from the conversation with Watson, explaining, “I didn’t realise that the thing that people before me wouldn’t have realised that actually, they needed to [keep records] to help a future person [in this position].”
Within this interview, an apparent element was the current use of an analogue method of measuring flood information through a set of steps as a marker (Figure 17) due to its consistency and reliability throughout the park’s lifetime. Therefore, an element that endures this longevity whilst retaining its function to record could be applicable in multiple scenarios, including informing potential stakeholders that may be impacted by the occurrence or absence of flooding in a specific property.
The team is now compiling records despite dealing with the ongoing and monotonous flooding of the park. The results they hope to gather include:
• Prior river condition
• Met Office warning or storm designation
• Start Date
• Duration
• Maximum height
• Severity
• Frequency
• Consequences, including the number of closure days
Equipped with this data, they aim to work with consultants, including Flood Risk Assessors, to develop firm procedures to mitigate the impact of future events. The approach Charlecote Park is now taking towards future events is clearly the one they wish was taken by their former team. Not only to mitigate the physical impacts on the park and mansion but on the team’s mental well-being. This information is by no means restrictive to handovers of National Trust properties. The prototype design should make the handover of knowledge regarding flooding more transparent for all properties.
According to research by Savills conducted in 2021, UK homeowners remained in a property for “14 years on average” before selling. Therefore, homes would potentially go through 8 different ownerships between 100-year flood events, the categorisation of a flood zone 3 property. Thus, the benefit of having available knowledge and prior warnings to allow people to self-assess the risk of flooding is again apparent. Risk can be seen as probability, increasing with the number of times flooding occurs. Therefore, the remainder of this research will explore how it would be possible to record the number of flood events reliably and passively.
CRITERIA 2: THE RECORDING DEVICE NEEDS TO BE ANALOGUE AND LONG-LASTING.
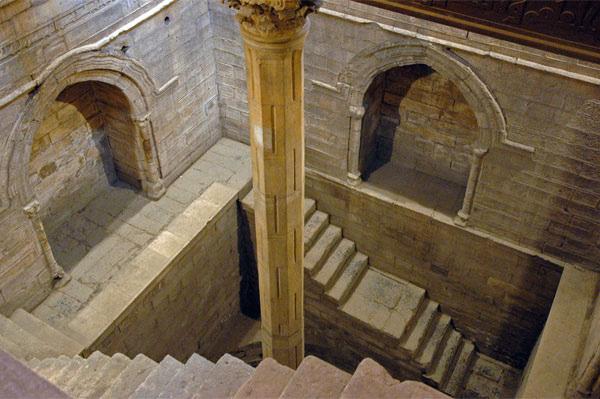
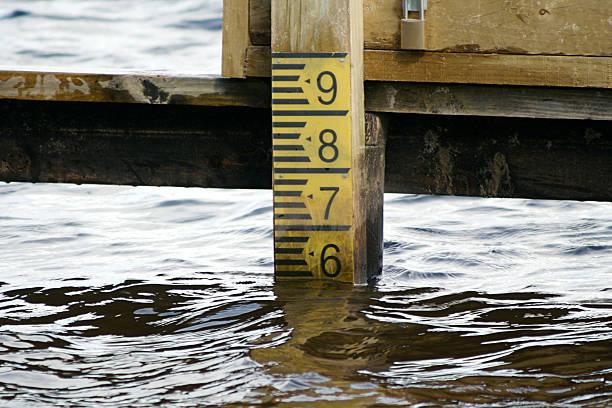
Current methods to collect flood-related data are often either mechanised or technological, therefore requiring maintenance of the apparatus or risk of them failing. Returning to the account that Watson shared about using a set of steps in the gardens as a marker for flooding,70 Watson uses an analogue method to observe flooding within the property. However, historically, humans have successfully used analogue methods that rely on the interaction of physical materials and floods to measure and record readings, including the Nilometer (Figure 18), an Ancient Egyptian device comprised of “gauges formed by graduated scales cut in natural rocks or in stone walls”71 or more recent flood height gauges (Figure 19). The obvious impracticality of using these built structures to measure floods is their size and unfeasible place in the modern-day home. However, their binary design indicating flood risk to the user over a period of time is an essential criterion in the design of ‘The Notifier’.
70 Watson, interviewed by author, Appendix C.
71 Charles Gordon Smith and Magdi M El-Kammash, Encyclopædia Britannica, 22 January 2019 s.v. ‘Nile River - Climate and hydrology’, accessed5 May 2024https://www.britannica. com/place/Nile-River/Climate-and-hydrology.
CRITERIA 3: THE DEVICE PRESENTS THE NUMBER OF TIMES A BUILDING HAS FLOODED SINCE ITS INSTALLATION.
For the desired data discussed by Watson, it would be challenging to record parameters, including start date, duration, severity, and consequences, through analogue methods. As part of the criteria for The Notifier, some aspects of conveying a flood cannot be done through an analogue system and rely on word of mouth or visual/ written records. Peak height has an existing apparatus, but the number of events and their frequency is an element that may be possible to record without an existing instrument. Therefore, to facilitate recording the number of flood events, it is proposed to develop an analogue apparatus that can be integrated into or around a building that, when submerged for a prolonged time in water, exhibits physical changes that develop with the number of flood events experienced. Providing affected residents with a complete set of information with which they can selfassess flood risk and develop appropriate procedures.
In the following sections, I will explore how similar changes and recording methods exist both in natural and built environments.
1 English Heritage, “Our Vision & Values”, https://www.english-heritage.org.uk/aboutus/ our-values/, (Accessed 27 December 2022)
1 English Heritage, “Our Vision & Values”, https://www.english-heritage.org.uk/aboutus/ our-values/, (Accessed 27 December 2022)
1 English Heritage, “Our Vision & Values”, https://www.english-heritage.org.uk/aboutus/ our-values/, (Accessed 27 December 2022)
1 English Heritage, “Our Vision & Values”, https://www.english-heritage.org.uk/aboutus/ our-values/, (Accessed 27 December 2022)
3 (English Heritage, Our Vision & Values, n.d.)
The following precedents are discussed to understand how this Notifier can present an analogue change triggered by the presence of water.
Various instruments can be used to predict, record, and analyse the weather and climate: a hygrometer for humidity, a thermometer for temperature, rain gauges for the volume of liquid precipitation, barometers for atmospheric pressure, and staff gauges for water and flood height. Despite their ability to record data, most of these instruments are mechanical and require regular maintenance and risk their electronics failing in severe floods. Therefore, these automated systems may not be applicable to all regions or their individual circumstances. However, the natural world, with its myriad analogue ways of illustrating the changes in climate both in short and deep time scales, could provide alternative inspiration. Tree rings grow wider in warmer and wetter climates,72 diversity of Lichen species directly correlates to the concentration of air pollution,73 and Hydrangeas change colour due to the prolonged acidity of the soil.74 Humans knowingly utilise these fine-scale climate sensitivities of other organisms to notify them of risks, such as the now anecdotal ‘canary in the coal mine’. Where Canaries (Figure 20) were used for their higher susceptibility to harmful gasses than humans in the same environment75 and would fall silent, warning humans to evacuate.
The climate fluctuations exacerbated by human activity are underscored by the overwhelming force capable of causing visible and measurable change within individual organisms and broader landscapes.
Despite these natural changes and records, none of these examples are instantly legible of the historically changing climates’ potentially imminent consequences and risks to people, such as flooding. Instead, a ‘visible witness mark’ is needed. This mark could be a distinct change in the Notifier’s appearance, such as a change in colour or shape, that allows for immediate comprehension of these events and their previous impacts.


n.d.)
72 Jessica Stoller-Conrad, ‘Tree Rings Provide Snapshots of Earth’s Past Climate – Climate Change: Vital Signs of the Planet’, NASA, 27 January 2017, accessed 1 April 2024, https:// climate.nasa.gov/news/2540/tree-rings-provide-snapshots-of-earths-past-climate/.
73 Beth Askham, ‘Nature and Pollution: What Lichens Tell Us about Toxic Air’, Natural History Museum, 4 June 2020, accessed 6 February 2024, https://www.nhm.ac.uk/ discover/nature-and-pollution-what-lichens-tell-us-about-toxic-air.html.
74 Henry Schreiber, ‘Curious Chemistry Guides Hydrangea Colors’, American Scientist, 6 February 2017, accessed 6 February 2024, https://www.americanscientist.org/article/ curious-chemistry-guides-hydrangea-colors.
75 Inc Ebrary, Animals as Sentinels of Environmental Health Hazards : Committee on Animals as Monitors of Environmental Hazards, Board on Environmental Studies and Toxicology, Commission on Life Sciences, National Research Council. (Washington, D.C.: National Academy Press, 1991).
The effects of climate and nature can often be shown through architecture, itself an anthropogenic manipulation of the landscape, and its defects. Efflorescence, (Figure 21) staining, water lines, mould, and erosion are all traces of the interactions between the natural and the built. But is there a way we can utilise these visible traces as climate records and notifiers? In the same way that the strata of glaciers indicate environmental change and sentinel species warn of risks, could efflorescence or staining become a gauge and warning for the number of flood events on a site? This could significantly improve people’s knowledge and understanding of their risk in a specific location, making the Notifier device a valuable tool for potential residents.
Housed on Holland Park roundabout in West London, the Thames Water Tower (Figure 22) is one of the “world’s largest barometers.” It notifies passers-by of changes in environmental conditions. Filling with water dependent on atmospheric pressure, the tower’s colour changes. A blue tower signifies an increase in air pressure and a likely improvement in the weather.76 However, as a stand-alone notification tool and more a piece of kinetic public art, the meaning of its different states is “confusing amongst Londoners.”77 If these monuments were, however, rolled out widely in other locations or accompanied by an easily translatable key, the notification may be more understandable to those interacting with it. This is a tangible representation of the concept for this thesis: a device that notifies people of climate change.
This chapter emphasises The Notifier’s immediate relevance and potential impact and reveals its vast potential applications. Learning from the research presented, to ensure its universal applicability, The Notifier’s design should be straightforward, seamlessly integrate with all existing properties, and be accompanied by an easy translation guide of what the changes signify, thereby ensuring its versatility.

76 Anon, ‘Thames Water Tower - Thames Water Tower reForm Architects, London’, Reform Architects London, accessed 3 April 2024, http://www.reform-architects.london/projects/ thames-water-.tower/#:~:text=It’s%20other%20function%20is%20as,landmark%20 within%20the%20public%20realm.
77 Thomas Kingsley, ‘What the Tower Sitting in the Middle of Holland Park Actually Is’, My London, 8 July 2020, accessed 10 March 2024, https://www.mylondon.news/news/westlondon-news/what-thames-water-tower-sitting-18563000.


Objectives of prototype testing:
To develop this apparatus, I will look to investigate three objectives through material testing:
Objective 01 - To create a physical change from saturating test samples.
Objective 02 - To create a progressive physical change that continues to develop with multiple saturation and drying cycles.
Objective 03 - To measure the progressive change to record the number of saturation cycles.
The aim of these tests is to validate the concept of an analogue device that can indicate the number of floods a building has endured since its installation.
It is important to note that while the concept of the Notifier is outlined sufficiently for further exploration, the full realisation of this product would necessitate extensive, standardised testing prior to manufacturing. Therefore, the testing conducted within this thesis should be understood within the context of its limitations, including its short timeline and the fact that it was carried out by a single researcher. Therefore, the design of this chapter’s structure, including the further works stated at the end, combined with the method and apparatus used within this research, clearly laid out in the following red pages, aim to encourage, and easily accommodate corroboration of the results and continuation of the testing that was not possible in the time frame of this thesis. Full results and images can be found in Appendix A of this document.

The initial test samples are 65mm cubes, based on the shortest dimensions of a standard UK brick (215 x 102.5 x 65mm).78 This size allows flexibility later to explore manufacturing and placement, including the possibility of retrofitting a small-scale element within a building. Beyond this, the size was easy to handle and store in volume while crucially being large enough to mix in additives and monitor the surface area for changes. If the sample sizes were much larger, there could have been numerous difficulties, including insufficient pigment penetration to make a visible change or taking too long to dry between submersions, limiting the number of repetitions it was possible to complete. By choosing this size, experiment costs were also kept low.
Human senses were used as a base to decide the potential change within objective 01. Smell, touch, sound, and taste would likely all require either proximity to or physical interaction with the apparatus. Therefore, sight offered an opportunity to observe and measure the change and, if desired, translate the changes to digital records through photographs.
To explore the colour transformations, Chromatography is a method used to separate elements depending on their properties, including size, shape, and hydrophobic properties.79 This method can be used for pigments, where water carries different colours further distances, leaving a distinguishable separation relative to the compound. The research selected typical stains as an initial pigment, assuming that these stains would remain on the sample blocks for a significant period. These pigments included coffee grounds, turmeric, and anthocyanin. These natural dyes were considered as they would not pollute the watercourse. However, through initial tests, samples 4, 5 and 6 were found not to have the desired movement of pigment and exhibited very little change throughout a saturation cycle.
78 Wienerberger, Technical Guidance - Brickwork Dimensions Table - Standard UK Brick, Wienerberger (Wienerberger, April 2021), accessed 6 April 2024, https://www.wienerberger. co.uk/content/dam/wienerberger/united-kingdom/marketing/documents-magazines/ technical/brick-technical-guidance-sheets/UK MKT DOC Brickwork%20Dimension%20 Tables.pdf.
79 Ozlem Coskun, ‘Separation Techniques: Chromatography’, Northern Clinics of Istanbul 3, no. 2 (11 November 2016): 156–60, accessed 22 April 2024, doi:https://doi.org/10.14744/ nci.2016.32757.
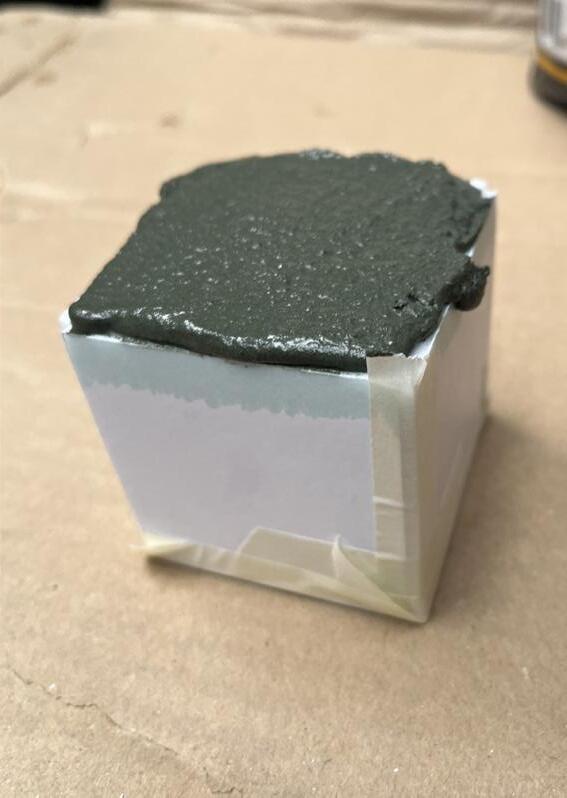
Instead, an alternative method was pursued to find a chemical reaction that indicates the presence of water. The typical experiment uses anhydrous Copper (II) Sulphate (CuSO4).80 In its pure form, it appears white when there is no presence of water but turns blue when wet, and once dried, it returns to its original state. (Figure 33) This blue colour is the same chemical often seen as run-off from copper or brass plaques on limestone monuments like that of the Nottingham War Memorial Gardens (Figure 34). Therefore, a primary investigation (sample 07) was undertaken to see if the reversible colour transformation in its pure form would be retained when mixed within a matrix material or if it would remain stained.
Similarly, inspiration for the next additive was found in the built environment. Efflorescence is a deposit of salts81 often seen on building surfaces. Salts are dissolved in moisture and drawn up through materials through capillary action. As the water evaporates, the salts crystalise, leaving white deposits. In the same way, this staining occurs naturally. Experiments aimed to see if this effect can be manufactured to create a change within a test sample that is representative of the number of submersion cycles, meeting objectives 1-3.
Following the selection of additives, a matrix material was needed to contain them. The use of additives within matrix materials is a common practice, especially in the concrete industry, to allow existing materials to function outside their typical applications.
Common building materials, including plaster, air-dried clay, and cement, were selected as potential matrix materials for the samples used in this research. These materials have varying densities, compositions, and porosities, but vitally, all allow the possibility to be cast and mixed with additives. Other materials considered included wax, plastic, rammed earth, fabric, and corn syrup. However, those selected were deemed the most appropriate due to their familiar use within the construction industry.

80 BBC, ‘Test for Water - Chemical Analysis - (CCEA) - GCSE Chemistry (Single Science) Revision - CCEA’, BBC Bitesize, accessed17 March 2024 https://www.bbc.co.uk/bitesize/ guides/zmbmrj6/revision/13#:~:text=When%20water%20is%20present%20in.
81 Laura Martin, ‘What Is Efflorescence? How to Prevent It and Remove It?’, Nitterhouse Masonry Products, LLC, 1 October 2019, accessed 6 April 2024, https://www. nitterhousemasonry.com/blog/what-is-efflorescence/.
Running the experiments
Several considerations were made regarding the parameters in which the samples would be tested in the design of these experiments. These included the length of time saturated, the amount of sample saturated, what liquid to saturate in, the length of time dried, and the drying method.
Now that the materials and objectives were determined, understanding what element of a flood would result in a change was needed. The test could react with mould, pollutants, and bacteria, all contained or created by floods. Although because of the nature of flooding, everything the water touches can potentially contaminate it. Therefore, the list of potentially harmful substances within a flood would be too vast to account for and test the presence of reactions for all of them. To eliminate this issue, water, the reactant chosen, would always be present in a flood. For this experiment, solely tap water was used. Despite the synonymous nature of coastal areas and saltwater with flooding, this was eliminated to ensure consistency within the testing and avoid potentially unforeseen variations in results caused by the presence of salt.
Considering the timescale of the research and this information, each sample will be saturated for 24 hours at a time, ensuring sufficient time for the materials to become fully saturated and react. Measurements will be taken at 0 hours when fully saturated and at 1, 2, 6, and 24 hours. These intervals are all factors of twenty-four and will make analysing results in line with objective three easier. To get a greater understanding of the effects of flooding on the test, the sample will only be half submerged, allowing comparison of the sample above and below the waterline. To hypothesise, the pigment will be drawn upwards more noticeably in the areas above the water line due to the motion of capillary action.

Following the 24-hour saturation of the samples, each will be air-dried for 72 hours. This was determined following initial investigations of samples 1 and 2, which took 24 hours to become dry to the touch and further drying for another 48 hours to ensure drying through the core. Firstly, this ensures that the research is appropriate for existing buildings following guidance written by David Pickles for Historic England in 2015, “Rapid drying can be damaging to historic fabric.”82 Secondly, this will ensure consistent drying parameters, avoiding the chance of variations between the results and a real-world application where forced drying techniques may not be possible.
The equipment used in the experiments was selected, designed, and assembled to enable the most consistent and accurate simulation and recording of results.
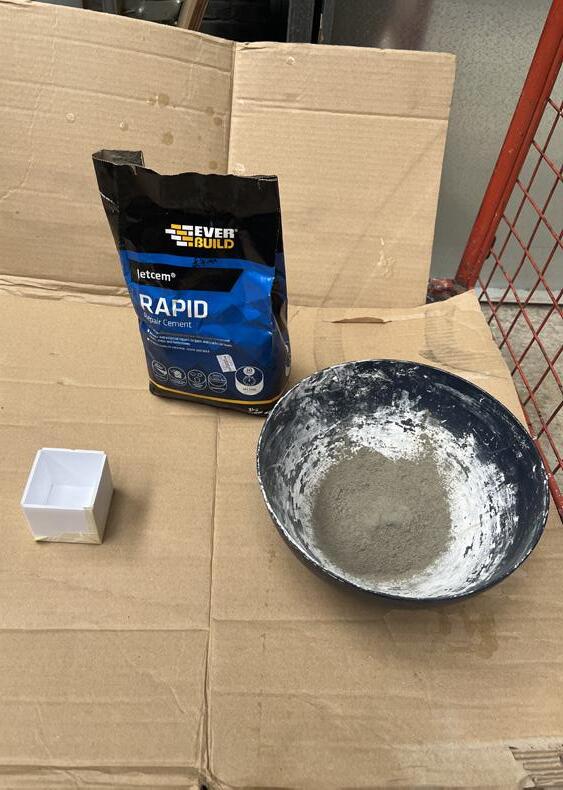
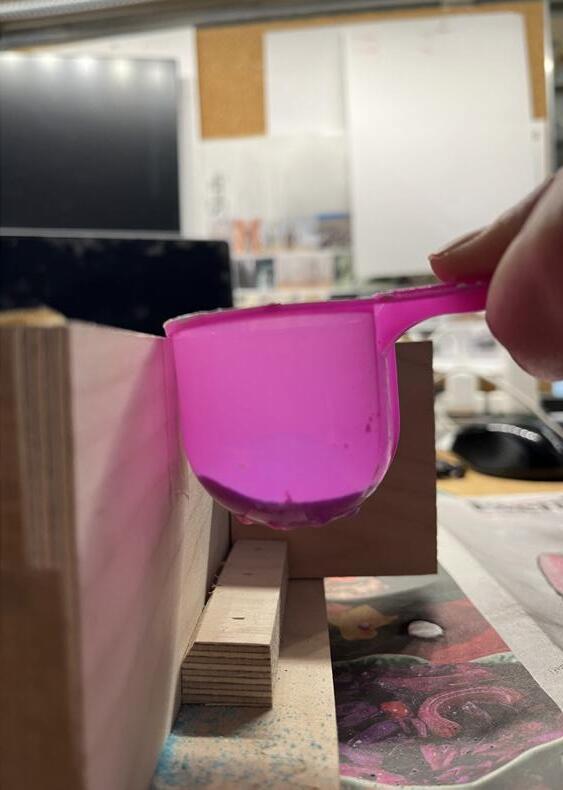
The samples are constructed using exact measurements from measuring scales and jugs, following the manufacturers’ guidance on mixing ratios for the matrix material and cast inside a 5-piece reusable mould. (Figure 35) Constructed of plywood and lined with parcel tape. The reusable mould ensures a repeatable process and, due to the lining, easily releases the cast whilst crucially avoiding any potentially contaminating release agents that may change the characteristics of the sample.
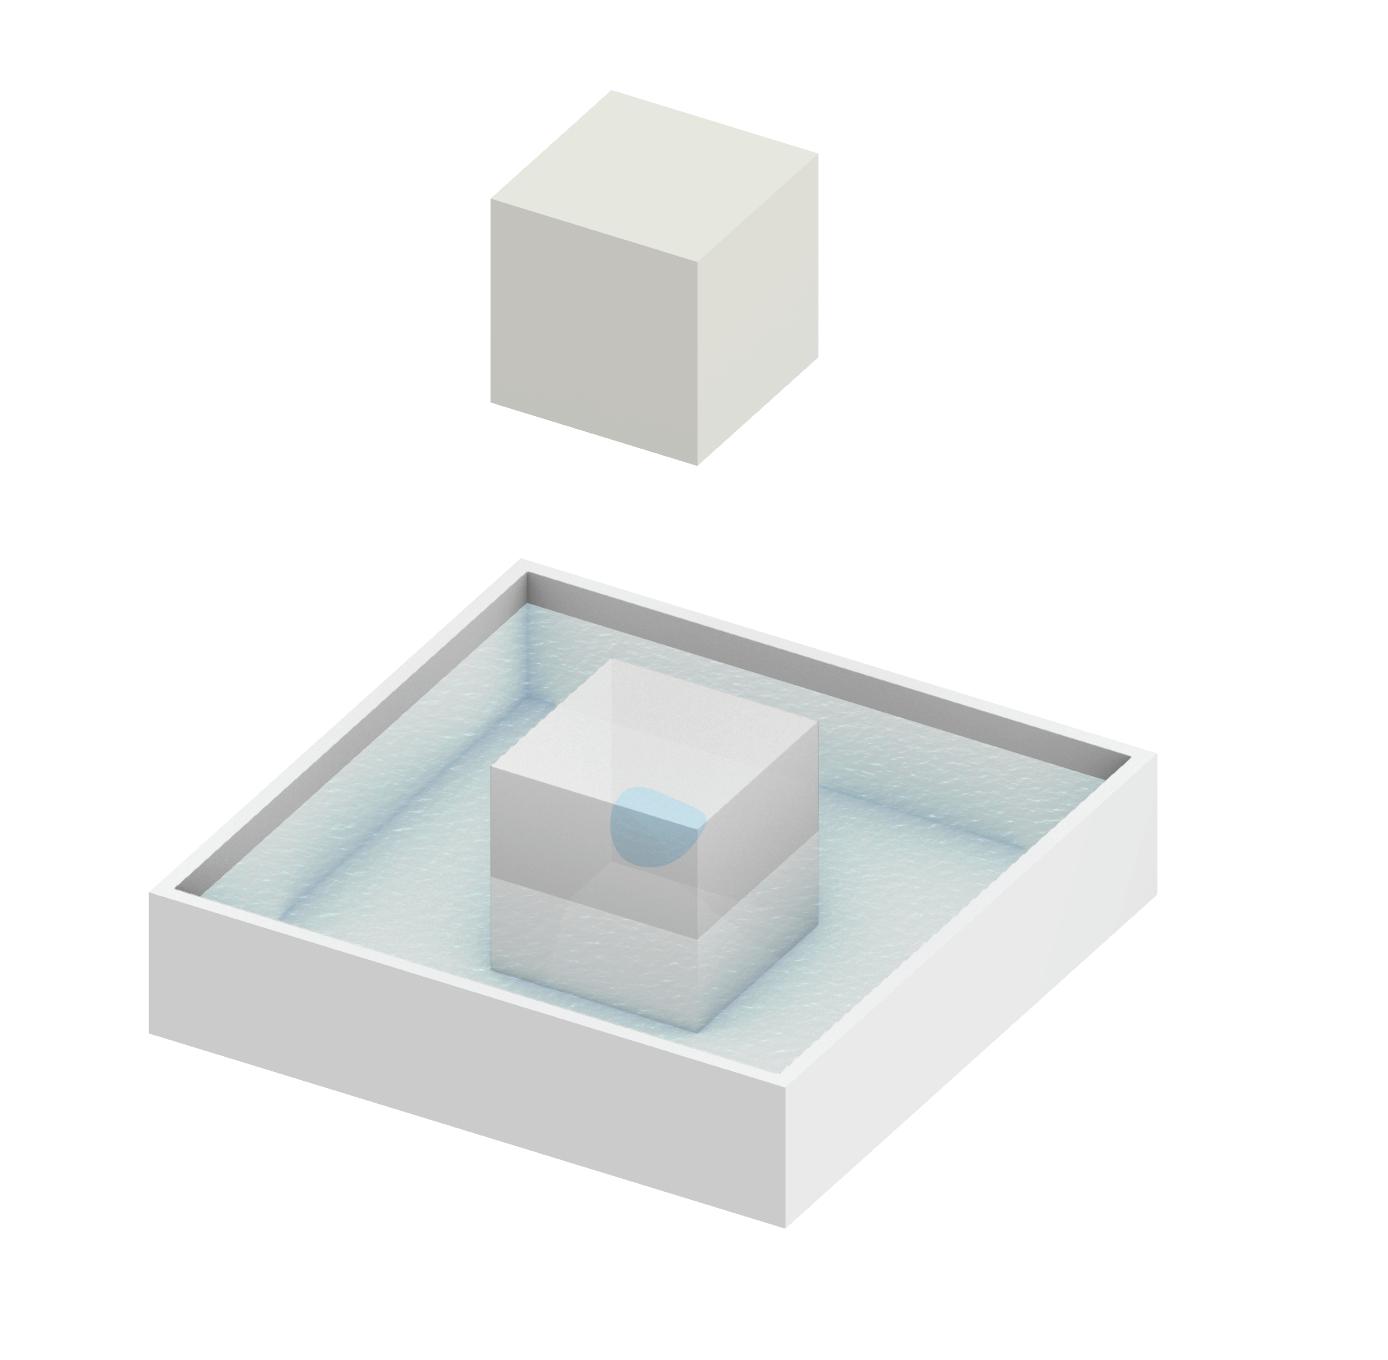
The samples are then tested inside a tray made of transparent acrylic and divided into two separate segments. This setup doubles the number of experiments possible and allows two experiments to be run simultaneously in identical conditions, allowing immediate comparison of the two samples and the ‘run-off’ into the water.
82 David Pickles, Flooding and Historic Buildings 2nd ed. (2010; repr., Historic England, 2015), 1, accessed21 January 2024https://historicengland.org.uk/images-books/ publications/flooding-and-historic-buildings-2ednrev/.
Measurements will be taken throughout the experiment using a digital laser thermometer, stopwatch, and camera. The temperature of the water and sample blocks will be taken, approximately 50mm from the surface, to allow further testing following this research, where different environmental conditions can be tested, including various water temperatures and samples, including saline, acidic, alkaline, and polluted water.
Photographs of the changes will be recorded against a draped white background using a consistent camera and lighting setup and analysed through post-production preset to ensure that the changes within the samples can be consistently compared in order to answer objectives 2 and 3. The comparison will assess the amount of degradation to the material, the presence of staining, movement of the stain, strength of the colours, and any dispersion. Digital software will be used to compare these changes, using a CMYK eye dropper to record the colour change. This system allows the comparison of colour hue (C, M and Y) and brightness (K).
The camera will be mounted on a tripod and set to the level of the samples to record the changes with minimal glare from light sources. A tripod is essential as the camera is set to a low shutter speed and ISO to allow maximum light and data onto the sensor for the best quality. However, this means camera movement must be removed. The exact camera and post-production settings have been listed in the apparatus list.


Equipment:
Making:
• PPE
o Goggles
o Mask
o Gloves
o Apron
• Reusable mould (sample size 65x65x65)
o Five-piece plywood mould, lined with brown parcel tape as a release agent.
• Scales
• Measuring bowls (x2)
• Mixing bowl
• Stirring instrument
Sample materials:
• Cement
• Plaster
• Earthenware Clay
• Freshwater
• CuSO4 Powder
• Epsom Salts
• Anthocyanin C15H11O+
o Saucepan + Lid
o Red Cabbage
o Knife
o Chopping Board
o Freshwater
o Measuring Jug
o Heating Element
o Stirring implement
o Sieve
o Jar
Testing:
• Transparent test tray split into two sections
• White infinity curve
• Top light
• Digital camera
• Manual focus lens (capable of 18-35mm)
• Tripod
• Digital laser thermometer
• Metric Ruler
• Measuring jug
• Freshwater
• Test samples
• Stopwatch
Camera and Lighting set up:
Canon 77D DSLR with an 18-135mm EFS lens was used on the following settings:
Mode: Manual
Shutter Speed: 2” (seconds)
Aperture: F22
Iso (Sensitivity): 100
Focal Length: Approximately 29mm File type: RAW
Lighting: LED overhead desk lamp, warm light.
Lightroom pre-set: Highlights: -10
Shadows: +10
Whites: +10
Blacks: +5
Temperature: 3,000
Tint: -2
Parcel tape as release agent for mould, leaves no residue
Seperated mould walls for easy disassembly
Concentrated pigment blocks
Cement control sample
Clear acrylic test tray for observations
Final test sample 03
Final test sample 07

Construct mould
• Make re-usable mould with coating that easily releases cast.
Making of Anthocyanin C15H11O+
• Dice red cabbage.
• Boil fresh water in a pan.
• Add red cabbage once the water is boiling.
• Cover with lid.
• Leave to simmer for 6 hours stirring occasionally.
• Remove from heat.
• Pour through a fine sieve into a jug, ensuring to wring out cabbage.
• Dispose of cabbage flesh.
• Return sieved water to the heat.
• Reduce by half.
• Pour into a sealable jar for storage.
Making of sample
• Weigh out measurements of material for test object using measuring bowl and scales. (Add material in ratios not exact weights as it will be difficult to remove all material from mixing bowl.)
• Mix materials following instructions from manufacturers.
• Pour into mould.
• Leave to dry until hard to touch.
• Release from mould.
• Leave to dry for a further 48 hours in room conditions.
• Once dried, note any observations of starting sample
• Record hypothesis for experiment
Testing of sample
• Clean container
• Insert test samples.
• Ensure camera is set up in repeatable manor.
• Measure temperature of sample blocks
• Record temperature of sample blocks
• Use approximately room temperature water (1622oC) to fill the container slowly to avoid splashing of samples until the depth reaches 30mm.
o Water is added after the samples to ensure water height remains consistent despite of water displacement
• Start stopwatch.
• Measure water temperature.
• Record temperature.
• At times 0 hours, 1 hour, 2 hours, 6 hours, 24 hours. Record observations, temperature of materials and take photos of samples.
• At the end of the 24 hour test remove the samples from the water and rinse under a high water pressure cold tap to remove any loose materials to simulate the movement of the flood water.
• Leave to dry by air in room conditions
• Record approximate drying time and any observations once the sample is dry to the touch.
• Leave for a further 48 hours to ensure no further changes occur.
• Repeat the experiment multiple times to simulate the multiple flooding events
• Record any conclusions and further investigations required following each running of the experiment.


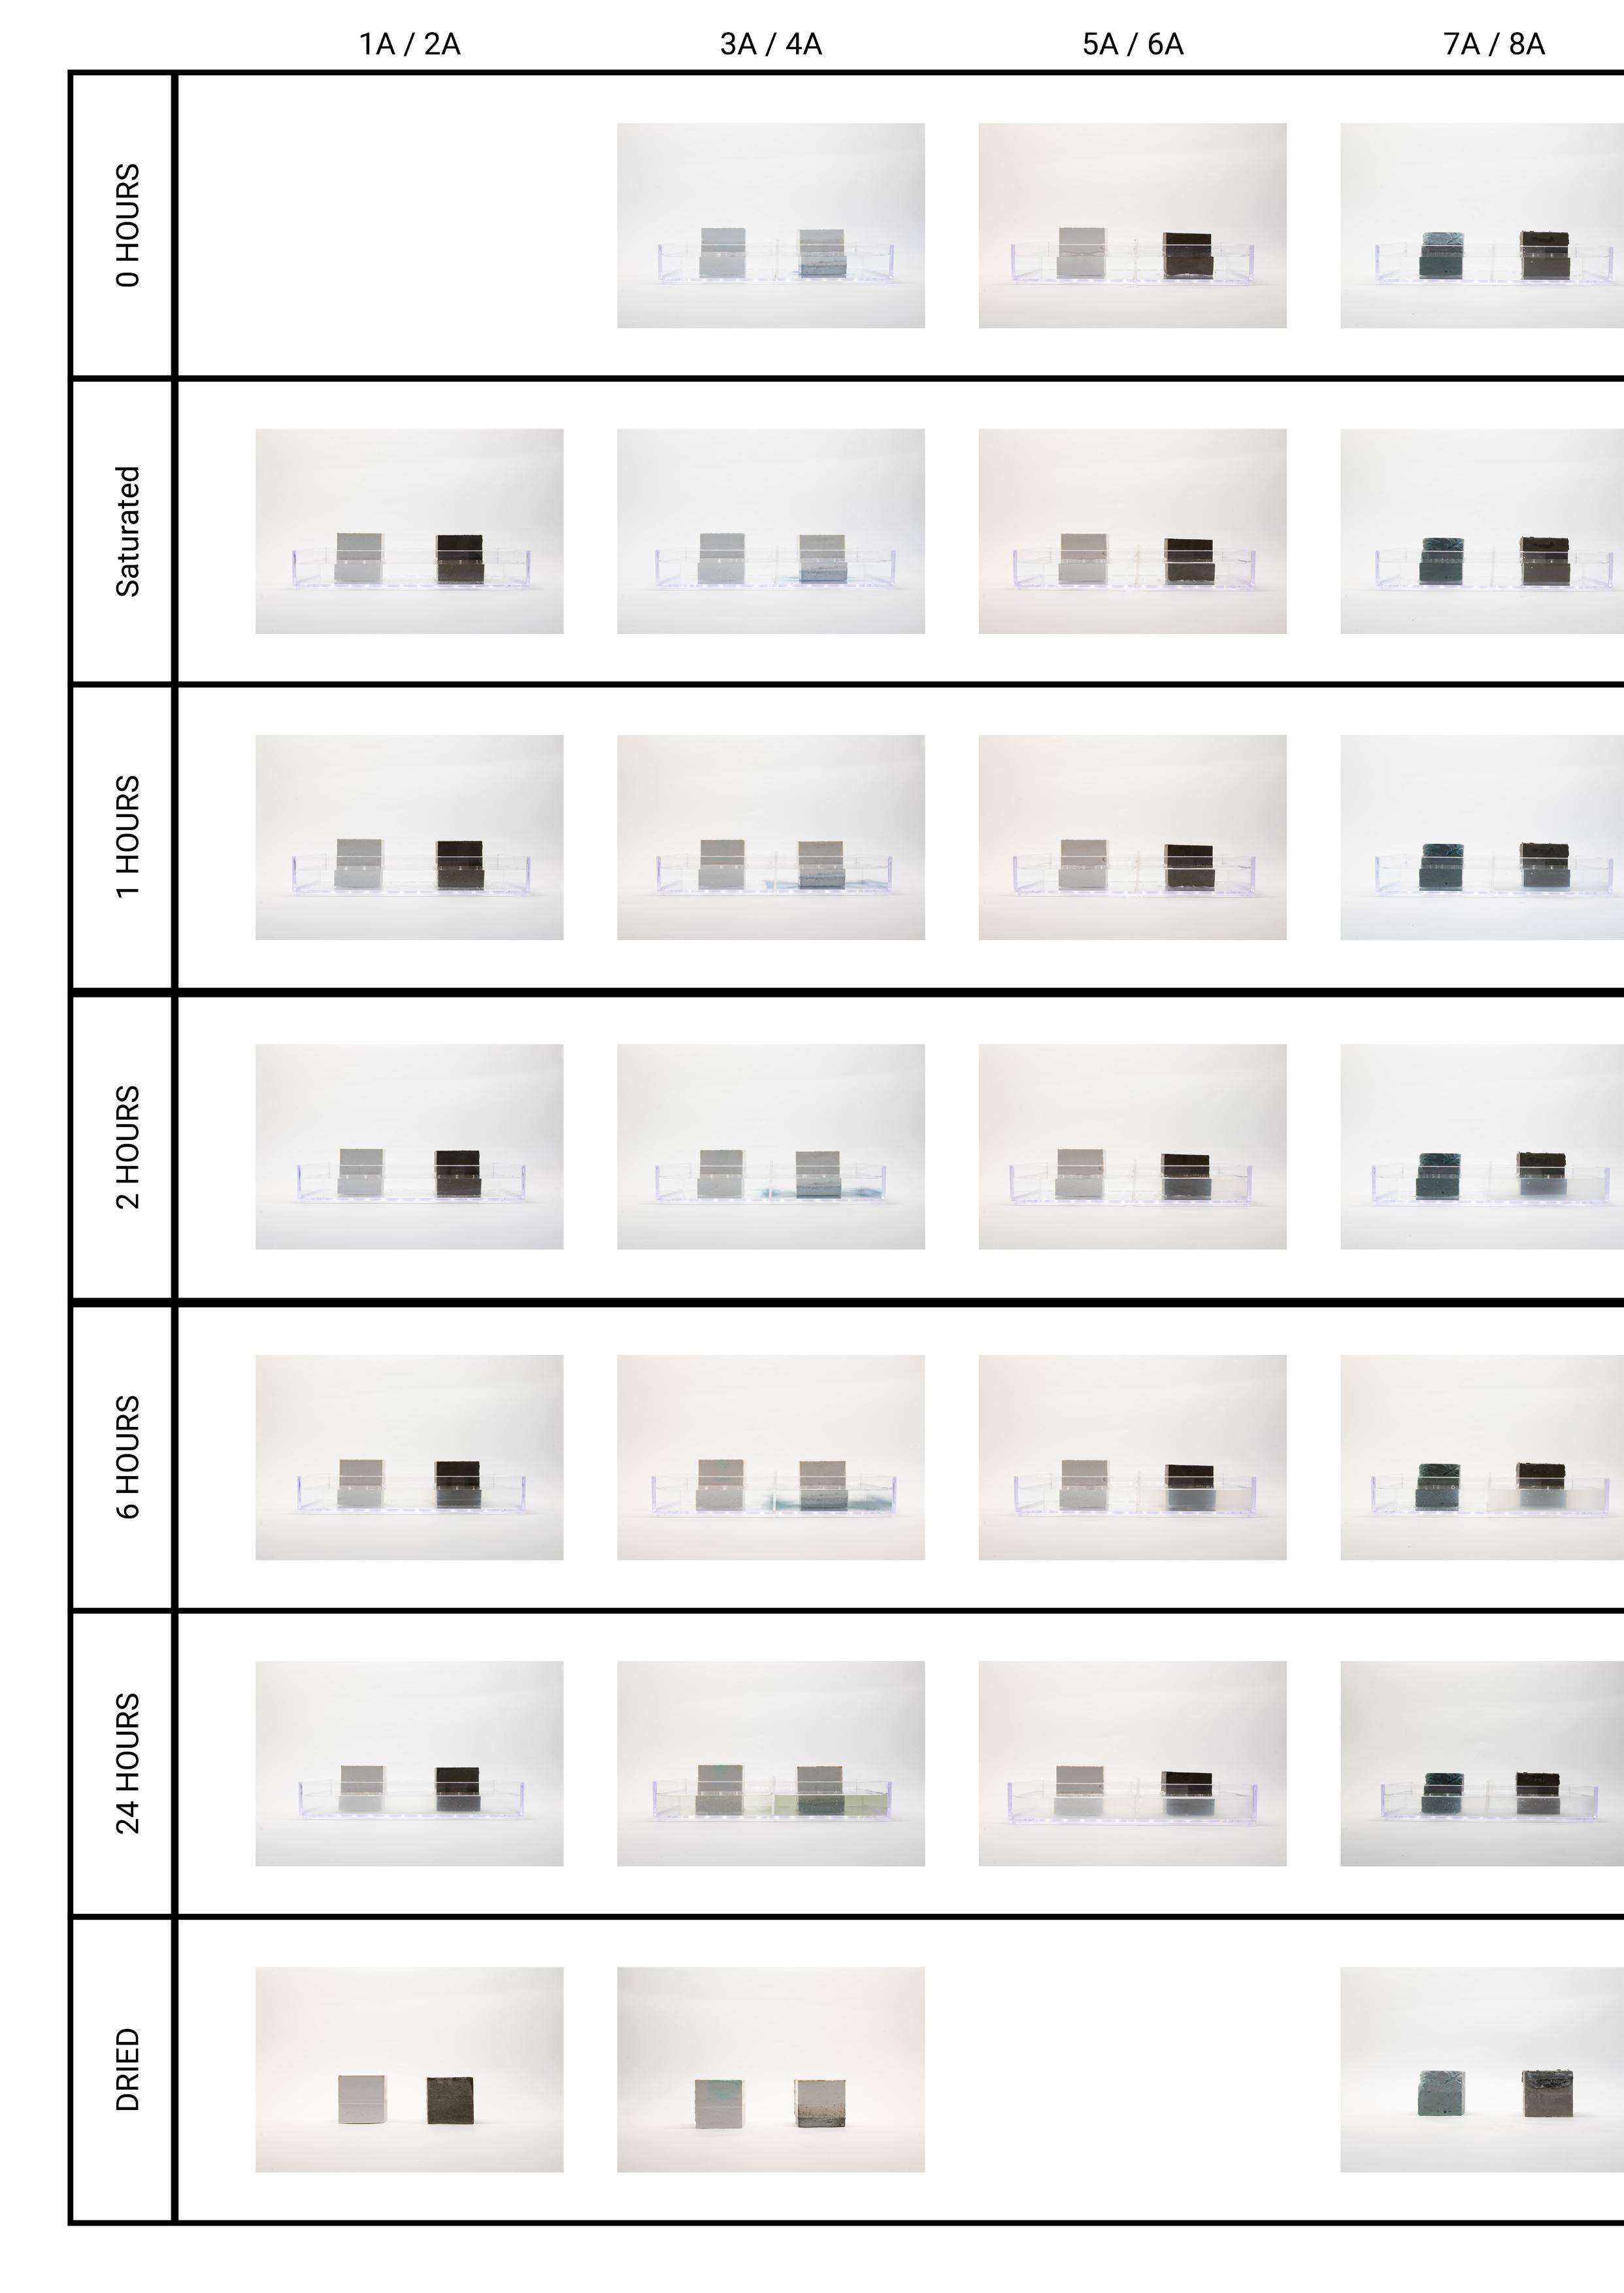
Experiments started with objective 01: to create a physical change from saturating test samples. The test samples included the following compositions, also found in Appendix A, with their respective results and observations.
01 - Plaster Only
02 - Cement Only
03 - Plaster
CuSO4 (20g Powder at centre)
04 - Plaster
Anthocyanin (13mm base)
05 - Plaster
Anthocyanin (10mm3 centre)
06 - Cement
Anthocyanin (20ml mixed)
07 - Cement
CuSO4 (50g Powder mixed)
08 - Cement
Epsom salt (20g centre)
09 - Air-dried clay only
The first test set was control samples to see what changes would happen to various pure materials. These findings helped to understand if later transformations in samples were related to the matrix material or the presence of an additive. For example, sample 01 exhibited slight orange staining on the top edges whilst eroding slightly beneath the water line; therefore, when samples 03, 04 and 05 exhibited the same changes, it was not due to the presence of the additive. Sample 02, however, exhibited little change apart from a witness mark at the water line. Due to the dark original colour and the long time it took to saturate, therefore, it seemed unlikely a change would occur in any future cement samples.
1 English Heritage, “Our Vision & Values”, https://www.english-heritage.org.uk/aboutus/ our-values/, (Accessed 27 December 2022)
1 English Heritage, “Our Vision & Values”, https://www.english-heritage.org.uk/aboutus/ our-values/, (Accessed 27 December 2022)
1 English Heritage, “Our Vision & Values”, https://www.english-heritage.org.uk/aboutus/ our-values/, (Accessed 27 December 2022)
1 English Heritage, “Our Vision & Values”, https://www.english-heritage.org.uk/aboutus/ our-values/, (Accessed 27 December 2022)
3 (English Heritage, Our Vision & Values, n.d.)

The clay sample 09 was not completed because it deformed beyond a reasonable tolerance due to issues in the casting process. Typically, a clay mould should be lined with sand to allow it to release. Instead, the clay stuck to the packing tape and became misshapen when removed.
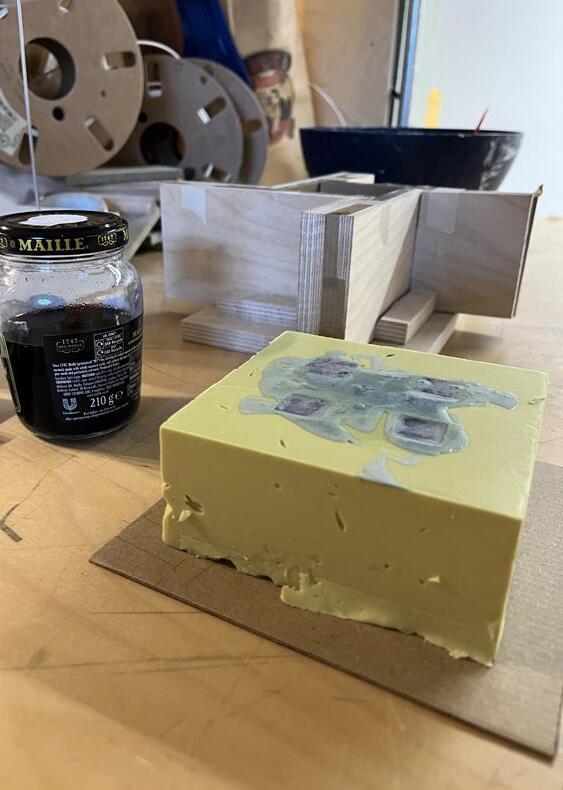
Following the control experiments, the subsequent tests included the additive anthocyanin. Despite sample 06 exhibiting no colour transformation, its structural stability was severely compromised. It crumbled when it was removed from the mould, placed in water, and washed, so much so that the sample would have likely completely disintegrated after just a few cycles, meaning that it would not have met objective 03, and testing was stopped. Learning from this, plaster samples 04 and 05 used anthocyanin as well; however, in different forms and locations within the samples. Sample 04 at the base and 05 as a concentrated core, both made by mixing 20ml of anthocyanin within a small volume of plaster. Both samples were saturated to see if there was any visible change or movement in the pigment; however, 05 showed no change other than slightly darker orange staining than that seen on sample 01, even over two cycles. Whilst 04 exhibited more visible changes, almost instantly, blue pigment had washed into the water. Originally thought to be reflecting the sample’s colour, it grew throughout the first saturation cycle until turning the water a mirky yet even green tone. When dried 04 had the expected plaster markings and some slight upward movement of pigment into the plain plaster and dark marks on the lower edges, potentially mould due to the organic origin of the additive. At this point, when inspecting the dried sample, the two parts broke apart as hypothesised; despite this estimate, it was thought to be unlikely as the two parts of the cast were both poured wet at the same time and were believed to have adhered.

At this point, three conclusions were drawn. Colour contrast between the additive and matrix creates the most visible transformation; all the changes that have occurred are permanent and do not return to the sample’s original form; anthocyanin doesn’t have a significant transformation to meet objective 01, and therefore, its testing was stopped. On reflection, I believe this failure was based on an oversight that the natural dye, as its purpose was intended, stained the plaster when cast because the binding capacity of the pigment was too strong to spread.
The final general test not to be continued was sample 8. Following the conclusions stated above, an additive that contrasted cement was chosen; as mentioned in the preparatory section of this research, efflorescence was a prominent marking that inspired the work. Epsom salt was used in the centre of the sample and, when saturated for 24 hours, had the expected effect, spreading to the surfaces above the water line to leave a white and stark crystalline residue as hoped, growing in contrast once dried. During the test, the residue washed into the water, leaving a milky translucency, but it appeared to have no other effect.
However, the samples that did meet objective 1 were 03 and 07, the focus subjects of the following section, and 08. However, between tests A and B of sample 08, there was little change in the contrast or area of the crystalline residue, principally not meeting objectives 02 or 03, and it was subsequently stopped. As evaluated against the three defined objectives, the two most successful samples were 03 and 07. Both samples used copper sulphate powder as the additive but expressed change differently. Therefore, they both meet Objective 2 but require different measurement methods in Objective 03.

Flood Height Maximum travel of pigment

Orange staining on edges

Objective 01: To create a physical change from saturating the test sample.
Sample 03 is composed of plaster and a 20g copper sulphate powder centre. Initially, the sample was well formed, filling the mould completely, with small faint blue circles appearing on two of the side faces, likely due to uneven placement of the additive within the cast. On the first saturation cycle, the area submerged in water eroded as per sample 01. Simultaneously, the blue pigment of this sample spread from the centre, staining the external surfaces but more clearly at the top edges as hypothesised. Once the sample had dried the first time, these stains became more vibrant and defined, especially in the areas of the original faint circles. The stains continued vertically onto the top face, forming a cross-shape, notably not reaching the corners, the furthest points from the nucleus, and not extending below the water line. It is unclear why this is, but further tests may help to understand if the additive has a terminal threshold or if it would continue to spread.
Overall, sample 03 met objective 01 by exhibiting a physical change of colour and texture when saturated, which also developed when dried, suggesting that it could potentially meet objectives 2 and 3.

Objective 02: To create a progressive physical change that continues to develop with multiple saturation and drying cycles.
Sample 03 underwent four saturation and drying cycles, and as shown in Figure 59, there has been a progressive change in the sample, clearly meeting the criteria of objective 02.
Throughout the cycles, trends in the transformations include the continuous growth of the stain and a fading in the vibrancy of the colour while saturated, likely affected by the reduction in the contrast between the white and the blue when the plaster darkened due to complete saturation.
In the second cycle, the definition in the peripheral stain became stronger once fully saturated; over the remainder of the saturation, the extent did not increase much, but the same area became fuller with pigment. Between two and six hours, an unexpected change concurrently occurred as a narrow crystalline residue formed on the arc of the original circular stain. This continued to grow in density until removed from the water, when the crystals became defined in the absence of moisture. By hour 2 of the same cycle, the staining began to show signs that it would not progress further below the watermark. In future tests, a sample with a nucleus below the water line would potentially confirm if this is due to the movement of high to low pressure in capillary action.
Further cycles continued the same initial increase in size and vibrancy, followed by a visible growth in crystalline residue from 2 hours onwards. Despite the continuous change being visible just by periodic observations, the rate of pigment spread has reduced from the first saturation cycle onward, reinforcing the assumption that the pigment may have reached a threshold of dispersion. Following the research’s completion, the sample’s dissection may prove interesting in understanding how much of the original nucleus had been absorbed, potentially informing further tests with different volumes of the additive.
In the third and fourth cycles, the significant change became the growth of the crystalline residue. From the first hour in the third cycle, the residue began to form new distinct branches, which continued until the end of the


testing. At this point, the staining had become full and seemingly consistent in its progression of area on both the side and top faces, still not progressing below the water line; nevertheless, meeting the requirement of objective 2, that the change continued to develop through multiple cycles and due to the seemingly steady change, there was potential to explore methods of measuring the change in line with objective 3.
Objective 03: To measure the progressive change to record the number of saturation cycles.
As the main change of the sample is the growth of the stain and crystal residue, the transformation was analysed using post-production software. Tracing the outline of the staining and residue on the final sample and overlayed these formations on the images of the previous cycles, measuring the growth per cycle through the diameter of the staining on one face, using the top of the acrylic tray as a datum height. As shown in Figure 61, the growth between the first and second cycles is vastly more significant than in the following tests. However, growth beyond this reduces to a seemingly steady incline.
The minimal data set available results in relatively inconclusive results regarding whether the pigment disbursement would continue to grow or if the crystalline residue would be the only developing factor. However, in a real-world application, I believe that the crystals would likely wash away from precipitation and, therefore, not make a reliable metric. Instead, further repetitions should be carried out to understand the existing data’s trajectory in a greater context of whether the pigment spread would continue or reach a threshold. From looking at examples of chromatography, it is expected that the pigments would most likely soon reach a limit of how far they could spread.
In conclusion, sample 03 did not meet the criteria of objective 03 but may have if more repetitions had been completed.

1 English Heritage, “Our Vision & Values”, https://www.english-heritage.org.uk/aboutus/ our-values/, (Accessed 27 December 2022)
1 English Heritage, “Our Vision & Values”, https://www.english-heritage.org.uk/aboutus/ our-values/, (Accessed 27 December 2022)
1 English Heritage, “Our Vision & Values”, https://www.english-heritage.org.uk/aboutus/ our-values/, (Accessed 27 December 2022)
1 English Heritage, “Our Vision & Values”, https://www.english-heritage.org.uk/aboutus/ our-values/, (Accessed 27 December 2022)
3 (English Heritage, Our Vision & Values, n.d.)

Key: Extent of final pigment spread
Extent of final crystaline residue
Objective 01: To create a physical change from saturating the test sample.
Sample 01 comprised of cement and 50g of copper sulphate powder mixed throughout. This sample was cast as an initial test to understand if the copper sulphate would retain its ability to return to a white powder even when combined with a matrix material. The conclusion of this test is evidently not, and the sample was not intended to be tested further due to the deformations caused in the casting process because of a too-dry mix. However, to understand if these imperfections would contribute to any transformations that potentially would not, had the cast been complete it was tested. The original sample before saturation was softer than pure cement and was easy to scratch off material from its surfaces. Beyond this, the cast was consistent in colour tone, and it was hypothesised, with saturation cycles, it may stain darker below the water line and similarly to the previous plaster samples eroding, that this weaker cement sample may react the same way.
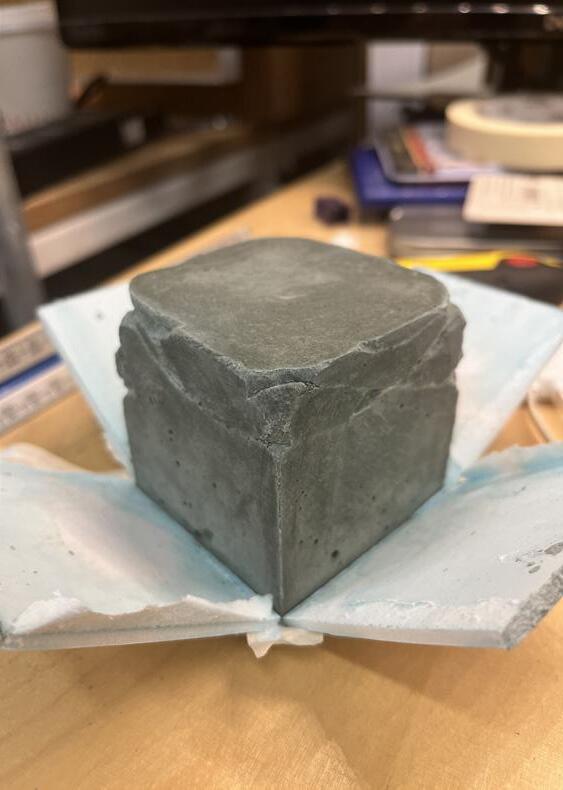
When submerged, the sample became saturated much quicker than the other cement samples, suggesting it had a higher porosity. With the saturation, it became a much darker green hue but did not visibly change in tone within the next twenty-four hours. Once washed and dried, the sample showed no signs of the predicted erosion but did show a defined contrast in colour between the submerged and exposed halves. This permanent transformation persisted and, therefore, met the criteria of objective 01, to exhibit a change following saturation. The consequential progression was then to carry out multiple saturation cycles to see if the colour would continue to change in line with objective 02.

Objective 02: To create a progressive physical change that continues to develop with multiple saturation and drying cycles.
Over the saturation cycles, the samples behaved almost identically each time, showing no signs of erosion and consistency in the colour of the saturated sample each cycle. However, when compared, the dried samples did show a change in stained colour. The contrast between the submerged and exposed sides grew, and the tones simultaneously became more vibrant and darker.
The hypotheses, however, did not predict the crystalline residue that began to appear when drying following the second saturation cycle. Initially assumed to be crosscontamination of Epsom salt from sample 8 between the compartments of the test tray, the concurrent testing of the samples stopped; however, through further testing and analysis, this seemed unlikely to have occurred. Firstly, there is no current in the water, so transmission of water and particulates would be very slow. Secondly, the gap in the fitting of the divider is minimal, and therefore, the volume of water passing through this gap is also minimal. Finally, the salt nucleus in sample 8 was positioned above the water line and exhibited no visible signs of downward transmission within the sample. Supported by the latter results of sample 03 this was more likely the crystalline structure was most likely caused by the movement of copper sulphate particulates towards the area of low pressure and, in drying, crystalising on the outside surfaces. However, the difference between the two samples is that the crystal residue in sample 03 is blue, whilst in 07, it is white. An assumption may be that due to the additive being more spread out, when it is filtered to the surface in smaller quantities, the crystals have a higher surface area and retain less moisture. Therefore, the reversible reaction is again seen in the copper sulphate, as the residue is no longer visible when re-saturated.
Nonetheless, in line with objective 2, the sample exhibits a change that develops with multiple cycles of saturation and drying; this colour change seems more consistent than sample three, however, and therefore may be more quantifiable in producing a measure of flood events.


Objective 03: To measure the progressive change to record the number of saturation cycles.
As previously discussed, the significant change in sample 07 is in the colour witnessed between dried samples. Therefore, to quantify the amount of change, I used a CMYK colour dropper on the photographs to measure both the intensity of the hue and brightness. As shown in Figure 65, the increase in colour tone is linear in both measurements, with the C and K values, respectively, increasing by 5 and 7 marks on average after each cycle. Beyond these four cycles, it would be helpful to have a further data sample to understand the continued trajectory of the data. However, from the completed tests, a pattern has begun to be established with a consistent increase in values per cycle. Therefore, for users to self-assess and measure the transformation, a colour gradient chart would be created, as shown in Figure 64, to translate the colour code to the number of flood events experienced.
This defined measurement method crucially meets objective three and that of the thesis, to create a method for people to self-assess flood risk by understanding the number of flood events on a site through a measurable material change.


The testing concludes that only sample 07 met all three objectives. While multiple samples exhibited expected and unexpected changes, these either did not continue to develop through saturation cycles or did not change in an easily measurable way.
Due to the time constraints of this research, only some of the identified tests could be carried out. However, the further tests that could be conducted were:
• To continue with multiple saturation cycles of samples 03 and 07 until the visible change plateaued.
• While testing against objective 02, I would run concurrent experiments in natural conditions to understand the effects of fluctuating humidity and precipitation on the sample, specifically sample 03, to understand how the crystalline structure would react.
• A taller test sample, would see if the movement of pigmentation would reach a threshold as seen in chromatography or continue to move further from its origin with increasing saturation cycles.
• Following this, a sample with multiple additive deposits at various heights above the water line would be used to see how this would affect the staining patterns.
• Test composition 07 in multiple water heights to see if multiple witness marks would be left on its surfaces or if only the latest would be visible.
• Tests conducted in different water samples, including polluted and saline, and at various temperatures to understand if the results would still be visible.
• To understand if the test sample with the additive would stain typical adjacent building materials, including brick and stone, or if the additive would be retained within the host block.
• Further combinations, measurements, and formations of test samples, mainly a copper sulphate nucleus within a cement matrix and a fully mixed copper sulphate and plaster sample.
Should this research be continued by others, several alterations should be made to the method to improve the breadth and rigour of the data. These included:
• Creating 3 sample blocks of each composition and testing these simultaneously to identify anomalies.
• Instead of casting concentrated additive cubes in plaster, frozen pure liquid cubes should be used. These
could be quickly inserted as solids into the fast-curing cast, allowing the maximum amount of pigment to react.
• Placing the additive nuclei lower in the sample below the water line to allow further distance for any staining to travel and understand how it would react below the water line.
• Sealed divisions between the test tray compartments, and a taller tray to have a clear view of the sample without an obstructing line of the top of the tray.
• Use time-lapse to record more incremental changes, with a stopwatch positioned behind to mark the time stamps of the images.
Understanding the context of flooding through existing literature, interviews with industry professionals, and detailed accounts of people affected by flooding provided proper context to gain an understanding and deep respect for the catastrophic and strengthening forces of the climate. As this research proves, these natural forces are expected to only become more severe with a warming climate and humans’ persistence in intervening with the landscape. However, the preparatory chapters of this research found that understanding the reasons, likelihood, and consequences of flooding can help improve people’s resilience to inevitably traumatic experiences. Records of climate change and catastrophic events already exist within the natural world but are often not visible; hence, there is a need to develop a method to notify and record these events recognisably and visibly.
As mentioned, this research and the document itself have been designed with clear documentation and presentation of the processes, equipment, and results to facilitate and encourage the continuation of this testing. The apparatus and methodology pages, coloured red, should be used as clear guides to complete the existing results to corroborate the findings or highlight any anomalies.
Although this is only an initial step in developing a functioning product, fundamentally, the question this thesis set out to investigate; whether it is possible to create an analogue product that notifies people of the number of flood events on a site. Therefore, allowing people to self-assess the risk of flooding; has been answered by testing numerous samples against strict and defined objectives to produce a proof of concept. The changes produced and the ability to measure them, as described in sample 07, illustrate that the material can, without the aid of humans, mechanics, or technology, record the number of flood events on a site and visually notify those concerned of the information, allowing themselves to assess their risk.
Until this point, the element has been discussed as a proof of principle. Still, in hypothesising the future application of The Notifier, this element would be best placed between neighbouring properties to be observed communally instead of household-specific, as through discussions with supervisors for this thesis, the staining that may pass onto other materials in the house would only cause further repair work following a flood.
Therefore, the standalone apparatus has been designed in numerous ways; firstly, it will stain at certain heights and strengths, showing the number of flood events; incidentally, of the materials selected, the erosion line found in the test samples shows flood height and, therefore, the narrower ribs of the design will erode to indicate maximum flood height clearly. The apparatus’s more prominent ribs and tapering are designed to correlate to the distance travelled by the copper sulphate pigment. Each peak of the undulation correlates to 1 flood event. The tapering accounts for the reduction in pigment as it gets further from the source. The apparatus is white in tone and made of plaster to ensure a high colour contrast to the staining blue copper sulphate.
A complementary user guide has been designed to help residents read the apparatus. Its format has been designed to be efficiently delivered to the site, pinned up as a poster, and folded again during a flood evacuation. On the poster are sections to record personal information, including emergency contacts, insurance policy number and contacts, and emergency evacuation kit list, as well as a separate section for recording further information correlating to the flood event, including start date, warning designation and duration.
The guide also contains further information for before, during, and after flood events generated from government and British Red Cross guidance. This includes what flood zones and flood alerts mean, a map of local flood zones to understand individual risk, procedures for preparing for flood events and recovering from floods, and a measurement tool that can be used to reference flood height within the property.
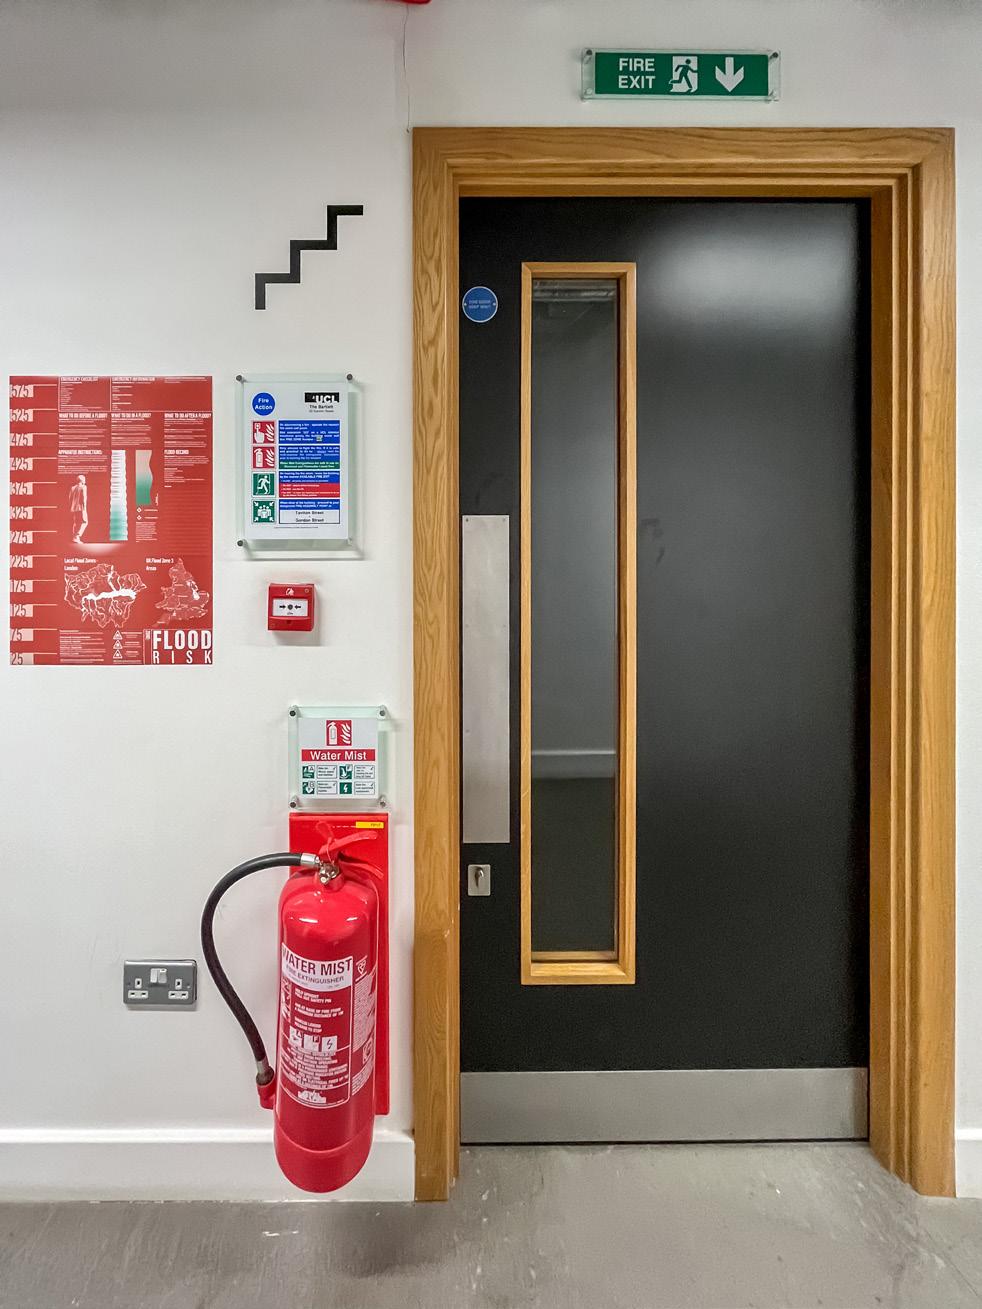
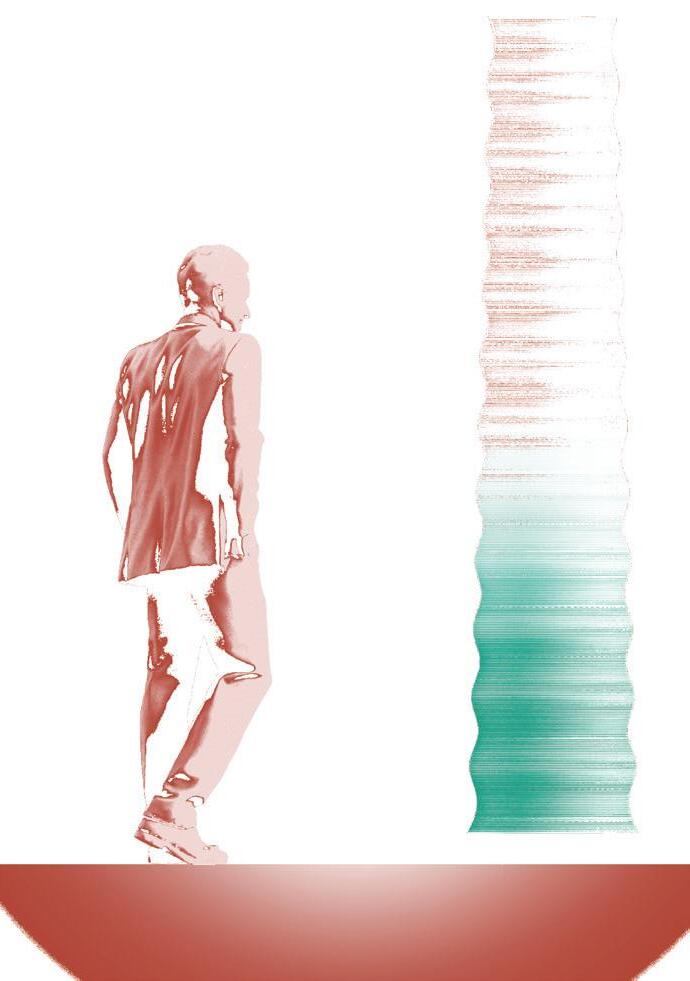

Agency, Environment. ‘Historic Flood Warnings’. Gov.uk. Environment Agency, 5 April 2024. Accessed1 April 2024https://www.data.gov.uk/dataset/d4fb2591-f4dd-4e7f-9aaf-49af94437b36/historic-floodwarnings.
Angelaka, Lila. ‘Engine Shed Guidance for Owners and Occupiers of Traditional Buildings’. Engine Shed, 30 September 2021. Accessed6 April 2024https://blog.engineshed.scot/2021/09/30/stormproof-your-historic-home/.
Anon. ‘5 Tips for Designing a Home in a Flood Plain’. Integrata Architecture + Construction, 22 January 2020. Accessed6 April 2024https://www.integrata-ac.com/news/5-tips-for-designing-a-home-inflood-plain.
———. ‘13. How Does Climate Change Affect the Strength and Frequency of Floods, Droughts, Hurricanes, and Tornadoes?’ Royal Society, March 2020. Accessed18 March 2024https:// royalsociety.org/topics-policy/projects/climate-change-evidence-causes/ question-13/#:~:text=A%20 warming%20atmosphere%20is%20also.
———. ‘Flood Basics’. NOAA National Severe Storms Laboratory. Accessed17 March 2024https://www.nssl.noaa.gov/education/svrwx101/floods/#:~:text=Floods%20 can%20occur%20within%20minutes.
———. ‘Flood Risk Assessment’. Earth Environmental & Geotechnical. Accessed4 March 2024https://www.earthenvironmental.co.uk/flood-risk-assessment/.
———. ‘How Do We Know Climate Change Is Happening?’ Imperial College London. Grantham Institute – Climate Change and the Environment. Accessed1 April 2024https://www.imperial.ac.uk/grantham/publications/climate-change-faqs/howdo-we-know-climate-change-is-happening/#:~:text=Human%20activities%20have%20 emitted%20increasing.
———. ‘Thames Water Tower - Thames Water TowerreForm Architects, London’. Reform Architects London. Accessed3 April 2024http://www.reform-architects.london/ projects/thames-water-.
Askham, Beth ‘Nature and Pollution: What Lichens Tell Us about Toxic Air’. Natural History Museum, 4 June 2020. Accessed6 February 2024https://www.nhm.ac.uk/discover/nature-and-pollution-whatlichens-tell-us-about-toxic-air.html.
Ayres, Jon, Jeremy Watson, Nick Reynard, Sotiris Vardoulakis, Mike Depledge, Mike Davies, Sarah Curtis, et al. UK Climate Change Risk Assessment 2017: Evidence Report Chapter 5: People and the built environment. Climate Change Committee. London: Climate Change Committee, 2016. Accessed4 March 2024https://www.theccc.org.uk/wp-content/uploads/2016/07/UK-CCRA-2017-Chapter-5People-and-the-built-environment.pdf.
BBC. ‘Climate Change: England Flood Planners “Must Prepare for Worst”’. Editorial. BBC News, 9 May 2019, sec. Science & Environment. Accessed4 March 2024https://www.bbc.co.uk/news/scienceenvironment-48206325.
———. ‘Farmers Urged by WWF to Do More to Prevent Flooding’. Editorial. BBC News, 29 January 2014, sec. Science & Environment. Accessed4 April 2024https://www.bbc. co.uk/news/science-environment-25931847.
———. ‘Plans for 500 Homes in Hereford Continue despite Flood Risk’. Editorial. BBC News, 6 January 2024, sec. Hereford & Worcester. Accessed5 April 2024https://www. bbc.co.uk/news/uk-england-hereford-worcester-67893166.
———. ‘Storm Franklin: How Do Flood Prevention Schemes Work?’ Editorial. BBC News, 22 February 2022. Accessed4 March 2024https://www.bbc.co.uk/news/uk-25929644. ———. ‘Test for Water - Chemical Analysis - (CCEA) - GCSE Chemistry (Single Science) Revision CCEA’. BBC Bitesize. Accessed17 March 2024https://www.bbc.co.uk/ bitesize/guides/zmbmrj6/revision/13#:~:text=When%20water%20is%20present%20in.
BBC Wales. ‘Flooding: Storm Dennis Is “a Taste of Things to Come” for Wales’. Editorial. BBC News, 2 March 2020, sec. Wales. Accessed4 April 2024https://www.bbc.co.uk/news/uk-wales-51631480. ———. ‘Storm Dennis: How Dangerous Is Floodwater?’ Editorial. BBC News, 18 February 2020, sec. Wales. Accessed19 March 2024https://www.bbc.co.uk/news/ uk-wales-51537884.
Bennett Oliver, and Sarah Hartwell-Naguib. Flood defence spending in England Parliament. uk. London: House of Commons Library, 19 November 2014. Accessed5 April 2024http:// researchbriefings.files.parliament.uk/documents/SN05755/SN05755.pdf.
Bevan, Sir James. ‘Defusing the “Weather Bomb”: The Future of Flood Defence’. Editorial. Gov.uk, 25 February 2020. Accessed26 February 2024https://www.gov.uk/government/speeches/defusing-theweather-bomb-the-future-of-flood-defence.
Black, Richard. ‘Flood Risk and the UK’. Energy & Climate Intelligence Unit, 11 February 2022. Accessed4 March 2024https://eciu.net/analysis/briefings/climate-impacts/flood-risk-and-the-uk.
Bracher, Jane. ‘This Is How Flooding Can Impact Our Health Wellcome, 19 May 2022. Accessed25 January 2024https://wellcome.org/news/how-flooding-can-impact-our-health.
Charles Gordon Smith, and Magdi M El-Kammash. ‘Nile River - Climate and Hydrology’. Encyclopædia Britannica, 22 January 2019. Accessed5 May 2024https://www.britannica.com/place/Nile-River/ Climate-and-hydrology.
Cloke, Hannah. ‘Housebuilding Ban on Floodplains Isn’t Enough – Flood-Prone Communities Should Take Back Control’. The Conversation, 27 February 2020. Accessed26 February 2024https://
theconversation.com/housebuilding-ban-on-floodplains-isnt-enough-flood-pronecommunities-should-take-back-control-132468.
Collins. ‘Analogue Definition and Meaning’. Collins English Dictionary. Collins. Accessed20 April 2024https://www.collinsdictionary.com/dictionary/english/analogue.
Committee, Member of the Climate Change. ‘National Audit Office Finds Evidence of Under-Investment in Flood Risk Management’. Climate Change Committee, 5 November 2014. Accessed24 March 2024https://www.theccc.org.uk/2014/11/05/national-audit-officefinds-evidence-of-under-investment-in-flood-risk-management/.
Coskun, Ozlem. ‘Separation Techniques: Chromatography’. Northern Clinics of Istanbul 3, no. 2 (11 November 2016): 156–60. Accessed22 April 2024doi:https://doi.org/10.14744/ nci.2016.32757.
Crichton, David. Flood Plain Speaking 3rd ed. 2012. Reprint, Chartered Insurance Institute, 2012. Accessed5 April 2024https://www.cii.co.uk/media/2233858/flood plain speaking 3rd ed.pdf.
Cruz, Joana, Piran C. L. White, Andrew Bell, and Peter A. Coventry. ‘Effect of Extreme Weather Events on Mental Health: A Narrative Synthesis and Meta-Analysis for the UK’. International Journal of Environmental Research and Public Health 17, no. 22 (1 November 2020): 8581. Accessed19 March 2024doi:https://doi.org/10.3390/ijerph17228581.
Dathan, Matt. ‘The Economic Cost of Flooding in Northern England Could Hit £6bn’. The Independent, 28 December 2015. Accessed4 April 2024https://www.independent.co.uk/ news/uk/politics/uk-flooding-economic-cost-of-storms-could-hit-ps6bn-industry-expertswarn-a6788316.html.
Davey, Melissa, ed. ‘Floods Linked to Increased Deaths from Heart and Lung Disease, Australian-Led Research Shows’. Editorial. The Guardian, 4 October 2023, sec. Australia news. Accessed4 April 2024https://www.theguardian.com/australia-news/2023/oct/05/ floods-linked-to-increased-deaths-from-heart-and-lung-disease-australian-led-researchshows.
Department for Communities and Local Government. National Planning Policy Framework. The National Archives. Department for Communities and Local Government, 27 March 2012. Accessed5 April 2024https://webarchive.nationalarchives.gov.uk/ ukgwa/20180608095821/https://www.gov.uk/government/publications/national-planningpolicy-framework--2.
Department for Levelling Up, Housing and Communities National Planning Policy Framework Gov.uk. Department for Levelling Up, Housing and Communities 20 December 2023. Accessed4 April 2024https://www.gov.uk/government/publications/ national-planning-policy-framework--2.
Dray, Sally. ‘Housing Developments on Functional Flood Plains’. Lords Library, 21 June 2021. Accessed26 February 2024https://lordslibrary.parliament.uk/housing-developments-onfunctional-flood-plains/.
Ebrary, Inc. Animals as Sentinels of Environmental Health Hazards Committee on Animals as Monitors of Environmental Hazards, Board on Environmental Studies and Toxicology, Commission on Life Sciences, National Research Council. Washington, D.C.: National Academy Press, 1991.
Environment Agency, and Department for Environment, Food & Rural Affairs. ‘Prepare for Flooding to Reduce Impacts on Mental Health’. GOV.UK, 21 January 2020. Accessed4 March 2024https://www.gov.uk/government/news/prepare-for-flooding-to-reduce-impacts-onmental-health.
Foresight Directorate. Foresight Future Flooding Executive Summary. Gov.uk. London: Foresight, 22 April 2004. Accessed5 April 2024https://assets.publishing.service.gov.uk/med ia/5a74c78de5274a3f93b48beb/04-947-flooding-summary.pdf.
Gill, Joanna. ‘Belgium: Floods Haunt Town as Rebuild Seeks to Stop Repeat Disaster | PreventionWeb’. Preventionweb, 11 July 2022. Accessed5 April 2024https://www. preventionweb.net/news/floods-haunt-belgian-town-rebuild-seeks-stop-repeat-disaster.
Grant, Katie. ‘10 Measures That Must Be Taken to Prevent More Flooding in the Future’. The Independent, 29 December 2015. Accessed31 March 2024https://www.independent.co.uk/ climate-change/news/10-measures-that-must-be-taken-to-prevent-more-flooding-in-thefuture-a6788866.html.
Historic England. ‘Protecting Your Home from Flooding and Flood Damage’. Historic England, 23 August 2023. Accessed24 April 2024https://historicengland.org.uk/advice/ your-home/flooding-and-older-homes/being-prepared-for-flooding/.
James, Alan. ‘How Long Does It Take to Dry out Water Damage?’ Dantherm Group, 30 August 2023. Accessed6 April 2024https://www.danthermgroup.com/en-gb/aerial/how-
long-does-it-take-to-dry-out-water-damage#:~:text=Increased%20ventilation&text=Anything%20 from%20opening%20windows%20in.
Johns, Daniel, Kathryn Humphrey, Ibukunoluwa Ibitoye, James Mabbutt, David Thompson, Alex Townsend, and Lola Vallejo. Managing climate risks to well-being and the economy. Adaptation Sub-Committee Progress Report 2014. The CCC. London: Committee on Climate Change 2014. Accessed5 April 2024http://www.theccc.org.uk/wp-content/uploads/2014/07/Final ASC-2014 webversion-4.pdf.
Kennett, Liz. ‘One in Thirteen New Homes Built in Flood Zone’. Aviva, 17 January 2024. Accessed26 February 2024https://www.aviva.com/newsroom/news-releases/2024/01/one-in-thirteen-newhomes-built-in-flood-zone/.
Khoo, Hock Eng, Azrina Azlan, Sou Teng Tang, and See Meng Lim. ‘Anthocyanidins and Anthocyanins: Colored Pigments as Food, Pharmaceutical Ingredients, and the Potential Health Benefits’. Food & Nutrition Research 61, no. 1 (13 August 2017): 1361779. Accesseddoi:https://doi.org/10.1080/16546628 .2017.1361779.
Kingsley, Thomas. ‘What the Tower Sitting in the Middle of Holland Park Actually Is’. My London, 8 July 2020. Accessed10 March 2024https://www.mylondon.news/news/west-london-news/what-thameswater-tower-sitting-18563000.
Lloyd, Matt. ‘Flooding: Calls to Stop Building Homes on Flood Plains’. Editorial. BBC News, 10 March 2020. Accessed31 March 2024https://www.bbc.co.uk/news/uk-wales-51712267.
LV. ‘How Can You Protect Your Home from Flooding?’ LV, 8 November 2023. Accessed26 February 2024https://www.lv.com/home-insurance/how-to-protect-your-home-and-prepare-for-flooding.
Martin, Laura. ‘What Is Efflorescence? How to Prevent It and Remove It?’ Nitterhouse Masonry Products, LLC, October 2019. Accessed6 April 2024https://www.nitterhousemasonry.com/blog/ what-is-efflorescence/.
Met Office. ‘Monthly, Seasonal and Annual Total Precipitation Amount for UK’. Metoffice. Met Office National Climate Information Centre, 1 April 2024. Accessed17 April 2024https://www.metoffice.gov. uk/pub/data/weather/uk/climate/datasets/Rainfall/date/UK.txt. ———. ‘UK and Global Extreme Events – Heavy Rainfall and Floods’. Met Office, 2022. Accessed4 March 2024https://www.metoffice.gov.uk/research/climate/understandingclimate/uk-and-global-extreme-events-heavy-rainfall-and-floods.
Millner, Martin. ‘Plans to Build over 5000 New Homes in Areas with High Flood Risk Approved’. LV, 5 October 2023. Accessed26 February 2024https://www.lv.com/home-insurance/new-homes-inflooding-areas.
NASA. ‘Global Surface Temperature NASA Global Climate Change’. NASA. NASA’s Goddard Institute for Space Studies (GISS), 2023. Accessed2 April 2024https://climate.nasa.gov/vital-signs/globaltemperature/?intent=121.
National Geographic Society. ‘Paleoclimatology’. National Geographic, 19 October 2023. Accessed3 April 2024https://education.nationalgeographic.org/resource/paleoclimatology-RL/. Newcombe, Grace. Plain dealing Building For Flood Resilience. Localis. Localis, 22 November 2021. Accessed5 April 2024https://www.localis.org.uk/wp-content/uploads/2021/11/042 Floodplains WebAWK.pdf.
O’Neill, Meaghan. ‘In the Venice Floods, a Lesson in Protecting Heritage Places’. Architectural Digest, 19 November 2019. Accessed6 April 2024https://www.architecturaldigest.com/story/venice-floodimplications.
Oliver, Isabel. The English National Study of Flooding and Health Summary of the evidence generated to date. Gov.uk. London: Public Health England March 2020. Accessed3 April 2024https://assets. publishing.service.gov.uk/media/5e6bb75fd3bf7f2695546ba8/Summary of findings NSFH January 2020 Final for DsPH 3 .pdf.
Pickles, David. Flooding and Historic Buildings 2nd ed. 2010. Reprint, Historic England, 2015. Accessed21 January 2024https://historicengland.org.uk/images-books/publications/flooding-andhistoric-buildings-2ednrev/.
Rotton, Tracy. ‘Western European Flooding’. Center for Disaster Philanthropy, 31 August 2021. Accessed5 April 2024https://disasterphilanthropy.org/disasters/western-european-flooding/.
Rowlatt, Justin. ‘Thousands of Homes to Be Built in Flood Zones’. Editorial. BBC News, 15 November 2019. Accessed31 March 2024https://www.bbc.co.uk/news/science-environment-50419925.
Schreiber, Henry. ‘Curious Chemistry Guides Hydrangea Colors’. American Scientist, 6 February 2017. Accessed6 February 2024https://www.americanscientist.org/article/curious-chemistry-guideshydrangea-colors.
Seabrook, Victoria. ‘Flood Risk Increased with New Housing Built without Defences in Vulnerable Areas, MPs Warn’. Sky News, 17 January 2024. Accessed24 April 2024https://news.sky.com/story/
flood-risk-increased-with-new-housing-built-without-defences-in-vulnerable-areas-mpswarn-13049616.
Stoller-Conrad, Jessica. ‘Tree Rings Provide Snapshots of Earth’s Past Climate – Climate Change: Vital Signs of the Planet’. NASA, 27 January 2017. Accessed1 April 2024https:// climate.nasa.gov/news/2540/tree-rings-provide-snapshots-of-earths-past-climate/.
The Construction Centre. ‘Repairing Flood Damaged Property Flood Advice’. The Construction Centre. Accessed6 April 2024https://www.theconstructioncentre.co.uk/ flood-advice/repairing-flood-damaged-property.html#:~:text=Wet%20brickwork%20is%20 susceptible%20to.
Wienerberger. Technical Guidance - Brickwork Dimensions Table - Standard UK Brick. Wienerberger. Wienerberger, April 2021. Accessed6 April 2024https://www.wienerberger. co.uk/content/dam/wienerberger/united-kingdom/marketing/documents-magazines/ technical/brick-technical-guidance-sheets/UK MKT DOC Brickwork%20Dimension%20 Tables.pdf.
Williams, Jeremy. ‘Five Ways to Build a Flood Proof Home’. The Earthbound Report, 8 January 2016. Accessed6 April 2024https://earthbound.report/2016/01/08/five-ways-tobuild-a-flood-proof-home/.
Yari, Arezoo, Abbas Ostadtaghizadeh, Ali Ardalan, Yadolah Zarezadeh, Abbas Rahimiforoushani, and Farzam Bidarpoor. ‘Risk Factors of Death from Flood: Findings of a Systematic Review’. Journal of Environmental Health Science and Engineering 18, no. 2 (24 July 2020): 1643–53. Accessed19 March 2024doi:https://doi.org/10.1007/s40201-020-00511-x
Figure 01: Staining apparatus. Submitted as part of design studio portfolio. (Smallwood, B., 2024)
Figure 02: Evacuating from Cumbria’s record floods in 2015. (Humphreys, O., 2015) Available at: https://edition.cnn.com/2015/12/07/europe/uk-flooding/index.html(First Accessed 18/04/2024)
Figure 03: UK Flood alert symbol, Flood warning symbol, Severe flood warning symbol. (anon, n.d.) Available at: https://patch.com/new-york/larchmont/calendar/event/20230912/2d958e64-5d6c4dd8-9d89-c0f4e8129eac/local-summit-sept-12-program-rising-waters-managing-personal-flood-risk (First Accessed 01/04/2024)
Figure 04: Naturally meandering river. (anon., n.d.) Available at: http://www.huntlearning.org.uk/ RiverDee/meandersmore.html (First Accessed 18/04/2024)
Figure 05: Straightened river through agricultural fields. (photocritical., 2023) Available at: https:// theconversation.com/we-have-forgotten-what-a-natural-river-even-looks-like-206443 (First Accessed 18/04/2024)
Figure 06: Land-Ocean Temperature Index graph (Smallwood, B., 2024) Data available at: https:// climate.nasa.gov/vital-signs/global-temperature/?intent=121 (First Accessed 02/04/2024)
Figure 07: Flood alerts to days in a year ratio. (Smallwood, B., 2024) Data available at: https://www. data.gov.uk/dataset/d4fb2591-f4dd-4e7f-9aaf-49af94437b36/historic-flood-warnings (Environment Agency, 2024) (First Accessed 01/04/2024)
Figure 08: Average flood alerts per month, 2006 - 2024. (Smallwood, B., 2024) Data available at: https://www.data.gov.uk/dataset/d4fb2591-f4dd-4e7f-9aaf-49af94437b36/historic-flood-warnings (Environment Agency, 2024) (First Accessed 01/04/2024)
Figure 09: Flood alerts per area in the UK. (Smallwood, B., 2024) Data available at: https://www. thomsonec.com/news/high-flood-risk-areas-and-flood-mitigation-in-england/(Environment Agency, 2024) (First Accessed 01/04/2024)
Figure 10: Flood warning designations 2011- 2024. (Smallwood, B., 2024) Data available at: https:// www.data.gov.uk/dataset/d4fb2591-f4dd-4e7f-9aaf-49af94437b36/historic-flood-warnings (Environment Agency, 2024) (First Accessed 01/04/2024)
Figure 11: Greater London flood map overlayed with development areas. (Smallwood, B., 2024) Data available at: https://apps.london.gov.uk/planning/ (First Accessed 05/04/2024)
Figure 12: The under construction Glasdir estate flooded in 2012 (anon., 2012) Available at: https:// www.bbc.co.uk/news/av/uk-21292631 (First Accessed 18/04/2024)
Figure 13: Broad map of flood zone 3 areas in England. (Smallwood, B., 2024) Data available at: https://www.newscientist.com/article/mg22129572-800-uk-must-abandon-or-adapt-in-face-offloods/ (The Environment Agency., n.d.) (First Accessed 02/04/2024)
Figure 14: Temporary flood warning sign positioned on road. (Shutterstock, n.d.) Available at: https:// blog.metoffice.gov.uk/2022/01/17/scientists-call-for-research-to-rise-to-the-challenge-of-hill-events/ (First Accessed 30/01/2024)
Figure 15: Start of repairs post flood damage including mould growth. (Boucher, J., 2020) Available at: https://pulitzercenter.org/stories/hurricanes-repeatedly-devastate-sc-town-leaving-stinking-threatbehind-mold (First Accessed 23/01/2024)
Figure 16: Drone footage of the flooding extent at Charlecote Park 2024. (Plester, A., 2024) Available at: https://www.bbc.co.uk/news/uk-england-coventry-warwickshire-67968697 (First Accessed 07/03/2024)
Figure 17: How far up the walled garden steps the flood waters came 2024. (Watson, R., 2024)
Figure 18: Nilometer, Egyptian device to measure height of the Nile and warn of drought and famine. (Baldiri, 2008) Available at: https://www.atlasobscura.com/places/nilometer (First Accessed 22/04/2024)
Figure 19: Flood level gauge. (iStockPhoto., n.d.) Available at: https://www.abc.net.au/science/ articles/2010/08/13/2982394.htm (First Accessed 22/04/2024)
Figure 20: Coal miner holding canary in a cage following shift in mine. Canaries were used between 1911 and 1986 in the UK. (anon., n.d.) Available at: https://www.forbes.com/sites/ oreillymedia/2015/01/13/who-needs-rebels-at-work/ (First Accessed 09/12/2023)
Figure 21: Effloresence on wall (anon., n.d.)Available at: https://www.thehomeinspectionhub.com.au/ what-is-efflorescence-and-is-it-serious/ (First Accessed 18/04/2024)
Figure 22: Thames water tower (anon., n.d.) Available at: http://www.reform-architects.london/ projects/thames-water-tower/ (First Accessed 04/04/2024)
Figure 23: Cloud formations diagram over Palermo, extracted from Google Earth data. Submitted with design studio portfolio. (Smallwood, B., 2024)
Figure 24: Strata. (Silver, J., 2012) Available at: https://www.justinsilver.com/travel/puconhiking/ (First Accessed 03/03/2024)
Figure 25: Tree rings. (anon., n.d.) Available at: https://www.timberstonepartners.com/ contact (First Accessed 03/03/2024)
Figure 26: Red sky. (anon., n.d.) Available at: https://www.pinterest.co.uk/ pin/18718154680467982/ (First Accessed 09/12/2023)
Figure 27: Ice Core. (Waszkiewicz, M., 2014) Available at: https://www.climate.gov/newsfeatures/climate-tech/climate-core-how-scientists-study-ice-cores-reveal-earths-climate (First Accessed 03/03/2024)
Figure 28: Hydrangea. (Shutterstock, n.d.) Available at: https://plantura.garden/uk/treesshrubs/hydrangeas/blue-hydrangeas (First Accessed 09/12/2023)
Figure 29: Leachates. (Santos de Almeida, W., n.d.) Available at: https://www.azom.com/ news.aspx?newsID=57918 (First Accessed 09/10/2023)
Figure 30: Damp board formed concrete at Scarpa building Palermo. (Smallwood, B., 2024)
Figure 31: Drought stone. (Gross, Dr. B., n.d.) Available at: https://arstechnica.com/ science/2022/08/viral-hunger-stones-tweet-left-out-context-original-story-was-from-2018/ (First Accessed 12/10/2023)
Figure 32: Acid rain erosion of statue. (Schmidt-Thomsen., 1969) Available at: https://www. thedailystar.net/news/sustainer-of-life-or-angel-of-death (First Accessed 08/04/2024)
Figure 33: CuSO4 Powder in water presence test. (Sciencephotlibrary., n.d.) Available at: https://www.sciencephoto.com/media/4739/view/adding-water-to-copper-sulphate (First Accessed 30/01/2024)
Figure 34: Nottingham war memorial gardens. Limestone monument stained wirh copper sulphate run off from the bronze plack. (Smallwood, B., 2021)
Figure 35: 5 piece plywood and parcel tape mould used to replicate cast size during experiments. (Smallwood, B., 2024)
Figure 36: Equipment setup diagram. (Smallwood, B., 2024)
Figure 37: Using a digital laser thermometer to monitor the temperature of the water and samples throughout the experiment. (Smallwood, B., 2024)
Figure 38: Ruler to check consistent 30mm water depth. (Smallwood, B., 2024)
Figure 39: Spread of apparatus and test samples used within the experiments. (Smallwood, B., 2024)
Figure 40: Inserting control test into the water. (Smallwood, B., 2024)
Figure 41 - 44: Process of casting sample 07. (Smallwood, B., 2024)
Figure 45 - 48: Forming sample 07 Measuring copper sulphate powder, nucleus of copper sulphate powder in centre of mould, completed cast. (Smallwood, B., 2024)
Figure 49: Alginate mould for Anthocyanin concentrate cubes. (Smallwood, B., 2024)
Figure 50: Spread of test samples. (Smallwood, B., 2024)
Figure 51: Comparative test samples with start and end CMYK colours. (Smallwood, B., 2024)
Figure 52: Comparative test samples with start and end CMYK colours. (Smallwood, B., 2024)
Figure 53: Test sample 04A after drying. (Smallwood, B., 2024)
Figure 54: Test sample 08A after drying. (Smallwood, B., 2024)
Figure 55: Sample 03 composition. (Smallwood, B., 2024)
Figure 56: Sample 03 experiment hypotheses. (Smallwood, B., 2024)
Figure 57: Sample 03A dried. (Smallwood, B., 2024)
Figure 58: Selection of images showing the change in stain size and colour over the cycles of saturation on sample 03. (Smallwood, B., 2024)
Figure 59: Chromatography samples of pigment movement. (Sciencephotlibrary., n.d.) Available at: https://edu.rsc.org/ideas/5-ways-to-teach-paper-chromatography/4016117.article (First accessed 22/04/2023)
Figure 60: Analysis of sample 3 spread of pigment over the 4 saturation cycles. (Smallwood, B., 2024)
Figure 61: Test sample 07A after fully drying and one saturation of 24 hours. (Smallwood, B., 2024)
Figure 62: Selection of images showing the change in stain size and colour over 4 cycles of saturation on sample 07. (Smallwood, B., 2024)
Figure 63: Gradient change in colour across saturation cycles of sample 07. (Smallwood, B., 2024)
Figure 64: Change in C and K colour values across the saturation cycles of sample 07. (Smallwood, B., 2024)
Figure 65, 66: comparison in crystalline residue on samples 3D and 7D through macro lens. (Smallwood, B., 2024)
Figure 67: Completed notifier user guide in location with other required safety documentation in public building. (Smallwood, B., 2024)
Figure 68: Completed notifier user guide. (Smallwood, B., 2024)
Experiment results and contact sheets
Anthocyanin (13mm base)
Split line between Anthocyanin cast and plaster cast.
Anthocyanin (10mm centre)
Cast Deformed (didn’t fill mould to edges).
No change in colour but expect parts to flake off with signs of erosion.
No change from original.
Expect blue staining to spread upwards through capillary action. Erosion to base following control sample 1a. Potential erosion at centre due to void from copper sulphate. Complete blue staining at top of block. Overall light blue staining.
Consistent blue staining around from bottom to top. Mainly staining gradient on sides with little staining on base. Potentially 2 layers split due to erosion.
Expect the plaster to stain faintly, the corners will not stain, the staining will faintly discolour the sides but mainly on top, will become more visible with more flood events.
Anthocyanin (20ml mixed)
Reduced significantly when casting. The sample block had different tone when tapped giving higher pitch resonance.
(50g Mixed)
Will potentially become fainter in colour under the saturation line. Their may be more substantial erosion to the area under the water line.
3mm above submersion line. Dark water line approx 3mm above submersion line.
Slight orange staining on edges.
No change.
Dark water line approx 3mm above submersion line.
Central area previously vivid blue is now fading. Stains becoming stronger and more full on sides, unrecognisable colour change on top.
Pigment spreading further through the material and becoming faded due to dilution amongst the material.
Light orange staining around edges and corners of block.
No change.
No visible change.
Plaster particles floating in water. Made water cloudy.
White crust on corners, oily residue left in water.
Stain has become more full and uniform in tone across the area but hasn’t appeared to have grown further. One corner has turned green.
Observations
After Washing
Signs of erosion below water line, thin layer appears rough and bubbly. 2 water lines visible.
Observations
After Dried
On close inspection capillary routes vertically have eroded and have become exposed approx 3mm above water line.
Water line visible but no wear visible as in plaster sample.
Light but noticeable efflorescence above water line and bleached like discolouration at centre of top surface. No change below water line.
The staining has moved vertically leaving a cross shaped form on the top surface, this is likely due to the corners being the furthest points from the concentration of CuSO4. Similar erosion to sample 1a.
The stained cross pattern has grown filling closer to the corners as the sample has dried, some light staining below the water line but mostly above. In drying the staining became darker.
Water absorbed slowly therefore could be more accurately related to severe flood events and less effected by ambient moisture and rainfall than other materials. Will not be effected in texture in solid form by flood water in smaller timescales eg. Up to 10years. wanting texture to change composition of form will need to be changed to layers with soluble membrane for example. Potentially salt migration maybe more easily visible? Texture changes up to 1mm and discolouration at edges potentially due to impurities in water at casting and testing. Maybe more effected by polluted flooding due to differences in acidity etc. potential discolouration from flood water may overcome pigmentation. Further experiment could involve inserting Epsom salt within the cement sample instead of pigment and exploring the transformation this causes.
The area of the pigment may need to be lowered in the sample to understand if the lack of staining on the lower half is due to the placement of the pigment movement of water and the area submerged in water. A way of creating solid dimension of the CuSO4 will help further experiments. A larger sample size may help to understand the extent the stain travels within the material.
Spreading colour in water only visible at level angle. Stained base is becoming fainter.
No visible change.
Further fading of stained base with colour in water spreading
No visible change.
No visible change in sample pigment, further dispersion of colour in water. Corners and edges have started to become noticeably orange.
No visible change.
Water has become murky and green in tone, making observations of pigment difficult. The top edges and corners of the sample have become orange.
Faint orange residue on submerged half of sample.
Same vertical markings as sample 1A visible.
Light dotted pigmentation visible on side surfaces.
Previously mentioned orange residue washed off easily.
There was little change apart from in the centre at the top there was an orange stain. Unusually not on the edges, leading me to think that some pigmentation has moved through the sample.
There was virtually no visible movement of pigment upwards in the material over 24 hours, however the water surrounding was heavily dyed. The experiment could be replicated upside down to understand if the pigment is too heavy for water too carry or if the water simply washes the pigment from the plaster. After drying the different materials broke away from each other cleanly into 2 pieces.
Suggest for the next sample to use a stronger concentration or more pigment and submerge the existing sample at least one more time to see there is any change.
(20g
Cast Deformed (didn’t fill mould on edges or to top). The mixed compound exhibited weaker structural properties crumbling when roughly handled. Large air bubble in one side.
Will become darker in water and potentially become darker under water line following drying. Similarly to plaster samples the base may exhibit signs of erosion due to its weaker structure.
The salt was put in the top third of the cast to see the efflorescence is visible below or if the salt will only travel up, signs will be visible quickly and get more severe with drying and repetition, especially around imperfections.
Area beneath the saturation will stain darker, signs of erosion to base will begin to show.
Area of crystalline residue will significantly grow.
Denser accumulation of crystals around deformed areas and corners.
No change. Became darker, green hues once fully saturated.
No visible change.
Water becoming murky.
changes.
No visible change.
Oily residue on top of water, no change to sample block. No visible change.
No visible change.
Base crumbled heavily in washing.
Drying has caused little change, there is a slight orange stain on the top surface.
There was no bluish run off as cabbage sample 4A. Suggest not to run this sample again as there was no visible staining due to the cement being too dark originally and the weakness of the sample.
No visible change.
Material came off in washing but no visible signs of erosion on sample block.
Water mark very visible from below saturation level.
After drying a darker area at the base of the sample was visible, this was the area that was submerged. Little to know signs of erosion other than when knocked, potentially the sample has became weaker but not eroded. would be interesting to see the submerged area becomes darker following more submersions, maybe the water being at different level would illustrate this more clearly.
Saturation time is estimated as colour change indicating saturation was not strong enough to notice visibly, therefore when moisture was noticed on top.
Became darker with saturation, no other changes. ***Unable to record***
Water became cloudy quickly.
Further clouding of water, no visible change in sample.
Water is now translucent, obscuring visibility. Slight signs of salt appearing.
Contamination of water has settled, signs of crystalline residue left on side faces.
No visible change.
The moisture began to dissolve the salt residue on the outside of the sample.
No visible change.
No visible change.
No visible change.
No visible change.
Existing salt residue has further dissolved.
Visible water line, no visible sign of erosion.
No washing on additional saturation cycles to avoid affecting staining patterns.
Salt residue marks became stronger with drying. Light salt residue around edges.
Up to 48 hours drying time the unsaturated half remained visibly darker than the base. 72 hours of drying reversed the contrast leaving the base darker. Crystalline residue starting to form on top edges.
Water surrounding has become cloudy but less than in test 8a. Slight spreading out of salt residue marks.
Faded base below water saturation line. Salt residue became stronger but didn’t spread visibly.
A visible water mark was left at the area submerged. The efflorescence had definitely ascended outwards and up but little to no change below the area with salts. Potentially taller sample could be explored with the salt deposit lower in the sample to see how far the efflorescence would travel.
Due to the divider between samples not being water tight there may have been some transmission of the salt from sample 08B into 07B. Following this set of experiments will make sure to not include the salt sample with non salt samples to see this crystalline residue grows. Tests on this sample to continue to see if changes in colour will continue.
Decided to stop further experiments with this sample as the change was not significant enough to illustrate number of flood events and would most likely wash off in rain if implemented into physical product.
Blue staining will visibly grow in strength and spread further from nucleus, do not expect staining to spread below saturation line.
Expecting blueish / purple staining to start to appear on sides from concentrated nucleus.
Expect blue staining to spread closer to edges and on top almost fill the surface. Existing crystal build up will become more dense.
Expect base to become darker once again and the white crystal build up to potentially become more wide spread but less dense.
The blue staining will continue to spread further but the strength of the colour will start to fade.
Stronger contrast between the sides saturated and not. Further spread and clarity of the crystalline residue.
Fizzing bubbling as water entered the sample.
Bubbling as 03B when placed in water. No changes.
Small dust sized grains of the sample came of into the water when submerged.
Contrast in staining becomes weaker.
No visible change.
Blue stain became visibly more vivid.
No visible change.
Staining has become darker from moisture.
White crystalline residue is no longer white with saturation but physical crystals remain.
Further fading of colour.
Orange staining on edges and corners.
Stain has spread slightly and become more faint, crystals have become less defined.
No visible change.
No visible change.
No visible change.
No visible change.
No visible change.
Stain has become more faint.
No visible change.
Crystals becoming less clear. Staining has become faded.
No visible change.
Potentially some spreading of pigment. Crystals starting to form in an arc form on side face, originally darker stained area.
No visible change.
Stain has become more faint.
No visible change.
Further fading of the stain.
No visible change.
More consistent and stronger colour in original stained area. More crystalline build up.
No visible change.
Crystals have grown in size and area whilst the stain has continued to fade.
Further crystal growth seems to have occurred but will become more apparent in drying.
Staining has become darker.
No visible change.
Significantly visible erosion to area below water line. Orange staining on edges and corners has become darker but not spread.
Stain has grown and returned to more vivid colour, the staining has seemed to have sunk to the water line and not progressed below it. Crystals have grown in size but have lost some the strength in their colour. Similarly to 07B the staining changed between 48hr drying and 72hr drying time. Further contrast between top and bottom of water line with significant growth in area and strength of crystals.
The staining is growing in shape and strength with every cycle. Seeming to get lighter when saturated and more intense with drying, the crystals were unexpected but the growth expect to continue. would be interested to see a further test with the pigment placed in an area under the water line within the sample to see if there is any difference in staining pattern. Continue with this sample through more saturation cycles to see this growth continues. As their has been no change in the pigment of the test expect there will be no further change no matter the number of saturation cycles therefore the conclusion was made to stop testing samples with Anthocyanin.
The formation of crystals on the latest test leads me to assume that the crystals on test 07 maybe from the copper sulphate and not transmission of the Epsom salt between samples. The changes in staining is beginning to be more a redistribution of the surface pigmentation and not a further increase in strength or area. The drop in pigment towards the water line is interesting and would be interesting to see it continued in drying and the next cycle. The crystals have significantly grown in areas and strength making it seem now that the crystals are from the copper sulphate being anhydrous hence their colour being white not blue. This maybe because they are now finer than the original powder and therefore retain moisture less. Further submersion tests should be conducted to see if colour contrast continues to grow and test if this is due to darkening base or fading top.