35 minute read
Coral Cover and Algae Growth Along a Water Quality Gradient in Moorea, French Polynesia Savannah Stu
Coral Cover and Algae Growth Along a Water Quality Gradient in Moorea, French Polynesia
BY SAVANNAH STURLA
Advertisement
RESEARCH SPONSOR (PI): BRENT MISHLER
ABSTRACT
As climate change and anthropogenic perturbations cause dramatic shifts in coral reef ecosystems, it is of increasing importance to understand corals’ tolerance, response, and adaptation to a combination of stressors. Nutrient enrichment increases the sensitivity of corals, making them more prone to bleaching from thermal stress. In Moorea, French Polynesia, Cook’s Bay is more developed and potentially more impacted by nutrient runoff from sewage and agriculture than its neighbor, Opunohu Bay. To assess the ecological gradient and level of human disturbance along these two central bays in Moorea, this study surveyed coral diversity by genera, percent coral cover, percent bleached coral cover, macroalgae cover, and nutrient-treated coral transplants in five sites surrounding the two bays. The site in between the two bays was the most ecologically diverse and rich, significantly differing from the Cook’s Bay sites as it had a greater average total coral cover. When Pocillopora verrucosa fragments were transplanted to each of the varying environments at the sites, in which some were treated experimentally with a nutrient diffuser at a different field-site prior to this study, treatment transplants experienced more bleaching than the control. This study supports previous research surrounding anthropogenic nutrient enrichment and its effects on coral reef ecosystems, while exploring the complex interactions among the various factors that impact coral resilience in an isolated island barrier reef.
Major, Year, and Department: Environmental Science; Undergraduate Senior; Department of Environmental Science, Policy, & Management
INTRODUCTION
As anthropogenic climate change alters conditions in natural environments via rising global average temperatures and ocean acidification, species distribution, functional traits, and biodiversity are threatened within ecosystems.1 Modern rates of climate change are more severe than previously recorded in global history.2 Under such dramatically shifting environmental conditions, certain organisms express a greater sensitivity to climate stress due to a combination of other environmental factors.3 As a result, competitive interactions and spatial partitioning shift accordingly.4 Disproportionate abilities to tolerate a combination of stressors are also expressed within one species.5 Small islands are specifically vulnerable to climate change—in conjunction with such human disturbances—due to their isolation, exposure to unpredictable weather, and dependence on the surrounding ecosystems.6
Coral reefs are culturally, ecologically and economically important ecosystems in small islands. Coral reefs make up the most productive and biodiverse marine ecosystems, providing a habitat for more than a quarter of all marine species.7 In addition, coral reefs are important in the atmospheric carbon cycle and protect coastlines from flooding and erosion.8,9 They also hold important economic value for coastal populations, as goods derived from coral reef ecosystems are estimated to be worth over $20 trillion U.S. dollars annually.7 While environmental fluctuations are a normal feature of the coral reef environment, drastic increases in ocean temperature and ocean acidification place stress on coral reefs, causing increased coral bleaching.10 Although coral bleaching events occur naturally and corals can recover their photosynthetic endosymbionts, bleaching events are becoming abnormally frequent and devastating to coral reefs due to climate change. In combination with local stressors, these events can result in both decreased live coral cover and coral diversity.11
Despite their economic, environmental, and cultural importance, coral reefs have recently faced a tremendous amount of physiological stress from a rapidly changing climate in conjunction with human perturbation.10 Other environmental conditions can increase susceptibility to bleaching from thermal stress. One important factor is nutrient enrichment from anthropogenic sources in these otherwise oligotrophic (or low nutrient) coral reef environments.3 Additionally, dissolved inorganic nutrients, such as nitrate, nitrite, phosphates, can impede coral growth and
functioning, as well as increase the severity of multiple diseases in corals.12,13,14 At a local scale, with decreased coral cover on predominantly conglomerate rock barrier reefs, coral-algal shifts are a growing concern—with increased coral bleaching and disease, macroalgae colonizes dead coral as a substrate and can dominate over coral recovery.15 But still unknown is whether corals can adapt to non-oligotrophic environments and how quickly coral reefs can recover from the ramifications of climate change.
The coral reef ecosystems in Moorea, French Polynesia provide a unique opportunity to investigate coral resilience. In particular, the two major bays on the north side of the island, Cook’s (Paopao) Bay and Opunohu Bay vary greatly and provide semi-natural experimental conditions. The differences in development surrounding each bay expose the coral reefs to different environments. Although Opunohu Bay has a nearby coastal shrimp farm and agricultural school, Cook’s Bay is more developed with more housing, pineapple plantations, and watershed pollution.16 These differences affect nutrient inputs to the nearby marine ecosystems via agriculture and sewage. Previous studies have compared the coral communities in these two bays, examining the greater presence of the disease Porites trematodias, a coral disease specific to Porites coral from a parasitic flatworm which reduces growth and reproduction, in Cook’s Bay in comparison to Opunohu Bay.17, 18 Another study has investigated the water discharge and suspended sediments in each bay, yet this study was conducted 27 years ago when land development in surrounding areas was much lower.19 These differences provide a way to investigate the impacts of different nutrient inputs on the species distribution and the state of the corals.
This study aims to understand the role of nutrient inputs on coral recovery following bleaching. This was accomplished by evaluating coral recovery, coral and algae cover, and coral diversity on the barrier reefs between Cook’s Bay and Opunohu Bay, after a recent bleaching event in May of 2019. Location relative to land development and sources of nutrient pollution was used to make predictions about differences in water quality in the field surveys and transplant studies. Previous work has suggested that water quality is poorer in Cook’s Bay than Opunohu Bay and relatively intermediate in between the two; therefore, I expected Cook’s Bay to have less abundant and less diverse coral cover in comparison to Opunohu Bay. Additionally, I hypothesized the visual severity of bleaching and macroalgae cover in relation to coral cover would be greater in Cook’s Bay. Finally, I predicted coral transplants placed in Cook’s Bay would exhibit poorer survival and growth in comparison to coral transplants in Opunohu Bay, but those with a history of nutrient exposure may be more tolerant to adapting to environmental changes.
METHODS
Study site
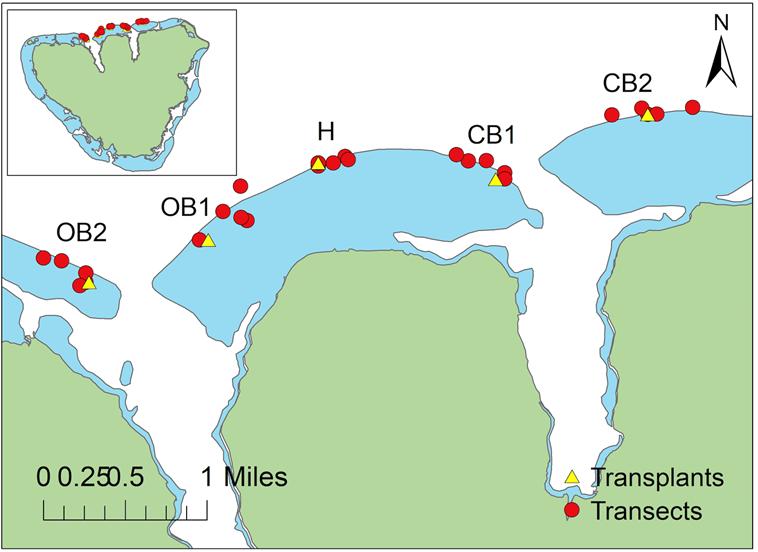
This study surveyed sites on the east and west sides of Opunohu Bay and Cook’s (Paopao) Bay, along with an intermediate site in between the two bays, in Moorea, French Polynesia. The study sites were examined from October 8th, 2019 to November 12th, 2019. GPS coordinates were recorded at the start of each transect using the
Figure 1. Locations used in this study in Moorea, French Polynesia.
Yellow triangles represent coral transplant locations, while the red dots represent transect locations. Specific coordinates can be found in the Appendix (Table A1 and Table A2, Appendix A). CB1 is Cook’s Bay site 1, CB2 is Cook’s Bay site 2, H is the intermediate/Hilton site, OB1 is Opunohu Bay site 1, OB2 is Opunohu Bay site 2. Map was created in ArcGIS.20
phone application Altimeter (Table A1, Appendix A). The various sites were denoted respectively as Opunohu Bay site 2, Opunohu Bay site 1, Cook’s Bay site 1, Cook’s Bay site 2, and the Hilton site (Figure 1).
Coral and algae: Survey methodology.
A total of 25 survey locations were selected randomly at each site. Two-stage sampling was used at each site, by first setting a tenmeter transect tape and then collecting data at every meter along the transect using a 0.5 x 0.5 meters square quadrat. The quadrat was held at bent arms-length, while snorkeling at the water surface. The quadrats were submerged approximately 0.5 meters under the water surface and assessed from above the water surface. Quadrats were divided into 25 smaller squares using fishing line, with each square representing four percent cover. Approximate cover of coral to algae was assessed using these squares. Due to three-dimensional space, the cover per quadrat does not add up to 100 percent solely based on the 25 surface level square quadrants. Percent cover was recorded with respect to approximate percentages in three dimensions, examining the coral coverage in spaces extending downwards in addition to visualizing the percent coverage from above. The quadrat square percentages were used to measure both corals parallel and perpendicular to the water surface throughout smaller crevices in the entire column of space below the quadrat.
Fleshy macroalgae cover was also assessed using the same method within the same quadrats. Only the percent cover of Turbinaria ornata and Sargassum muticum were recorded (Figure A14, Appendix A). As a result of the quantification methods using the quadrat explained previously, coral and algae percent coverage do not sum to 100 percent.
Coral and algae: Genera identification.
Corals were identified by genus, using identification references and Moorea coral resources from Dr. Peter J. Edmunds with the California State University Northridge Moorea Coral Reef Long
Site Shannon-Weiner Simpson’s Richness
CB1 1.485 0.627 3.2 CB2 2.427 0.875 5.6
H 2.540 0.876 7.6 OB1 2.493 0.884 6.4 OB2 2.516 0.885 7.0
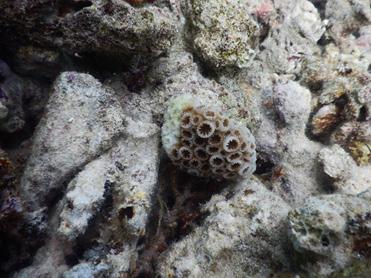
Term Ecological Research Site (Becker, D., personal communication, October 22, 2019).21 Within each genus observed, corals were categorized into ‘normal’, ‘partially bleached’, or ‘bleached.’ Normal coral cover was considered to be corals with enough zooxanthellae symbionts to have a visible color. Partially bleached corals were identified as any coral that showed bleaching (Figure A16, Appendix A), typically around the edges, yet still retained notable coloring from their symbionts. Bleached corals were considered to be corals that were fully bleached, with no detectable coloring (Figure A17, Appendix A). Photos showing examples of corals in each category were taken using a Nikon Coolpix camera.
Coral and algae: Statistical analysis.
The Shannon-Wiener index, Simpson index, and a richness count (the number of species present) were calculated in R as implemented in RStudio at the transect level and averaged to get indices for each site.22,23,24,25,26,27,28 These indices were chosen because they are very commonly used to quantify ecological diversity, yet they emphasize different aspects of measuring diversity. The Shannon-Wiener index weighs species richness and evenness (the distribution of species), while the Simpson index calculates the likelihood of different species occurring and is more impacted by the most dominant species. The equations for the Shannon-Wiener and Simpson indices, respectively, are as follows.29,30


The relationship between average coral cover and average macroalgae cover per transect was quantified using a linear regression model.23,24,25,31,32 Pairwise least-square means comparisons used to compare sites for relationships with average macroalgae cover per transect.33,34,35,36 A linear mixed model was used to test if the total average coral cover per transect varied by site location, utilizing pairwise least-square means comparisons to compare sites.33,37,38,39,40 To see if the proportion of the transect averages of bleached and partially bleached coral cover to the total coral cover varied due to site location, a general linear model with a quasibinomial family was used to make pairwise least-square means comparisons to compare
Table 1: Shannon-Weiner indexes, Simpsons indexes and richness counts calculated by location by averaging indexes calculated at the transect level (CB1 is Cook’s Bay site 1, CB2 is Cook’s Bay site 2, H is the intermediate/Hilton site, OB1 is Opunohu Bay site 1, OB2 is Opunohu Bay site 2).
and contrast sites.23,24,25,31,32,33,34,35,36,37,38
Coral transplants: Nutrient enrichment.
Finally, in addition to the field study exploring coral cover and dominant macroalgae cover, an experiment was also performed to explore resilience following nutrient enrichment. Six coral transplants were placed at each of the five study sites (Figure 1). These Pocillopora verrucosa fragments were obtained from Danielle Becker, working with the Northridge MCR LTER lab, and were initially growing on the east side of Cook’s Bay on the fore reef (Becker, D., personal communication, October 22 – December 6, 2019). Control Pocillopora verrucosa were located within the same fore reef ecosystem, but at a distance which hindered impact from acute nutrient exposure. The treatment corals were treated with slow release fertilizer pellets, Osmocote 19-6-12 (N-P-K ratio), via a small nutrient diffuser tube for 15 months, beginning in July 2018. The control fragments were on the 15th of October 2019 at 9:00 AM and the treatment fragments at 11:00 AM. Although the treatment coral fragments had a much higher symbiont count upon collection, it was confirmed via laboratory testing, using PreSens equipment and an OXY-10, that the treatment coral fragments were underperforming. This was done by recording oxygen and temperature continuously over temperature treatments and then comparing photosynthesis, respiration, and calcification. In this follow-up study, three treatment fragments and three control fragments were planted at each site.
Coral transplants: Transplant methods.
Prior to placing the fragments in the site locations, the corals spent two to three days in the water tables in the outdoor wet lab at the UC Gump Research Station. At the end of this period, each coral fragment was photographed on each side with a ruler for scale using the Nikon Coolpix camera. The coral fragments were transplanted to the various sites on October 17th and 18th of 2019. Each coral fragment or “nub” was glued to cement tiles with holes in the center of them, using Gorilla hot glue and a Gorilla hot glue gun. These tiles were then hot glued and zip-tied to a metal wire cage, which was labeled with a plastic tag and weighed down using a rock inside, with four ends of rope attached. At each site, the cages were set on the ocean floor near other Pocillopora corals and secured with the ropes to a nearby substrate of either dead coral or rock (Figure A20, Appendix A). The coral transplants were given one week of recovery time and then monitored approximately every week for observations.
Coral transplants: Statistical analysis.
At the end of the experiment (approximately 3.5 weeks), the corals were collected on the 18th and 19th of November 2019. They were then photographed again to compare color change and
surface area in ImageJ.41 Using R in RStudio, the change in surface area was analyzed using a generalized linear model as a gaussian family and ANOVA tests.22,23,24,25,38 The color change due to bleaching was quantified using the CoralWatch coral health chart index, and any growth or changes in size were assessed using ImageJ.41,42 The potential color and surface area change were analyzed using a generalized linear model with a quasibinomial family and a gaussian family respectively and ANOVA tests, to look for changes in color and in surface area both in between sites and among the treatment and control replicates. Multiple generalized linear models were performed to assess for significant differences between treatment and control groups overall and to assess differences in between sites.
RESULTS
Coral and algae
Observed coral genera included: Acropora, Pocillopora, Porites, Pavona, Montipora, Gardinoseris, Millepora, Siderastrea, Phymastrea, Leptoseris, Leptastrea, Psammocora, Acanthastrea, Lithophyllon, and Pleuractis (Figures A1–A13, Appendix A). Consistent between both the Shannon-Wiener and Simpson indices, Cook’s Bay site 1 was the least diverse, containing a lower abundance, evenness and richness of various coral genera. The Hilton site was the most diverse using the Shannon-Wiener index, while Opunohu Bay site 2 was the most diverse using the Simpson index (Table 1). Opunohu Bay site 1 was also more diverse than the Hilton site when using Simpson index. Cook’s Bay site 1 was the least rich among genera, and the Hilton site was the richest among genera. Apart from Cook’s Bay site 1, the other sites were fairly close among diversity and richness indices. The Hilton and Opunohu Bay sites varied in order of diversity based on the two different indices.
When per transect averages of coral cover at all locations were analyzed, an almost flat line (m = 0.02268) reflected the relationship
Figure 2. Regression linear model of the average total coral percent cover against the average macroalgae percent cover per transect
amongst all sites (p > 0.05, m= 0.02268).
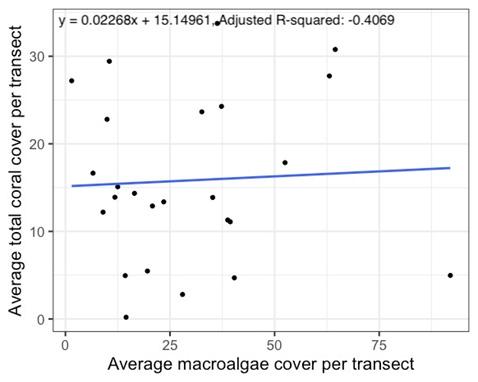
between average total coral cover and average macroalgae cover, which was not statistically significant (Figure 2, p = 0.8062). The average macroalgae cover per location was 26.6% for Cook’s Bay site 1, 20.1% for Cook’s Bay site 2, 46.8% for the Hilton site, 39.3% for Opunohu Bay site 1, and 12.4% for Opunohu Bay site 2. After performing a pairwise comparison, the Hilton site differed from Opunohu Bay site 2 notably (p = 0.0234). Other less dominant macroalgae types were noted, but not measured. Dictyota was very commonly noted at Cook’s Bay site 1, while Asparagopsis was observed at the Hilton site and Opunohu Bay sites.
The average total coral cover, when all transects in a location were averaged, was 8.1% for Cook’s Bay site 1, 14.2% for Cook’s
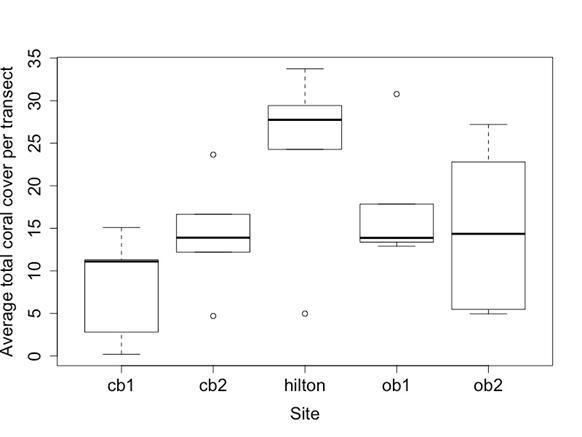

Figure 3. Boxplot of the average total coral percent cover per transect by site is shown on the left. Cook’s Bay site 1 and the Hilton significantly differed from each other (p = 0.0001), Cook’s Bay site 1 and Opunohu Bay site 1 significantly differed (p = 0.0431), and Cook’s Bay site 2 and the Hilton site significantly differed (p = 0.0379). Boxplot of the averages of the total bleached (sum of partially bleached and bleached) coral cover per transect among different locations is shown on the right. The right figure uses averages rather than proportions to better show the spread of the transect cover differences. Differences between locations was found to be insignificant (p > 0.05). The same site abbreviations are used as described in Table 1.
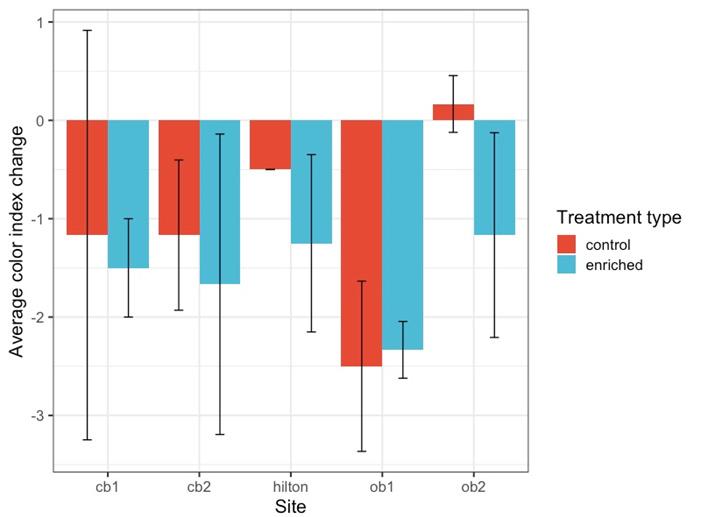
Figure 4. Average color change of treatment and control Pocillopora verrucosa, based off the CoralWatch color index by site location.42
Nutrient-enrichment treated coral fragments typically more dramatically bleached than control corals. Site and treatment did not have a significant effect (p > 0.05).
Bay site 2, 24.0% for the Hilton site, 17.8% for Opunohu Bay site 1, and 15.0% for Opunohu Bay site 2 (Figure 3A). The Hilton site was significantly different from the Cook’s Bay site 1 (Figure 3A, p = 0.0001). Opunohu Bay site 1 significantly differed from Cook’s Bay site 1 (Figure 3A, p = 0.0431). Cook’s Bay site 2 also significantly differed from the Hilton site (Figure 3A, p = 0.0379)
The average percent coverage of bleached coral (both partially bleached and fully bleached) as a proportion of total coral cover was 26.7% at Cook’s Bay site 1, 15.2% at Cook’s Bay site 2, 12.9% at the Hilton site, 9.7% at Opunohu Bay site 1, and 10.1% at Opunohu Bay site 2. In average percent cover per transect not as a proportion, the most bleached coral was at the Hilton site (Figure 3B). Differences in between sites in the average proportion of bleached coral cover over total coral cover per transect were statistically insignificant (Figure 3B, p > 0.05).
Coral transplants
When comparing the average color index change among the three replicates transplanted at each location, enriched fragments typically had a higher color change than control fragments, save those at Opunohu Bay site 1 (Figure 4). The difference in color change in control and treatment fragments was not significantly different (Figure 4, p = 0.2914). The location did not have a notable effect on color change either (Figure 4, p = 0.1525).
Most coral fragments were partially bleached by the end of the experiment, with the exception of two (one unenriched sample in Opunohu Bay site 1 and one enriched sample in Cook’s Bay site 1). One control fragment in Cook’s Bay site 1 and one control fragment in Opunohu Bay site 1 were overgrown with algae, and several fragments had green hues or small patches of algae growth. The size of the coral transplants did not notably change over time. The average surface area change calculated in ImageJ was 0.681 pixels per centimeter for enriched corals and 0.919 pixels per centimeter for control corals.41 By site, the average surface area change was 0.712 pixels per centimeter for Cook’s Bay site 1, 0.987 for Cook’s Bay site 2, 0.464 for the Hilton site, 0.872 for Opunohu Bay site 1, and 0.966 for Opunohu Bay site 2. Neither treatment nor location were significant (p = 0.2316, p = 0.3979 respectively).
DISCUSSION
Coral diversity and coral cover variation by site paralleled nitrogen and phosphorus pollution and correlating reef disturbance estimates made in Boutillier and Duane (2006).16 These types of nutrient pollution can worsen the negative effects of ocean acidification and temperature changes on corals, by causing dysbiosis, an imbalance or impairment in their microbiomes, which may lead to the corals becoming immune-compromised.3,43 Therefore, the sites which are presumed to deal with more nutrient pollution from increased surrounding agricultural runoff and sewage from commercial development may, over time, have less resilient and diverse coral reefs. Yet, with the Simpson index, Opunohu Bay site 1 had more diversity than the Hilton site, and Opunohu Bay site 2 had the greatest diversity index number, because the Simpson index weighs species evenness and more common species more heavily (Table 1). The Shannon-Wiener index is more sensitive to differences in diversity, but the Simpson index can better reflect the dominant species and richness of a site. Thus, the Hilton site may have a greater variety of genera, but the Opunohu sites have a greater abundance of the dominant genera. Still, this trend is in support of this study’s initial hypothesis, suggesting how freshwater, sewage, and runoff inputs from the two bays may be impacting coral. Certain corals tolerate nutrient inputs and sedimentation better because of their morphology and genetic variation, but others may respond by bleaching or partial mortality.29 For example, Porites and Montipora were most commonly found in all sites. These encrusting and bouldering corals were present more often than branching coral formations, as branching corals tend to be more fragile. However, in contrast, a study performed in 2015 on Moorea concluded that Acropora and Montipora were more susceptible to coral bleaching
than Porites and Pocillopora. 5 They also found that 21% less Acropora colonies were bleached proportionately in comparison to 2007, suggesting that more resilient genotypes and small corals may be being selected for over time.5 Yet, that study assessed reefs on the north coast of Moorea in six different reef zones, most of which were at greater depths and further out from the barrier reef than in this research.5 The general trends found in Montipora are in alignment with this 2015 study, but other factors regarding the difference in reef zones assessed and the time frames are likely the cause for the differences in findings around Porites, since large bommies of Porites seem to be more typically found on the flat barrier reefs than the deeper sloping reefs.5
The Hilton site had a higher proportion of bleached coral than the Opunohu Bay sites. This finding supports the hypothesis that the proportion of bleached coral is higher in Cook’s Bay but rejects the prediction that the Opunohu Bay sites would have more bleached coral than the Hilton site. These results suggest that the relationship between diversity, coral cover, and bleaching is more complex than hypothesized. One responding variable may not directly correlate with another, despite these factors having a relationship. Bleaching may not be as large of a concern in areas that are more stable due to species richness and evenness.
The average total coral cover per transect had a slightly positive relationship with average total macroalgae cover, when analyzed across all the transects. Because only the percent cover of the dominant macroalgae genera Turbinaria ornata and Sargassum muticum were recorded, other macroalgae genera such as Dictyota (Figure A15, Appendix A) and Asparagopsis were not represented. Since not all macroalgae types were recorded, the full scope of coral-algae relationship was not captured, which is typically spatially competitive when associated with a perturbation such as bleaching in combination with reduced herbivory and nutrient enrichment.15 Therefore, a relationship may have been clearer if all genera were measured. Despite the Hilton site having the most average total coral cover, it had the most average macroalgae cover when averaged at the location level, contrasting to the expected results. Similar observations were also found at Opunohu Bay site 1. Although there was greater average coral cover and diversity at these sites, the large potential surface area for macroalgae to colonize in between and on top of large coral bommies may contribute to the increased macroalgae cover, in comparison to sites at Cook’s Bay. The relationship between these factors is complex, is under current debate, and differs relatively in importance at locations.15
The Pocillopora coral transplants did not significantly change in color overall from their respective starting points. Yet, the treatment transplants generally had a higher color change than the control fragments, which is in alignment with previous studies where corals treated with nutrient loading were more susceptible to bleaching.44 Even though the nutrient loaded coral fragments had a more dramatic color change, they also had an excessive, detrimental level of symbionts to begin with from Becker’s initial assessment (Becker, D., personal communication, October 22 – December 6, 2019). More analysis regarding the transplants’ photosynthesis, respiratory and calcification functioning would need to be performed following a similar experiment.
Although the average surface area differences among both treatments and site locations (in pixels per centimeter) were not statistically significant, the average surface area change in the control coral fragments was larger than the treatment coral fragments. This may potentially support that the enriched coral fragments could still be underperforming in comparison to the control corals that may have been able to marginally grow. Yet, there is much room for error in this analysis since there are only three replicates of each coral type and inconsistent photography angles in the before and after images.
Since the coral fragments used were from the fore reef at a depth of approximately 10 meters, shortly following a major bleaching event, there are other factors that may have also contributed to their stress response. The decrease in depth and excess sunlight exposure in the barrier reef in comparison to their native environment in the deeper fore reef may have also contributed to their final state, because of the stress from the environmental change. The coral fragments were also in the water table in the wet laboratory for a duration of time which impacted their state when they were output into the sites. The hot glue typically bleached the base of the coral fragment, which is why the color change focused on the overall color and overlooked the bleached bases. Yet, these factors may have influenced the results as well.
The findings generally support the results of previous work suggesting that barrier reefs near inputs of nutrient runoff are impacted more than corals in barrier reefs nearby. Studying the fringing reefs in these same areas where the effects on bleaching and cover may be more dramatic could be beneficial for comparison, as fringing reefs are closer to the potential pollutant sources and runoff entry points. Because the barrier reefs around this arc of Moorea receive different amounts of freshwater from streams and are geomorphologically different, there are additional factors to consider that were not measured in this study. Variation exists among these sites regardless of additional inputs from sewage and agriculture, due to differences in depth and formation. Although turbidity and total dissolved solids measurements were taken, the results were inconclusive, and thus omitted, largely due to limitations in equipment and the duration of the study. Turbidity is generally regarded as harmful and associated with poorer water quality, when it blocks sunlight penetration for proper photosynthesis in marine organisms. However, other research suggests there may be benefits of turbid water to corals in tolerating higher temperature stress.45 In future studies, the relationship between turbidity, or the total dissolved solids, and coral requires further investigation. An additional indicator of stress to consider in future studies is mucus production, which is an important immune response to nutrient enrichment and sedimentation.46 This study took observations on mucus present on Porites in transects, but the results were mostly dependent on which sites had more Porites present (Figure A18, Appendix A). Many factors influence mucus production, such as depth, light exposure, temperature, and low tides.46 Since it had been around five months following the most recent bleaching event in Moorea, more obvious stress-induced mucus production may be present if surveyed closer in time to a bleaching event. More research should also be done on the rates of photosynthesis and respiration following a long duration of recovery from a nutrient loading environment. Questions concerning bleaching tolerance, stress responses, adaptations, and resiliency following stress are
important to the ability of coral reef ecosystems to tolerate changing climate conditions.
Maintaining the diversity of coral reefs is important for the long-term stability of marine ecosystems. More research and greater public awareness on current scientific knowledge are needed for better understanding about the different indirect factors that degrade coral reefs, especially when in combination with changing abiotic factors due to global warming, which pose a risk to marine diversity, coastal protection, and human life.
APPENDIX
The appendix to this article may be found online by navigating to: https://escholarship.org/uc/our_bsj/
REFERENCES
1. Kubicek, A., Breckling, B., Hoegh-Guldberg, O., & Reuter,
H. (2019). Climate change drives trait-shifts in coral reef communities. Scientific Reports, 9(1), 3721. https://doi. org/10.1038/s41598-019-38962-4 2. Schluessner, C., Rogelj, J., Schaeffer, M., Lissner, T., Licker,
R., Fischer, E.M., Knutti, R., Levermann, A., Frieler, K., and
Hare, W. (2016). Science and policy characteristics of the Paris
Agreement temperature goal. Nature Climate Change, 6, 827–835. https://doi.org/10.1038/nclimate3096 3. Wiedenmann, J., D’Angelo, C., Smith, E.G., & Hunt, A.N. (2013).
Nutrient enrichment can increase the susceptibility of reef corals to bleaching. Nature Climate Change, 3(2), 160–164. https://doi. org/10.1038/nclimate1661 4. Eurich, J.G., McCormick, M.I., & Jones, G.P. (2018) Direct and indirect effects of interspecific competition in a highly partitioned guild of reef fishes. Ecosphere, 9(8). https://doi. org/10.1002/ecs2.2389 5. Pratchett, M. S., McCowan, D., Maynard, J. A., & Heron, S. F. (2013). Changes in bleaching susceptibility among corals subject to ocean warming and recurrent bleaching in Moorea, French
Polynesia. PLOS ONE, 8(7), e70443. https://doi.org/10.1371/ journal.pone.0070443 6. Nicholls, R. J., Wong, P. P., Burkett, V., Codignotto, J., Hay, J.,
Woodroffe, C. D., Abuodha, P., Arblaster, J., Brown, B., Forbes,
D., Hall, J., Kovats, S., Lowe, J., McInnes, K., Moser, S., Rupp-
Armstrong, S., Saito, Y., & Tol, R. S. J. (2007). Coastal systems and low-lying areas. Cambridge University Press, 315–356. 7. Olguín-Lopez, N., Gutiérrez-Chávez, C., Hérnández-Elizárraga,
H., Ibarra-Alvarado, C. and Rojas-Molia, A. (2017). Coral reef bleaching: an ecological and biological overview, Corals in a changing world. IntechOpen. https://doi.org/10.5772/ intechopen.69685 8. Ware, J. R., Smith, S. V., & Reaka-Kudla, M. L. (1992). Coral reefs: sources or sinks of atmospheric CO2? Coral Reefs, 11(3), 127–130. https://doi.org/10.1007/BF00255465 9. World Resources Institute. (2006). Value of coral reefs in
Caribbean Islands: draft economic valuation methodology.
Retrieved from http://pdf.wri.org/methodology_with_ appendix_jul06.pdf 10. Frieler, K., Meinshausen, M., Golly, A., Mengel, M., Lebek, L.,
Donner, S.D., & Hoegh-Guldberg, O. (2013). Limiting global warming to 2 degrees Celsius is unlikely to save most coral reefs.
Nature Climate Change, 3(2), 165–170. https://doi.org/10.1038/ nclimate1674 11. Carilli, J. E., Norris, R. D., Black, B. A., Walsh, S. M., & McField,
M. (2009). Local stressors reduce coral resilience to bleaching.
PLOS One, 4(7), e6324. https://doi.org/10.1371/journal. pone.0006324 12. D’Angelo, C., & Wiedenmann, J. (2014). Impacts of nutrient enrichment on coral reefs: New perspectives and implications for coastal management and reef survival. Current Opinion in
Environmental Sustainability, 7, 82–93. https://doi.org/10.1016/j. cosust.2013.11.029 13. Bruno, J. F., Petes, L. E., Harvell, C. D., & Hettinger, A. (2003).
Nutrient enrichment can increase the severity of coral diseases.
Ecology Letters, 6(12), 1056–1061. https://doi.org/10.1046/ j.1461-0248.2003.00544.x 14. Silbiger, N.J., Nelson, C.E., Remple, K., Sevilla, J.K., Quinlan,
Z.A., Putnam, H.M., Fox, M.D., & Donahue, M.J. (2018).
Nutrient pollution disrupts key ecosystem functions on coral reefs. Royal Society, 285(1880). https://doi.org/10.1098/ rspb.2017.2718 15. McManus, J.W. & Polsenberg, J.F. (2004). Coral-algal phase shifts on coral reefs: ecological and environmental aspects. Progress in Oceanography, 60(2–4), 263–279. https://doi.org/10.1016/j. pocean.2004.02.014 16. Boutillier, S. & Duane, T. P. (2006). Land use planning to promote marine conservation of coral reef ecosystems in
Moorea, French Polynesia. Environmental Science. 17. Shea, A.G. (2011). Coral health and disease: a comparison of Cook’s and Opunohu Bays in Moorea, French
Polynesia. “Biology and Geomorphology of Tropical
Islands” class, University of California, Berkeley, Student
Papers. Retrieved from http://ib.berkeley.edu/moorea/ uploads/6/6/8/3/6683664/2001_final_papers.pdf 18. Aeby, G.S., Ross, M., Williams, G.J., Lewis, T.D., & Work, T.M. (2010). Disease dynamics of Montipora white syndrome within
Kaneohe Bay, Oahu, Hawaii: distribution, seasonality, virulence, and transmissibility. Diseases of Aquatic Organisms, 91, 1–8. https://doi.org/10.3354/dao02247 19. London, S. & Tucker, L. (2009). A comparison of the effects of agriculture and development on the two bays in Moorea,
French Polynesia, and the effects of a water outflow on a nearshore coastal community. “Biology and Geomorphology of Tropical Islands” class, University of California, Berkeley,
Student Papers. Retrieved from http://ib.berkeley.edu/moorea/ uploads/6/6/8/3/6683664/2001_final_papers.pdf 20. ESRI. (2011). ArcGIS Desktop: Release 10. Redlands, CA:
Environmental Systems Research Institute. 21. Veron, J.E.N. (1985). Corals of Australia and the Indo-Pacific.
London, Sydney: Angus & Robertson. 22. R Core Team. (2018). R: A language and environment for statistical computing. Vienna, Austria: R Foundation for
Statistical Computing. Retrieved from https://www.R-project. org/
23. Wickham, H., Averick, M., Bryan, J., Chang, W. McGowan,
L.D., François, R., Grolemund, G., Hayes, A., Henry, L., Hester,
J., Kuhn, M., Pedersen, T.L., Miller, E., Bache, S.M., Müller,
K., Ooms, J., Robinson, D., Seidel, D.P., Spinu, V., … Yutani,
H. (2019). Welcome to the tidyverse. Journal of Open Source
Software, 4(43), 1686. https://doi.org/10.21105/joss.01686 24. Wickham, H. (2011). The split-apply-combine strategy for data analysis. Journal of Statistical Software, 40(1) 1–29. http://www. jstatsoft.org/v40/i01/ 25. Wickham, H., François, R., Henry, L., & Müller, K. (2020). dplyr: A grammar of data manipulation. R package version 0.8.4. https://CRAN.R-project.org/package=dplyr 26. Deepayan, S. (2008). Lattice: multivariate data visualization with R. Springer-Verlag, New York. ISBN 978-0-387-75968-5. 27. Simpson, G.L. (2019). permute: Functions for generating restricted permutations of data. R package version 0.9-5. https://
CRAN.R-project.org/package=permute 28. Oksanen, J., Blanchet, F.G., Friendly, M., Kindt, R., Legendre,
P., McGlinn, D., Minchin, P.R., O’Hara, R.B., Simpson, G.L.,
Solymos, P., Stevens, M.H.H., Szoecs, E., & Wagner, H. (2019). vegan: Community ecology package. R package version 2.5-6. https://CRAN.R-project.org/package=vegan 29. Salas, F., Neto, J.M., Borja, A. & Marques, J.C. (2004). Evaluation of the applicability of a marine biotic index to characterize the status of estuarine ecosystems: the case of Mondego estuary (Portugal). Ecological Indicators, 4(3), 215–225. https://doi. org/10.1016/j.ecolind.2004.04.003 30. Sagar, R. & Sharma, G.P. (2012). Measurement of alpha diversity using Simpson index. Environmental Skeptics and Critics, 1(1), 23–24. 31. Wickham, H. (2016). ggplot2: Elegant graphics for data analysis.
Springer-Verlag, New York. https://ggplot2.tidyverse.org 32. Rudis, B., Kennedy, P., Reiner, P., Wilson, D., Adam, X., Barnett,
J., Leeper, T.J., & Meys, J. (2020). hrbrthemes: Additional themes, theme components and utilities for ‘ggplot2.’ R package version 0.8.0. https://cran.r-project.org/web/packages/hrbrthemes/ index.html 33. Russel, L. (2019). emmeans: estimated marginal means, aka least-squares means. R package version 1.4.3.01. Retrieved from https://CRAN.R-project.org/package=emmeans 34. Halekoh, U., Højsgaard, S. (2014). A Kenward-Roger approximation and parametric bootstrap methods for tests in linear mixed models - the R package pbkrtest. Journal of
Statistical Software, 59(9), 1–30. http://www.jstatsoft.org/v59/ i09/ 35. Henry, L. & Wickham, H. (2020). rlang: Functions for base types and core R and ‘tidyverse’ features. R package version 0.4.4. https://CRAN.R-project.org/package=rlang 36. Wickham, H. & Seidel, D. (2019). scales: Scale functions for visualization. R package version 1.1.0. https://CRAN.R-project. org/package=scales 37. Bates, D., Maechler, M., Bolker, B. & Walker, S. (2015). LME4: linear mixed-effects models using Eigen and S4. R package version 1.1.8. 38. Xiao, N. (2018). ggsci: Scientific journal and sci-fi themed color palettes for ‘ggplot2.’ R package version 2.9. https://CRAN.R-
project.org/package=ggsci 39. Kuznetsova, A., Brockhoff, R.B., Christensen, R.H.B. (2017). lmerTest package: Tests in linear mixed effects models. Journal of Statistical Software, 82(13), 1–26. https://doi.org/10.18637/ jss.v082.i13 40. Bates, D., Maechler, M., Bolker, B. & Walker, S. (2015). LME4: linear mixed-effects models using Eigen and S4. R package version 1.1.8. 41. Rueden, C. T., Schindelin, J., & Hiner, M.C., et al. (2017).
ImageJ2: ImageJ for the next generation of scientific image data.
BMC Bioinformatics, 18, 529. 42. CoralWatch. (2019). Using the Coral Health Chart. CoralWatch.
Retrieved from https://coralwatch.org/index.php/monitoring/ using-the-chart/ 43. Dougan, K.E., Ladd, M.C., Fuchs, C., Thurber, R.V., Burkepile,
D.E., & Rodriguez-Lanetty, M. (2020). Nutrient pollution and predation differentially affect innate immune pathways in the coral Porites porites. Frontiers in Marine Science, 7: 563865. https://doi.org/10.3389/fmars.2020.563865 44. Burkepile, D.E., Shantz, A.A., Adam, T.C., Munsterman,
K.S., Speare, K.E., Ladd, M.C., Rice, M.M., Ezzat, L., Mcllroy,
S., Wong, J.C.Y., Baker, D.M., Brooks, A.J., Schmitt, R.J. &
Holbrook, S.J. (2020). Nitrogen identity drives differential impacts of nutrients on coral bleaching and mortality.
Ecosystems, 23, 798–811. https://doi.org/10.1007/s10021-01900433-2 45. Cacciapaglia, C. & van Woesik, R. (2016). Climate-change refugia: shading reef corals by turbidity. Global Change Biology, 22, 1145–1154. https://doi.org/10.1111/gcb.13166 46. Brown, B.E. & Bythell, J.C. (2005). Perspectives on mucus secretion in reef corals. Marine Ecology Progress Series, 296, 291–309. https://dx.doi.org/10.3354/meps296291
ACKNOWLEDGMENTS
I thank Stephanie Carlson, George Roderick, Seth Finnegan, and Brent Mishler for their persistent guidance in formulating and executing this study. I also would like to thank Philip Georgakakos, Mo Tatlhego, and Ilana Stein for all their help in statistical analyses and mentorship in study design and fieldwork. I am very grateful to Danielle Becker for all her help in identifying coral genera, giving me the opportunity to work with her coral fragments, and assisting me in designing the coral transplants portion of this study. Additionally, I would like to acknowledge the Moorea Class of 2019 for being so supportive and helpful in the field, with notable mention to Kyra Grove, Yayla Sezginer, Chris McCarron, and Kyle Schwartz. I would also like to give appreciation to Rynier Clinton for his assistance in operating the Geographic Information System and ImageJ.
TRANSECT COLUMNS
Site, Transect Latitude South Longitude West
CB1.1 17.48 149.82722222 CB1.2 17.47944444 149.82722222 CB1.3 17.47833333 149.82888889 CB1.4 17.47833333 149.83055556 CB1.5 17.47777778 149.83166667 CB2.1 17.47444444 149.81388889 CB2.2 17.47444444 149.81305556 CB2.3 17.47388889 149.81444444 CB2.4 17.47388889 149.80972222 CB2.5 17.47444444 149.81722222
H.1 17.47777778 149.84194444
H.2 17.47861111 149.84444444
H.3 17.47833333 149.84444444
H.4 17.47805556 149.84166667
H.5 17.47833333 149.84305556 OB1.1 17.48333333 149.85111111 OB1.2 17.4830556 149.85333333 OB1.3 17.48305556 149.85166667 OB1.4 17.485 149.85555556 OB1.5 17.485 149.85333333 OB2.1 17.48861111 149.86611111 OB2.2 17.48777778 149.86611111 OB2.3 17.48888889 149.86666667 OB2.4 17.48666667 149.86833333 OB2.5 17.48638889 149.87
Table A1: Transect locations in decimal degrees listed by site and transect. There are 5 transects at each site. For example, CB1.1 stands for Cook’s Bay site 1, transect 1 and so on. Cook’s Bay site 1 is abbreviated at CB1, Cook’s Bay site 2 is abbreviated as CB2, the Hilton site is abbreviated as an H, Opunohu Bay site 1 is abbreviated as OB1, and Opunohu Bay site 2 is abbreviated as OB2.
CORAL TRANSPLANT COORDINATES
Site Latitude South Longitude West CB1 17.48 149.82805556 CB2 17.47444444 149.8138889 H 17.47833333 149.84444444 OB1 17.485 149.85472222 OB2 17.48861111 149.86583333
Table A2: Transplant locations in decimal degrees listed by site. Cook’s Bay site 1 is abbreviated at CB1, Cook’s Bay site 2 is abbreviated as CB2, the Hilton site is abbreviated as an H, Opunohu Bay site 1 is abbreviated as OB1, and Opunohu Bay site 2 is abbreviated as OB2.
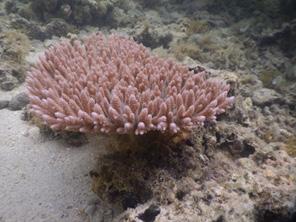
Figure A1: Coral identification photo of the Acropora genus. Figure A2: Coral identification photo of the Pocillopora genus. Figure A3: Coral identification photo of the Porites genus (left purple coral), Pavona genus (middle orange coral), and Montipora genus (right purple coral).
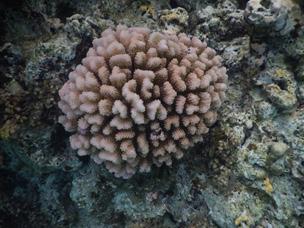
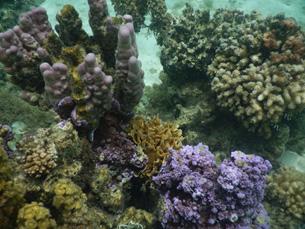
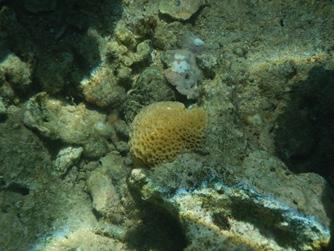
Figure A4: Coral identification photo of the Gardinoseris genus. Figure A5: Coral identification photo of the Millepora genus. Figure A6: Coral identification photo of the Siderastrea genus.
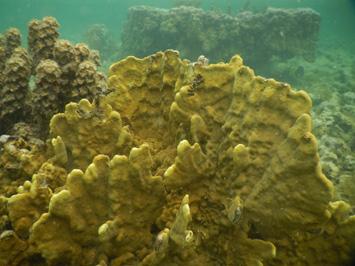

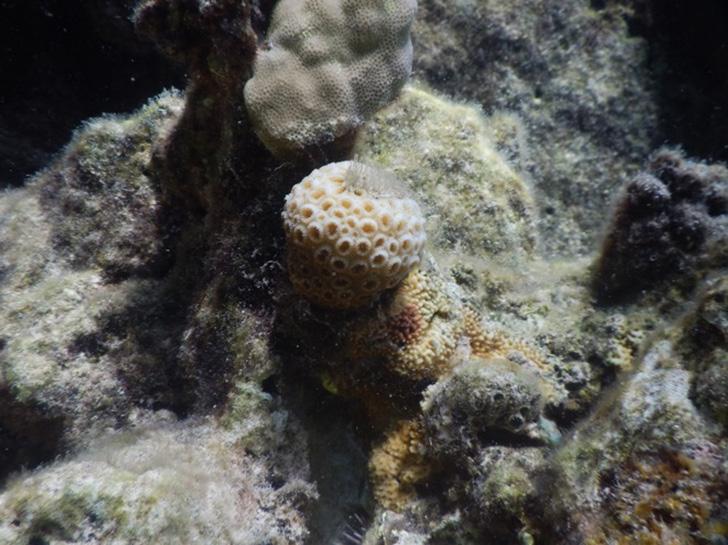
Figure A7: Coral identification photo of the Phymastrea genus. Figure A8: Coral identification photo of the Leptoseris genus. Figure A9: Coral identification photo of the Leptastrea genus.
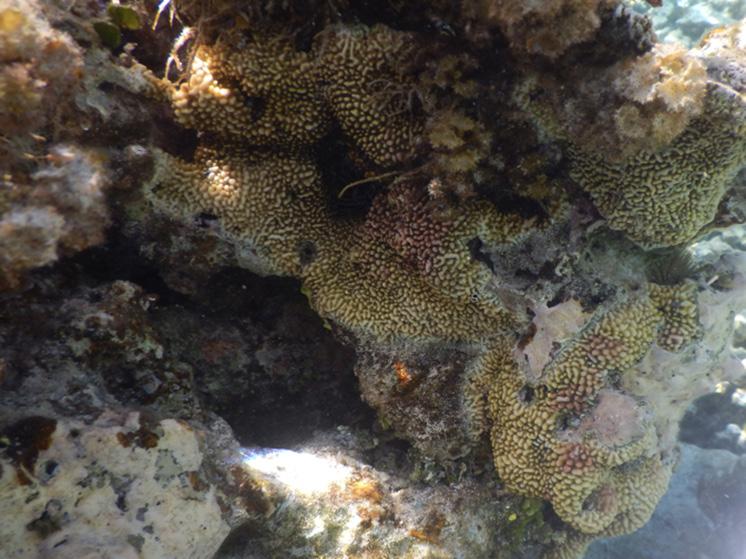
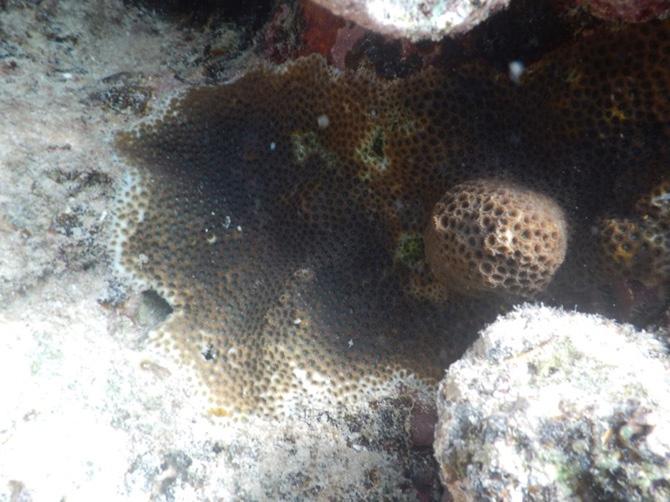
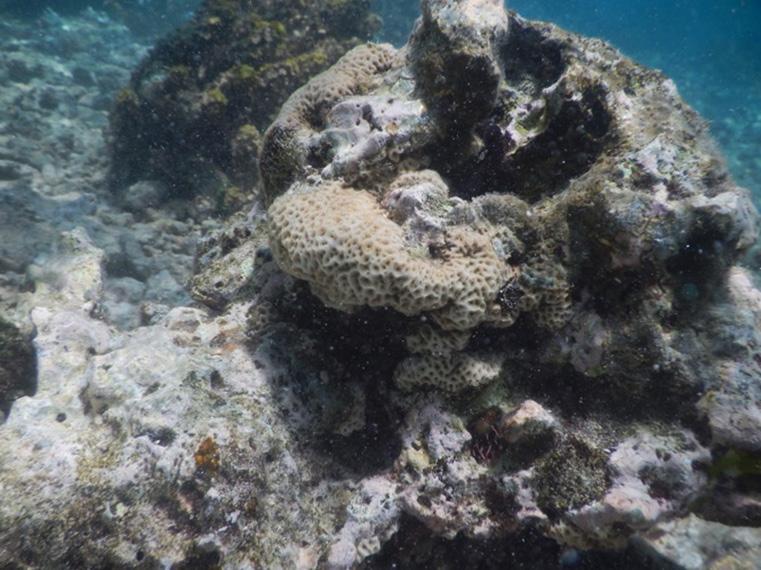
Figure A10: Coral identification photo of the Phymastrea genus. Figure A11: Coral identification photo of the Acanthastrea genus. Figure A12: Coral identification photo of the Lithophyllon genus.
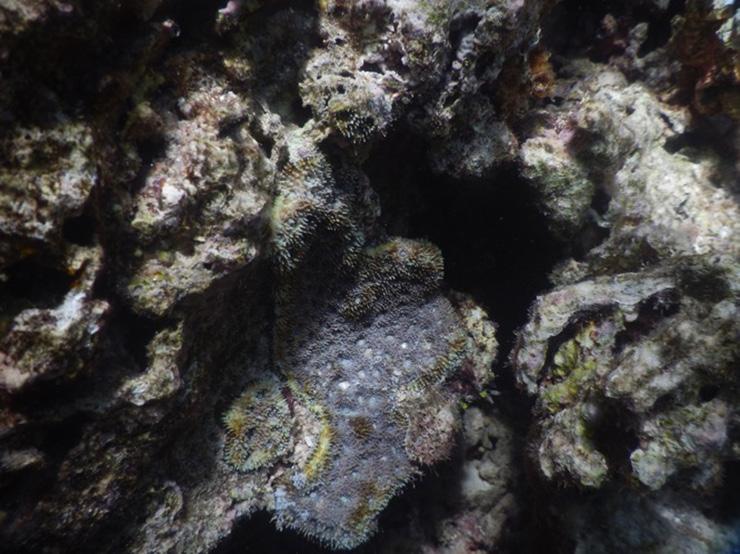
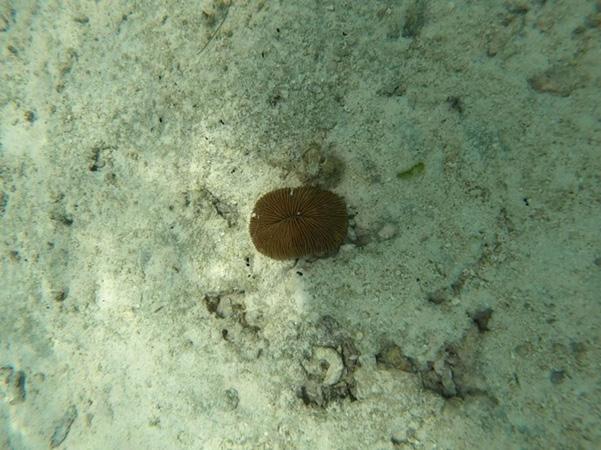
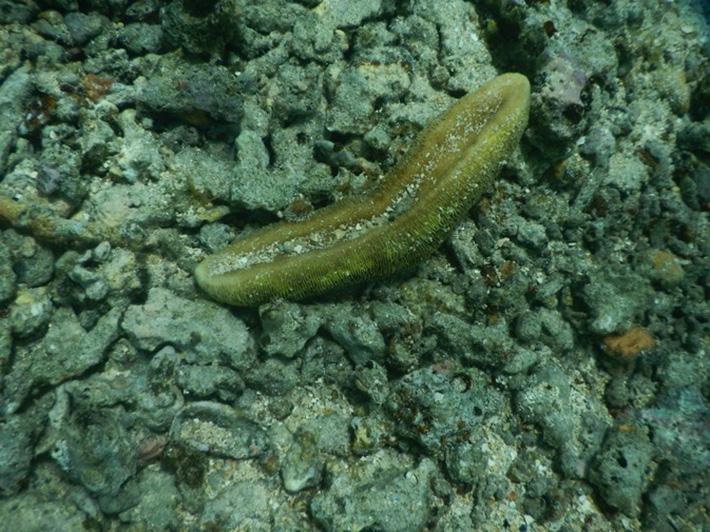
Figure A13: Coral identification photo of the Pleuractis genus.
MACROALGAE
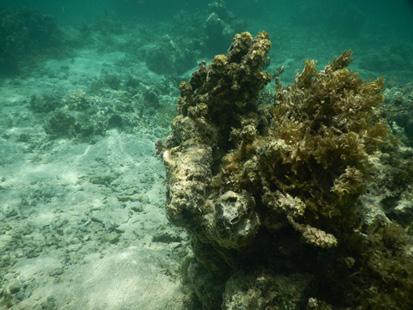
Figure A14: Identification photo of Turbinaria ornata (left) and Sargassum muticum (right) fleshy macroalgae types. Figure A15: Identification photo of Dictotya bartayresiana fleshy macroalgae type.
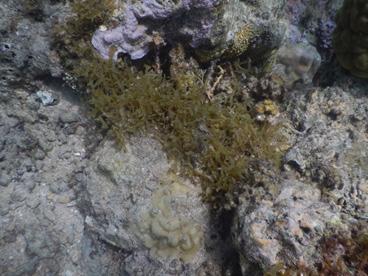
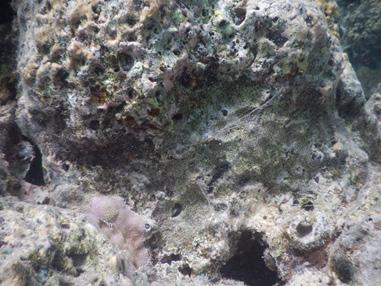
Figure A16: Representative photo of a “bleached” categorized Pocillopora coral. Figure A17: Representative photo of a “partially bleached” categorized Phymastrea coral.
CORAL MUCUS
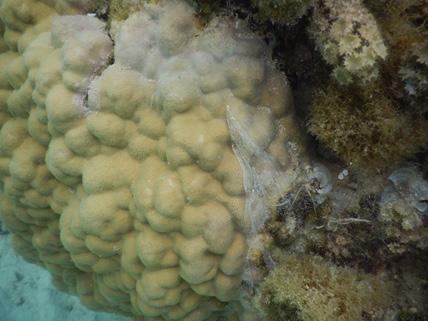
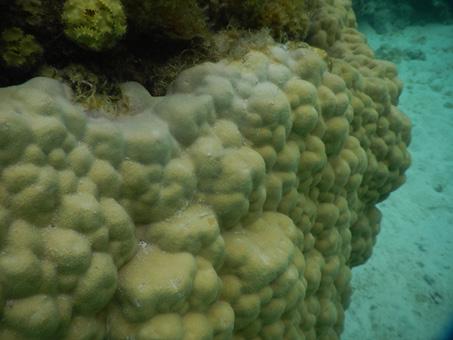
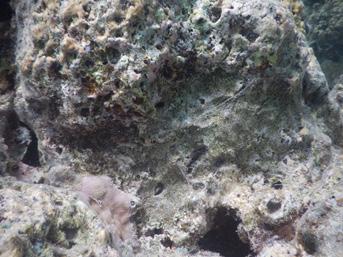
Figure A18: Representative photos of stress-induced coral mucus on a Porites coral head. Figure A19: Representative photo of string-like mucus from a vermetid snail.
CORAL TRANSPLANTS
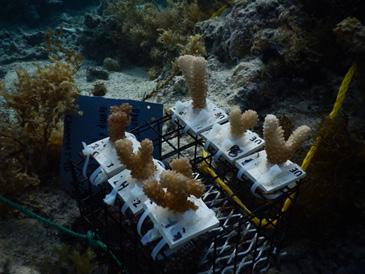
Figure A20: Photo of a coral transplant setup at an underwater site during the initial
output in Opunohu Bay site 1. Nutrient enriched corals are at the front left row, while control corals are at the back right row.


