16 minute read
Wildfire Significance within the San Francisco Bay Area’s Air Quality
from ORIGINS
By: Scott Hashimoto, Rohith A Moolakatt, Amit Sant, Emma Centeno, Ava Currie, Joyce Wang, and Grace Huang; Research Sponsor (PI): Professor Amm Quamruzzaman
ABSTRACT
Advertisement
Due to the increase in frequency and severity of wildfires in the San Francisco Bay Area, wildfire smoke has become a significant public health hazard linked with lung morbidity and increased mortality in exposed populations. Wildfire smoke consists of many types of particles, each with its own set of adverse effects. This study focuses on particulate matter smaller than 2.5 microns, or PM 2.5, one of the main contributors to adverse health effects, especially to the pulmonary and cardiovascular systems. In particular, we examine trends in 21 years of publicly available data from the Environmental Protection Agency on PM 2.5 air pollution by county by comparing PM 2.5 levels in the wildfire season months (May through October) to the rest of the year. Upon initial review, our findings may seem counterintuitive; on the three examined features of the dataset (mean, median, and maximum), the non-wildfire season generally yielded higher concentrations of mean and maximum PM 2.5 than the wildfire season. However, over time, the gap between the seasons has shrunk, which we propose is partially due to the PM 2.5 maximums driven by recent wildfires. Although the historic gap of PM 2.5 levels between wildfire and non-wildfire should be explored, the acute maximums offer a compelling climate and public health threat to the San Francisco Bay Area region as a whole. Given the severe public health consequences of exposure to PM 2.5 and wildfire smoke, we urge policy makers to take additional preventative and mitigative action during and in preparation for annual wildfire seasons.
Major, Year, Departmental: Hashimoto (Molecular Cell Biology, Junior); Moolakatt (Molecular Environmental Biology & Interdisciplinary Studies Field, Junior), Sant (Computer Science, Junior), Centeno (Ecosystem Management and Forestry & Data Science, Junior), Currie (Ecosystem Management and Forestry, Junior); Wang (Molecular Environmental Biology, Sophomore); Huang (Rhetoric & Environmental Economics and Policy, Junior), Department: Interdisciplinary Studies Field
INTRODUCTION Wildfire smoke has quickly become one of the most apparent and pressing climate issues for the San Francisco Bay Area. The western United States has seen consistent and rapid increases in wildfire activity since the 1980s, characterized by a rise in the frequency, severity, size, and total burned area associated with wildfires. California recognizes emerging wildfires as one of the significant threats to be expected under climate change;1 aggregate fire indices have risen by 20% following temperature increases and precipitation decreases in autumn over the last four decades.2 California wildfires from the last five years (Carr, Camp, Lightning Complex, and Dixie) highlight the necessity of wildfire prevention and mitigation. Wildfire smoke, in particular, has been a public health risk for vulnerable populations and is projected to become increasingly severe amidst high emissions climate change scenarios.3 Smoke is notoriously difficult to measure and model, and data on it is scarce, relatively recent, and often incomplete. By studying levels of particulate matter (PM), a metric tracked by the United States Environmental Protection Agency (EPA) since the 1990s, we can draw some relevant conclusions from the incomplete picture the data provides. In particular, we focused our study on the levels of particulate matter that is sized about 2.5 micrometers (PM 2.5) or smaller as those are some of the most harmful forms of pollution from the wildfires that can be tracked. PM can be sourced from multiple pollutants, however, as one of the primary particles of wildfire smoke, particulate matter is widely used to measure levels of smoke during wildfire events.4,5 Additionally, since PM 2.5 is a particularly hazardous form of air pollution to human health, monitoring its levels is a valuable metric. LITERATURE REVIEW Altogether, the consequences of climate change continue to worsen wildfire conditions yearly. Impacts such as alterations to precipitation cycles, increased drought, and more frequent extreme heat events all contribute to more favorable conditions for extreme wildfire events. Recent climate studies indicate that precipitation within California will increasingly fall as rain rather than snow in shorter, but heavier, storm events later into autumn.6 This delayed wet season exacerbates wildfire risk as September, October, and November (typically the wettest) are drier, thereby extending the wildfire season before the shorter rain season begins. Furthermore, research suggests that wildfires can reburn similar areas quicker when drought conditions have been active within the region, although this relationship needs to be explored further in fire prone areas, such as chaparral.7 Wildfire smoke is composed of many hazardous pollutants, including carbon monoxide, nitrogen dioxide, ozone, volatile organic compounds, and particulate matter (PM).8 The exact health effects of smoke, particularly associated with long term exposure, are difficult to measure and have become an active area of research today. However, there are clear dangers in regard to lung function and mortality. Within the Amazon, exposure to high levels of PM 2.5 from biomass burning was associated with reductions in lung function among school children.9 In Russia, wildfire smoke exposure in association with a 44-day long heat wave was expected to have caused 2000 more deaths than otherwise projected.10 A 13-year study on bushfire and dust exposure in Sydney, Australia yielded similar results on the heightened dangers of wildfire mortality during and the day after extreme heat events.11
These studies highlight a growing link between the threat of smoke exposure and extreme heat, a critical intersection between climate threats as both are expected to increase in frequency under climate change.
In recent years, wildfires are estimated to make up half of PM 2.5 emissions in the Western United States and about a quarter nationwide.12 Other primary sources of PM 2.5 include vehicle emissions, secondary sulfate, biomass combustion, and secondary organic aerosol (SOA).13 Historically, PM is associated with high mortality: in the London air pollution episode of 1952, 3000-4000 deaths were attributed to the dramatic levels of PM.14 PM 2.5 is dangerous for vulnerable populations, particularly the elderly, infants, persons with chronic cardiopulmonary disease, influenza or asthma,15 and increases in PM 2.5 lead to higher rates of emergency room visits, hospitalizations, and inpatient spending.16 This study also estimates that 1 microgram per cubic meter in PM 2.5 exposure for one day causes 0.69 additional deaths per million elderly, and that a 1 μg·m-3 increase over 3 days in PM 2.5 is expected to cause a loss of about 3 life-years per million beneficiaries. To put these numbers in context, wildfires often surpass 35 μg·m-3 (safe level of AQI) and have the potential to reach levels greater than 250 μg·m-3 (hazardous level of AQI).17 One study found that, since the mid 1900s, PM levels have been decreasing by an average of 0.66 ± 0.10 μg·m-3 per year around the United States likely due to more stringent environmental regulation. The exception to this trend was in the Pacific Northwest seeing the highest increase in Sawtooth National Forest of an increase of 0.97 ± 0.22 μg·m-3 per year. The authors concluded that it was due to an increased wildfire occurrence in the Rocky Mountains.18 This study indicated that wildfires have a significant effect on the long term air quality of a region, although it highlights that a regional analysis is necessary to find accurate results. The Bay Area Air Quality Management District released a comprehensive report about the effect PM has on public health in November 2012, and it provides a strong public health framework for our wildfire discussion. Among other air pollutants, PM was only recognized as a severe public health threat beginning in the mid-1990s due to a series of compelling health studies regarding exposure.
METHODS We focused our study on the levels of PM 2.5, or particulate matter that is sized about 2.5 micrometers or smaller, as it is one of the most harmful forms of pollution we can track that is directly related to wildfire smoke. Our objective for this study was to chart the relationship of PM 2.5 levels to wildfire activity within the San Francisco Bay Area using all of the available data from the United States Environmental Protection Agency. We tracked nine different counties that constitute the San Francisco Bay Area: Alameda, Contra Costa, Marin, Napa, San Francisco, San Mateo, Santa Clara, Solano, and Sonoma to determine if trends we gathered are consistent across this region. We aimed to determine how PM 2.5 levels have changed since 1990, especially in regard to recent wildfires. Our data was collected from the United States Environmental Protection Agency Air Quality System (AQS). We analyzed daily PM 2.5 AQI values from 1999-2020 for each of the nine San Francisco Bay Area counties. We focused our attention on PM 2.5 to measure the persistence of wildfire smoke, as wildfire smoke is one of the major contributors to PM 2.5 levels in the United States. Furthermore, to analyze trends between wildfires and AQI values, we split each year into two categories: wildfire season (May 1st to October 31st) and non-wildfire season (November 1st to April 30th). We arrived at the reasoning behind this set of dates by referencing a similar study which analyzed wildfire-specific particular matter, using these dates to distinguish wildfire season from non-wildfire season. 19 In order to interpret the data, we plotted the mean, median, and maximum PM 2.5 AQI value trends using linear regressions during the wildfire season and non-wildfire season for each San Francisco Bay Area county. We also ran 2 Independent Sample T-tests on the differences between the fire and non-wildfire seasons over various periods of time. To do this, we processed the data in a Jupyter Notebook using the following Python libraries: pandas to manage the data tables, matplotlib to generate the graphs, and scipy to run the statistical tests.
RESULTS The linear regression trends for mean and median values were not found to be statistically significant for both the non-wildfire season and the wildfire season. However, during the non-wildfire seasons from 1999-2020, all nine San Francisco Bay Area counties exhibited a significant negative correlation between maximum PM 2.5 AQI values and time, but during the wildfire seasons, this trend does not hold (the r-value is slightly positive, in fact). This suggests that there has been an increase in extreme events causing maximum PM 2.5 values to rise over time, possibly influenced by wildfires. Due to the unpredictable nature of wildfires and wildfire smoke, as well as the significant length of the wildfire season, there are often periods of time during the wildfire season without wildfires influencing the San Francisco Bay Area’s air quality. Moreover, wildfire smoke is typically relatively short-lived in a specific region following a wildfire event. These factors make it difficult to know how much of the daily PM 2.5 AQI values during the wildfire season is due to wildfires, especially when dealing with mean and median values. T-Tests revealed a significant difference between the wildfire and non-wildfire seasons from 1999-2020, showing that, in terms of mean and maximum PM 2.5 AQI, the non-wildfire season, in general, had higher levels of PM 2.5. However, as we exclude less recent years (1990-2008) and focus on 2009-2020, the results show that the difference between the wildfire and non-wildfire season is less significant, indicated by larger P-Values (P > 0.05). In other words, more recently, the difference in PM 2.5 AQI between the wildfire season and non-wildfire season is becoming less noticeable.
DISCUSSION Our findings show that, for most of the counties in the San Francisco Bay Area, mean and maximum PM 2.5 AQI has reliably been
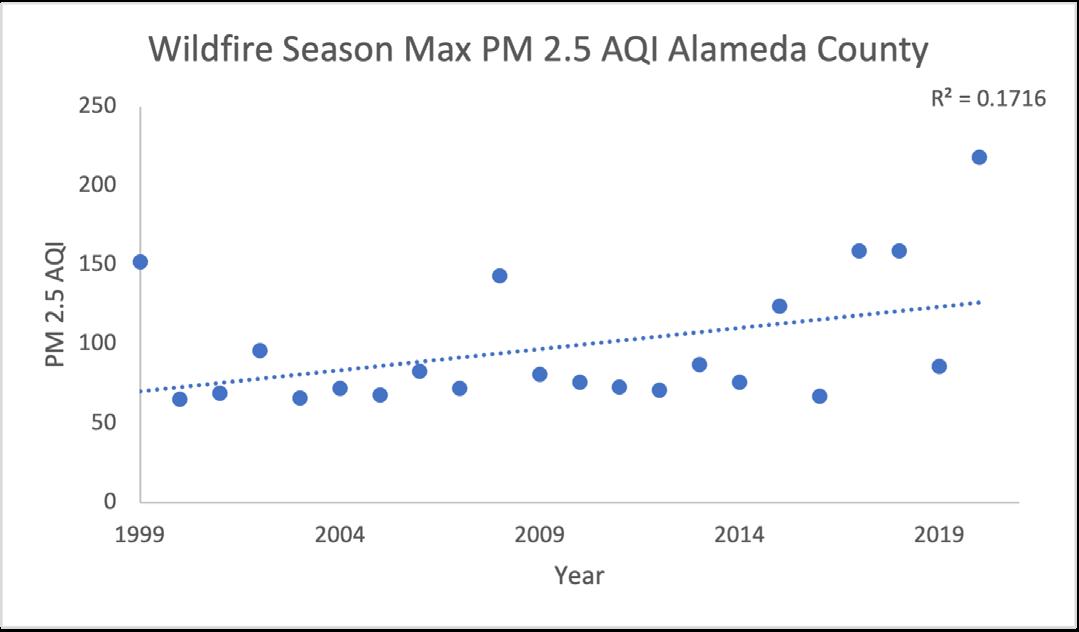
Figure 1: “Wildfire Season Max PM 2.5 AQI Alameda County”: This graph displays a non-significant correlation between maximum PM 2.5 AQI and time during the wildfire season (May 1st to October 31st) in Alameda County.
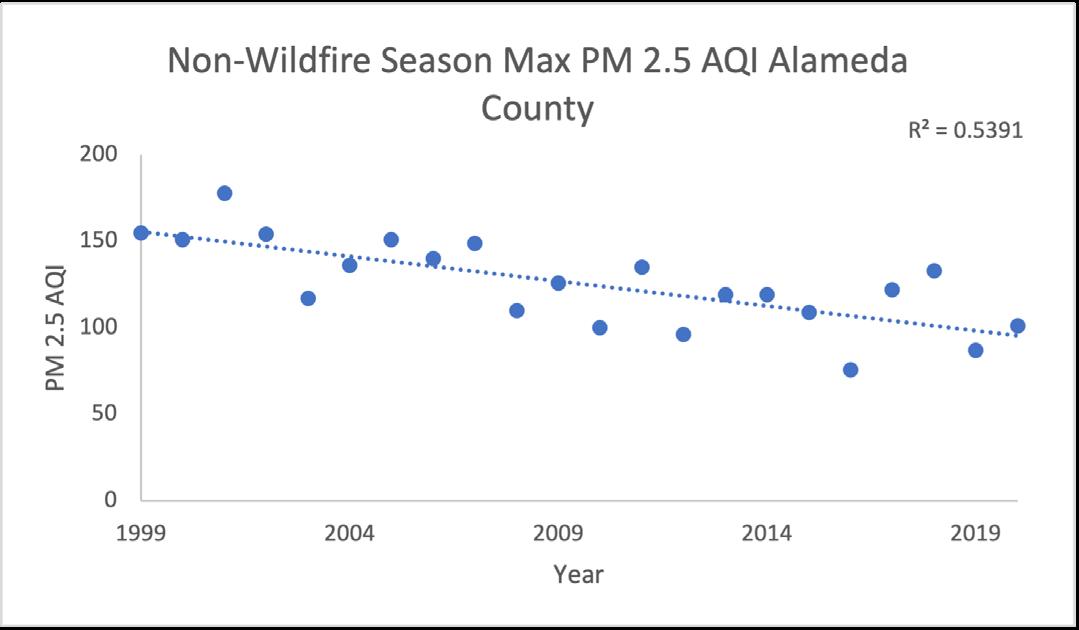
Figure 2: “Non-Wildfire Season Max PM 2.5 AQI Alameda County”:
This graph displays a negative correlation between maximum PM 2.5 AQI and time during the non-wildfire season (November 1st to April 30th) in Alameda County.

higher during the non-wildfire season. However, by analyzing the average differences of the median, mean, and maximum PM 2.5 levels, we observed that the difference between the two seasons has been shrinking. Essentially, PM 2.5 levels have historically been higher during the non-wildfire seasons, although in the last 5-10 years, the difference between the two seasons has decreased, suggesting an influence by recent phenomenon. We believe this influence is driven by the increased frequency of wildfire in San Francisco and the accompanying wildfire smoke of each fire. In addition, it is logical that median values do not show significant differences between wildfire and non-wildfire seasons if the difference is due to extreme weather events, such as wildfires. Given that the dramatic increase in frequency of wildfire is fairly recent, we expect the heightening PM 2.5 levels to continue to increase without severe wildfire prevention efforts under worsening climate change. We call for further analysis of PM 2.5 levels in accordance with demographic data for Bay Area communities given the skewed health effects left on the young and elderly populations to gauge vulnerability to extreme smoke events. Although PM 2.5 is one of the most dangerous common air pollutants for health, wildfire smoke is composed of many air pollutants, and the exact health consequences, although known to be negative, are difficult to determine. The link between extreme heat events and smoke mortality highlights a severe climate risk due to the expectation of a higher frequency of both due to climate change. Seasonal variations in the air temperature and wind patterns may have influenced the PM 2.5 levels recorded, however, the specifics of these dynamics are special to each region, and lie beyond the scope of this paper. Additionally, more specific geospatial data on air quality is needed within the San Francisco Bay Area, as it is difficult to pinpoint the areas with the worst air quality. For future research, innovation in detecting wildfire smoke levels independent of existing air pollution levels would greatly improve the capacity of future health research regarding the effects of wildfire smoke in the population. In this


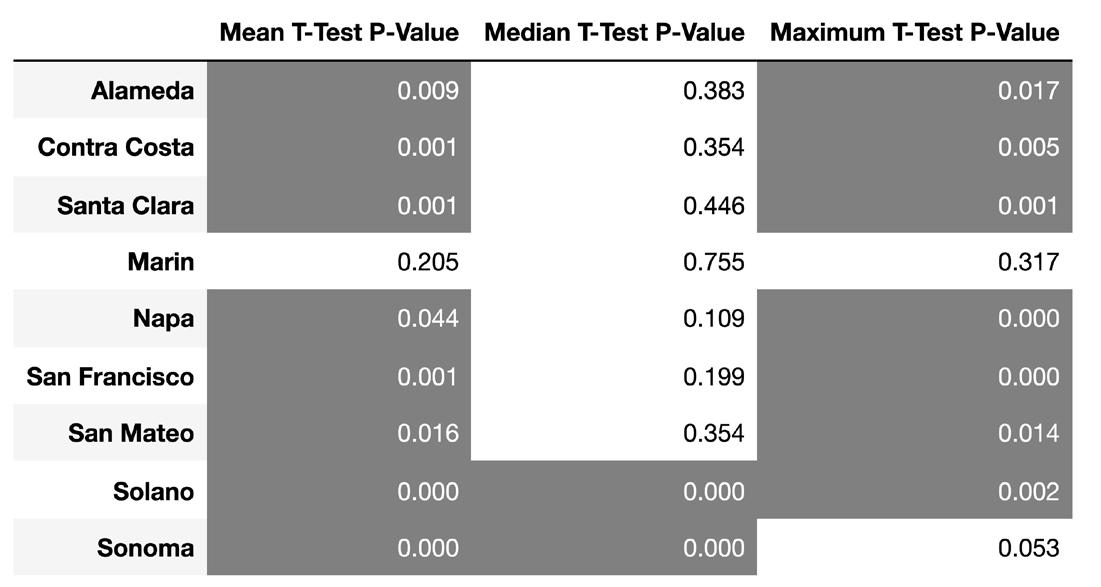
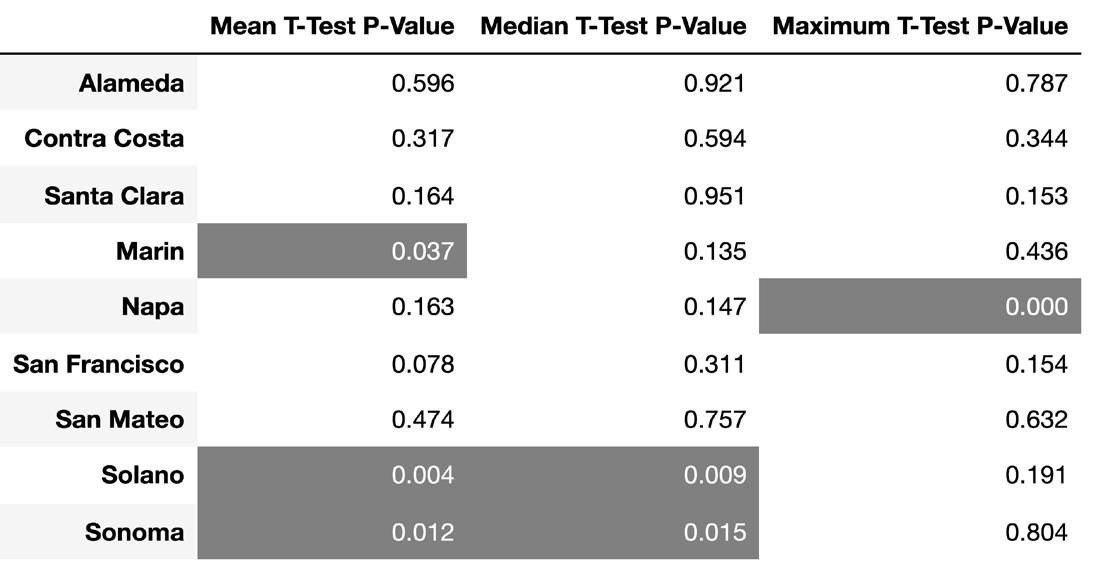
1999 - 2020 T-Test Results. Napa County only has data since 2007 2009-2020 T-Test Results. Shaded have p-values ≤ a = 0.05, and therefore pass the hypothesis test.
Figures 3 and 4: 1999 - 2020 T-Test Results and 2009-2020 T-Test Results: These charts display the P-Values for a T-Test which convey the difference between wildfire season and non-wildfire seasons. For this study, we used P < 0.05 as the cutoff for significance. The gray areas represent a statistically significant difference between the wildfire and non-wildfire seasons while white areas denote a statistically insignificant difference.
study we use particulate matter as a metric to track wildfire smoke levels, however, background pollution from other sources, such as automobile commuting and wood burning in homes, may have skewed the data from the effects of wildfire smoke. We call on lawmakers within the San Francisco Bay Area to recognize wildfires to be a major contributor to local air pollution, and therefore the public health of the Bay Area. Measures to mandate and increase access to more stringent air filtration within buildings will contribute to building more resilient and safer spaces for communities. In working to adapt communities to threats of wildfire, this paper aims to highlight wildfire as both an urban planning issue and an acute climate impact that requires regional, national, and global mobilization to adequately address.
REFERENCES 1. Bedsworth, L. (2018). California’s Fourth Climate Change
Assessment Statewide Summary Report. 133. 2. Goss, M., Swain, D. L., Abatzoglou, J. T., Sarhadi, A., Kolden,
C. A., Williams, A. P., & Diffenbaugh, N. S. (2020). Climate change is increasing the likelihood of extreme autumn wildfire conditions across California. Environmental Research
Letters, 15(9), 094016. https://doi.org/10.1088/1748-9326/ ab83a7 3. Mills David, Jones Russell, Wobus Cameron, Ekstrom Julia,
Jantarasami Lesley, St. Juliana Alexis, & Crimmins Allison. (2018). Projecting Age-Stratified Risk of Exposure to Inland
Flooding and Wildfire Smoke in the United States under
Two Climate Scenarios. Environmental Health Perspectives, 126(4), 047007. https://doi.org/10.1289/EHP2594 4. Kundu, S., & Stone, E. A. (2014). Composition and sources of fine particulate matter across urban and rural sites in the
Midwestern United States. Environmental Science: Processes & Impacts, 16(6), 1360–1370. https://doi.org/10.1039/C3E-
M00719G 5. Holder, A. L., Mebust, A. K., Maghran, L. A., McGown, M.
R., Stewart, K. E., Vallano, D. M., Elleman, R. A., & Baker, K.
R. (2020). Field Evaluation of Low-Cost Particulate Matter
Sensors for Measuring Wildfire Smoke. Sensors, 20(17), 4796. https://doi.org/10.3390/s20174796 6. Swain, D. L. (2021). A Shorter, Sharper Rainy Season Amplifies California Wildfire Risk. Geophysical
Research Letters, 48(5), e2021GL092843. https://doi. org/10.1029/2021GL092843 7. Parks, S. A., Parisien, M.-A., Miller, C., Holsinger, L. M., &
Baggett, L. S. (2018). Fine-scale spatial climate variation and drought mediate the likelihood of reburning. Ecological Applications, 28(2), 573–586. https://doi.org/10.1002/eap.1671 8. Reid, C. E., Brauer, M., Johnston, F. H., Jerrett, M., Balmes, J.
R., & Elliott, C. T. (2016). Critical Review of Health Impacts of Wildfire Smoke Exposure. Environmental Health
Perspectives, 124(9), 1334–1343. https://doi.org/10.1289/ ehp.1409277 9. Jacobson, L. da S. V., Hacon, S. de S., Castro, H. A. de, Ignotti,
E., Artaxo, P., & Ponce de Leon, A. C. M. (2012). Association between fine particulate matter and the peak expiratory flow of schoolchildren in the Brazilian subequatorial Amazon: A
panel study. Environmental Research, 117, 27–35. https://doi. org/10.1016/j.envres.2012.05.006 10. Shaposhnikov, D., Revich, B., Bellander, T., Bedada, G. B.,
Bottai, M., Kharkova, T., Kvasha, E., Lezina, E., Lind, T.,
Semutnikova, E., & Pershagen, G. (2014). Mortality related to air pollution with the moscow heat wave and wildfire of 2010.
Epidemiology (Cambridge, Mass.), 25(3), 359–364. https:// doi.org/10.1097/EDE.0000000000000090 11. Johnston, F., Hanigan, I., Henderson, S., Morgan, G., & Bowman, D. (2011). Extreme air pollution events from bushfires and dust storms and their association with mortality in Sydney, Australia 1994–2007. Environmental Research, 111(6), 811–816. https://doi.org/10.1016/j.envres.2011.05.007 12. Burke, M., Driscoll, A., Heft-Neal, S., Xue, J., Burney, J., &
Wara, M. (2021). The changing risk and burden of wildfire in the United States. Proceedings of the National Academy of
Sciences, 118(2). https://doi.org/10.1073/pnas.2011048118 13. Zou, B.-B., Huang, X.-F., Zhang, B., Dai, J., Zeng, L.-W.,
Feng, N., & He, L.-Y. (2017). Source apportionment of PM2.5 pollution in an industrial city in southern China. Atmospheric Pollution Research, 8(6), 1193–1202. https://doi. org/10.1016/j.apr.2017.05.001 14. Bernard, S. M., Samet, J. M., Grambsch, A., Ebi, K. L., &
Romieu, I. (2001). The potential impacts of climate variability and change on air pollution-related health effects in the
United States. Environmental Health Perspectives, 109(suppl 2), 199–209. https://doi.org/10.1289/ehp.109-1240667 15. Pope, C. A. (2000). Epidemiology of fine particulate air pollution and human health: Biologic mechanisms and who’s at risk? Environmental Health Perspectives, 108 Suppl 4, 713–723. https://doi.org/10.1289/ehp.108-1637679 16. Deryugina, T., Heutel, G., Miller, N. H., Molitor, D., & Reif, J. (2019). The Mortality and Medical Costs of Air Pollution: Evidence from Changes in Wind Direction. The American Economic Review, 109(12), 4178–4219. https://doi.org/10.1257/ aer.20180279 17. Aguilera, Rosana, Thomas Corringham, Alexander Gershunov, and Tarik Benmarhnia. 2021. “Wildfire Smoke Impacts
Respiratory Health More than Fine Particles from Other
Sources: Observational Evidence from Southern California.” Nature Communications 12 (1): 1493. https://doi. org/10.1038/s41467-021-21708-0. 18. 18. McClure, C. D., & Jaffe, D. A. (2018). US particulate matter air quality improves except in wildfire-prone areas.
Proceedings of the National Academy of Sciences, 115(31), 7901–7906. https://doi.org/10.1073/pnas.1804353115 19. Liu, J. C., Wilson, A., Mickley, L. J., Dominici, F., Ebisu, K.,
Wang, Y., Sulprizio, M. P., Peng, R. D., Yue, X., Son, J.-Y., Anderson, G. B., & Bell, M. L. (2017). Wildfire-specific Fine Particulate Matter and Risk of Hospital Admissions in Urban and
Rural Counties. Epidemiology (Cambridge, Mass.), 28(1), 77–85. https://doi.org/10.1097/EDE.0000000000000556
Special thanks to our donors:
Michael Delaney Wenbin Jiang Hassan and Humaira Khan Sophia Liu Clifton and Norma Russo Jack Yin Nancy Yin


