$37.8M = Madison County Property Tax Collection State of Montana received approximately $87.9M in income taxes, corporate taxes, property taxes, lodging taxes, gas taxes, and alcohol taxes
$20.3M = Gallatin County Property Tax Collection
NET FISCAL IMPACT
Big Sky makes up approximately 80% of the taxable value in Madison County
Big Sky makes up approximately 11% of the taxable value of Gallatin County
TOTAL ECONOMIC IMPACT
Big Sky has a huge economic impact on Gallatin and Madison Counties, and the State of Montana
$2.276B OF ECONOMIC IMPACT
Madison and Gallatin Counties: $1.269B and 26,065 jobs or 32% of the 2-County Labor Force
State of Montana: $1B in additional impact PROPERTY TAXES COLLECTED
Big Sky has 6 Hotels with 450 Rooms1200 Short-Term
In 2022, Big Sky’s lodging brought in a total of $7,120,677 in lodging tax for the State of Montana
Big Sky is the largest collector of lodging tax across the State of Montana
Big Sky collected 32.6% of Yellowstone Country’s lodging tax collections
Big Sky collected 12.3% of state-wide collections
Big Sky collected $1.8M more than Bozeman
Big Sky’s lodging tax collections has grown 213% since 2017
BIG SKY RESORT AREA DISTRICT HAS 810 BUSINESS ENTITIES REGISTERED AS DOING ACTIVITY WITHIN THE DISTRICT
These businesses report employing 15,748 employees
7,407 (47%) work within the BSRAD boundaries
4,322 (58%) are seasonal workforce
3,224 employees are estimated by the U.S. Census Bureau to be working full-time year-round. Of these, 815 live AND work in Big Sky.
2,409 (74.7%) work in Big Sky but live in the surrounding county area
3,085 (42%) working year-round 32%
Conservative estimates that these 3,224 full-time year-round employees pay approximately $57.8M in state income taxes
26,065 jobs are attributed to economic activity in Big Sky
which equates to 32% of the two-County workforce that is impacted by economic activity in Big Sky.
COLLECTIVELY, THE GREATER BIG SKY COMMUNITY PAID $58.1M IN PROPERTY TAXES IN 2022
$21.3M IN PROPERTY TAXES COLLECTED BY THE STATE OF MONTANA
$20M went to State School Equalization Levies
$1.3M went to University Levies
$21.15M IN PROPERTY TAXES COLLECTED BY MADISON COUNTY
$2.5M went to Ennis K-12
$1.8M went to Madison Valley Hospital
$950K went to schools County-Wide
$13.1M went to other County Levies
$15.69M IN PROPERTY TAXES COLLECTED BY GALLATIN COUNTY
$694K went to Big Sky Water/ Sewer District
$5.7M went to Big Sky Fire District
$388K went to Madison County Library
Madison County Property Tax Comparison
$4.4M went to Big Sky K-12
$40K went to Big Sky Zoning District
$1.57M went to Schools County-Wide
$5.3M went to Other Country Levies
Gallatin County Property Tax Comparison
OVERVIEW
In March 2023, the Big Sky Resort Area District, in partnership with the Big Sky Chamber of Commerce, engaged the Northern Rocky Mountain Economic Development District to provide an analysis of the fiscal contributions of the community of Big Sky to Gallatin and Madison Counties, as well as the state of Montana. This study builds upon the Big Sky Economic Profile published in October 2022, extending the scope of the initial research to provide a more comprehensive and technically detailed assessment.
The central objective of this analysis is to comprehensivley assess the extent of Big Sky’s economic contributions to the region. This encompasses a range of vital factors, such as population dynamics, employment statistics, taxes, and economic activity generated by businesses and tourism activity in Big Sky.
This report is divided into three sections. The first section presents a thorough demographic analysis of the Big Sky community, offering insights into population trends, growth patterns, and demographic characteristics. The second section conducts a fiscal analysis, delving into public revenues and tax collections within Big Sky. This includes an assessment of various revenue streams and their implications for public services and development. Lastly, the third section undertakes an economic impact analysis, quantifying the ripple effects of local expenditures driven by businesses and tourism. Together, these sections provide a holistic understanding of Big Sky’s demographic makeup, fiscal health, and economic contributions to the broader region.
Data Methodologies
The following analysis uses data from multiple sources, including the Big Sky Resort Area District Tax Collections, private employers in Big Sky, the U.S. Census Bureau American Community Survey, the U.S. Bureau of Labor Statistics, the Bureau of Economic Analysis, Madison County Treasurer reports, Gallatin County Treasurer reports, Montana Department of Revenue reports, Montana Office of Public Institution School District budgets, and IMPLAN multipliers. Unless otherwise noted, all data is from 2022.
Big Sky, situated within both Gallatin and Madison Counties in Montana, stands as an unincorporated community. This unique geography and small community size pose data challenges in terms of accessibility and accuracy. Due to these factors, many commonly used publicly available data sets do not provide estimates for variables with this geographic bound. The available variables typically have larger standard errors, indicating broader ranges in their accuracy estimates.
In an effort to compensate for the dearth of publicly available data, this study uses two community sources to supplement public data. The first is private employer data, such as construction spending and employee zip code information. The second is from the Big Sky Resort Area District (BSRAD). In accordance with state regulations, every business functioning within the resort district limits must formally register their organization and submit an annual report to BSRAD, the overseeing body responsible for managing the resort district and guaranteeing compliance to state regulations. The reports BSRAD receive include revenues generated within the district, along with various responses to questions regarding business activity, employment, and other services provided by employers such as housing.
DEMOGRAPHICS
Population
Table 1 illustrates the population residing within the boundaries of the Big Sky Resort Area District. By aligning census block data with residential structure data, we can estimate the population residing in the BSRAD portion within each county. The Big Sky community overall has seen significant growth, increasing 54% between 2010 and 2020. This growth rate presents a drastic need for infrastructure investment to support this growth. In addition, the share of the total county population has grown over the years, from 2.5% in 2010 to 3% in 2020. Both Gallatin and Madison Counties also experienced large growth from 2010 to 2020 as shown in Figure 1.
Table 1: Regional Population Over Time
REGIONAL EMPLOYMENT
There are three sources of data we can use to compare employment in Big Sky relative to the region. The federal Bureau of Labor Statistics generates employment data at the national and county levels, providing comprehensive and reliable information. However, this data does not extend to estimating employment on a community scale. To determine employment in Big Sky, we can compare two other data sources – U.S. Census Bureau estimates, and data collected locally by the Big Sky Resort Area District.
U.S. Census Bureau employment estimates are created annually for the census-designated place (CDP) of Big Sky. A constraint to these estimates stems from the district boundary within which they are calculated. The CDP boundary, established by the Census Bureau, omits certain areas of economic activity and employment within Big Sky.
Figure 1: Population Trends Over Time
The Big Sky Resort Area District has recently begun collecting employment information from all businesses conducting activity within the resort district area. The data collected includes the total number of employees by the business, the number of employees working within the resort district boundary, and the number of seasonal employees each business hires. Limitations to this data include self-reporting errors and the possibility for businesses to inaccurately estimate the average amount of employees working in the district. It is essential to consider that these results might be inflated as all businesses engaged in any economic activity within the district are mandated to register with BSRAD. While this requirement encompasses businesses operating year-round, it also includes businesses in Big Sky for occasional and one-time events such as farmer’s markets, concerts, and other similar activities. Consequently, the reported employment levels are likely to be higher than the actual yearround permanent employment figures.
We want to understand the two types of employment that impact Big Sky and the region. The first is full-time, year-round employment, and the second is the seasonal labor. Bureau of Labor Statistics data does not track seasonal employment independently of full-time, year-round jobs. Therefore, we can use locally collected data through BSRAD to estimate seasonal employment by industry.
Figure 2 demonstrates that the total annual labor force overtime in both counties has grown since 2017. Figure 3 shows the monthly breakdown of total employment over time since 2017 for Gallatin County. We illustrate this to examine how seasonal employment affects totals over time and in what seasons employment grows or contracts.
Figure 3: Monthly Employment Over Time, Gallatin County
Madison Gallatin
Source: Bureau of Labor Statistics, LAUS Data Figure 4: Monthly Employment Over Time, Madison County
Table 2: County-Wide Labor Force Over Time
Source: Bureau of Labor Statistics, LAUS Data
Figure 3 shows that total employment levels have grown year over year except for 2020 (likely attributed to COVID-19). From January through May, employment levels are fairly steady, and beginning in May, employment levels in Gallatin County grow until their peak in July and then slowly contract until October, when employment levels out for the remainder of the year. The height of the labor force in July is likely driven by an influx of tourism to see Yellowstone National Park and enjoy outdoor recreation in the Montana summer. Generally, from high employment in July to low employment in January, the workforce fluctuates by 8-10%.
Comparing across successive years, Figure 4 shows the month-to-month variation in total employment levels in Madison County, which are more volatile when compared to Gallatin County, fluctuating 25-27% between peaks and lows. Each year (excluding 2020), total employment levels have grown. Winter months have a larger labor force, with consistent employment from December through April. This is likely due to Big Sky and the tourism influx to enjoy skiing and winter recreation. In May, employment levels drop and fluctuate until November.
Gallatin and Madison Counties have almost mirror-opposite seasons of employment, where Gallatin County employment is higher from May through October, and Madison County employment is higher from December through May. However, the Gallatin County labor force is over 10 times the size of Madison County, so the fluctuations do not fully offset each other.
Table 2 shows the county-wide labor force over time. In both counties, the labor force has grown, and combined together the two-county labor force is 81,553 workers.
Big Sky Employment
To capture employment in Big Sky, we can compare two different data sources. Unfortunately, the Bureau of Labor Statistics does not measure employment levels for communities with populations smaller than 50,000 (classified as a metropolitan). Therefore, we must find alternative data sources to estimate employment impacts.
Table 3 shows Census Bureau estimates for 2021 employment in Big Sky. These estimates are for the census-designated place, a boundary the U.S. Census Bureau determines. This data generates estimates for full-time, year-round employment and does not consider seasonal employment.
Table 4 shows employment data for Big Sky Area Resort District’s 2023 annual business registration. This district more broadly covers the Big Sky region than the censusdesignated place, including crucial economic activity centers excluded from the previous data set. There are 810 business entities registered with BSRAD and reporting data on their employment levels. However, this data also includes businesses that may work in Big Sky for occasional events and other irregularly occurring activities. This data is excellent for assessing the employment impact of the activities occuring in Big Sky and how many businesses are engaging in providing goods and services to community residents and visitors.
A total of 810 business entities registered with BSRAD in 2023 reported employing 15,748 employees, or 19% of the two county 2022 total employment of 81,553. Businesses registered estimate 7,408 employees working within the district and hire 4,322 seasonal workers.
Figure 5 shows employment by industry compared across the two data sets.
Table 4: Big Sky Employment Estimates - BSRAD 2023 Business Registration
Source: BSRAD 2023 Business Registration Data
Table 3: Big Sky Employment EstimatesCensus
Figure 5: Employment by Industry Comparison Census Data
except public
Arts, entertainment, and recreation, and accommodation and food services
Educational services, and health care and social assistance
Professional, scientific, and management, and administrative and waste management services
Finance and insurance, and real estate and rental and leasing
Source: Census Bureau American Community Survey, DP03 Five-Year Estimates, 2021
Employment Location
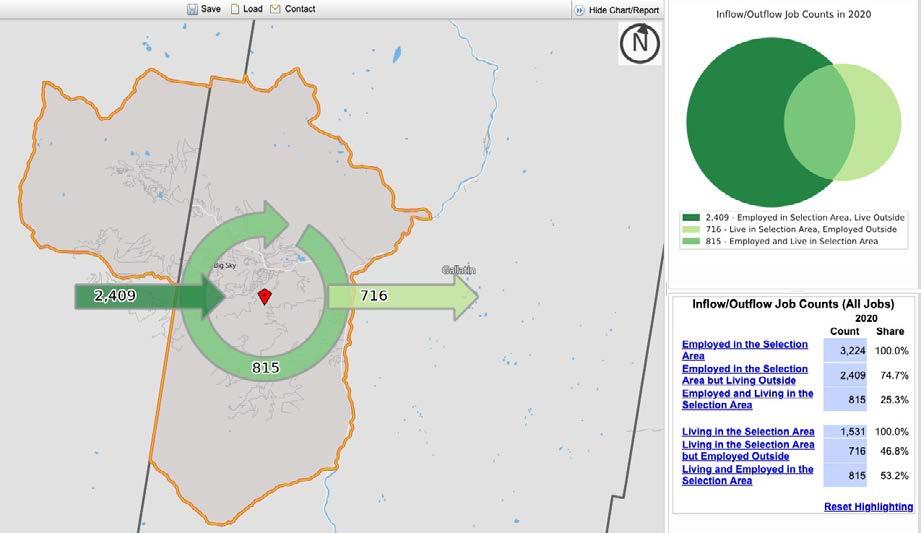
Due to the extremely high cost of housing, Big Sky is unable to house the entire workforce employed by businesses located in the area. Therefore, a large majority of the workforce lives in the surrounding county. There are two resources we can use to estimate residential living patterns of the labor force in Big Sky. The first is from the U.S. Census Bureau, performing a labor market inflow/outflow analysis using the OnTheMap tool. Figure 6 shows the results of this analysis. The U.S. Census estimates a total of 3,224 individuals employed full time year-round in the Big Sky CDP in 2020. 74.7% or 2,409 individuals are employed within the boundary but live in the surrounding county area, and 25.3%, or 815 individuals live and work in Big Sky.
Of the 1,531 working individuals estimated to live in the Big Sky CDP, 716 individuals live in Big Sky but are employed outside of the community.
Figure 6: Employee Inflow/Outflow AnalysisCensus Data
Source: U.S. Census Bureau, On the Map
While it is powerful to see that it is estimated that 75% of employees in Big Sky live in the surrounding area, this tool does not tell us where exactly the employees are residing. In an attempt to model where employees live in the surrounding area, we collected employee zip code data from the largest employers in Big Sky. This data is only zip codes of employee permanent addresses, resulting in 3,732 observations. We removed all non-Montana zip codes because we want to analyze where local workers live, resulting in 2,169 permanent Montana resident employees. Furthermore, of the 2,169
employees that have Montana zip-codes, 2,025 live within zip codes in Gallatin and Madison Counties. Figure 7 is a heat map of all observations plotted by zip code throughout Montana. The 59716 zip code has the most employees, at 912, and the Bozeman zip codes of 59718 and 59715 have the next two highest concentrations of employees at 465 and 272, respectively. Of the 2,025 employees that live within Madison and Gallatin County zip codes, 1,953 employees (or 96.4%) live within Gallatin County, and 72 (or 3.56%) live within Madison County.
Figure 7: Big Sky Employee Residence by Zip Code
TAXES OVERVIEW
Montana employs multiple taxation methods, including income, property, and sales/excise taxes. This report focuses on taxes paid by Big Sky residents. It begins with an analysis of property taxes in both Madison and Gallatin counties. Subsequently, it examines excise taxes, encompassing lodging, alcohol, and fuel taxes. Lastly, it briefly considers income and business taxes paid by community and business members.
Property Tax Overview
Property taxes are the primary way that Montana State funds it’s schools, and local Montana governments fund their various activities such as education, law enforcement, roads, libraries, emergency services, hospitals, infrastructure, and other activities. Property taxes are set by a combination of actors: the Montana Department of Revenue, the Montana State Legislature, and local governments and districts. The Montana Department of Revenue determines property value throughout the state and ensures uniform valuation of similar properties. The Montana State Legislature determines the share of tax burden on properties by designating property classes, establishing tax rates, setting the basis of valuation, and determining exemptions. Finally, local governments, and other districts such as a schools and hospitals, determine the tax level through budgeting and maximum mill levy limits.2 Local governments must adhere to a mill levy limit, and the law limits the revenue they can collect from property taxes.3
Each activity, such as a school district or municipality, has properties that make up the tax base within the district. Each property has a classification either as commercial or residential. Every property is assigned an assessed value which the Montana Department of Revenue periodically determines. This assessed value represents the property’s estimated market worth, including the land and building structures. To find the various classes of properties and tax rates, the Montana Department of Revenue produces a biennial report that covers property taxes in depth.
Table 5 shows the growth of taxable value over time from 2014 to 2023. Big Sky is represented by the Big Sky K-12 School District in Gallatin County, and the Big Sky Fire District in Madison County. It is important to note that the Big Sky Fire District boundary does not include the Yellowstone Club. The Yellowstone Club has their own private fire district but is an important component of the taxable property values in Big Sky. The two Big Sky districts are then summed to represent the community of Big Sky, excluding the Yellowstone Club. In the nine years spanning 2014 to 2023, the taxable value of Big Sky has increased by 270%. This increase is only surpassed by Madison County, which is in part due to the inclusion of the Yellowstone Club and Big Sky in their taxable valuation. In 2023, the taxable value of Big Sky was five times that of Belgrade’s taxable value, and three-quarters of the taxable value of Bozeman. Big Sky’s taxable value is 50% of all Missoula County, 38% of the value of Flathead and Yellowstone counties, and 4% of the taxable value for the entire state of Montana.
"Big Sky Fire District (Madison County) * Excludes Yellowstone Club Private Fire District "
Source: MT Department of Revenue, Montana Certified Values, https://svc.mt.gov/dor/property/cov#/206
Madison County Property Tax Collections
In Madison County, there are two levy districts that cover and serve the Big Sky region. Figure 8 is a map of these two levy districts, District 28 and 29. Table 6 shows the levies within both of these districts.
Table 6: Madison County Levies by District
Figure 8: Madison County Tax Districts for Big Sky
Table 7 shows the taxable value of the Big Sky taxing districts in Madison County, and compares the taxable value of those districts to the total taxable value of other special districts in Madison County, and the taxable value of the entire county. In 2022, both taxing districts in Big Sky had the taxable value of $166,659,917. This is 80% of the entire taxable value of Madison County, 87% of the Ennis K-12 School District, and 86% of the Madison Valley Hospital District.
Since the two taxing districts (District 28 and 29) in Madison County are not the same as the Big Sky Resort Area Boundary (BSRAD), we also had the Montana Department of Revenue create a GIS map of the properties within the BSRAD boundary. This finds that the taxable value of all properties within the BSRAD boundary are $149,835,389, or 90% of the taxable value of District 28 and 29 combined, and is 72% of the taxable value of Madison County.
Table 8 shows the distribution of the 2022 property tax collections from districts 28 and 29. The distribution of the property taxes is based on mills within each district. Out of the total taxes collected from Big Sky properties, only 6% are for special districts in Big Sky. 44.1% of the collections are sent to the state, and 49.9% go toward other Madison County activities. The county collects specific levies on behalf of the state and the revenues are not retained locally. This includes the University Mill Fund, the State Elementary Equalization Levy, the State High School Equalization Levy, and the State Equalization Fund.
Table 7: Madison County Properties 2022 Taxable Value
Source: Madison County Treasurer
Gallatin County Property Tax Collections
Table 9 shows the total taxable value of the various special districts applying to Big Sky properties. Some districts do not span across all properties in Big Sky, this includes the Big Sky Fire, Big Sky Sewer and Water, Big Sky Zoning, So. Gallatin Canyon Zoning, and Gallatin Gateway Fire Districts. In 2022, the taxable Big Sky K-12 was 11% of the taxable value of the entirety of Gallatin County.
Table 10 shows the property taxes collected in Big Sky on the Gallatin County side, compared to the county-wide or districtwide collections of the corresponding fund. Out of the total collections from Big Sky properties, 42.8% are towards special districts in Big Sky, 22.7% are levies sent to the state, and 34.5% go to various Gallatin County activities.
Source: Gallatin County Treasurer
Table 9: Gallatin County Taxable Property Values, 2022
10: Gallatin County Property Tax Collection Distribution, 2022
Big Sky K-12 General (72N)
Excise Taxes
An excise tax is a form of taxation applied to specific goods and activities, serving both revenue generation and regulatory purposes. It operates as a supplemental fee on particular items and behaviors. To illustrate, when you purchase gasoline for your vehicle, a portion of the total cost includes an excise tax, which the government allocates to fund infrastructure projects like road maintenance and public transportation initiatives. Essentially, it functions as a mechanism whereby individuals who utilize certain resources or engage in particular activities contribute directly to their associated costs. Excise taxes can be levied on a diverse range of products, such as tobacco, marijuana, and alcohol, as well as on activities like gambling and telecommunications. The primary objective is twofold: to provide a source of government income and to influence consumer choices, often by raising the cost of goods or activities that may have societal or environmental implications. Excise taxes represent a methodical approach to fiscal policy and social regulation. Montana has many excise taxes, but this study focuses on taxes collected on lodging, fuel, and alcohol.
Lodging Tax Collections
Due to the dominance of the tourism industry, Montana collects a state-wide lodging tax of 8% (4% sales tax to the general fund and 4% facility use tax, commonly known as the “bed tax”). The lodging tax is placed on all guests of hotels, motels, bed and breakfasts, guest ranches, resorts, propertymanaged units, and campgrounds. These revenues are collected by the state government and redistributed among various programs at the state and local level such as historical preservation, facility maintenance in state parks, travel research programming, and non-profit convention and visitors’ bureaus. The total bed tax revenues are public information and published by the Montana Department of Commerce. Revenues are reported on an aggregated level called “tourism regions,” with Yellowstone Country being the tourism region in which Big Sky is located. They are also reported at the county level and Convention and Visitors Bureau (CVB) level. The Yellowstone Country tourism region is made up of Gallatin, Park,Sweetgrass, Stillwater, and Carbon Counties in Montana. Analyzing the trends in lodging tax collections allows us the ability to capture tourism activity across seasons and years. It is important to note that the volume of collections from a region will vary depending on nightly lodging rates, which vary depending on demand and season.
Figure 9: Quarterly Lodging Tax Collections Over Time
Figure 9 shows quarterly lodging tax collections over time. Quarterly lodging tax collections over time demonstrate the seasonality of tourism in Montana and across the region. This graph shows that Big Sky’s largest collections typically occur in Q1 of each year, indicating a strong winter season. This is different than Montana’s and Yellowstone Country’s height of collections, which falls in Q3 of each year. This graph also demonstrates how Big Sky compares to the much larger city of Bozeman when comparing total collections.
Table 11 and Figure 10 show annual lodging tax collections over time. This illustrates that annual lodging tax collections have been generally increasing, with 2020 being the exception. While Big Sky’s lodging tax collections did not dip in 2020, Montana’s, Yellowstone Country’s, and Bozeman’s did see a decline. Big Sky’s annual tax collections have outpaced Bozeman’s since 2020. Big Sky’s annual lodging tax collections have outpaced Bozeman’s since 2020.
Table 11: Annual Lodging Tax Collections Over Time
Source: Montana Department of Commerce Lodging Tax Collections
Figure 10: Annual Lodging Tax Collections Over Time
$60,000,000
$55,000,000
$50,000,000
$45,000,000
$40,000,000
$35,000,000
$30,000,000
$25,000,000
$20,000,000
$15,000,000
$10,000,000
$5,000,000
0
Source: Montana Department of Commerce Lodging Tax Collections
Figure 11 shows Big Sky lodging tax collections, compared to Bozeman’s collections, as a proportion of Yellowstone Country and of entire state-wide collections. Big Sky’s proportion of lodging tax collections has grown over time, with collections making up 32% of the entire Yellowstone Country’s annual total in 2022, and 12.3% of the entire state-wide total. 2023 year-to-date includes Q1 and Q2 collections, where Big Sky’s largest seasonal collection occurs in Q1.
Figure 11: Big Sky Lodging Tax Collections as a Proportion of Collections
Source: Montana Department of Commerce Lodging Tax Collections
Resort Tax Collections
Montana allows for communities with tourism-based economies to elect to impose a resort tax. Collected on the sale of goods and services geared toward visitors, resort tax is designed to offset the impact of tourism without overburdening local residents. Statute allows for up to a 3% rate, with an additional 1% for voter-approved infrastructure projects. Big Sky collects a 4% tax on luxury industries, such as lodging, restaurants, alcohol service, destination resorts, and recreational facilities. In Big Sky, property tax relief is in the form of interlocal agreements and annual allocations towards infrastructure and government services. Funding decisions are made by the publicly elected BSRAD Board of Directors.
Table 12 shows Big Sky’s resort tax collections for calendar year 2022, along with the computed gross industry revenue. These numbers are broken down for each part of the district that falls within Gallatin or Madison County, and totals district-wide. Lodging is the largest industry in Big Sky, with a majority of the activity occuring in Madison County. In calendar year 2022, the Big Sky Resort Area District collected $19.49 million in tax revenue, which includes the 1% tax that is restricted for voter-approved infrastructure projects.
Table 12: 2022 BSRAD Tax Collections and Industry Revenue
Source: Big Sky Resort Area District Tax Collections
BSRAD District
Gallatin County Madison County
Gas Tax
Another excise tax that Montanan’s pay is the fuel tax. The Montana Department of Transportation currently issues a tax on all vehicular fuel sold in Montana. The taxation point of gasoline, aviation fuel, and diesel fuel is at the distributor level. The current tax rate for gasoline is $0.33, special fuel (including biodiesel) is $0.2975, aviation fuel is $0.05, and collected taxes are paid to the Montana Department of Transportation.4
A person must have a distributor’s license to distribute gasoline in Montana. To qualify for a distributor’s license, a person must engage in one or any of the following activities:
1. The business of producing, refining, manufacturing, or compounding gasoline or special fuel for use or distribution
2. Importing fuel from another state or province.
3. Exporting fuel from Montana to another state or province.
4. Engaging in the business of wholesale distribution of gasoline or diesel and choosing to become licensed to assume the Montana state gasoline and/or special fuel tax liability.
5. Grandfathered licensed prior to 1969.
6. A blender of ethanol (alcohol) and gasoline.5
Tables 13 and 14 show total fuel consumption by type, and total fuel taxes collected in 2022 for Gallatin and Madison Counties, respectively. It is important to note that these tables omit the breakout of certain fuel types (jet fuel, av gas, clear diesel, and dyed diesel), but that the consumption numbers and tax collections are included in the grand totals column for each county and city. Total fuel consumed and taxed in Big Sky equated to 2% of total fuel consumption in Gallatin County in 2022. However, it is important to note that most Big Sky residents purchase their fuel in Bozeman, Belgrade, or the surrounding county area due to higher prices in the Big Sky community.
Table 13: Total Fuel Consumption and Tax Collected, Gallatin County, 2022
Source: MT Department of Transportation
Table 14: Total Fuel Consumption and Tax Collected, Madison County, 2022
Montana’s 127 incorporated cities, 54 counties, and two consolidated city-county governments benefit from allocated fuel tax revenues. Each fiscal year, the funds are distributed on a monthly basis. They are designated to support reconstructing, maintaining, and repairing rural roads, streets, and alleys within cities or towns. Counties receive a share based on a calculation involving the ratio of rural road mileage, the rural population outside incorporated areas, and the land area within each county. Meanwhile, cities and towns receive funding following a ratio derived from the population residing within corporate limits and the extent of city or town street and alley mileage.6
Table 15 shows the county and city fuel allocations for state fiscal year (SFY) 2023. Gallatin County and it’s incorporated cities received $1.383M, or only 4.2% of the total fuel taxes collected from the same region in the previous year. Madison County and it’s incorporated cities received $183,915 in SFY 2023, which was 11.2% of the total fuel taxes collected from the county in the previous year.7
Table 15: County and City Fuel Tax Collections, SFY 2023
Alcohol
States use two types of strategies to regulate alcohol—license and control. License states provide private businesses licenses to sell alcoholic beverages, and control states have a state agency act as the sole wholesale, and in some states, also the sole retailer for some or all alcoholic beverages. Some control states also license and regulate parts of the supply chain.
Montana is a controlled state, and its agency is the only wholesaler of distilled spirits and fortified wine. However, private companies are licensed wholesalers of beer and table wine. Montana’s Department of Revenue Alcoholic Beverage and Control Division (ABCD) licenses and regulates all alcoholic beverage operations within the state.
Alcoholic beverage sales are a source of revenue for the state of Montana, funding state government operations and other support programs. In 2023, $49.3M from liquor operations went to the State General Fund, and $12.2M to the Special Revenue Fund. The Special Revenue Fund is used by Department of Public Health and Human Services for treatment, rehabilitation, and prevention of alcoholism and chemical dependency.
The ABCD is divided into two bureaus to oversee these activities – the Liquor Distribution Bureau and the Licensing and Compliance Bureau. The Liquor Distribution Bureau manages the wholesale process for distilled spirits and fortified wine, including operating state liquor warehouses to order, manage, and maintain liquor inventories, establishing defined prices for all approved liquor products to be distributed, and establishing and maintaining agency contracts
Table 16: Statewide Alcohol Tax Revenue by Type
to supply products to the 95 agency liquor stores throughout the state. Table 16 shows the total tax revenue collected, state-wide, by alcohol type for fiscal year (FY) 2021 and 2022.
Big Sky has one state-managed liquor store, located at 223 Town Center Ave.8 Gallatin County has five state-agency liquor stores, and Madison County has three. Table 17 shows each of the state-agency liquor store gross sales for FY 2022 and 2021, and where they rank in gross sales among the 95 state-wide agency managed liquor stores.
Figures 12 and 13 show the portion of total alcohol sales by store in each county. Alcohol sales in Big Sky comprised 14.3% of all alcohol sales in Gallatin County in 2022.
The Licensing and Compliance Bureau oversees and enforces compliance with the state’s alcoholic beverage laws, including licensing all individuals and businesses that manufacture, import, distribute, or retail alcoholic beverages in Montana, verifying the qualifications of alcoholic beverage license applicants, monitoring licensee activities to ensure compliance and manage violations, revocation, and other regulatory requirements.
Table 18 shows the liquor license tax and the excise tax on liquor that was collected from each state-agency liquor store and distillery in Gallatin and Madison Counties, for fiscal year 2022 and 2023. The Big Sky liquor store collected 13.3% of total Gallatin County alcohol taxes in FY 2022, and 14.2% in FY 2023.
Table 17: State Agency Liquor Store Sales, FY 2022 and 2021
Figure 12: Percent of Total Liquor Store Sales
Figure 13: Percent of Total Liquor Store Sales
Madison County
Source: Liquor Enterprise Fund Report of Operations, FY 2022, Alcoholic Beverage Control Division, Department of Revenue
Table 18: License and Liquor Tax for Gallatin and Madison Counties, FY 2022 and FY 2023 Gallatin County
West Yellowstone #59
Bozeman #9
Bozeman #193
Big Sky #190
Belgrade #76
Twin Bridges #77
Sheridan #105
Ennis #60
Source: Liquor Enterprise Fund Report of Operations, FY 2022, Alcoholic Beverage Control Division, Department of Revenue
INCOME TAXES
Personal Income
Individual income tax is the largest source of tax revenue for the state of Montana, making up 61.5% of the general fund revenue for fiscal year 2022. In 2022, individual income tax collections amounted to $2,393,807,454 according to the Department of Revenue’s Biennial Report. In 2021, the Montana state legislature passed Senate Bill 399 which made many changes to the Montana tax code, one of which was the reduction of the number of tax brackets to two: 4.7% and 5.9%.
Table 19 shows income tax liability paid by residents of Big Sky. This data was obtained from the Montana Department of Revenue and includes 2022 income tax returns based on the mailing address reported. This includes two variables, the first is the tax liability of the taxpayers after non-refundable credits. This is the number used when the Department of Revenue creates revenue estimates. The second variable is total taxpayer liability after refundable credits. This number is usually used to estimate actual taxes paid.
It is important to note that this data does not distinguish between the region of Big Sky that falls within Gallatin County and the region that falls within Madison County
Source: Montana Department of Revenue
Table 19: Personal Income Tax Returns, 2022
The U.S. Census Bureau estimates that approximately 75% of individuals employed in Big Sky live in the surrounding areas, therefore the income taxes they pay on their wages earned in Big Sky are not captured by the Department of Revenue data in the above table. Therefore, in order to quantify the impact of wages earned in Big Sky, this study attempts to estimate income taxes paid by the commuting workforce.
This estimate was built using combined data from the Census Bureau “On the Map” resource, and the Department of Revenue data used above. Table 20 shows these estimates, combined with the income tax collections reported above. When compared to the total collections from Gallatin and Madison counties, this study estimates that the Big Sky workforce contributes approximately 16.2% of the total income taxes paid by the region.
Table 20: Total Income Tax Estimates, 2022
ECONOMIC IMPACT ANALYSIS
An economic impact analysis refers to a systematic examination of how specific economic activities and spending affect various aspects of a local economy. The purpose of conducting an economic impact analysis is to evaluate the ripple effects that a given project or policy may have on a region or industry. For instance, if a city plans to build an event center, an economic impact analysis would examine not only the immediate construction jobs but also the broader economic consequences, such as jobs in tangential industries this activity impacts, what revenues stay locally, and what revenues are paid to the state.
This analytical approach utilizes IMPLAN multipliers to quantify these effects, often considering both direct and indirect impacts. Direct impacts represent the initial changes caused by the project, while indirect impacts are the subsequent economic changes resulting from the direct impacts. Together, these provide a comprehensive view of how a particular undertaking influences an economy.
In essence, economic impact analysis serves as a valuable tool for policymakers, businesses, and communities to make informed decisions by understanding the potential economic benefits and drawbacks associated with the examined activities.
The analysis examined each sector individually before totaling the impacts of the three sectors to determine a combined impact number. Substantial time went into isolating and targeting data points specific to the project area.
Resident
Expenditures
Currently, there are no publicly available household or individual expenditure estimates specific to Big Sky. In gathering the inputs to identify resident-based benefits, this study used the 2021 Personal Consumption Expenditures (PCE) for Montana, and Cost-of-Living Indices (COLI) and Composite COLIs for Big Sky that were estimated in a 2022 proprietary, private study. COLIs were used to adjust Montana PCE estimates to approximate expenditures for residents of Big Sky. The per capita expenditure was multiplied by the Big Sky population of 3,854 residents to provide the $257.1 million in resident expenditures used in this report as the direct impact.
Visitor Expenditures
To approximate visitor expenditures, BSRAD resort tax collections were used. While VISA credit card spending data was also considered to approximate visitor expenditures, it was decided that resort tax collections more accurately and comprehensively reported tourism activity by industry yearround.
Construction Expenditures
Currently, no estimates are available for gross domestic product (GDP) at the community level, making construction expenditures imperfect. The construction data presented represents major private entities’ annual spending. However, this is not all-inclusive of construction activities in Big Sky and excludes public spending on infrastructure such as the TIGER transportation grant and other wastewater treatment plant construction spending.
Data Methodology
This study recognizes that exactness in the impact estimates is challenging when classic public data is unavailable. It was agreed that the data points used in the study must be reasonable, conservative, and defensible, and the objective would not be to seek out and apply the most significant attributable data points. For example, in efforts to identify per-capita expenditures, the 2021 PCEs applicable to the project area ranged from $47,887 to $86,151 (a number that included an overall Big Sky PCE with Composite COLI). This study uses $66,733.31 for annual per capita expenditures. Estimates were based on a Big Sky PCE, modified by a local COLI.
Description of Report Variables
This analysis is divided into four reports: resident spending impacts, visitor spending impacts, private construction spending impacts, and gross economic output. The gross economic output report is the aggregate of the first three reports, and is the community’s total economic benefit, including all direct and indirect benefits. The total includes local economic benefits and benefits from the county region. The following provides descriptions for the variables in each report.
Gross Economic Output: This is the aggregated market value of goods and services produced by businesses and government enterprises from the analyzed expenditures. It essentially equals the revenue businesses collect within the community or county.
Gross County Product: This is the total value added by the production of goods and services in the economy. It represents the sum of labor compensation, capital-type income, and indirect business taxes, and is the economic impact that stays locally within the county. The subtraction of gross county product from gross economic output equals the amount of economic impact that is lost to the local region but is benefitting the larger economy, such as the state. Gross county product is best described as new money added because of the combined activities of the industry being analyzed.
Total Labor Income: This is the compensation to employees and self-employed proprietors, including wages and indirect payments such as retirement benefits, health insurance, and other similar fringe benefits.
Total Employment: This is the number of jobs generated within the impact area, including full-time and part-time positions, salaried workers, and sole proprietors.
Capital Income: This is the estimate of business profits, interest, and rental income. Capital income is best described as non-labor benefits.
Indirect Business Tax: This is the taxes and fees not based on the businesses’ income. It may represent sales tax (resort tax in this case), county property taxes against businesses, and federal, state, and local fees.
PURCHASES OF GOODS & SERVICES
ECONOMIC ACTIVITY
Impacts Measured:
Resident Spending
Visitor Spending
Private Construction Spending
JOBS CREATED IN DIRECT INDUSTRIES DUE TO SPENDING
WAGES PAID
WAGES PAID
SUPPLY CHAIN EFFECTS
BUSINESS TAX IMPACTS
AMENITIES
HOUSEHOLD TAX IMPACTS
JOBS CREATED IN SUPPORTIVE INDUSTRIES IN RESPONSE TO SPENDING
PLACEMAKING
DIRECT EFFECTS
The initial changes that result from economic activity
INDIRECT EFFECTS
The impact of local industries buying goods and services from other local industries as a result of influence in the industry
INFRASTRUCTURE
LOCAL IMPORT & PURCHASES
HOUSE HOLD PURCHASES
COMMUNITY ENGAGEMENT
SOCIAL EFFECTS
The qualitative impacts that occur in the community as a result of economic activity
INDUCED EFFECTS
Response by the economy to an initial change that occurs through the income received by wage earners and businesses due to direct spending
Resident Expenditures Impact
Table 21 details the economic impacts of resident expenditures in Big Sky. This estimate is based on a per capita expenditure of $66,733.31 for the estimated 3,854 residents. These estimates are broken out by industry based on 2021 PCE estimates obtained from the Bureau of Economic Analysis.
Total
Economic Impacts
The direct impact of resident expenditures is estimated to be $257 million, with indirect impacts estimated at $116.9 million, for a total economic impact exceeding $374.1 million.
Local Benefit: It is estimated that of the total economic impact of $374.1 million total impact, $216 million is retained in the local market.
Payroll Benefits in Dollars: The study shows that resident expenditures contribute a total of $108.9 million to local payroll and employment.
Job impacts: It is estimated that 4,030 jobs benefit from resident-based expenditures.
Capital income: Capital income and related non-labor benefits total $80.7 million that are generated from resident spending.
Indirect Business Taxes: Resident spending is estimated to generate $26.9 million in indirect business tax benefits.
Table 21: Economic Impact Analysis of Resident Expenditures
Visitor/Tourist Expenditures Impact
Table 22 details the economic impacts of visitor and tourist expenditures in Big Sky. This estimate is based on the 2022 resort tax collections, reported by industry.
Total Economic Impacts
The direct impact of visitor expenditures is estimated to be $487.3 million, with indirect impacts estimated at $217.7 million, for a total economic impact exceeding $705.1 million.
Local Benefit: It is estimated that of the total economic impact of $705.1 million total impact, $422.1 million is retained in the local market, or 59.8%.
Payroll benefits in Dollars: The study shows that visitor expenditures contribute a total of $207.3 million to local payroll and employment.
Job impacts: It is estimated that 8,707 jobs benefit from resident-based expenditures.
Capital income: Capital income and related non-labor benefits total $156.3 million that are generated from visitor spending.
Indirect Business Taxes: Visitor spending is estimated to generate $58.4 million in indirect business tax benefits.
Table 22: Economic Impact Analysis of Visitor Expenditures
Private Construction Expenditures Impact
Table 23 details the economic impacts of private construction spending in Big Sky in 2022. This is aggregated data shared by private employers detailing the construction investment in commercial activity. This does not include public spending that occurs on roads, bridges, water or sewer, etc.
Total Economic Impacts
The direct impact of resident expenditures is estimated to be $722.8 million, with indirect impacts estimated at $424.7 million, for a total economic impact exceeding $1.197 billion.
Local Benefit: It is estimated that of the total economic impact of $1.197 billion total impact, $630 million is retained in the local market.
Payroll benefits in Dollars: The study shows that resident expenditures contribute a total of $489.8 million to local payroll and employment.
Job impacts: It is estimated that 13,328 jobs benefit from private construction-based expenditures.
Capital income: Capital income and related non-labor benefits total $114.4 million that are generated from resident spending.
Indirect Business Taxes: Resident spending is estimated to generate $25.9 million in indirect business tax benefits.
Table 23: Economic Impact Analysis of Construction Expenditures
Summary of Economic Impacts
Table 24 is the summation of resident, visitor, and construction spending and estimated economic impacts. This is intended to represent the total economic impact of the community of Big Sky to the local region of Gallatin and Madison Counties, and estimate the amount of economic activity that is generated for the broader geographic region outside of isolated local impacts.
Total Economic Impacts
This summary combines the benefits of resident, visitor and construction-related impacts in Big Sky Montana. The total economic impact of Big Sky resident, visitor and construction expenditures exceeds $2.28 billion. This is a significant economic contribution from a community of less than 4,000 and only 3% of the two-county population. The total impact is comprised of $374.1 million in resident benefits, $705.1 million in visitor benefits, and $1.2 billion in construction-related impacts. Overall, $1.3B (57%) of Big Sky’s economic impact stays in the region, but $1.0B (43%) is leaked to the rest of the state.
Table 24: Total Economic Impact
Local Benefit: It is estimated of the total $2.28 billion in total benefits, $1.27 billion is retained in the local market.
Payroll benefits in Dollars: The study shows that resident, visitor, and construction expenditures contribute a total of $806.1 million to local payroll and employment.
Job impacts: Job impacts total 26,065. Of these jobs, 4,030 benefit from resident-based expenditures, 8,707 are visitorrelated and 13,328 are construction-related. Big Sky is 3% of the two-county population but its economy contributes to and supports 32% of the labor force in Gallatin and Madison Counties.
Capital income: Capital income and related non-labor benefits total $351.5 million.
Indirect Business Taxes: Indirect business tax benefits total $111.3 million.
BIG SKY’S GDP
To estimate the economic size, performance, and impact of the community of Big Sky on both the local county region and Montana state-wide, we turn to GDP. The Bureau of Economic Analysis (BEA) is the federal agency that estimates GDP on an annual and quarterly basis in the United States. While the BEA creates these estimates nation-wide, state-wide, and countywide, they do not create estimates at a more local level. Therefore, to estimate the GDP of Big Sky’s industries, we can use the “Gross County Impact” variable from the previous Economic Impact section. Gross County Impact is an estimate of the economic impact that stays within the local region, and is the equivalent to local GDP. It is important to note that Gross County Impact is not the entire economic impact of Big Sky, but only what stays in the local economy. There is other economic activity that bleeds into the larger statewide economy, and this is captured by Total Gross Impact. In this analysis, the Gross County Impact variable serves as Big Sky GDP estimates and is comparable to county-level GDP obtained from the BEA for 2021. Total Gross Impact serves as state-wide GDP estimates and is comparable to Montana GDP also obtained from the BEA.
As does the economic impact analysis, Big Sky GDP estimates include the contributions of both visitor spending and local resident spending on the region. The industry breakdown provided in the previous section is rolled up under the appropriate high level private industry seen below.
Table 25 shows the GDP comparison of Big Sky to Gallatin and Madison Counties in 2021. Total Regional GDP represents Gallatin and Madison Counties GDP summed together to achieve a regional total. Big Sky Total Industry Revenue represents summed totals from the Gross County Impact estimates in the applicable economic impact analysis tables. In Table 29 we can see that Big Sky makes up 16.34% of the total private industry GDP. Big Sky does not have any government enterprises, and when this industry is factored into the total, Big Sky’s GDP makes up 14.65% of the regional total.
Since Gross County Impact are estimates that are limited to the two-county region, and there are economic impacts that occur outside of the two-county area. Therefore, to compare the entire economic impact of Big Sky to state-wide GDP, we look at the Total Gross Impact of all industries from Table 28. Big Sky’s total GDP is estimated to be $2,276,889,870, or 4.3% of the Montana State-wide GDP reported at $52.95B.
Table 25: GDP by Industry and County Compared to Big Sky, 2021
Source: Bureau of Economic Analysis **GDP estimates are taken directly from the Gross County Impact column in the Economic Impact Analysis Section
CONCLUSION
The economic power and broad impact of Big Sky is undeniable. The community of approximately 3,800 residents generates 4% of Montana state-wide GDP, and 14% of GDP in Madison and Gallatin Counties. This economic engine impacts 1 in 5 jobs throughout Madison and Gallatin Counties, and collected over $58M in property taxes in 2022. For every $1 spent in Big Sky, $2.50 of economic impact is created that the region and state benefit from.
However, this massive economic impact is not without its constraints. Between 2010 and 2020, Big Sky grew over 54%, putting pressure on existing infrastructure development to further accommodate the growth. Big Sky’s recent capital improvement plan (CIP) has identified over $770M in infrastructure needs to keep up with growing demand from residents and tourists alike. This cost estimate takes into account essential infrastructure to keep the economic engine of Big Sky generating the impact from which the entire region receives benefit.
Adding additional demand on infrastructure in the community of Big Sky is the large amount of tourists each year. Big Sky is the largest contributor to lodging tax, making up 12.3% of total state-wide collections in 2022. Big Sky only receives 11% of that back, and these funds are legislatively required to be spent on tourism marketing.
Due to overwhelmingly high housing costs, 75% of the workforce lives in the surrounding county areas and commutes into Big Sky. Due to this, transportation is a top priority for all that live, work, and do business in Big Sky. While the 191-highway is the only public access to Big Sky, it is located in a narrow mountain canyon and there are few physical solutions to ease traffic flow. Funding solutions for transportation is also a challenge, with the state of Montana collecting $32M in fuel taxes from Gallatin County in 2022 but only reallocating 4.2% back to all incorporated governments within Gallatin County the following fiscal year (FY23).
Lastly, property taxes, a typical source of revenue that local governments use to fund their services, is a complicated set of taxing districts for the unincorporated Big Sky. In 2022, Madison County collected $37.8M from the two Big Sky tax districts. Out of the $37.8M collected, only $2.26M (6%) went to support direct services in the community. $18.8M (50%) went to other Madison county-wide levies, and $16.6M went to state school equalization levies. Gallatin County property taxes collections were significantly more balanced, with 42.8% ($8.69M) of the total $20.3M in collections going to direct services in Big Sky. 34.2% ($6.95M) went to Gallatin county-wide levies, and 22.9% ($4.66M) went to state school equalization levies.