
24 minute read
Madhukar Tripathi
Telecom Network And Network Testing
Madhukar Tripathi
Advertisement
Head - MARCOM &OPTICAL PRODUCTS, ANRITSU INDIA PVT.LTD

Test and Measurement: Network Test Network testing is very broad subject. In this article I am covering telecom (mobile) network testing. Telecom network can be divided into 2 major category- wired network and wireless network from installation and operation point of view. Telecom network is hybrid (combination of Wired and wireless network). Wired and Wireless network are essential and important part of all telecom network. Due to 5G network deployment worldwide this article covers network testing having 5G network as focus. Wired Network Measurement
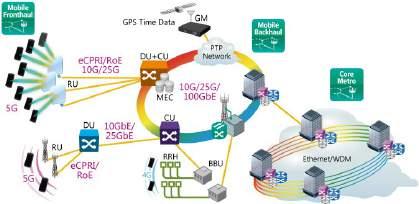
Figure -1: 5G Mobile Network
CU- Central Unit DU- Distributed Unit RU- Remote Unit eCPRI- Ethernet Common Public Radio Interface RoE- Radio Over Ethernet MEC Mobile Edge Computing GM/GMC- Grand Master Clock Transport Measurements required by 5G Mobile Network I&M (Installation and Maintenance) contain following measurements: • 5G Mobile Network eCPRI/RoE Measurements • 5G Mobile Network Latency Measurements • 5G Mobile Network Time Synchronization Measurements
5G Mobile Network eCPRI/RoE Measurements
Common Public Radio Interface (CPRI) compliant interface equipment has been used for 3G and LTE systems to convert the mobile fronthaul wireless signal to the optical signal. CPRI is commonly said to need to be about 16 times faster than the radio transmission speed to perform digital conversion of radio signals. Since 5G transmission speeds are about 100 times faster than LTE, a new eCPRI/RoE technology based on market mainstream Ethernet is being adopted. With 5G featuring high speeds and large capacity, maintaining mobile fronthaul communications quality requires communications and latency tests measuring either CPRI or RoE frame bit errors and latency with high accuracy.
The 1914.3 (RoE) and eCPRI frame formats both use Ethernet in their lower layers, allowing timing areas to be tested using standard Ethernet timing methods. Areas such as latency, routing, switchover time, and BER over the 1914.3 and eCPRI frame formats must also be tested.
5G Mobile Network Latency Measurements
Since maintaining minimum assured communication speeds is generally impossible using Ethernet, latency times of the entire network including the 5G mobile fronthaul must be managed strictly. To suppress latency times between the mobile fronthaul 5G antenna and Core/Metro network, it is important to minimize the latency of the network equipment as much as possible. Implementing the 5G low-latency feature requires using two testers to accurately measure one-way delay between two distant separate points.
Both the 1914.1 and eCPRI standards require a known network latency, ensuring delivery of the frame payload to the RF interface accurately and reliably. Different standards offer insight into network latency requirements; 3GPP discusses how latency from the BBU to UE and back RTT must be within 1 ms for URLLC, while IEEE 802.1CM requires a latency of 100 µs across the transport network between the CU and RU. IEEE 1914.1 focuses on the area of the transport network, offering more in-depth details, splitting it into sub-classes based on network segments and traffic types.

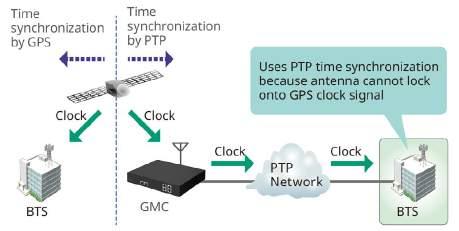
At present, time synchronization between base stations commonly uses GPS time data, but this method is limited by the ability of GPS radio waves to reach some locations where base stations are installed, such as inside buildings and underground shopping malls, etc. To remedy this problem, PTP-based time synchronization is being deployed at some locations. Since PTP is unaffected by installation location, it is being proposed for 5G, making it more important than previously Use of the 5G mmWave band requires many small base stations because the high radio-wave frequency only propagates over short distances. As a result, the Precision Time Protocol (PTP) is used to synchronize time between base stations. Time synchronization using PTP demands strict evaluation of the entire network to maintain time differences within the permissible range.
Mobile fronthaul test include:
• eCPRI/IEEE1914.3 Frame test and high-resolution Latency test • CPRI/OBSAI L1 test • CPRI/OBSAI L2 test • Pass-through monitoring • CPRI over OTN
CPRI/OBSAI measurements
• CPRI/OBSAI L1 Test • CPRI: 614.4, 1228.8, 2457.6, 3072.0, 4915.2, 6144.0, 9830.4, 10137.6 Mbps 12.1651 Gbps, 24.3302 Gbps • OBSAI: 768, 1536, 3072.0, 6144.0 Mbps – Clocks: Internal, External (10 MHz), GPS – Level measurement (dBm) – Bit rate (bps) and deviation (ppm) measurement – Alarm/Error detection (Signal Loss, PSL, Pattern Error) – Unframed BER measurement • CPRI L2 Test – Link status monitoring – Alarm/Error detection (Signal Loss, LOS, LOF, R-LOS, R-LOF, RAI, SDI, Reset, PSL, LCV, INVSH, Pattern Error) – Framed BER measurement – RTD Measurement (min, avg., max) • Pass-through monitoring • CPRI over OTN – OTN Alarm/Error detection – L1 Unframed BER measurement using CPRI client signals • Fiber end face inspection using VIP (Video Inspection Probe)
CPRI over OTN Several vendors are working on CPRI over Optical Transport Network (OTN) solutions supporting transport of the raw radio (CPRI) data from the RE over optical fiber to a centralized location for baseband processing. • A single location can serve multiple REs. • This level of consolidation has huge power and cost savings over the distributed approach without impacting network scalability. OTN supports transport of several protocols over the same fiber, offering OTN operators fault management, performance monitoring, and protection mechanisms coupled with low cost-of-entry and the ability to support current, future, and legacy infrastructure technologies. OTN operators also enjoy the advantage of using the same network-wide management system.
Mobile backhaul test include:
• Test and analysis of Synchronous Ethernet and PTP: o SyncE (ITU-T G.826x) o PTP (IEEE 1588 v2) o G.8265.1, G.8275.1 and G.8275.2 telecom profiles o Time/Phase error measurement. (with High Performance GPS Disciplined Oscillator MU100090A) • Synchronous Ethernet run together with normal Ethernet functions including: o Ethernet tests at 25 Gbps, 10 Gbps, 1 Gbps, 100 Mbps and 10 Mbps o Ethernet Service Activation Test (Y.1564) o Automated RFC 2544 tests of Throughput, Frame Loss, Latency or Packet Jitter and Burstability o BER tests – include Frame Loss and Sequence Error tests o Service disruption measurements Ethernet test include: • Ethernet tests at 100 Gbps, 40 Gbps, 25 Gbps, 10 Gbps, 1 Gbps, 100 Mbps and 10 Mbps • Traffic generation up to full line rate • IPv4 and IPv6 test • Ethernet Service Activation Test (Y.1564) • Industry defined IEEE, IETF and ITU-T benchmark testing • TCP Throughput option (RFC 6349) • BER tests – include Frame Loss and Sequence Error tests • Service disruption measurements • Ethernet OAM tests • 10G WAN-PHY tests • Synchronous Ethernet test (ITU-T G.826x and IEEE 1588 v2) • Ethernet Multistream • Stacked VLAN (Q-in-Q) • MPLS tests
• MPLS-TP and PBB/PBB-TE tests • Ping • Traceroute • Frame capture for protocol analysis with Wireshark • Electrical cable tests and optical signal level test
SyncE (Synchronous Ethernet)
Regular Ethernet is an asynchronous communications standard where the timing of data sent and data received are not matched. This simplifies the type of transmission equipment needed. Smartphones, however, require synchronized timing of data between base stations in order to permit uninterrupted transmission as the Smartphones move between base stations. The ITU-T organization has established a new standard called SyncE that adds a function for synchronizing asynchronous Ethernet communications. In addition, IEEE also has a new standard known as IEEE 1588 v2 for matching times.
Anritsu’s Ethernet test solution supports standard Ethernet communications and is also the ideal platform for verifying, developing and troubleshooting the new SyncE (Synchronous Ethernet) and IEEE 1588 v2 functions used by base stations.
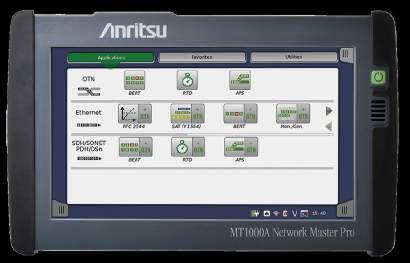
Anritsu Network Master Pro MT1000A is ideal test platform to support all legacy wired network and latest 5G network supporting backward compatible 3G and 4G network. SEEK is a automation, one button feature which helps engineers to test network in less time, accurately.
Wireless measurements are performed at various stages-right from network planning to deployment and operation to network maintenance.
Due to 5G technology focus most of operators are planning 5G network or will roll out 5G network soon. Much of the world is focusing initial 5G rollouts on the 3GPP defined FR1 bands (those carriers with frequencies below 6 GHz). South Korea Japan, China, USA , Germany etc rolled out 5G network. Note: 5G technology Spectrum is divided into 2 parts- FR1 and FR2.
FR1- Sub 6Ghz band / frequencies. FR2 –millimeter-wave (mmWave) – frequencies.
There are practical differences between FR1 and FR2 signals. There are also technological differences that will impact performance and testing. Per the 3GPP standard, mmWave 5G NR signals have subcarrier spacing of either 120 or 240 kHz, compared to only 30 or 60 kHz for FR1. This results in a wider sync signal block (SSB) – 28.8 and 57.6 MHz, respectively. The SSB contains the SSS, PSS, and PBCH information, which are required for demodulation and signal identification. Therefore, any instrument or device must have the capability of capturing wide bandwidths of data (at least as wide as the SSB) in order to make proper ID of and communication with the radio. FR2 signals also have more SSB beams.
All 5G NR base stations transmit SSB beams through the antenna’s transmission sector, but mmWave radios use between 12 and 64 beams, whereas FR1 radios are limited to 4 or 8 beams. With 64 beams, the radio can transmit narrower beams with more power, which improves the efficiency of the radio and helps avoid interference. However, more beams require decoding more bits from the PBCH in order to read out all 64 beam indexes in their correct position. It also requires a greater number of antenna elements in the antenna array used for beam forming. This makes it impossible to do connected testing and verification of the radios, forcing users to do all testing OTA.
Finally, mmWave signals have shorter wavelengths (as hinted in the name), which will cause greater propagation loss through both air and most physical objects – including windows, which are often coated with UV protective films which strongly attenuate mmWave RF. This means 5G mmWave service will require greater radio density and strategic placement/ alignment. It will also make signals more vulnerable to interference and requires test equipment with lower noise floors and faster sweep speeds in the mmWave bands.
Testing 5G NR mmWave
Spectrum clearance, interference test is carried during network planning stage after spectrum allocation. Once spectrum is cleaned, scanned for allocated frequency, network planning, sites are decided.
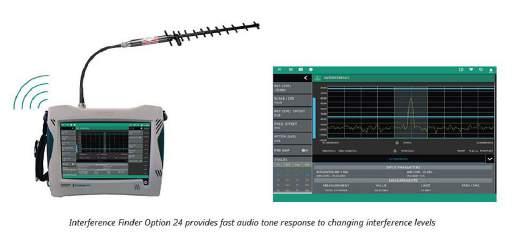
Installation Verification
• Once spectrum is clear and radios are going up, it will be key to ensure the radios are configured correctly and performing per standard. – validate the performance of the gNB base station with essential measurements that are in full compliance with 3GPP TS 38.104 V15, including i.e. The Field Master Pro MS2090A offers a full 5G NR demodulation suite, which decodes the SSB beams to provide the following
information: • Cell ID, Sector ID, and Cell Group • Frequency error • Time offset • Individual beam RSRP, RSRQ, and SINR • EVM of the individual SSB parts • Multi cell measurements • Channel power / occupied bandwidth
Single Cell Testing
ID information is important for verifying the configuration of the radios. Network operators rely on proper radio identification to pinpoint issues with service, interference, or gaps in coverage. Cells are usually hung in groups of three, each covering one of three sectors. The cell ID is then equal to 3 x CELL GROUP + SECTOR ID Frequency error is key to performance, where less error promotes greater signal quality and faster throughputs. According to the 3GPP standard for 5G NR OTA testing (TS 38.104, section 6.5.1.2), the base station frequency error should comply to standards as follows: Time offset is key to full network performance. All 5G NR signals should be tightly synchronized to GPS. Time offset measures the difference between the GPS clock and the start of the frame. This avoids interference between cells. Per the 3GPP standard, the time offset should not exceed 2 µs at a distance less than 1 km. RSRP, RSRQ, SINR, and EVM are key indicators of radio performance and signal quality. The average EVM of the signals should typically be under 15% with a high quality beam (one with high RSRP and SINR). Multi Cell The Field Master Pro MS2090A also offers a measurement of multiple radios in the same capture (called Multi Cell in the instrument). By utilizing advanced noise cancellation methods, it is able to read out multiple cell IDs for a single geographic point and show the RSRP of every beam from strongest to weakest. This is powerful for mapping coverage in these dense radio environments. Network planners can utilize the Multi Cell measurement to identify radio handoff points and possible gaps in coverage, even mapping out the
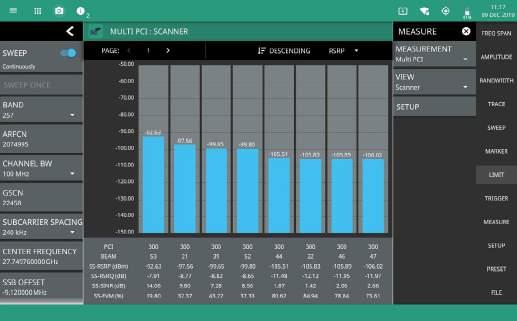
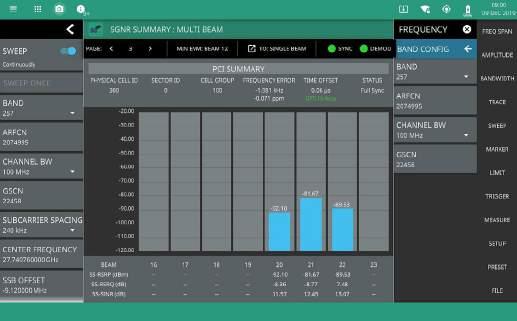
coverage, cell by cell. Post installation of 5G sites, coverage mapping test is also carried to ensure Base Station (BS) is transmitting to designed / planned area.
5G coverage mapping – receive a clear representation of the signal strength of 5G transmitters over intended geographic area by continuously measuring RF data – including 5G channel power, EIRP, or RSRP – with results graphically displayed on a
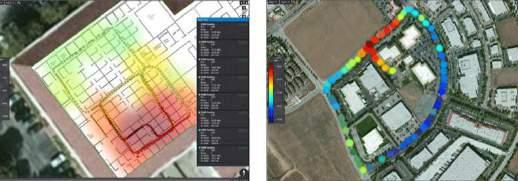

digital map or building floor plan The Field Master Pro MS2090A with NEON mapping tools allows users to map out beam powers across a 5G mmWave radio’s full sector
Conclusion: 5G network is evolving and involves more complex methods, hence testing of network & devices are very important part of network life and network performance. Network performance testing reflects customer experience. Network testing will pay in longer term during network deployment and post deployment. Selection of right testing tool is equally important. This ensure efficient network testing and solve issues in timely manner.
Biometric System-on-Card, The 2 Challenges Behind Fingerprint Bank Cards
Biometric System-on-Card
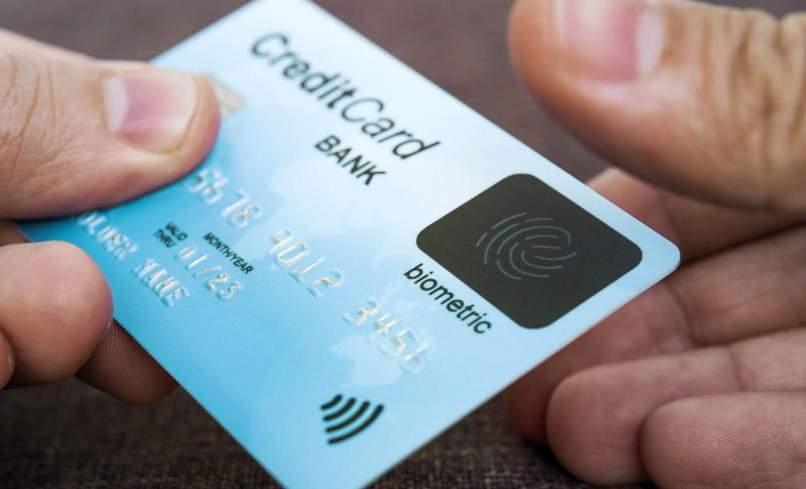
On July 2020, ST announced co-developing a Biometric System-on-Card (BSoC) platform with Fingerprint Cards. We will provide an STM32 generalpurpose microcontroller and an ST31 MCU. The latter uses an Arm SecurCore SC000 core that relies on a 40-nanometer process node. ST will also bring its STPay solution, which relies on a JavaCard based operating system for banking applications.
Moving Security From the PIN to the Finger Tip
The announcement was symbolic, and it appeared on news sites because it serves as a sign of an emerging trend. According to a study by ReportLinker, the global contactless biometrics technology market should reach $18.6 billion by 2026. The study also cites the recent pandemic as a driver of adoption. Consumers are looking for ways to pay while staying physically distant. They also wish to reduce interactions with potentially contaminated hard surfaces. Hence, secure payments through contactless cards with biometric authentication are ever more popular, and introducing BSoC solutions will help increase – or even remove – today’s contactless cap limits.
Unfortunately, as BSoCs become mainstream, getting precise and relevant information can get difficult. Buzzwords abound, platitudes follow, and managers can have a hard time finding accurate data. We thus thought that it was essential to contextualize the ST and Fingerprint Cards announcement. Additionally, the core technologies behind biometric payment cards are sipping into other forms of identification, such as employee badges or ID cards. It is thus crucial for thought-leaders and decision-makers
to understand the technical challenges inherent to these emerging technologies.
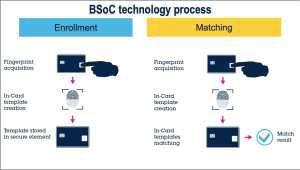
The hardware building blocks are relatively straightforward. There’s a fingerprint sensor, a general-purpose MCU to extract the image it captures, and a secure element. The latter stores the fingerprint image after enrollment and matches it before any transaction in a secure environment. However, a biometric system-on-cards can only be successful if it overcomes multiple challenges.
A biometric system-on-card in action A biometric system-oncard in action Adding biometrics on a card is challenging because manufacturers must still meet existing thickness requirements to ensure compatibility when swiping or inserting the card in existing readers. The ISO/IEC 7810 standard dictates that all bank and ID cards must have a thickness of 0.76 mm. Other standards also define a card’s ability to bend without the connectors or components breaking. However, satisfying those stringent requirements mean that companies that master biometric bank cards can easily port their solutions. Biometric ID badges, employee’s identification with fingerprint recognition, and more become a lot easier to make.
Engineers must also solve the technical challenge behind the card’s power consumption and energy harvesting. Hence, ST implemented a secure element that can harvest power from the contactless reader and distribute it to the entire card. Such a system is possible because the general-purpose MCU (STM32) and the ST31 have such a low power consumption that they can run with just the energy harvested during magnetic coupling. A BSoC is thus innovative because it uses the same NFC technology as the previous generation of contactless bank cards, but it can now power more components, such as a fingerprint sensor and a general-purpose MCU.
Storage and Computational Throughput
Capturing the user’s fingerprint and storing the associated template after enrollment will necessarily require more memory. Hence, engineers working on biometric system-oncards face enhanced hardware requirements. The secure element executes the application, secures information, including the biometric template, and runs the algorithm that matches the fingerprint to the template to authenticate the user. There’s thus a need for more storage for the template and the matching algorithm. Similarly, the general-purpose MCU extracts the fingerprint from the sensor and sends it to the secure element, which features high computational performance and low power consumption.
Decision-makers thus understand the importance of hardware optimizations. The STM32 microcontroller has low power modes to improve energy efficiency significantly. Similarly, we ensure the ST31 runs the fingerprint matching algorithm as quickly as possible. Indeed the total transaction time, including the fingerprint matching, must take less than one second. The platform must, thus, offer the greatest optimizations and guarantee a flawless user experience.
Biometric System-on-Card: The Challenge of Security and User Experience Ease-of-Use
A challenge that users face is the lack of standardization around the enrollment process, which must offer a good tradeoff between overall security, performance, and user convenience. Implementers are looking into different enrollment mechanisms that would utilize a sleeve, a mobile device, or a reader with optional LEDs on the card and the enrollment support. The capture must also be fast enough and comply with biometric standards such as FAR (False Acceptance Rate) and FRR (False Recognition Rate) requirements that regulate biometric interactions. False positives are severe breaches of security and make the whole system unreliable. On the other hand, a false negative creates friction that end-users hardly tolerate. Teams working on their system must, therefore, find the right balance between accuracy and performance.
Security
A BSoC distinguishes itself from current solutions by offering better biometric processing and more secure protection of the assets, such as the sensor image and templates. As a result, biometric cards represent a vastly more secure system than a PIN authentication or basic contactless solutions, by offering more robust security and privacy protections. However, as we saw in this blog post, designing a BSoC is challenging. Hence, adopting the ST and Fingerprint Cards solution means teams can bypass this complexity, ensuring their end-users trust their biometric system-on-card. The STPay platform also guarantees fast processing times, which are crucial for a successful experience.
(The article is an original piece written by STMicroelectronics)

ACCELERATING THE TRANSFORMATION TO PREDICTIVE CARE
For most patients, the process of reaching a diagnosis is familiar and predictable. You meet with your physician, undergo a battery of tests at the doctor’s office, work toward an interpretation of your symptoms and plan for care.
But what if it didn’t work that way? What if, instead of following a reactive approach to treatment, doctors had access to digital healthcare technology that could help identify early warning signs using data captured from genomic analysis, advanced imaging or a wearable device—and then, rather than treating an existing illness or condition, devise a plan to help prevent it instead? And what if wearable technologies could identify and alert people to indicators of viral infection before symptoms develop?
“We’re using the digital concept to keep people out of the hospital and treat diseases sooner in the process using interventions based on remote patient monitoring,” says Dr. Curtis Lowery, director of the Institute for Digital Health and Innovation at the University of Arkansas for Medical Sciences. “Now we’re able to treat people in their home, with data flowing in from an electronic scale, a blood pressure monitor or even a pulse oximeter.” In the midst of a global pandemic, the ability to assess data and treat patients virtually has benefits beyond convenience and cost savings. Now virtual treatment is an added safety measure that can literally save lives.
“We're using the digital concept to keep people out of the hospital and treat diseases sooner in the process using interventions based on remote patient monitoring.”
Curtis Lowery Director of the Institute for Digital Health and Innovation| University of Arkansas for Medical Sciences
Prior to the COVID-19 outbreak, the digital healthcare technology industry’s leading innovators, including Analog Devices, were already putting next-generation technology into the hands of providers. One example is vital-signs-monitoring technologies, like wearables and hearables. With them, unobtrusive data capture takes place continuously—even when the patient leaves the doctor’s office. This allows physicians to extract actionable insights, making it easier to reach accurate diagnoses. Now, according to Pat O’Doherty, senior vice president of digital healthcare at Analog Devices, the pandemic has resulted in a tidal wave of demand for their crucial digital health technology products. “We prioritized the production of healthcare-related technologies that are essential for medical devices on the front line, such as ventilators, infusion pumps, patient monitors, diagnostic testers, CT scanners and digital X-ray machines.”
A CALL FOR CARE
According to the Centers for Disease Control and Prevention, 6 in 10 Americans live with a chronic condition, such as diabetes or heart disease. These illnesses are among the leading causes of death in the United States and, along with mental health, comprise 90% of the country’s $3.5 trillion annual healthcare expenditures. Add an aging population and a projected shortage of registered nurses into the mix, and you begin to understand the urgency around the adoption of new digital health solutions.
“There’s a very serious challenge for the finances of the healthcare system, and it will ultimately result in poor patient care unless we can intervene and transform it to be more patient-centered,” says Martin Cotter, senior vice president of sales and digital marketing at Analog Devices. “That means driving efficiency for all the different partners of the ecosystem, whether it’s the physician, provider, payer or patient.”

THE RISING COST OF HEALTHCARE
Healthcare expenditures in the United States are the highest in the world, and costs are only expected to grow in the years ahead.
$3.5T $6T
U.S. HEALTHCARE SPENDING IN 2017
PROJECTED SPENDING BY 2027
Sources: “National Health Expenditures 2017 Highlights,” Department of Health & Human Services; “National Health Expenditure Projections 2018-2027,” Centers for Medicare and Medicaid.
With decades of expertise developing sensors used for vital signs monitoring, Analog Devices is enabling the next generation of wearables that could put the digital healthcare technology industry (and patients) on a more positive path. For example, picture the traditional fingerstick test diabetes patients use, typically multiple times a day, to monitor blood glucose levels and administer insulin. Now picture a low-profile sensor that sits at the surface of the skin and takes continuous measurements, providing an uninterrupted view of the patient’s health.
Devices like this are giving diabetics an improved quality of life, and physicians are also empowered, helping patients better manage their disease and potentially even slow its progression.
“It’s better to measure the patient over a long period of time rather than only in a controlled, clinical environment. The inclusion of real-world conditions provides much more accurate data, giving physicians a better way to manage the health of their patients,” Cotter says. “An even more exciting proposition would be to non-invasively track the progression of chronic diseases, so that we can someday keep the patient from needing a particular medication.” While some continuous monitoring solutions are already available, the technology has yet to fully proliferate throughout the industry, leaving the door open for all manner of innovation. Analog Devices’ wearable health monitor resembles a typical smart watch, but constantly pulls data about the wearer’s heart rate, body temperature and other vital signs. It can be worn on the wrist or as a patch on the skin, storing measurements on an SD card or wirelessly sending the data to a smart device. With its combination of embedded sensors, processing power and wireless communication, ADI’s wearable health monitor could be a model for the next stage of digital health.
Analog Devices is also collaborating with a nanosensor pointof-care diagnostics leader to deliver rapid viral and bacterial test technologies that could have major impact on detection and prevention of COVID-19 and future pandemics.
“Care is rapidly moving out of hospitals and toward the home, creating the need for a new generation of clinical-grade technology products that are smaller, easier to use and lower cost. The rate of this fundamental change is accelerating due to the pandemic and we are prioritizing our r&d investments to be able to meet this new demand.”
Patrick O’Doherty
Senior Vice President of Digital Healthcare | Analog Devices
CARE YOU CAN WEAR
Wearable devices could soon allow patients to continuously monitor various health parameters, driving a more preventative approach to care. Meanwhile, wireless connectivity would arm physicians with a continuous stream of data.

BRINGING IMAGING INTO FOCUS
While some of healthcare’s biggest opportunities will take place in the home, the instrumentation used in hospitals and clinical settings is also getting an upgrade. The technology behind common tests like X-rays and CT scans is becoming more sensitive and precise, resulting in higher-resolution images with lower noise levels.
Analog Devices’ deep experience developing signal processing technology and sensors enabling data collection—connecting the physical world with the digital one—plays a similarly vital role here. “With CT scanning, precision sensing allows for faster scan times, reducing the dose of radiation to the patient,” says Jen Lloyd, vice president of precision technology and platforms at Analog Devices. “Meanwhile, artificial intelligence can be applied to the images to draw the physician’s attention to certain key areas, allowing them to work more efficiently.”
THE PICTURE OF HEALTH
DIGITAL IMAGING SOLUTIONS DRIVE EFFICIENCY IN THE HOSPITAL WHILE SUPPORTING PHYSICIAN DECISION-MAKING.

DIGITAL X-RAYS
Converting an analog signal can save thousands of dollars in chemical processing costs and can result in a clearer, lower-noise image.
CT SCANS
Precision sensors and digital processors improve image quality and reduce scan times, exposing patients to less radiation.
ULTRASOUNDS
Analog-to-digital converters with higher resolutions and data rates are paving the way toward 3D imaging while bringing down the cost of machines.

Precise imaging, clinical-grade vital sign monitoring, and improved digital healthcare technology, O’Doherty explains, are helping physicians improve diagnosis accuracy and allowing people to manage chronic illnesses more effectively. But the ultimate goal is to move from reactive to predictive medicine altogether, resulting in a better quality of life for people and reducing the strain on the health care system.
“I’m seeing an appetite among practitioners for digital technology that helps manage the cost of healthcare, to be able to reduce the amount of time that people are ill or cure something before it becomes a problem. My sense is that we’re in for decades of potentially very explosive growth in the healthcare sector, both at the large machine diagnostics level and at the everyday, human level.”
Vincent Roche
President and CEO | Analog Devices
Keeping pace with explosive growth will require more than just further investment in digital health, but also sophisticated wellness, imaging and vital-signs-measurement solutions developed by technology partners who are already driving the transformation.
(The article is an original piece written by ANALOG DEVICES)


