14 minute read
Madhukar Tripathi
INTERFERENCE HUNTING IN THE FIELD
Madhukar Tripathi
Advertisement
Head –MARCOM & OPTICAL PRODUCTS, ANRITSU INDIA PVT. LTD

What is Interference?
Interference is any unwanted signal that makes a radio receiver’s job harder such as illegal transmissions, unlocked and drifting transmissions, noise from leaky cable TV feeds, unsuppressed EMI from power tools or microwave ovens, local high power radios and even multi-path from nearby buildings and hills. Interference from both illegal and unintentional signals is a significant problem for mobile service providers, security services and government regulators. Interference degrades network performance, causing critical communications to be interrupted.
Sources of Interference
• Illegal jammers • Unlocked or drifting radios • Oscillating repeaters • Damaged or leaking RF cables • Improper antenna positioning • Pulsed signals (similar to radar) • Signals hidden in LTE uplink channels • “Pirate” TV/radio stations and BTS cellular equipment operating illegally
Spectrum monitoring system

Benefits of Real-time Spectrum Analysis for Resolving Interference Problems
RF field engineers have relied on spectrum analyzers to detect transient interferers and unwanted hidden signals for each wireless communications generation. As we enter a new era where millimeter wave (mmWave) frequencies are becoming more commonplace due to the rollout of 5G and advanced aerospace/military systems, selecting the proper spectrum analyzer becomes more important. In fact, it can
be the difference between quickly and efficiently locating and removing an interfering signal or missing it entirely and having network performance fail to meet key performance indicators (KPIs).
Many modern spectrum analyzers can perform the following functions -- real-time spectrum analysis (RTSA), swept-tuning and signal analysis. Each has advantages and limitations for interference hunting.
Advantages of Real Time Spectrum Analyzers
RTSA's continuously acquires samples of pulsed or transient signals where a fast Fourier Transform (FFT) is performed. RTSA's are particularly useful for finding intermittent interference signals. The RTSA process flow can acquire a new sample frame while simultaneously performing the FFT on the previous sample frame. This parallel processing requires fast digital hardware and a large memory buffer. RTSA spectrum analyzers perform FFTs at an extremely fast rate. For example, the Field Master Pro™ MS2090A, can perform 527,000 FFTs per second for a 512-point FFT.
Most RTSA instruments display the FFT data in a colorful density display, which summarizes the amount of time RF energy is present at any given frequency/amplitude during the capture. This is especially useful in interference analysis for two reasons. First, signals of very short duration will still be displayed on the screen. Second, when an interfering signal is hidden inside an intended modulated signal, it will still be displayed on screen. Often, these signals will be shown in a different color for easy recognition.
Swept-tuned Spectrum Analyzer
A swept-tuned spectrum analyzer uses an architecture that sweeps its local oscillator (LO) to down-convert the input frequency range to a fixed intermediate frequency (IF). It is then filtered by the resolution bandwidth (RBW) filter and detected. This type of spectrum analyzer can only see a small portion of the frequency span at any moment. It is blind to transient signals that appear when the sweep is scanning a different part of the input frequency range. Wideband monitoring is often most useful in the detection phase of the interference mitigation process.
Signal Analysis Process
To determine the type of interference under investigation, the signal can be demodulated. Various parameters such as signal quality, color codes and identification information (depending on signal type) can be obtain. Knowledge of the signal type can ofter help the user in addressing the interference problem. Where signal identity can be determined, the problem can sometimes be address with a phone call to the offending party.
Probability of Intercept (POI)
The key performance metric when evaluating spectrum analyzers, especially for finding transient interference, is the probability of intercept (POI). POI is defined as the minimum signal duration necessary to accurately measure the amplitude of a continuous wave (CW) signal. The smaller the POI, the higher the chance of catching intermittent interference.
POI is affected by several factors, including FFT processing speed, sample rate, window overlap, RBW, and span. Anritsu offers a wide range of interference testing tools and software to make engineers job easy. Using a right tool and software will enable interference detection and documentation simple and fast.
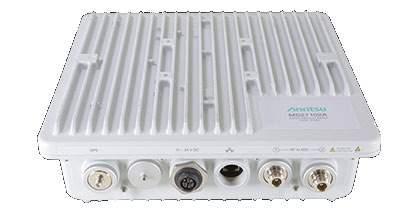
(A) Anritsu’s MasterClaw™ multi-dimensional service assurance solution, coupled with our Remote Spectrum Monitors, identify possible interference by providing real-time visibility of communications network performance and specific RFfocused monitoring. MasterClaw provides Communications Service Providers with an unrivaled, real-time view into network performance (hand-offs, RSSI, data rates, etc.), which enables optimization of customer experience, better understanding of how customers use data services, and visibility of customer impacts. The solution provides unique visibility into the experience of ALL your customers, including how many users are impacted by any problem, which services are impacted, and when. MasterClaw has actionable intelligence to identify, prioritize, and resolve problems before they impact your customers. Anritsu Remote Spectrum Monitors are housed in an environmentally secure enclosure, can be permanently located outdoors, and are tolerant of all-weather conditions. By installing an array of these devices around a large geographic area, it is now possible to monitor for RF interference city- or even statewide. Each Remote Spectrum Monitor is connected by Ethernet back to a central monitoring location. Using Anritsu Vision™ software, the RF environment may be monitored 24 hours a day, 7 days a week. Alarms can be set to automatically send alerts when interferers are identified. BTS Master™ now has a CPRI option for remote radio heads PIM Master™ identifies passive intermodulation Interference Hunting.
(B) Base Station Interference Testing: Once possible interference issues have been identified, it’s time to go to the nearest affected base station. Checking the base station receive signal, typically at an RX test port, is a good place to start. Interfering signals will often be obvious at this point. Once spotted, it is important to decide if the interfering signal is being produced by a base station fault or is from an external source. If it is coming from the base station, Anrtisu has an array of test equipment to identify faults. Passive intermodulation, bad transmitters, and damaged feedlines or antenna can all contribute to interference. Anritsu offers a full portfolio of base station test and measurement equipment for maintenance and optimization. If the interference is coming from outside of the base station, a spectrum analyzer allows you to see the spectrum and better identify what type of interferer you are looking for based on the frequency, spectrum shape, time of day, and spectrum analyzer setup. The results of your testing should give you an initial estimate 2of the emitter location, at least identifying the sector

VISION SOFTWARE:
Spectrum monitoring systems facilitate the identification and removal of interference signals that degrade network capacity. By monitoring spectrum on a continual basis, problem signals can be identified as they occur in real time. Patterns of unwanted signal activity can also be examined, providing an efficient way to characterize and locate the source of the interference problem. In addition to interference detection, spectrum monitoring is also used to characterize spectrum occupancy. Government regulators and operators are often interested in determining the usage rate for various frequency bands. Monitoring these frequencies provides the information needed to optimize spectrum for maximum utilization. Spectrum can be re-purposed for other applications or multiplexed with other signals using cognitive radio techniques. Spectrum monitoring also serves to enforce compliance with government regulations. Police, fire fighters, air traffic control, military, and emergency services must all have access to communications free of impediments and distortion. Compliance with spectrum regulations is often enforced by spectrum monitoring. Figure 1 shows spectrum monitors surrounding a prison facility looking for illegal transmissions.

Vision MX280001A Software Overview The Vision MX280001A software platform works with Anritsu’s spectrum monitoring hardware to automate the process of collecting measurement data, as well as providing useful information about network health and use of the spectrum. Using multiple hardware probes covering a wide geographical area, Vision software presents a comprehensive picture of spectral activity to assist users in monitoring the spectrum for unusual activity. Figure 2 shows a typical signal monitoring system with Anritsu Remote Spectrum Monitor MS27102A positioned for maximum coverage. Vision software facilitates a variety of applications used for spectrum monitoring systems. One important application includes determining the presence of interferers in a network that can degrade communication services. Cellular operators in particular are vulnerable to such interference that manifests itself in slower data rates and dropped calls. In most cases, network performance is compromised on the uplink frequency bands (communication from the mobile unit to the base station). However, network quality of service can also be impacted by interference on the downlink channels. This type of interference can be prevalent at the cell periphery where the power levels of the interference signals approximate those transmitted by the base station itself. Another important application for Vision software is the detection of illegal or unlicensed broadcast signals. Illegal broadcasters may set up AM/FM, cellular, or other types of transmissions that must be identified and ultimately located. By using spectrum monitors, unlicensed broadcasts can be tracked, processed, and stored in a database for further examination and potential use in legal proceedings.
Vision Monitor: The Vision Monitor program is the visible user interface for monitoring remote spectrum activity. It provides a listing of all hardware monitors in the system along with a graphic overview of system health.
Vision Monitor performs a wide range of spectrum monitoring duties including: • Measurement acquisition • Data storage • Threshold setting/alarm generation • Reporting Users can set up the Vision Monitor program to take automatic measurements for all spectrum monitors. The measurements are in turn uploaded into a database for further review. The database is updated with new data while old information is periodically purged according to user settings. Functions are also available for archiving, copying, and compressing the database.
For each remote monitor, Vision Monitor is capable of collecting data from as many as 24 input RF ports. This can be ideal for cellular systems with multiple sectors and multiple frequencies per sector.

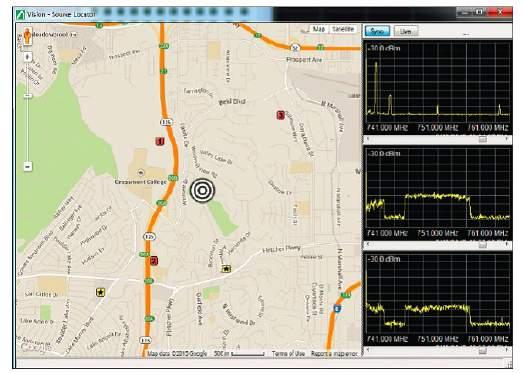
Vision Locate Vision Locate is an optional program used with Vision Monitor. Once an interferer or suspected illegal signal is identified, a geo-location algorithm is employed to fix the approximate position of the signal. This enables the user to narrow down the signal location, minimizing the time and expense for pin-pointing its position. A sample map is shown in Figure 9 showing the suspected interference position using Power of Arrival (POA). In this window, the probe locations are indicated by the red squares. The interference position is identified by the concentric circles.
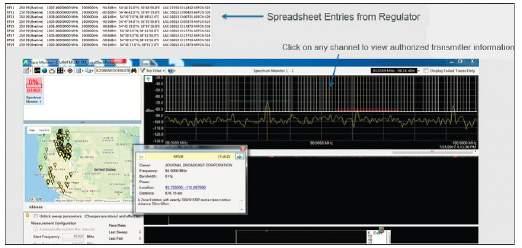
File Viewer The File Viewer is a free utility included with the Vision software download. As part of the Vision installation, the ‘FileViewer.exe’ program is placed in the Vision software’s installation directory. Spectrum channel measurements saved as part of the High-Speed Port Scanner option can be viewed with the File Viewer. Signal Broadcast Identification is important feature in interference testing. When hunting interference signals, it can be helpful to have real-time information for what type of signal is authorized to be in a given channel. Regulators monitoring their frequency bands also want to view what signals are present and whether the transmissions fall within the bandwidth allocated to a particular vendor. Anritsu’s Signal Broadcast Identification feature is designed to meet these needs. Using publically available data, users can import this information so that it is readily available once the spectrum is viewed. Whatever information that is available from the government regulator (or other agency involved with broadcast licensing) can be used. Broadcast information generally supplied include: • Identity of broadcaster • GPS coordinates of broadcaster’s transmitter position • Frequency band in which a broadcaster is allowed to transmit • Power level authorized for the transmission • Type of signal broadcast (commercial radio, public safety,
cellular, etc) Broadcaster information can be imported into Vision Monitor (option 400) via a spreadsheet (CSV format) and overlaid on the trace display. Additionally, users can plot the positions of all the transmitters on a map. Users can simply ‘mouseover’ an icon on the map to see a pop-up window showing all information available on that transmitter. In addition to broadcaster information supplied by the regulator, users may want to plot and identify other positions. For example, a cellular operator may want to identify the positions and frequencies of all their BTS transceiver equipment. This information is often considered proprietary and would be used only within the operator’s system. Interference hunters working for the operator could use this information to know their proximity

to BTS equipment to prevent over-powering their receivers

UNVEIL
IN THIS SPACE!

MD- STMicroelectronics India share company’s Technology & Key industry trends that will dominate in 2021
Vivek Sharma, Managing Director, STMicroelectronics talks about key industry trends of 2021.
As we come closer to 2021, the semiconductor industry is mulling into the industry trends and technologies which will shape the next year. One of the industry’s stalwart, Vivek Sharma, MD-India, STMicroelectronics has his cognizance for the industry in which he shares ST’s ahead strategies and industry outlook for 2021.
During this COVID-19 pandemic, what was ST’s key focus and how will it continue in 2021?
At ST, we will continue to ensure both the ongoing health and safety of our employees and continuity of our business operations for our customers through the current challenges. These priorities remain of utmost importance for the company. The focus will remain on continuing to implement the strategic decisions that ST Management has made stemming from secular growing market trends and addressing key societal needs. Even with the challenges of 2020, the underlying principles of company’s strategy have not changed, and ST remains determined to continue making the company stronger, executing the sales and operating plans, and outperforming the markets we serve.
Highlight ST’s industry outlook in 2021?
While predicting the industry outlook is not our business, ST is operating on the assumption that after a flattish 2020, which was impacted in H1 by the pandemic’s impact on our end markets, the market will grow again in 2021.
Share emerging technology trends dominating in 2021?
As ST, we see a number of very strong trends. Most of these, like the electrification and digitization in the automotive markets, were already in place before the current global situation, and others, like the industrialization of the IoT and the adoption and integration of Artificial Intelligence into embedded applications, have accelerated by the circumstances in 2020. On
Vivek Sharma
MD-India|STMicroelectronics

electrification and digitization in automotive markets, ST is seeing the continuation of strong growth in our SiC business – in fact, while that business is taking off in the automotive market, it is moving rapidly into the industrial space. Half of our customer engagements for SiC projects are for Industrial applications. And in digitization, that is being driven by the ongoing trends toward Electronic Control Units (ECUs) and Smart Gateways, as well as the growing demand for multiapplication, deterministic, Integrated Controllers for the automotive market to maximize safety and security, where ST just made an announcement with a well-known and -regarded tier-one automotive electronic module supplier. There is also an intense effort toward Level 2 and Level 2+ in Advanced Driver Assistance Systems (ADAS), where we are quite active.
Then there is the industrialization of the IoT, which has accelerated. Here, we’re seeing tremendous innovation from our customers and – just to offer a couple of examples, Aura Aware used our FlightSense Time-of-Flight sensors in a social-distancing application and Schneider Electric is using Artificial Intelligence running on ST’s leading STM32 microcontrollers in a people-counting sensor that has great value in attendance and building usage applications. We’ve got many more examples that highlight ST’s strong positioning to address these trends.
Semiconductor Industry Trends of 2021
Balajee Sowrirajan,Managing
Director, Samsung Semiconductor
India R&D Center (SSIR) talks about semiconductor industry trends of 2021.
“One of the biggest trends I foresee in the coming year is around building a connected and intelligent world. The emergence of devices that are not only connected but are able to take informed decisions based on data is well underway and this trend will largely be defined by four pillars -
• Connectivity – The fourth industrial revolution will be built on 5G, which will be driven by convergence of digital and physical technologies such as digital connectivity, cloud and edge-computing, IoT and smart devices, AI, robotics, blockchain, and AR/VR • Sensor – While more pixels and more cameras will be enhancing the quality of our pictures, smart sensors will provide more intelligence and will enable us to choose the best shots too. Beyond image sensors, other sensors are also catching up to mimic human capabilities • Data – With big data on rise, storage solutions have evolved from core storage to a hybrid multicloud infrastructure • AI – Artificial intelligence will be critical with movement from Cloud based AI to Edge based AI, to enable real time decision making”
Balajee Sowrirajan
Managing Director|Samsung Semiconductor India R&D Center (SSIR)


