


2.
2.1
2.2
2.3
2.4
3.
3.1
4.
5.
6.
6.1
6.2
7.
8.

2.
2.1
2.2
2.3
2.4
3.
3.1
4.
5.
6.
6.1
6.2
7.
8.
This is the eleventh National Bowls Census, undertaken to support bowls strategies, and to plan development of the game of bowls around Australia. The eleventh Census is the third compiled entirely from data collected in the Bowls Australia CRM, BowlsLink platform and Sporting Schools databases with input from Bowls Australia’s team, especially Club Support Managers This is a significant enhancement on previous censuses which were compiled through collaborative input of Bowls Australia staff, State and Territory Bowls Associations and surveys of bowls clubs around the nation.
The 2022-23 Census results have been compiled from the participation data of 83% of all clubs nationally and scaled to provide estimates for 100% of clubs1 .
Formal, or registered, playing membership of bowls clubs has been decreasing for more than 40 years, at the rate of 2.6% per annum on average The most recent decrease was 4.0% (between 2020-21 and 2022-23) The Australian resident population was increasing at an average annual rate of 1.6% until the COVID pandemic but this has reduced to an estimated 0.2% in the 2020-21 pandemic year Increased immigration policies have reportedly caused population growth to rebound to about 2.0% per annum since pandemic restrictions ended
Decreases in formal membership of bowls clubs have been offset by growth in social participation in bowls; a functionof Australia’s time poor population Growth in flexible formats for social bowls has also had a strong impact on the age structure of bowls participants.
1 By calculating averages for participation by reporting clubs and applying these averages to clubs where 2022-23 data was missing.
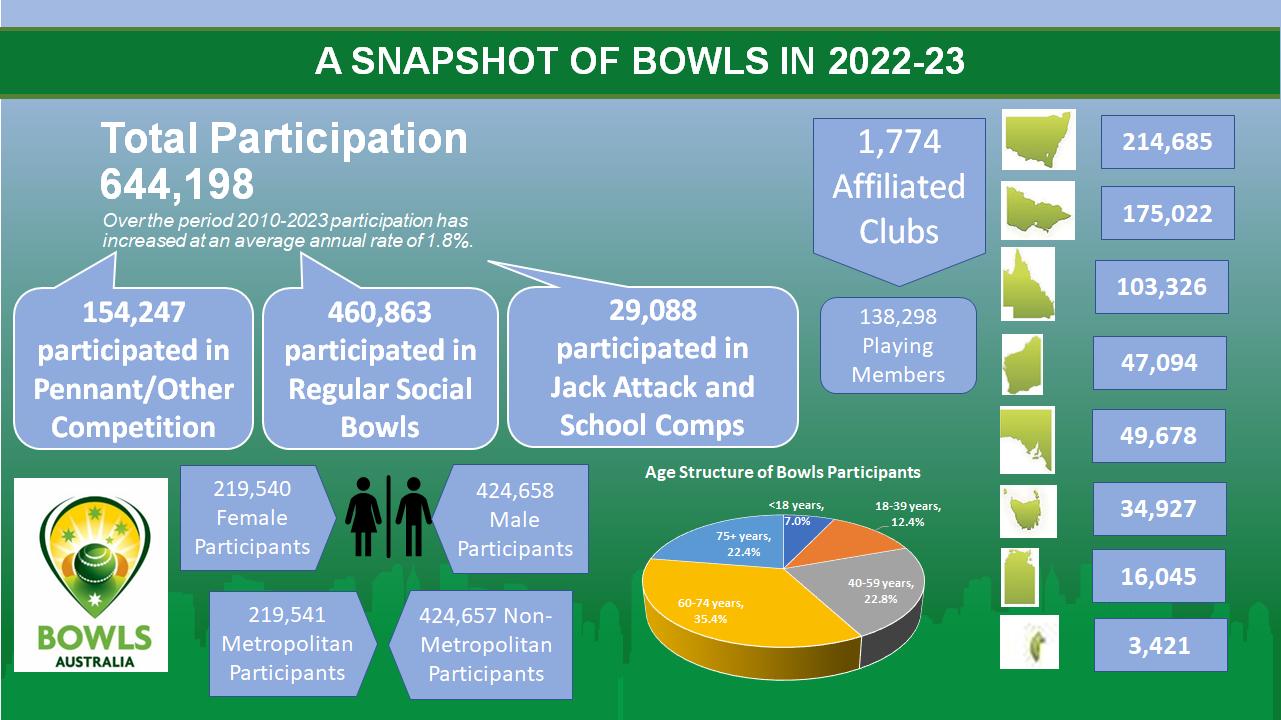
There were 644,198 participants2 in Australian bowls (Figure E1) in 2022-23: o 154,247 pennant/other competition participants o 460,863 participants in regular social bowls (including unaffiliated club and lifestyle village participants o 29,088 participants in Jack Attack and school programs
Figure E1 National Bowls Participation, 2022-23

Bowls Participants
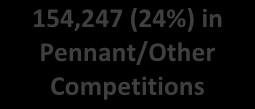
154,247 (24%) in Pennant/Other Competitions


29,088 (4%) Jack Attack and School 460,863 (72%) in Regular Social Bowls


Bowls regular participation increased by 1.1% on average between 2020-21 and 2022-23 Social bowls maintains its dominance as the largest participation segment in bowls, despite a decrease of 2.9% per annum between 2020-21 and 2022-23 (Figure E2)
Competition bowls recorded its first increase in many years (of 13.5% per annum), during 2020-21 to 2022-23 as pennant schedules resumed after COVID disruptions.
Over the thirteen-year period 2010 to 2023, regular bowls participation increased at an average annual rate of 1.75%.
Figure E2: Participation Trends: Competition and Social Bowls, 2010-2022/233

2022-23 Census results encompass a period in which the COVID pandemic continued to impact on Australian lifestyles and behaviour. For more than the past decade Australia’s population growth has been made up of around 67% from net-migration and 33% from natural increase. This was disrupted during the COVID pandemic and immigration levels have been substantially increased in the past year to increase the overall national growth rate above 2.0%
2 Participation figures include the counting of a participant each time they compete in a bowls competition or program of at least 4 games duration.
3 Jack attack and school participation are included in ‘Social Bowls’ in this graph until 2018-19 and in ‘Competition’ from 2020-21.
1.1
Sport and recreation have always been important to Australia and Australians as an integral part of lifestyle, a source of national pride, and a part of the country’s culture. During the past few decades ‘sport and recreation’ has emerged as a full-scale industry within the Australian economy, making substantial employment and financial contributions in all regions and at all levels (local, State and National).
Australian Bowls is one of the largest sectors in the ‘sport and recreation’ industry. For example: (i) Number of participants. Bowls ranks highly among sports in Australia. Bowls club playing membership in Australia is now 138,298 across 1,774 clubs. Male membership is 70% and female membership 30%. Bowls is very strong in country areas of Australia, where the number of clubs outnumber those in metropolitan areas more than two to one and participation is 93% greater
(ii) Events and Assets. Australian bowls hosts a number of premier championship events. Bowling clubs are significant capital assets (including greens, drainage/irrigation systems, club facilities and other supporting infrastructure).
(iii) Employment and Economic Contribution. A plethora of management, administrative, marketing, green keeping, asset management, and catering jobs are directly created by Australian bowls. Bowling clubs are significant businesses in their own right, creating millions of dollars in annual direct and indirect expenditure.
Bowls Australia introduced a National Census of Australian Bowls in 2010. Censuses were conducted annually during 2010 to 2017 and biennially from 2018. This is the report from the eleventh census
Formal membership of bowls clubs has been reducing for many years while, the censuses to date have proven, participation in social and corporate bowls competitions and events has significantly increased. There is a clear need to build on the understanding of participation in bowls, at all levels and in all regions in order to plan for the changing dynamics of the game.
In this 2022-23 Census, results are presented for participants4 and members in each form of bowls Note that, throughout the tables presented in this document, any small differences (of 1 or 2) between the sum of any column or row and the stated totals are due to rounding.
The 2022-23 Bowls Census is the second that has been reported entirely from data collected on Bowls Australia’s electronic systems: the Bowls Australia CRM, BowlsLink and Sporting Schools databases The databases encompassed data from 83% of Australia’s affiliated bowls clubs
4 Participation figures include the counting of a participant each time they compete in a bowls competition or program of at least 4 games duration.
Bowls Regions around Australia.
One of the important applications of the Census is its use as a planning tool at regional level. The development of regional boundaries for each state/territory has been implemented and is reviewed with consideration given to statistical area boundaries, in order to enable the calculation of player to population rates and preparation of regional profiles. There are 64 Bowls Regions reported in 2022-23:
24 Metropolitan Regions (including the Australian Capital Territory as a single metropolitan region)
40 Country Regions (including the Northern Territory as a single country region)
Bowls Databases
The Bowls Australia CRM, BowlsLink and Sporting Schools databases encompassed details of:
- Club details (address and contacts)
- Playing members.
- Participation in each form of bowls (including details of participation of 4 or more bowls games per annum5).
- Promotional bowls experiences
- Age and gender details for all participation and promotional experiences.
Census results have been compiled from the participation data of 83% of all clubs nationally, as shown in Table 1.1 and scaled to provide estimates for 100% of clubs6 .
Table 1.1 Clubs with Data Entered on BowlsLink, 2022-23
Retirement Lifestyle Villages and Unaffiliated Bowls Clubs
There are an increasing number of Retirement Lifestyle Villages which incorporate bowling greens and clubs, as well as a number of Bowling Clubs around the country which are not affiliated with Bowls Australia or a State/Territory Association. For the first time, participation from 33 unaffiliated clubs and 62 retirement and lifestyle villages have been included in this 2022-23 Census.
5 Note that 4 games per annum has been used as the minimum level to be counted as a bowls participant in the Census figures. Participation at less than 4 games has been recorded as ‘promotional involvement’
6By calculating averages for low, medium and high participation clubs and applying these averages to clubs where 2020-21 data was missing.
Bowls Australia (BA) and the State/Territory Associations recognise that membership and participation are fundamental to the success of the sport in a competitive environment, in which Australia’s population is increasingly conscious of the importance of health and leisure but, at the same time, is increasingly ‘time poor’ and receptive to sport and recreational pursuits that enable participation within the constraints of a busy lifestyle.
Figure 2.1 shows that formal, or registered, playing membership has decreased progressively since 1980. The average rate of decrease has been 2 6% per annum throughout the period. However, in the past five years the average annual decrease has been somewhat higher at 4.0%. This includes the period between 2019-20 and 2020-21, during the height of the COVID pandemic, when the decrease escalated to 7.2%. Playing members of bowls clubs in 2022-23 were only 32% of those registered in 1980. Over this same period (1980-2022) the Australian total resident population has increased by 77%, from 14.69 million to 26.01 million, at an average annual rate of 1.4%.
Table 2.1 summarises the playing member trends contributing to a 3.98% average annual decrease since Bowls Censuses began.
2.1 Trends in Playing Membership 1980-2022/23
Table 2.1
SOURCE: Bowls Australia records, Censuses 2010 to 2022-23
Table 2.2 presents details of all bowls participation (greater than 4 weeks/games duration) by State/Territory and bowls segment. There were 644,198 participants in bowls in 2022-23 (in competitions and programs of at least 4 weeks/games duration), comprising:
154,247 pennant/other competition participants
460,863 social programs participants (including barefoot and other social bowls activities, and participation in unaffiliated and lifestyle clubs)
29,088 Jack Attack and school participants
Table 2.2: Bowls Participants (4+ weeks/games) Australia, 2022-23
Table 2.3 and Figure 2.2 summarise trends in both participants and playing members over the nine years since inception of the national bowls census. The table also shows that:
The average annual increase in regular (4+ games) bowls participation has been 1.06% over the period 2020-21 to 2022-23
The average annual increase in regular social participation has been 8.00% over the period 2010 to 2022-23.
The average annual decrease in regular pennant and other competition participation has been 4.74% over the period 2010 to 2022-23
The average annual decrease in playing membership has been 3.98% over the period 2010 to 2022-23.
Pennant/Competition Members
Table 2.3 Trends in Participation (4+ games) and Playing Membership: 2010 to 2022-23 by State and Territory
Table 2.3 (continued) Trends in Participation (4+ games) and Playing Membership: 2010 to 2022-23 by State and Territory
State/Territory
South Australia
Tasmania
* Note: Competitions include Jack Attack, and School (of 4+ weeks/sessions) from 2020-21
SOURCE: National Bowls Censuses 2010 to 2022-23
Male bowls participants are in the majority, making up 66% of all regular participants. This gender variation is quite consistent across all age groups except those less than 18 years, where males are just in the majority, contributing 50.2% of the total; a reflection of the inclusion of mixed school groups and junior participants in Jack Attack programs. Figure 2.3 shows male and female participant numbers by age group.
Females
Bowls participation to population rates show the extent to which people in each age group and in each region are involved in bowls. The participant to population rates for each State and Territory and Australia are presented in Table 2.4
The overall participation rate in Australia was 3.19% for males and 1.60% for females. Participation was highest in the 75+ years age group (10.02% for males and 3.64% for females) and lowest in the 518 years age group for males (0.88%) and the 18-39 years age group for females (0.78%).
Male Participation Rates
The Australian Bowls regions are all consistent with groups of Statistical Divisions used by the Australian Bureau of Statistics for a wide range of statistical collections. These can be valuable in comparing and planning bowls initiatives using regional data (population, economic and other relevant data). Regions are an appropriate unit for allocating resources, targeting growth areas and developing local responses to meet the needs of communities around the nation. However, the distribution of regions needs some adjustment, so that the number of regions per State is consistent with population, geography and bowls participation.
Table 2.5 summarises the top ten participation regions and the top ten by competition and social bowls revealing that:
- New South Wales regions of Central Coast, North Coast, Hunter, Riverina Murray, Northern Sydney and Central West are heartlands for bowls participation.
- Coastal tourism and retirement regions tend to be strong in social bowls (eg Central Coast, and Gold Coast), and some are highly ranked in both competition and social bowls (eg North Coast, Hunter and Hobart and South).
- Recent renovations/capital investment in Darwin and Alice Springs (and tourism) have stimulated social bowls participation in the Territory.
- Western Australia has maintained a high level of participation in competition bowls with South-West and Southern, South Coast Perth and Northern Perth all in the top 10 regions
- Seven of the top 10 participation regions are in non-metropolitan areas
Table 2.5 Largest Competition, Social and Overall Participant Regions
Rank Competition Bowls
Social Bowls
Total Participants
1 South-West and Southern WA Yarra, Vic Yarra, Vic
2 South Coastal Perth, WA Central Coast, NSW Central Coast, NSW
3 Strzelecki, Vic Riverina Murray, NSW Riverina Murray, NSW
4 Northern Perth, WA Northern Sydney, NSW Northern Sydney, NSW
5 Hunter, NSW Northern Territory, NT North Coast, NSW
6 Riverina Murray, NSW North Coast, NSW Hobart and South, Tas
7 Eastern Ranges, Vic Hobart and South, Tas Hunter, NSW
8 North Coast, NSW Gold Coast, Qld Northern Territory, NT
9 Sandbelt, Vic Central West, NSW Gold Coast, Qld
10 Hobart and South, Tas Hunter, NSW Central West, NSW
Table 2.6 shows the Australian Bowls regions in rank order of participants.
Table 2.6 (continued) Regions Ranked by Bowls Participation, 2022-23
To be counted as ‘a participant’ in the National Bowls Census a person must play at least four times during the year in a competition or in a social or other program. This definition has been agreed to provide a meaningful minimum level of involvement for measuring regular participation.
There are also many people involved in events, once-off activities, community programs and other bowls activities of less than four weeks/games duration, which are broadly described as bowls experiences. These experiences can be an integral part of the viability of a bowls club and to the development of the game of bowls. The nature and level of experiences varies from state to state. Promotional bowls experiences can include some social, corporate and school activities.
Table 2.7 shows that there were 1,285,028 bowls experiences (i.e. social activities of less than four weeks’ duration; usually once) in 2022-23. There has been great interest in, and promotion of, casual events around barefoot bowling and this segment contributed 76% of all bowls experiences in 202223
Table 2.7
Promotional Bowls Experiences (Less than 4 weeks/games) 2022-23
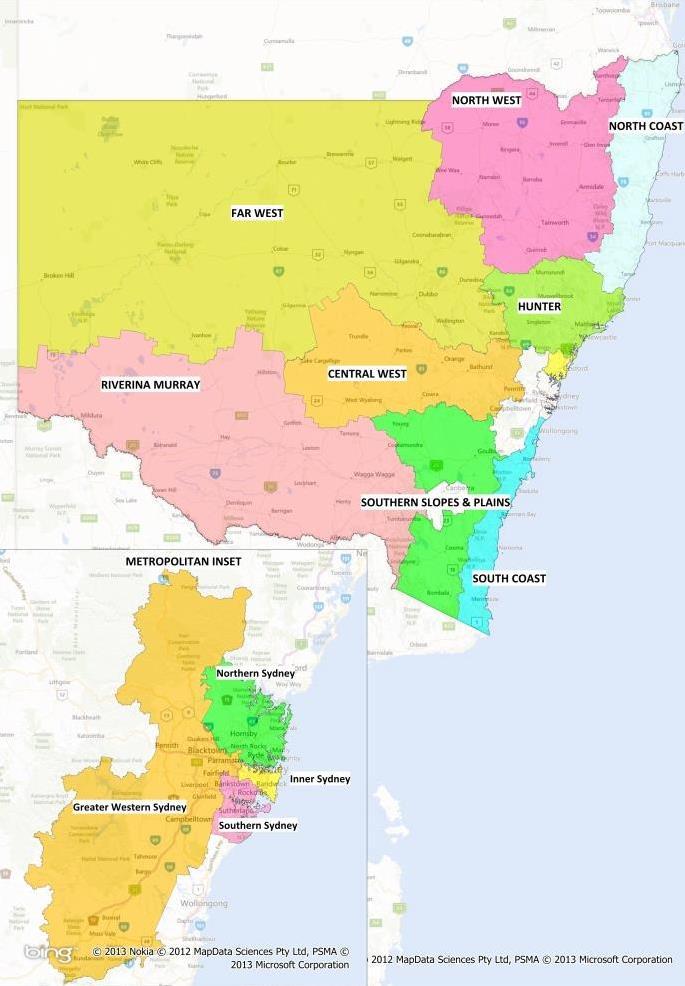
New South Wales is Australia’s most populous state with 8,165,731 residents or 31.4% of the Australian population7 . Bowls New South Wales has four regions in metropolitan Sydney, and nine country regions.
The New South Wales Bowls regions for planning and development are:
Metropolitan Sydney
Northern Sydney
Greater Western Sydney
Inner Sydney
Southern Sydney
Country New South Wales
Central West
Far West
North West
North Coast
South Coast
Hunter
Central Coast
Southern Slopes and Plains
Riverina Murray
The locations of these regions are shown in Figure 3.1.
Table 3.1 summarises bowls participation by major segment. In total, there were 214,685 participants in bowls competitions and programs (of at least 4 games duration) in New South Wales during 202223. Specifically,
- The greatest participation segment in New South Wales was ‘other social’ bowls (ie social bowls excluding barefoot), with 43.2% of participants.
- Male participation makes up 69.7% of all bowls participation in New South Wales.
- Participation in country New South Wales (156,792) is 75.1% of the total, although country NSW makes up around 37% of the population, and there were an additional 6,030 participants in unaffiliated clubs (including retirement village clubs).
Many bowls participants are involved in more than one structured bowls competition, social or other program. This includes:
Pennant and other competition participants who regularly play in more than one competition during the same season or year.
Participants involved in both competition and social bowls
7 Australian Bureau of Statistics, Regional Population 2021-22 (Released August 2023)
Bowls participation to population rates show the extent to which people in each age group and in each region are involved in bowls. The age-specific participation rates are shown in Figure 3.2 and overall participant to population rates for New South Wales were: - 3.90% for males - 1.67% for females.
NSW Participation Rates
Table 3.1
Bowls Participation (4+ games) in New South Wales, 2022-23
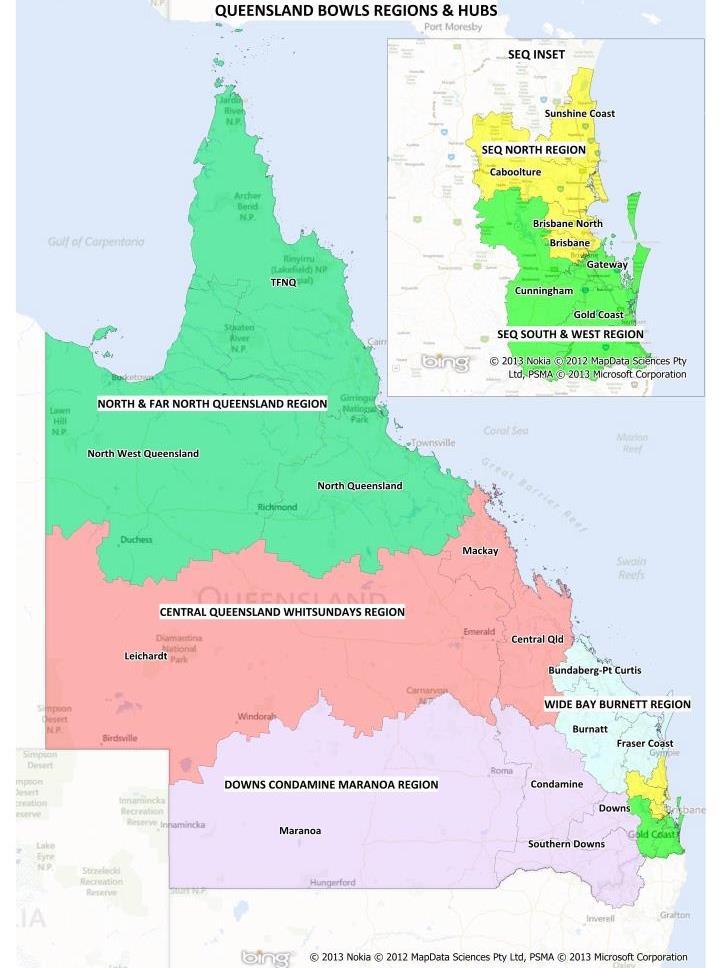
Queensland is Australia’s third largest state in terms of resident population with 5,320,496 persons or 20.5% of the Australian population8. Queensland and Tasmania are Australia’s most decentralised states. They are the only states/territories where the majority of the population does not live in the capital city.
Bowls Queensland has six ‘hub’ regions, with twenty regions: Two regions in metropolitan Brisbane (plus the Gold Coast and Sunshine Coast regions), four country hub regions.
The Queensland hubs and regions for Census reporting in 2022-23 are:
Metropolitan Brisbane
Brisbane North
o Brisbane
o Brisbane North
o Caboolture
Brisbane South and West
o Cunningham
o Gateway
Country Queensland
Gold Coast
Sunshine Coast
Wide Bay Burnett
o Bundaberg Pt Curtis
o Burnett
o Fraser Coast
Downs Condamine Maranoa
o Downs
o Southern Downs
o Condamine
o Maranoa
Central Queensland Whitsundays
o Central Queensland
o Leichardt
o Mackay
North and Far North Queensland
o North Queensland
o Far North Queensland (FNQ)
o North-West Queensland.
The locations of these regions are shown in Figure 4.1.
8 ABS Regional Populations 2022
Table 4 1 summarises bowls participation by major segment. In total, there were 103,326 participants in bowls competitions and programs (of at least 4 games duration) in Queensland during 2022-23 Specifically,
- The greatest participation segment in Queensland was ‘other social bowls programs’ (excluding barefoot), with 55.4% of participants.
- Male participation makes up 64.0% of all bowls participation in Queensland.
- Participation in country Queensland (62%) is much higher than metropolitan Brisbane participation (38%) and there were an additional 6,663 participants in unaffiliated clubs (including retirement village clubs).
Many bowls participants are involved in more than one structured bowls competition, social or other program. This includes:
Pennant and other competition participants who regularly play in more than one competition during the same season or year.
Participants involved in both competition and social or corporate bowls.
Bowls participation to population rates show the extent to which people in each age group and in each region are involved in bowls. The age-specific participation rates are shown in Figure 4.2 and overall participant to population rates for Queensland were: - 2.53% for males - 1.39% for females.
Queensland Participation Rates
Males Females
Table 4.1
Bowls Participation (4+ games) in Queensland, 2022-23
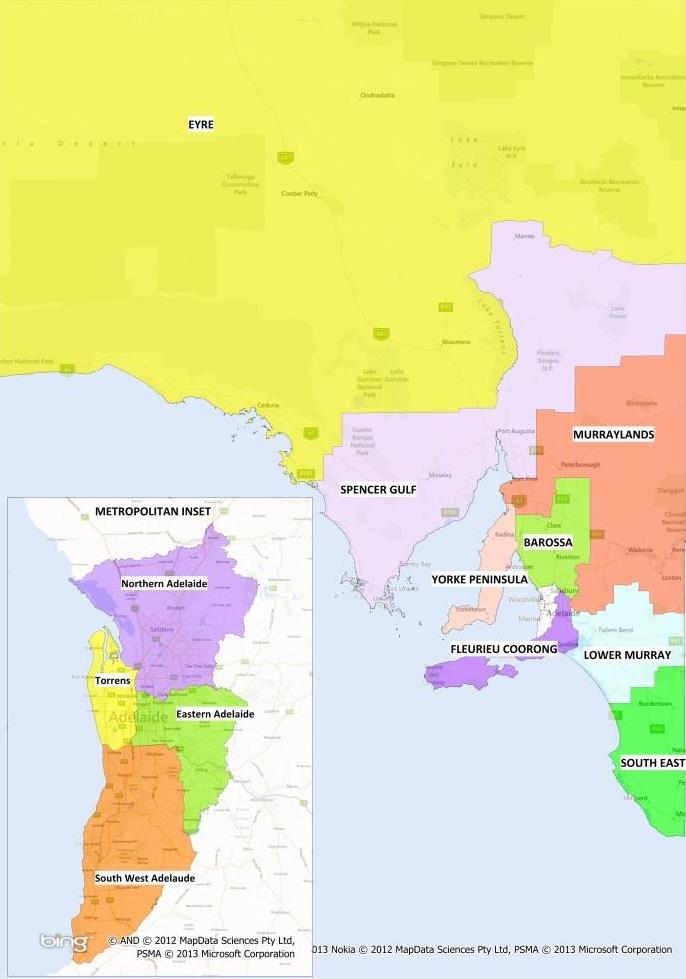
South Australia is Australia’s fifth most populous state with 1,821,200 residents9 or 7.0% of the Australian population. Bowls South Australia has four identified regions in metropolitan Adelaide, and eight country regions.
The South Australian regions for the 2022-23 Census and for bowls planning and development are:
Metropolitan Adelaide
Northern Adelaide
Eastern Adelaide
Adelaide South West
Adelaide Torrens
Country South Australia
South-East
Yorke Peninsula
Spencer Gulf
Murraylands
Eyre
Lower Murray
Coorong-Fleurieu
Barossa
The locations of these regions are shown in Figure 5.1.
Table 5 1 summarises bowls participation by major segment. In total, there were 49,678 participants in bowls competitions and programs (of at least 4 games duration) in South Australia during 2022-23 Specifically,
- The greatest participation segment in South Australia was ‘other social bowls’ (excluding barefoot bowls), with 53.7% of participants.
- Male participation makes up 60.8% of all bowls participation in South Australia.
- Participation in country South Australia (31,881) is higher than metropolitan participation (16,959) and there were an additional 838 participants in unaffiliated clubs (including retirement village clubs).
Many bowls participants are involved in more than one structured bowls competition, social or other program. This includes:
Pennant and other competition participants who regularly play in more than one competition during the same season or year.
Participants involved in both competition and social or corporate bowls.
9 ABS Regional Populations 2022
Bowls participation to population rates show the extent to which people in each age group and in each region are involved in bowls. The age-specific participation rates are shown in Figure 5.2 and overall participant to population rates for South Australia were: - 3.50% for males - 2 19% for females.
5.2
South Australian Bowls Participation Rates (%)
Australian Participation Rates
Table 5.1
Bowls Participation (4+ games) in South Australia, 2022-23
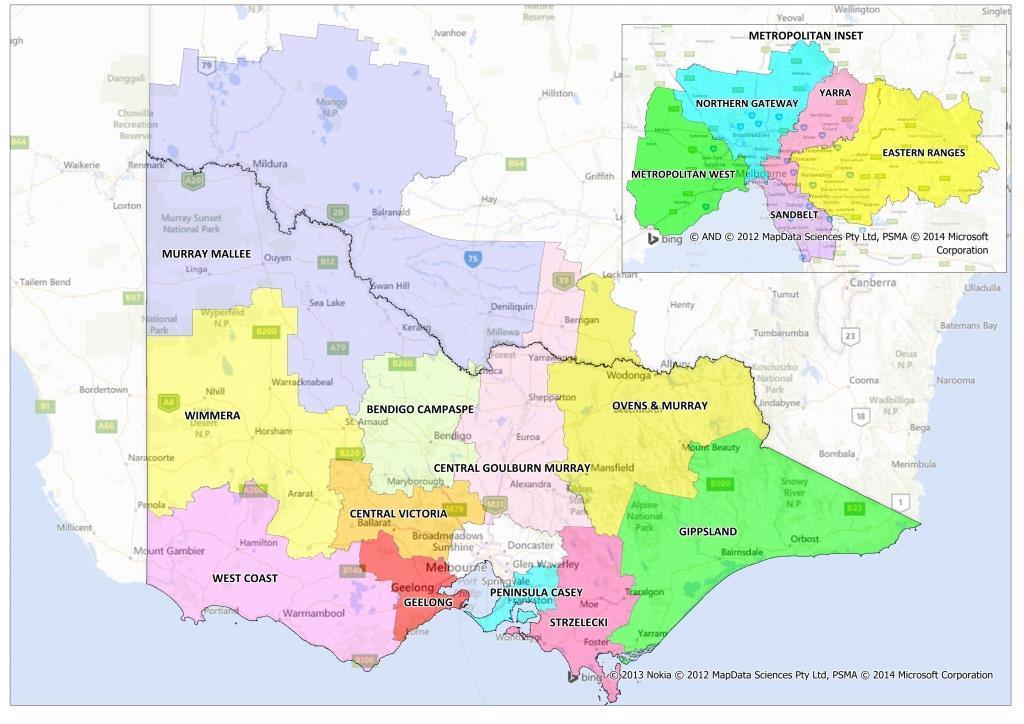
Victoria is Australia’s second most populous state with 6,625,964 residents10 or 25.5% of the Australian population. Bowls Victoria currently has five identified regions in metropolitan Melbourne, and eleven country regions. Victorian regions in the 2022-23 Census and bowls planning and development are:
Metropolitan Melbourne
Melbourne West
Northern Gateway
Yarra
Eastern Ranges
Sandbelt
Country Victoria
Geelong
West Coast
Wimmera
Murray Mallee
Central Victoria
Bendigo Campaspe
Central Goulburn Murray
Ovens and Murray
Gippsland
Strzelecki
Peninsula Casey
The locations of these regions are shown in Figure 6.1.
Table 6 1 summarises bowls participation by major segment. In total, there were 175,022 participants in bowls competitions and programs (of at least 4 games duration) in Victoria during 2022-23 Specifically,
- The greatest participation segment in Victoria was ‘other social bowls’ (excluding barefoot bowls), with 38.1% of participants.
- Male participation made up 65.4% of all bowls participation in Victoria.
- Participation in country Victoria (90,378) was higher than metropolitan participation (80,378) and there were an additional 4,266 participants in unaffiliated clubs (including retirement village clubs).
Many bowls participants are involved in more than one structured bowls competition, social or other program. This includes:
Pennant and other competition participants who regularly play in more than one competition during the same season or year.
Participants involved in both competition and social or corporate bowls.
10 ABS Regional Population 2022
Bowls participation to population rates show the extent to which people in each age group and in each region are involved in bowls. The age-specific participation rates are shown in Figure 6.2 and overall participant to population rates for Victoria were: - 3.63% for males - 1.87% for females.
(%)
Victorian Participation Rates
Table 6.1
Participation (4+ games) in Victoria, 2022-23
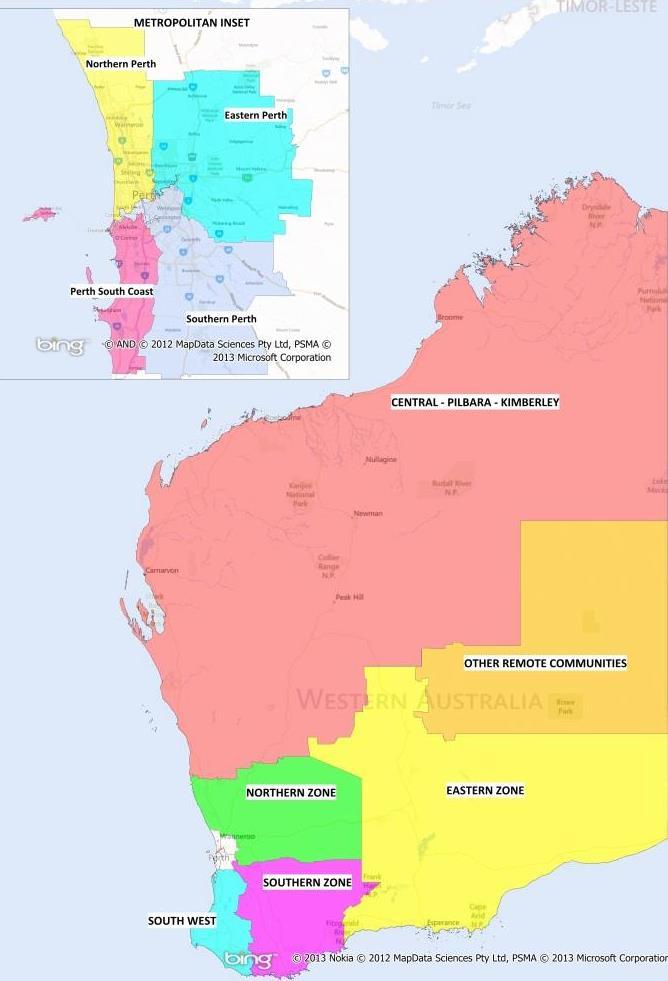
Western Australia is Australia’s fourth most populous state with 2,789,14811 residents or 10.7% of the Australian population. Bowls Western Australia has four regions in metropolitan Perth and four country regions.
The Western Australian regions for the 2022-23 Census and for bowls planning and development are:
Metropolitan Perth
Eastern
Northern
Southern
South Coastal
Country Western Australia
Eastern Zone
Northern Zone
Southern and South-Western Zone
Central - Pilbara - Kimberley
The locations of these regions are shown in Figure 7.1.
Table 7 1 summarises bowls participation by major segment. In total, there were 47,094 participants in bowls competitions and programs (of at least 4 games duration) in Western Australia during 202223. Specifically,
- The greatest participation segment in Western Australia was pennant/other competition bowls, with 80.3% of participants.
- Male participation makes up 65.6% of all bowls participation in Western Australia.
- Participation in country Western Australia (21,284) is almost as high as metropolitan participation (23,764) and there were an additional 2,046 participants in unaffiliated clubs (including retirement village clubs).
Many bowls participants are involved in more than one structured bowls competition, social or other program. This includes:
Pennant and other competition participants who regularly play in more than one competition during the same season or year.
Participants involved in both competition and social or corporate bowls.
11 Australian Bureau of Statistics Regional Population Growth 2021-22
Bowls participation to population rates show the extent to which people in each age group and in each region are involved in bowls. The age-specific participation rates are shown in Figure 7.2 and overall participant to population rates for Western Australia were:
2.31% for males
1.14% for females.
Table 7.1
Bowls Participation (4+ games) in Western Australia, 2022-23
Tasmania is Australia’s smallest state (and ranks sixth among states and territories) with 571,01312 residents or 2.2% of the Australian population. Bowls Tasmania has four regions; Hobart and South and three country regions.
The Tasmanian regions in the 2022-23 Census and for planning bowls development are
Metropolitan Hobart and South
Country Tasmania
o Launceston and North
o North West
o East
The Northern Territory is Australia’s least populous state/territory with 250,21913 residents or 1.0% of the Australian population. Northern Territory Bowls has three longer-term identified regions; one metropolitan region and two country regions.
The Northern Territory regions for longer term Bowls Censuses and for planning bowls development are
o Metropolitan Darwin and Top End
o Katherine Barkly
o Central Australia.
However, in the 2022-23 Census, the Northern Territory continues as a single reporting region.
The Australian Capital Territory has 456,84414 residents, or 1.8% of the Australian resident population. The ACT is classified as one administration region, although Bowls ACT encompasses bowls competitions and programs which extend beyond the Territory’s border and includes the Queanbeyan area (with an additional population of 65,765 residents)
The locations of these regions are shown in Figure 8.1.
Tasmanian, Northern Territory and Australian Capital Territory Bowls Regions
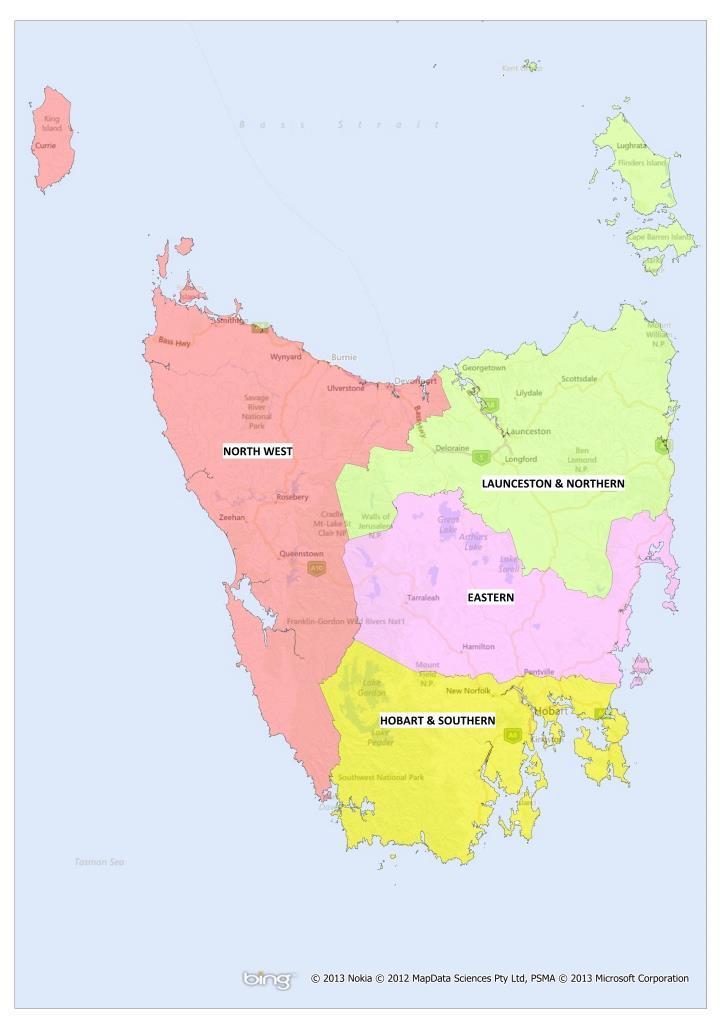
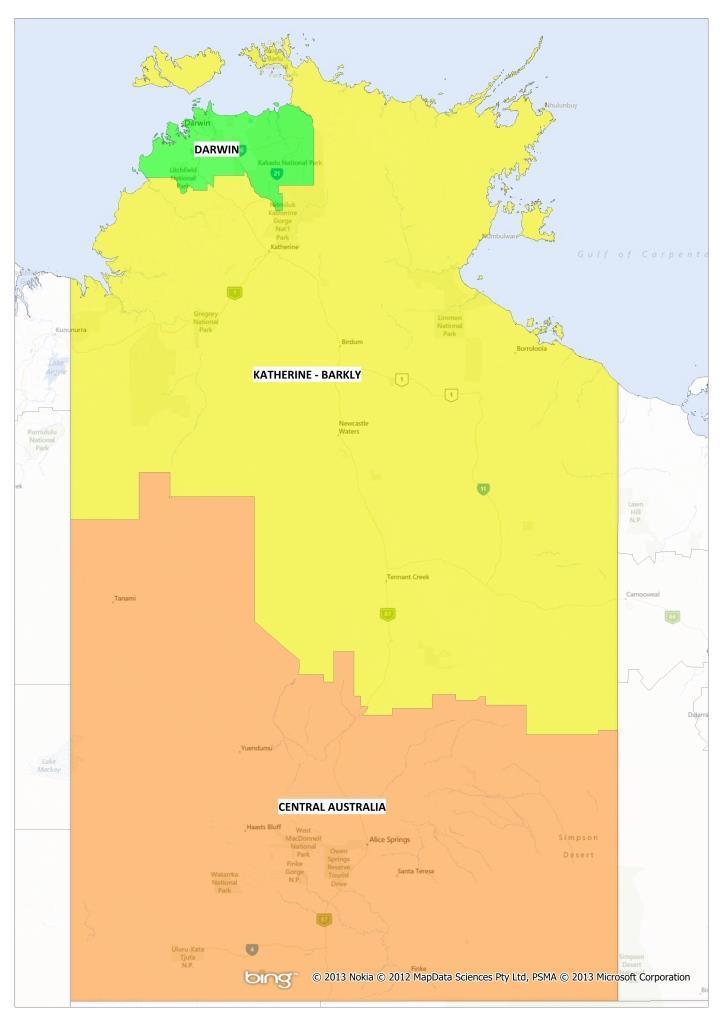
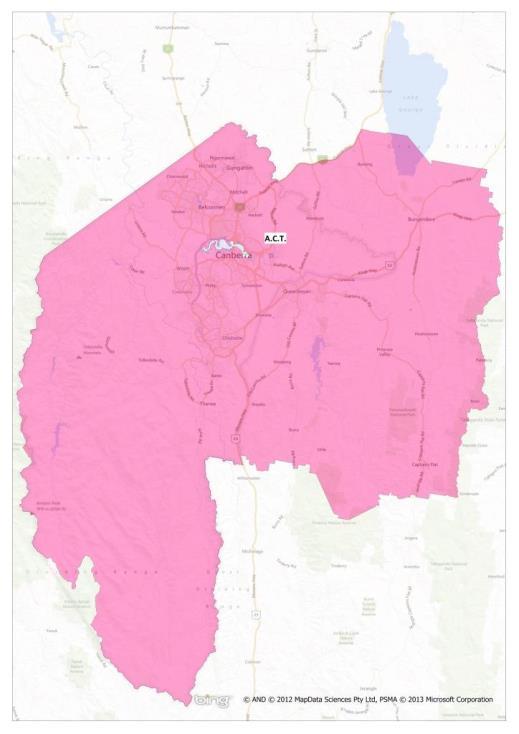
Table 8 1 summarises bowls participation by major segment. Specifically, - ‘Other social bowls’ is now the largest segment in both Territories and Tasmania (although only marginally in Tasmania), with 94.8% in Northern Territory, 55.4% in the ACT and 20.0% in Tasmania.
- Male participation makes up 58.3%, 63.0% and 60.4% of all bowls participation in Tasmania, Northern Territory and Australian Capital Territory, respectively. The Northern Territory has the highest rate of female participation of all states/territories. The Territories and Tasmania had an additional 264 participants in unaffiliated clubs (including retirement village clubs).
Bowls participation rates show the extent to which people in each age group and in each region are involved in bowls. The overall participation rate in the Australian Capital Territory was 1.04%, Tasmania was 4.14%, while the Northern Territory’s rate was 6.11%. The male and female participation rates were:
The age-specific participation rates are shown in Figures 8.2 to 8.4
ACT Participation Rates Males
Northern Territory Participation Rates
Males Females
8.4
Bowls Participation Rates (%)
Table 8.1 Bowls Participation (4+ games) in Tasmania, Northern Territory and Australian Capital Territory, 2022-23