Transition | a year in review
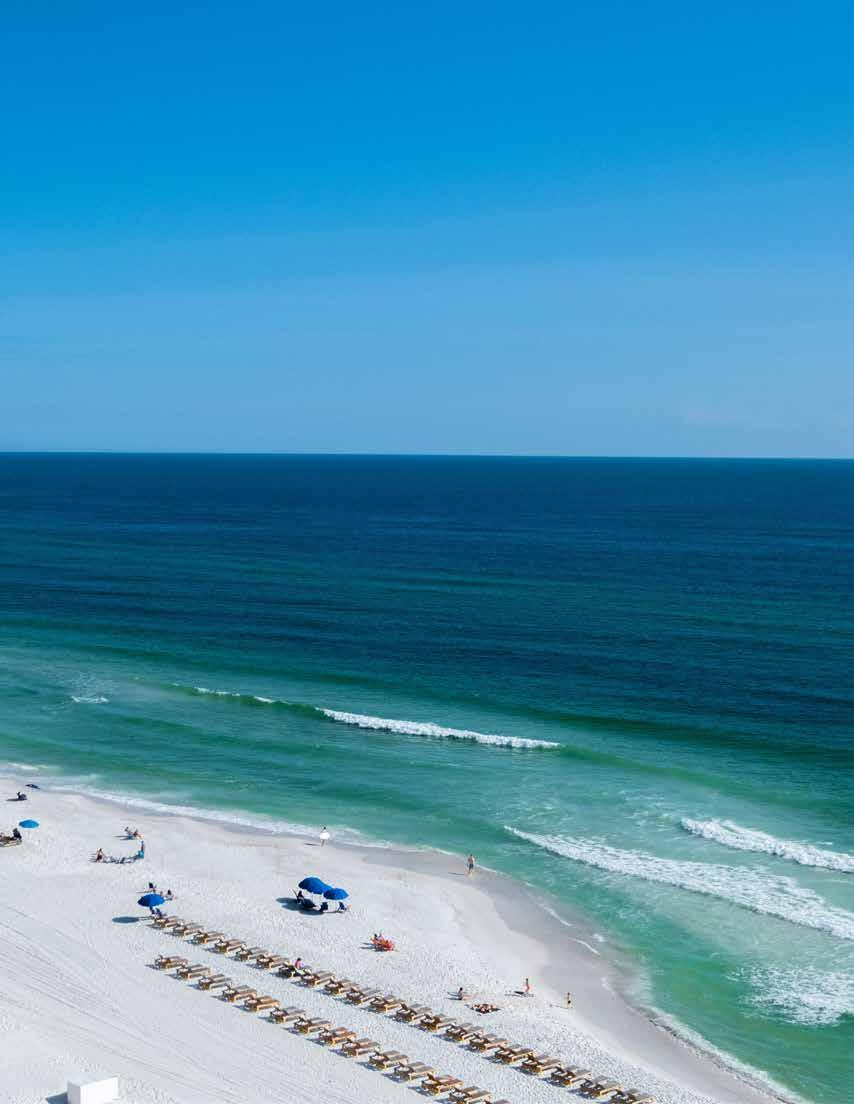
As we reflect on the 2022 real estate market along the Northwest Florida Gulf Coast, transition is the word that best describes the changes experienced in both the market and in the gulf side communities that compose this spectacular coastline. This year can best be described as “a tale of two halves” with the intense momentum of the past two years continuing through July and then sales activity beginning to transition during late summer in correlation with rising interest rates and inflation concerns.
2022 has brought a wealth of new homeowners as well as new full-time residents to our communities with the strong demand of the first two quarters met by increasing prices. We continued to have record low days on the market from January through July. Starting in late summer, the number of sales began to fall when compared to the year prior.
Prices have remained strong; however, we’ve seen indications that this may soften in conjunction with the number of sales over time. As we moved toward the end of the year, we saw a steady increase in the number of homes available for sale, yet sales remained at levels within historical norms.

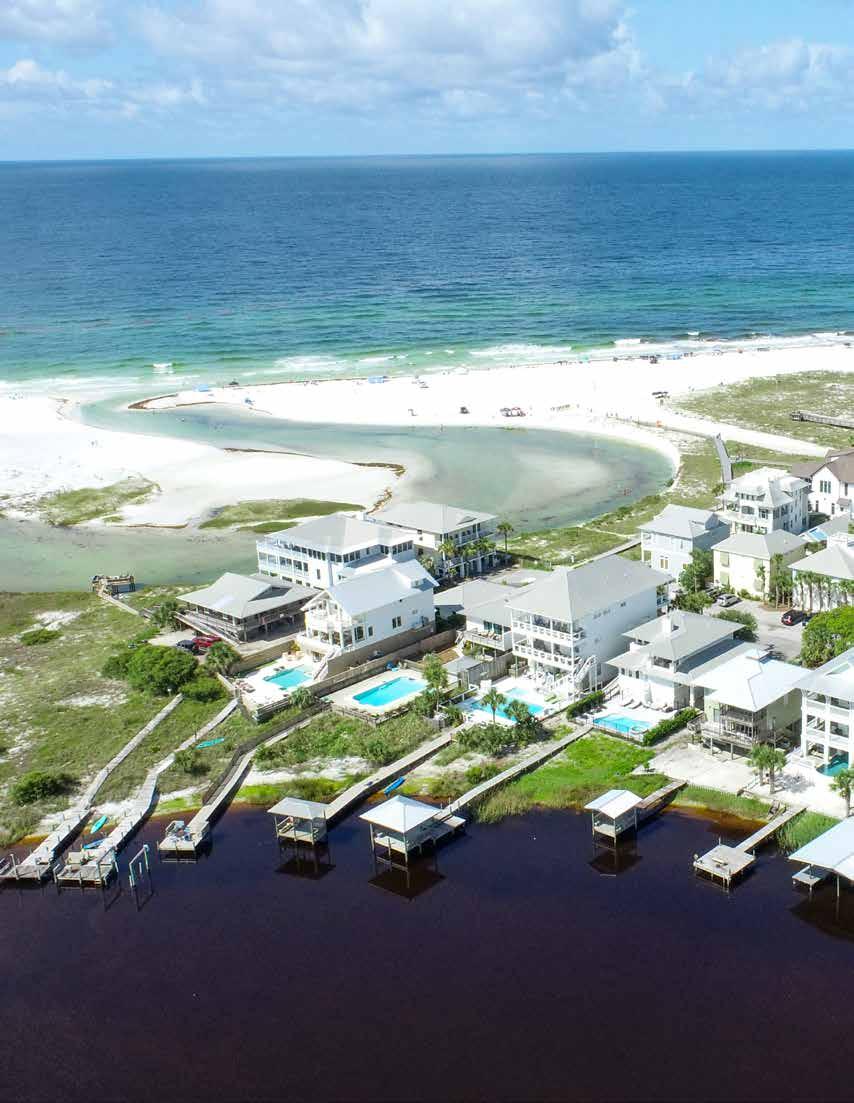
With the growth of our local populations, there has been a transition in our communities to support new residents. More infrastructure is being put in place to better serve larger full-time populations including new businesses, additional housing options, and roadway improvements. The draw of the emerald green waters, sugar white sands, and welcoming Southern charm of this section of the Gulf Coast continues to have an undeniable appeal to homeowners.
Looking ahead to 2023, we expect that the market will continue to transition from what was a very robust seller’s market into one that is more in favor of the buyer. An increased amount of inventory coupled with a softening of sales should result in this with some pockets of strength and pockets of increased weakness remaining due to the exuberance of last year’s market. Depending on your overall goals, this could be a prime time to find your place along our shores.
Established in 2007 to be a premier real estate company dedicated to extraordinary customer service, our agency became an affiliate of Berkshire Hathaway HomeServices network in 2016 and wholly owned by HomeServices of America in 2022. Our brand is built on trust, integrity, stability, and innovation, and our customers benefit by being part of a firm that is an international leader in the sales and promotion of its properties. Our sales executives are experts in the market, and ready to guide you through any market conditions to the best possible outcome.
We look forward to a new year of brokering real estate sales along our coast and feel so blessed to have served all the extraordinary people that we encountered in 2022. We welcome the opportunity to serve you in 2023 and beyond.
1 ANNUAL REPORT 2022 | BERKSHIRE HATHAWAY HOMESERVICES BEACH PROPERTIES OF FLORIDA
MARKET REPORT 2021 | BERKSHIRE HATHAWAY HOMESERVICES BEACH PROPERTIES OF FLORIDA 2 1. DESTIN 151 Regions Way, Suite 4A Destin, FL 32541 850.502.2120 2. WATERCOLOR MAIN 28B WaterColor Way Santa Rosa Beach, FL 32459 850.534.3006 3. WATERCOLOR CROSSINGS 49A WaterColor Way Santa Rosa Beach, FL 32459 850.213.5450 4. WATERSOUND BEACH 6652 E Co Hwy 30A, Ste 110 Watersound, FL 32461 850.213.5150 5. PIER PARK 15750 Panama City Beach Pkwy, #140 Panama City Beach, FL 32413 850.252.4160 6. WINDMARK BEACH 101 Goodmorning Street Port St. Joe, FL 32456 850.296.3716 7. ST. GEORGE ISLAND 140 West 1st Street, Ste B St. George Island, FL 32328 850.927.6000 NWFL Beaches International Airport Destin Ft. Walton Beach Sandestin Blue Mountain Beach Seaside WaterColor Seagrove WaterSound Beach Rosemary Beach Panama City Beach West Bay Choctawhatchee Bay 5 98 1 4 2 331 79 office locations 3 ANNUAL REPORT 2022 | BERKSHIRE HATHAWAY HOMESERVICES BEACH PROPERTIES OF FLORIDA 2
3 Lynn Haven Mexico Beach WindMark Beach Cape San Blas Apalachicola National Forest St. George Island Port St. Joe Apalachicola Tyndall AFB Tallahassee Eastpoint Carrabelle Panama City Apalachicola Bay 6 71 98 231 20 20 7 ANNUAL REPORT 2022 | BERKSHIRE HATHAWAY HOMESERVICES BEACH PROPERTIES OF FLORIDA

# 1 BROKERAGE ON 30A *Transactions TOP 4 BROKERAGE IN PANAMA CITY BEACH *Volume # 1 BROKERAGE ON ST. GEORGE ISLAND + APALACHICOLA *Transactions + Volume TOP 3 BROKERAGE ON THE FORGOTTEN COAST *Transactions + Volume #21 GLOBALLY BROKERAGE WITHIN BERKSHIRE HATHAWAY HOMESERVICES *Gross Commission Income | 2021 Top 50 Brokerage Annually Since 2016 NEARLY $1.8 BILLION 2022 COMPANY SALES VOLUME 2022 ACCOLADES 4 ANNUAL REPORT 2022 | BERKSHIRE HATHAWAY HOMESERVICES BEACH PROPERTIES OF FLORIDA
PANAMA CITY BEACH 8 PANAMA CITY BEACH CONDOS 10 PANAMA CITY 12 NEW CONSTRUCTION | BAY COUNTY 14
OF
ANNUAL REPORT 2022 | BERKSHIRE HATHAWAY HOMESERVICES BEACH PROPERTIES OF FLORIDA 5
bay county
TABLE
CONTENTS
$200,000
$350,000 $400,000 100 $450,000 $500,000 150 $550,000 200 2015 2015 2019 2019 2013 2016 2016 2020 2020 2014 2014 2018 2018 2017 2017 2021 2022 2021 2022 65% 173% % GROWTH 2013 - 2022 % GROWTH 2013 - 2022 PANAMA CITY BEACH $294,692 $232K $312,780 $249K $357,241 $441,294 $272,069 $374,667 $529,645 $633,559
AVERAGE
AVERAGE
50
0
DAYS ON MARKET 97 104 100 114 79 68 107 66 44 36 6 ANNUAL REPORT 2022 | BERKSHIRE HATHAWAY HOMESERVICES BEACH PROPERTIES OF FLORIDA
SOLD PRICE 2013 $250,000 $300,000
$150,000
NUMBER OF SALES PRICE PER SQUARE FOOT $100 750 $50 500 $150 1,000 $200 1,250 $250 $300 1,500 2015 2015 2019 2019 2013 2013 2016 2016 2020 2020 2014 2014 2018 2018 2017 2017 2021 2022 2021 2022 48% 158% % GROWTH 2013 - 2022 % GROWTH 2013 - 2022 PANAMA CITY BEACH $161 931 $127 747 $170 940 $136 742 $186 918 $218 1,139 $147 872 $194 1,027 $261 $327 1,287 1,103 7 ANNUAL REPORT 2022 | BERKSHIRE HATHAWAY HOMESERVICES BEACH PROPERTIES OF FLORIDA

PANAMA CITY
14208 FRONT BEACH ROAD 8 ANNUAL REPORT 2022 | BERKSHIRE HATHAWAY HOMESERVICES BEACH PROPERTIES OF FLORIDA
BEACH
PANAMA CITY BEACH SINGLE FAMILY HOMES 2021 2022 PERCENT CHANGE 1,287 1,103 14% $681,652,674 $698,815,030 3% $529,645 $633,559 20% $261 $327 25% 44 36 18% 98% 98% 0% 44 2021 36 2022 98 % 2022 98 % 2021 14% 25% 0% 18% NUMBER OF SALES AVERAGE SOLD PRICE PER SQUARE FOOT PERCENTAGE OF LIST PRICE SOLD AVERAGE DAYS ON MARKET 2021 2021 2022 2022 1,287 $ 261 1,103 $ 327 NUMBER OF SALES YEAR SOLD VOLUME AVERAGE SOLD PRICE AVERAGE SOLD PRICE PER SQ. FT. AVERAGE DAYS ON MARKET % OF LIST PRICE SOLD Panama City Beach saw a less dramatic decrease in number of sales and sold volume than other areas of the Northwest Florida Gulf Coast showing its longstanding appeal and value to both primary and secondary homebuyers. 9 ANNUAL REPORT 2022 | BERKSHIRE HATHAWAY HOMESERVICES BEACH PROPERTIES OF FLORIDA

10 ANNUAL REPORT 2022 | BERKSHIRE
HOMESERVICES BEACH
PANAMA CITY BEACH CONDOS
HATHAWAY
PROPERTIES OF FLORIDA
PANAMA CITY
CONDOS 2021 2022 PERCENT CHANGE 2,547 1,644 35% $957,053,747 $771,633,856 19% $376,053 $469,364 25% $337 $429 27% 71 39 45% 98% 98% 0% 71 2021 39 2022 98 % 2022 98 % 2021 35% 27% 0% 45% NUMBER OF SALES AVERAGE SOLD PRICE PER SQUARE FOOT PERCENTAGE OF LIST PRICE SOLD AVERAGE DAYS ON MARKET 2021 2021 2022 2022 2,547 $ 337 1,644 $ 429 NUMBER OF SALES YEAR SOLD VOLUME AVERAGE SOLD PRICE AVERAGE SOLD PRICE PER SQ. FT. AVERAGE DAYS ON MARKET % OF LIST PRICE SOLD The Panama City Beach condo market lagged behind single family homes with a greater drop in number of sales and sold volume, likely due to limited inventory with a significant drop in average days on market. 11 ANNUAL REPORT 2022 | BERKSHIRE HATHAWAY HOMESERVICES BEACH PROPERTIES OF FLORIDA
BEACH

12 ANNUAL REPORT 2022 | BERKSHIRE HATHAWAY HOMESERVICES BEACH PROPERTIES OF FLORIDA
PANAMA CITY
PANAMA CITY SINGLE FAMILY HOMES 2021 2022 PERCENT CHANGE 2,189 2,129 3% $616,263,999 $702,666,865 14% $281,528 $330,045 17% $147 $175 19% 42 39 7% 98% 98% 0% 42 2021 39 2022 98 % 2022 98 % 2021 3% 19% 0% 7% NUMBER OF SALES AVERAGE SOLD PRICE PER SQUARE FOOT PERCENTAGE OF LIST PRICE SOLD AVERAGE DAYS ON MARKET 2021 2021 2022 2022 2,189 $ 147 2,129 $ 175 NUMBER OF SALES YEAR SOLD VOLUME AVERAGE SOLD PRICE AVERAGE SOLD PRICE PER SQ. FT. AVERAGE DAYS ON MARKET % OF LIST PRICE SOLD With appealing price points and a continued rejuvenation of the city drawing new buyers, the Panama City market experienced a very low decrease in number of sales and an increase in sold volume during 2022. 13 ANNUAL REPORT 2022 | BERKSHIRE HATHAWAY HOMESERVICES BEACH PROPERTIES OF FLORIDA

NEW CONSTRUCTION | BAY COUNTY BREAKFAST POINT 14 ANNUAL REPORT 2022 | BERKSHIRE HATHAWAY HOMESERVICES BEACH PROPERTIES OF FLORIDA
NEW CONSTRUCTION | BAY COUNTY SINGLE FAMILY HOMES 2021 2022 PERCENT CHANGE 525 501 5% $189,297,912 $231,319,022 22% $361,946 $461,715 28% $179 $224 25% 34 39 15% 98% 100% 2% 34 2021 39 2022 100 % 2022 98 % 2021 5% 25% 2% 15% NUMBER OF SALES AVERAGE SOLD PRICE PER SQUARE FOOT PERCENTAGE OF LIST PRICE SOLD AVERAGE DAYS ON MARKET 2021 2021 2022 2022 525 $ 179 501 $ 224 NUMBER OF SALES YEAR SOLD VOLUME AVERAGE SOLD PRICE AVERAGE SOLD PRICE PER SQ. FT. AVERAGE DAYS ON MARKET % OF LIST PRICE SOLD The popularity of many of the new construction developments in Bay County such as Breakfast Point and SweetBay have allowed this sector of the market to remain strong, experiencing the highest increase in average sales price in Bay County. 15 ANNUAL REPORT 2022 | BERKSHIRE HATHAWAY HOMESERVICES BEACH PROPERTIES OF FLORIDA

©2023
Affiliates,
of
Affiliates, LLC.
For You For Life EMERALD COAST | SOUTH WALTON | BAY COUNTY | FORGOTTEN COAST Get to know us at BeachPropertiesFLA.com
Market data for 2022 as of 1/10/23. Infromation reported is deemed reliable but is not guaranteeed.
MLS and FBS. ©2023 BHH
LLC. An independently operated subsidiary
HomeServices of America, Inc., a Berkshire Hathaway affiliate, and a franchisee of BHH
Berkshire Hathaway HomeServices and the Berkshire Hathaway HomeServices symbol are registered service marks of Columbia Insurance Company, a Berkshire Hathaway affiliate. Equal Housing Opportunity.


