3 minute read
Used market health score
With over 60 million monthly cross platform visits and advertising over 500,000 cars every day, we have a very broad view of the market and particularly of the UK car buyer.
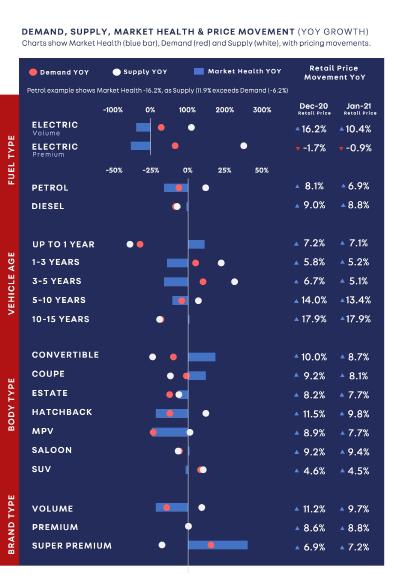
This means we’re able to track a huge variety of metrics and trends in almost real-time, including the levels of supply and demand in the market, as well as the subsequent influence on like-for-like pricing. Based on these various dynamics, we’re able to determine a Market Health score at a macro and micro level, such as fuel, price, age, and body type, from both a national and regional perspective. As well as giving our customers fulltime access to this data, each month we package the highlevel view up as part of our Monthly Market Intelligence report, of which this is a January snapshot. Supply of new and used cars remained constrained for large parts of H2 2020, and whilst supply pressures have certainly not disappeared, they have eased. And although demand remains robust, the extremely strong and sustained levels we saw in recent months began to ease with the introduction of the new restrictions at the turn of the year.
JANUARY
2019

As a result of these changing dynamics, overall Market Health softened in January; and consequently, price growth slowed somewhat from the very strong levels seen through the closing months of 2020. Despite those pressures, like-for-like prices remained up 7.4% year-onyear, marking 10 months of consecutive price growth. At the time of writing, in late-February, we’ve seen this trend continue, with growth easing to c. 6.5%. Our latest proxy sold data indicates most retailers are now trading at around 75% of normal volumes, which is up significantly from January (circa 65%). It’s testament to the speed at which the industry has adapted to digital retailing, and points to a strong recovery over the coming weeks. We’ve also seen a significant step up in audience performance on our marketplace, and during the week of the 15th February, we recorded 15.2 million cross platform visits, which is a 10.3% increase on the same period last year, and a 6.5% increase week-on-week. This strong level of consumer engagement resulted in the number of leads being sent to retailers growing 31.3% year-on-year.
Cause for a positive outlook
Reassuringly, in addition to these consumer metrics, several wider economic factors point to another period of strong retail demand once forecourts can reopen in April. The latest Bank of England findings indicate average household finances are in better shape than they were preCOVID, with savings levels around three times as much as in any other nine-month period. What’s more, significant levels of consumer credit have been repaid with outstanding credit to individuals dropping £23 billion since February 2020. This aligns to our own research which revealed that consumers’ confidence in being able to afford their next car remains very high, and ahead of confidence levels recorded prepandemic. For those looking to buy in the next two weeks, confidence levels were even higher. There’s no question the industry is facing significant challenges at the moment, and not being able to open forecourts during the key sales month of March will be frustrating. However, with better than expected retailer performance, coupled with very positive market indicators, we believe there are plenty of reasons for a positive outlook.
Contributed by Ian Plummer, Commercial Director, Auto Trader
Expert analysis
Savings to be spent
Several wider economic factors point to another period of strong retail demand once forecourts can reopen in April. The latest Bank of England findings indicate average household finances are in better shape than they were pre-COVID, with savings levels around three times as much as in any other nine-month period.


