
36 minute read
Cal-Toons by Ted Green
through optical fiber to a much larger community of users, ranging from other national laboratories, academia and industry.
This work is available at: M. Schioppo et al. “Comparing ultrastable lasers at 7 × 10⁻¹⁷ fractional frequency instability through a 2220 km optical fibre network,” Nature Communications (2022), https://doi.org/10.1038/s41467-02127884-3.
Advertisement
Marco Schioppo, Senior Research Scientist, NPL states: “This work is important as it demonstrates that it is possible to compare two geographically distant ultrastable lasers and measure their fundamental noise using an optical fiber network. We show that ultrastable lasers can be used to effectively measure the total fiber link noise. We also assess the possibility to disseminate ultrastable light to distant users through optical fiber. Our work is an important step towards making available the time and frequency high-precision measurement capability of a national metrological institute to a wide range of users.”
Jochen Kronjäger, Senior Research Scientist, NPL states: “I find it absolutely fascinating to see how two world-leading ultrastable lasers, developed independently and both pushing the boundaries of optical technology, can be compared to reveal their fundamental noise, despite being separated geographically by almost 800 km. It’s a fantastic demonstration of the power of light, made possible by many years of international collaboration.”
Corresponding authors:
Marco Schioppo marco.schioppo@npl.co.uk
Jochen Kronjäger jochen.kronjaeger@npl.co.uk
Source: https://www.npl.co.uk/news/record-comparison-ofdistant-ultrastable-lasers
CAL-TOONS by Ted Green teddytoons@icloud.com
MEH. THEY CALL THEMSELVES “THE RESISTANCE.” JUST IGNORE THEM.
17 - 20 May 2022 PARIS

PRESS RELEASE - 22 February 2022
GAS ANALYSIS 2022: A GREEN INDUSTRIE FIGUREHEAD
GAS Analysis Symposium & Exhibition is the world symposium for gas analysis, gathering more than 300 participants and highly valuable for the gas analysis community. The event will thrive under the aegis of the CFM in Paris Nord Villepinte during its 11th edition from 17 to 20 May 2022.
A rich programme combining Hydrogen, Biogas, Energy and Environment
Responding to global challenges, GAS Analysis has positioned itself as the best forum for discussing the latest cuttingedge advances and applications in the industry. It attracts many key players in the sector: experts, policy makers, technical managers, research laboratories, manufacturers and end-users.
It will be run under 2 key application axes: Environment and Energies. Its programme will consist of 80 lecture and poster presentations dealing with the latest advances in gas metrology, hydrogen, decarbonation, energy transition, industrial innovation, climate and air quality. Also on the menu: 4 short courses as well as an exhibition area animated by face-to-face meetings.
A GAS Analysis hub within an expanded exhibition
GAS Analysis is in partnership with Global Industrie/Measurement World. The symposium is claimed as a pillar of an industry in the desire for change: in the midst of the fight against global warming and faced with the integration of the environmental factor in our production methods, this unprecedented conjunction then takes on its full meaning!
In order to ensure optimal cohesion, the exhibition part of GAS Analysis will be the meeting point of the symposium participants, benefiting from a central position. The heart of this exhibition named "GAS Analysis Hub" will be lively through poster sessions as well as non-stop catering service, aligned with the symposium programme.
Placed in a privileged way around this hub, the GAS2022 exhibitors will be able to be in direct contact with the participants of the symposium and other organisations of the Instrumentation, Metrology and Analysis sector.
GAS Analysis is organised by Air Liquide, Analytical Controls by Pac, Cetiat, Effectech, Euramet, LNE, Linde, NPL, VSL, Shell Global Solutions International and the Collège Français de Métrologie.
Sponsors declared to date: Agilent Technlogies et Orthodyne
Exhibitors confirmed to date: Agilent Technologies, Alytech, AP2E, APIX Analytics, Bohr / Endet, Bundesanstalt für Materialforschung und -prüfung (BAM) / MefHySto, Chemlys, EffecTech, Endress+Hauser, Etalonair, LNI Swissgas, Meeco, mirSense, National Physical Laboratory (NPL), Orthodyne, Picarro, Process Insights, PST Process Sensing Technologies, SIAD, Soclema, Thermo Fisher Scientific...
The detailed programme is now available, see you there!
Organiser and Press Contact: Collège Français de Métrologie +33 (0)4 67 06 20 36 - gas2022@cfmetrologie.com - www.gasanalysisevent.com

Overview of the ISO/IEC 17025 Revision Process
Diana Baldi and Heather A. Wade
ISO standards are considered the top of the global standards hierarchy. This means that ISO standards supersede regional or national standards, where an equivalent ISO standard exists. All international standards managed by ISO are developed based on a market need within a specific subject area. If a proposed need is accepted by ISO, the project proposal proceeds through the ISO standards development process. ISO standards are developed on a consensus-based approach and take into account comments from all stakeholders. Once published, all ISO standards are reviewed at least every five years to determine if a revision is required. The systematic review process ensures that ISO International Standards and other deliverables remain up-to-date and globally relevant [1]. ISO/IEC 17025 is one of these international standards that has undergone a series of updates over the past 30+ years. We will explore the revision process and history for ISO/IEC 17025 as well as the international organizations who play a part in its application and support.
What Is ISO/IEC 17025?
ISO/IEC 17025 is an international standard that specifies the requirements for a laboratory management system. The standard contains a set of requirements enabling laboratories to improve their ability to produce consistently valid results. It applies to both testing laboratories and calibration laboratories.
Why Has ISO/IEC 17025 Been Revised?
Various management system practices have come into use worldwide over the last thirty-plus years. All ISO standards are scheduled for review at least every five years to establish if a revision is required to keep them current and relevant for the marketplace. Organizations that use multiple management systems standards are increasingly demanding a common format and language that is aligned between those standards. ISO/IEC 17025:2017 responds to the latest trends for laboratories and to be more compatible with other standards related to conformity assessment (i.e., ISO/IEC 17000 series of standards).
The laboratories worldwide have a period of three years from the date of publication to transition to the new version. The impact of this revision will be greater than the 2005 edition. Eighteen months from the date of publication, any new accredited certifications issued will be to ISO/IEC 17025:2017. Originally, as of November 2020, ISO/IEC 17025:2005 would have been completely withdrawn and all labs with ISO/IEC 17025 accreditation will need to be accredited to ISO/IEC 17025:2017. However, due to the COVID-19 pandemic, ILAC Resolution GA 20.15 (November 2016) passed an ILAC ballot thus extending the transition period for ISO/IEC 17025:2017 from 30 November 2020 to 1 June 2021: "This extension has been granted to ensure all accreditation bodies and the accredited laboratories are able to achieve the remaining transitions in a robust manner under the restrictions imposed as a result of the global coronavirus disease 2019 (COVID-19) outbreak [2]."
Where Are We in the Revision Process?
The ISO/IEC 17025:2017 standard was published November 2017. On the right is a timeline of ISO 9001 and ISO/IEC 17025 revision history. ISO 9001 is included as it has been a supplemental source for management system practices and requirements used in conjunction with ISO/IEC 17025.
Year 1987 1990 1994 1999 2000 2005 2008 2010 2015 2017 Nov 2020 June 2021 Standard ISO 9001:1987 (first edition) ISO/IEC Guide 25 ISO 9001:1994 (first minor revision) ISO/IEC 17025:1999 (renumbered Guide 25) ISO 9001:2000 (first major revision) ISO/IEC 17025:2005 ISO 9001:2008 (second minor revision) ILAC/SABS requested CASCO workgroup to revise ISO/IEC 17025 ISO 9001:2015 (second major revision) ISO/IEC 17025:2017 ISO/IEC 17025:2005 original withdrawal date ISO/IEC 17025:2005 extension withdrawal date (due to COVID-19)
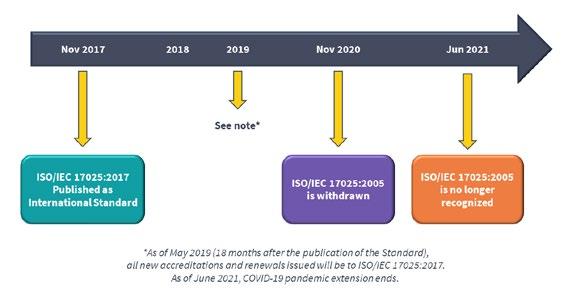
Figure 1. General Transition Period for Accreditation
Since the end of the transition period extension, the accreditation of a laboratory to ISO/IEC 17025:2005 is no longer recognized under the ILAC Arrangement.
Can Accreditation Bodies Define a Different Transition Period?
Yes. For example, for a while, Standards Council of Canada had noted that they may allow laboratories to continue to be assessed to the 2005 version under extenuating circumstances. Examples of valid, extenuating circumstances include, but were not limited to, the following: Corporate/Group accreditation laboratories that are working on a consolidated approach to implementing the revised standard, or laboratories that hold two or more accreditations from different accreditation bodies, who are required to meet different transition and implementation plans developed by the accreditation bodies.
Who’s Who on the International Stage?
The four international bodies responsible for metrology, accreditation, and standardization worldwide are the following:
1. BIPM = The International Bureau of Weights and
Measures (https://www.BIPM.org)
a. BIPM is the coordinator of the world-wide measurement system.
b. BIPM provides a forum for Member States to act together on matters related to measurement science and measurement standards. c. BIPM publishes the SI Brochure, which defines the International System of Units (SI).
2. OIML = The International Organization of
Legal Metrology (https://www.OIML.org). Legal metrology is the application of legal requirements to measurements and measuring instruments.
Legal metrology encompasses, in part, how items are measured for sale and trade. OIML is an intergovernmental treaty organization which: a. Develops model regulations, standards, and related documented use develops model regulations, standards, and related documents for use by legal metrology authorities and industry; b. provides mutual recognition systems which reduce trade barriers and costs in a global market; c. represents the interests of the legal metrology community within international organizations and forums concerned with metrology, standardization, testing, certification, and accreditation; d. promotes and facilitates the exchange of knowledge and competencies within the legal metrology community worldwide; and e. cooperates with other metrology bodies to raise awareness of the contribution that a sound legal metrology infrastructure can make to a modern economy.
3. ILAC = The International Laboratory Accreditation
Cooperation (https://ILAC.org)
a. “ILAC is the international authority on laboratory, inspection body, reference material producer and proficiency testing provider accreditation, collectively known as conformity assessment bodies (CABs), with a membership consisting of accreditation bodies and stakeholder organizations throughout the world." b. The International Laboratory Accreditation Cooperation (ILAC) is the international organization for accreditation bodies operating in accordance with ISO/IEC 17011 and involved in the accreditation of conformity assessment bodies including calibration laboratories (using ISO/IEC 17025), testing laboratories (using ISO/ IEC 17025), medical testing laboratories (using ISO 15189) and inspection bodies (using ISO/ IEC 17020).
4. ISO = The International Organization for
Standardization (https://www.ISO.org)
a. ISO is an “independent, non-governmental international organization with a membership of 164 national standards bodies” that, through its members, “brings together experts to share knowledge and develop voluntary, consensusbased, market relevant International Standards that support innovation and provide solutions to global challenges." a. The Council Committee on Conformity Assessment (CASCO) is the ISO committee that works on issues related to conformity assessment.
What Do These Four Organizations Do?
In November 2018, these four organizations issued a Joint Declaration on Metrological Traceability emphasizing that “Metrological traceability is one of the elements that establishes international confidence in the worldwide equivalence of measurements [3].”
These four bodies collaborate, with other international stakeholders, in the Joint Committee for Guides in Metrology, (JCGM), responsible for developing common documents. Two JCGM documents key to this Declaration are:
1. Uncertainty in Measurement - Part 3 - Guide to the Expression of Uncertainty in Measurement (GUM)
– JCGM 100. Two related documents are OIML G 1-100 and ISO/IEC Guide 98-3. All three documents promote a consistent and common approach to the evaluation of measurement uncertainty in a variety of metrological situations; and
2. International vocabulary of metrology - Basic and general concepts and associated terms (VIM)
– JCGM 200. Two related documents are OIML V 2-200 and ISO/IEC Guide 99.
The latest versions of these and related publications can be downloaded free of charge from the BIPM website.
Who Publishes ISO/IEC 17025:2017?
ISO/IEC 17025:2017 is published by ISO (International Standards Organization) and IEC (International Electrotechnical Commission). IEC is one of the three global sister organizations (IEC, ISO, and ITU) that develop International Standards for the world. IEC is the world’s leading organization for the preparation and publication of International Standards for all electrical, electronic, and related technologies. ISO is an “independent, non-governmental international organization with a membership of 164 national standards bodies” that through its members, “brings together experts to share knowledge and develop voluntary, consensus-based, market relevant International Standards that support innovation and provide solutions to global challenges.”
Who Oversees Accreditation to ISO/IEC 17025:2017?
ILAC maintains a formal list of signatories on their Mutual Recognition Agreement (MRA). The accreditation bodies that are signatories to the ILAC MRA have been peer evaluated in accordance with the requirements of ISO/IEC 17011 to demonstrate their competence. The ILAC MRA signatories agree to accept the results of each other’s accredited Conformity Assessment Bodies under the ILAC MRA. Hence, the results from the Conformity Assessment Bodies accredited by the ILAC MRA signatories are able to be recognized internationally. The aim being, “Accredited Once, Accepted Everywhere [4].”
BEWARE OF UNRELIABLE MARKS. Here are two examples of UNRELIABLE seals that imply ISO/IEC 17025 “approval.”
Be sure to understand the difference between certification and accreditation. Accreditation is the proper term to use. Confirm the authorizing authority (the accreditation body) on any ISO/IEC 17025-accredited testing or calibration certificates you use is listed on ILAC’s Mutual Recognition Agreement list: https://ilac.org/signatory-search/.
Who Works Along with ILAC in the Realm of Accreditation?
The International Accreditation Forum (IAF) is the world association of Conformity Assessment Accreditation Bodies and other bodies interested in conformity assessment in the fields of management systems, products, services, personnel and other similar programs of conformity assessment. Its primary function is to develop a single worldwide program of conformity assessment which reduces risk for business and its customers by assuring them that accredited certificates may be relied upon. Accreditation assures users of the competence and impartiality of the body accredited. [5] In short, IAF ensures that “its accreditation body members only accredit bodies that are competent to do the work they undertake and are not subject to conflicts of interest.” Another way to express this is that IAF ensures accreditation bodies are competent and impartial.
What is the Scope of Accreditations Worldwide?
• Over 94,000 accredited conformity assessment bodies (CABs) • Over 103 economies represented
Conclusion
ISO/IEC 17025 is the top internationally recognized standard providing the requirements and expectations for testing and calibration laboratories. Whether the use of ISO/IEC 17025 is required or voluntary, the coordination between multiple, high-level global non-governmental organizations provides for uniform application of ISO/ IEC 17025. This standardized and consensus-based solution ensures that each member economy has a voice in the standards development and application. As a result, global trade and consumer protection are enhanced and supported.
This article contains an overview of the ISO/IEC 17025 revision process and is an excerpt of Chapter 1 from ISO/ IEC 17025:2017 Requirements Overview e-book by Diana Baldi and Heather A Wade. Download the entire ebook to gain an overview of the requirements within ISO/IEC 17025:2017. The ebook is written in practical language to help demystify these requirements. Available for free - Download from: https://bit.ly/Free-17025-ebook or https:// bit.ly/17025-ebook
Sources
[1] https://www.iso.org/developing-standards.html [2] https://ilac.org/latest_ilac_news/transition-period-foriso-iec-17025-extended/ [3] https://www.bipm.org/documents/20126/42177518/
BIPM-OIML-ILAC-ISO_joint_declaration_2018. pdf/7f1a4834-da36-b012-2a81-fc51a79b0726 [4] https://ILAC.org [5] https://www.iaf.nu.
THE INTERNATIONAL PICTURE
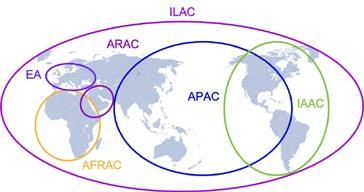
IAAC Inter American Accreditation Cooperation EA European Cooperation for Accreditation APAC Asia Pacific Accreditation Cooperation ARAC Arab Accreditation Cooperation AFRAC African Accreditation Cooperation
Figure 2. ILAC Regional Cooperation Bodies. Image provided by ILAC with permission.
ENOB: The Best Digitizer Performance Metric
By Andrew Dawson, Ph.D.
Vitrek
Introduction
While the nominal vertical resolution of a high-speed waveform digitizer (specified in bits) is often promoted, its true performance is provided by its measured Dynamic Parameters and in particular by its Effective Number of Bits (ENOB). This article describes measurement of the Dynamic Parameters and presents measurements for a leading-edge GaGe 12-bit Digitizer.
A widely used digitizer-like device, the Digital Storage Oscilloscope (DSO), is optimized for the visualization of unknown signals [1]. The relatively low 8-bit vertical resolution of most DSOs is sufficient for signal visualization and is offered at the highest sampling rates (~200 GigaSamples/second). Furthermore, high-end DSOs are often optimized for the determination of signal edge positions in the time-domain, such as in eye-diagram measurements. Accordingly, product marketing typically promotes DSO’s high input bandwidth and vertical performance parameters are not emphasized.
Signal Fidelity Considerations
In contrast to DSOs, dedicated digitizers—such as those on modular platforms like PCIe or PXIe—are usually optimized for the rapid acquisition and analysis of small changes in familiar signals. While providing lower maximum sampling rates, digitizers typically offer higher vertical resolutions of 12-, 14-, and 16-bits. Consequently, a proper understanding of the Dynamic Parameters is paramount for digitizer users.
There is an important distinction between the absolute accuracy and the relative accuracy of a digitizer. The absolute accuracy of a digitizer describes how close its measured voltage values correspond to true absolute voltage reference standards. By contrast, its relative accuracy specifies the fidelity of the shape of the acquired waveform with no reference to absolute voltage standards. Using on-board calibration techniques, a high-speed digitizer may achieve absolute accuracies of order 0.1% of the full-scale input voltage range. In most digitizer applications, however, users are concerned principally with relative accuracy, which is specified by the Dynamic Parameters.
The fidelity of a signal acquired by a digitizer device may be compromised by three distinct factors: 1. Addition of random noise by the digitizer to the acquired signal. 2. Distortion of the acquired signal by the digitizer. 3. Irregularities in uniformity of the time intervals between samples acquired by the digitizer arising from imperfections in the ADC clocking signal.
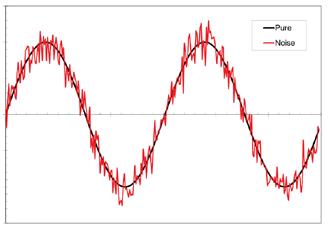
Figure 1a. Illustration of a pure sine wave (black) and one that has picked up noise (red).
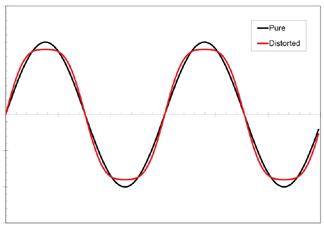
Figure 1b. Illustration of a pure sine wave (black) and one that has suffered distortion (red).
ENOB: The Best Digitizer Performance Metric Andrew Dawson, Ph.D.
The distinction between signal noise and signal distortion is illustrated in Figures 1a and 1b. The figures show a pure sine wave, together with a sine wave that has been compromised by the addition of broadband signal noise and by signal distortion. Distortion is shown as attenuation near the input range limits, which is the typical precursor to signal clipping.
As a rule, the design of an amplifier for low noise and for minimal distortion represents opposing design goals. This principal is illustrated in Figure 2, which shows the transfer curve for an idealized amplifier component. Consider that a small amount of random noise is picked up at the output of this amplifier. If the amplifier was configured for high gain, then it operates in the red region of Figure 2. In this case, the signal suffers high signal distortion, due to the visible curvature of the transfer curve at higher voltage where it begins to saturate. Alternately, if the amplifier was configured for low gain in the green region of Figure 2, then the transfer curve is highly linear and distortion is minimal. The reduced output signal amplitude, however, will result in the noise pickup having a proportionately larger effect. This simple example illustrates the interdependencies that links noise and distortion—namely that if one increases the other generally decreases.
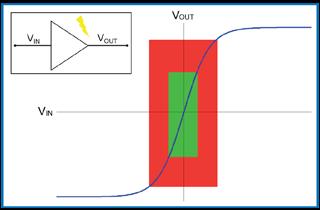
Figure 2. Transfer function of an idealized amplifier. Small signal (green) and large signal (red) regions are indicated.
The effects upon signal fidelity of imperfections in the ADC clocking signal are more difficult to describe. In general, we may distinguish two types of imperfections. In the case of Phase Jitter, the clock signal edges vary about their correct positions that are spaced exactly uniformly by the fixed clock period. In the case of Frequency Drift, however, the actual instantaneous clocking frequency changes over time. Phase Jitter tends to be a greater concern over the shorter term while Frequency Drift error builds up over the longer term. The effect of clocking imperfections will not be directly considered in the measurements below and their effects are assumed to manifest as an associated degradation in measured noise and/or distortion.
Dynamic Parameter Measurement
There are two different measurement methods for characterizing digitizer performance. One method is performed in the time domain and the other in the frequency domain [2]. Both methods involve acquisition of a high-purity sine wave signal by the digitizer under test. Creation of this high-purity sine wave usually requires filtering of the signal generator output by a high-quality, multi-pole passive bandpass filter to remove noise and distortion intrinsic to the signal.
In the time-domain method, which is specified in IEEE 1057-1994, a sine wave function is fitted to the sine wave signal acquired by a digitizer. The resultant error function is then normalized to obtain the SINAD. From the SINAD, the ENOB is calculated as:
ENOB =
___ SINAD − 20log10√3/2 _____________ 20log10 2 ≈ SINAD − 1.76 dB _____________ 6.02
The ENOB is the single most important overall indicator of digitizer performance and allows for direct comparison with the number of bits indicated by the digitizer ’s nominal resolution. The ENOB depends upon signal frequency and also changes with all adjustable digitizer input settings —notably its input range. The main advantage of the timedomain method is that it produces ENOB values with no adjustable parameters. The primary disadvantage is that it does not allow for clear separation and characterization of digitizer noise and distortion.
The second method of characterizing digitizer performance requires signal analysis in the frequency domain. The acquired high purity sine wave is subjected to Fourier analysis and a Power Spectrum is obtained (Figure 3), usually after application of a time-domain windowing function to reduce spectral leakage.
Once the Fourier spectrum has been obtained, three different types of frequency bins are identified: 1. Fundamental Bins are those within a specified range of the known input sine wave frequency f₀. 2. Harmonic Bins are those within a specified range of harmonic frequencies (2f₀, 3f₀, 4f₀...). 3. Noise Bins are all remaining frequency bins.
The sum of all power amplitude values within each of the three types of bins respectively provides the Fundamental Power F, the Harmonic Power H, and the Noise Power N. Unlike with the time-domain technique, the identification of these three power values allows calculation of three Dynamic Parameters:
Signal-to-Noise Ratio (SNR): SNR ≡ 10 log10(F _ N) Total Harmonic Distortion (THD): THD ≡ 10 log10(H _ F) Signal-to-Noise-and-Distortion Ratio (SINAD): SINAD ≡ 10 log10( F _ N + H)
ENOB: The Best Digitizer Performance Metric Andrew Dawson, Ph.D.
Unlike in the time-domain, the frequency-domain technique requires the adjustment of spectral parameters, such as the windowing function type and the number of frequency bins used to determine F, N and H. However, the method has the clear advantage of separating the noise and distortion introduced by the digitizer, which are respectively quantified by the SNR and the THD. The spectral display used in the frequency-domain method also provides a useful visual tool for design feedback during digitizer development.
As in the time-domain technique, the ENOB is calculated directly from the SINAD. The two methods may be shown experimentally to render equivalent ENOB values in most circumstances.
Independent of any noise pick-up within the digitizer, the act of digitization intrinsically adds noise to the signal. This is because the digitizer transforms a continuous analog voltage value into a discrete integer value, which results in an associated truncation error. This truncation adds a small uniform power to all frequency bins in the spectrum that can usually be ignored.
Most uncorrelated “random” noise added to the input signal by a digitizer usually results from pick-up of unavoidable local digital signals. This pickup leads to a broad spectrum of noise across the frequency spectrum and contributes to the reduction of the SNR.
The digitizer ’s THD is primarily degraded by signal distortion imposed within the digitizer ’s front end signal- conditioning circuitry, as illustrated in Figure 2. Unlike distortion, noise pickup is generated within a digitizer independent of an input signal so that the SNR does not depend upon the input signal frequency. In sharp contrast, distortion requires the presence of a signal and usually increases markedly with its frequency due to increased amplifier distortion. As a result, the digitizer’s THD, SINAD and ENOB, usually degrade markedly with increasing signal frequency.
The fact that distortion produces harmonic frequency peaks is easily illustrated by considering the simplest possible distortion scheme, which is modeled in the equation:
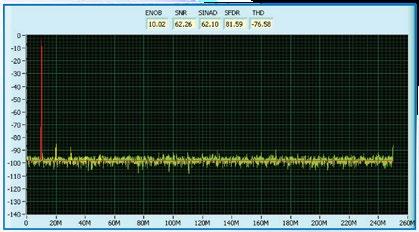
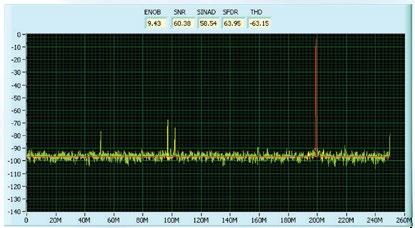
Figure 3. Fourier Power Spectrum used for calculating Dynamic Parameters for a 12bit GaGe digitizer with a 10 MHz sine wave input signal and sampling at 500 MS/s. Fundamental, Harmonic and Noise frequency bins are respectively indicated in red, yellow and green. Figure 4. Fourier Power Spectrum like in Figure 3 but for a 199 MHz sine wave input signal.
VMEASURED = A×V + B×V2
where V is the voltage input to the digitizer, VMEASURED is the voltage measured by the digitizer, and A and B are constants. The first term is linear and so causes no distortion while the second non-linear term can introduce distortion. Next, we insert a sinusoidal signal with frequency f₀ for the input V and use an elementary trigonometry identity: VMEASURED = A×sin(2πf0t) + B×sin2(2πf0t)
VMEASURED = A×sin(2πf0t) + 1⁄2B×(1−cos(4πf0t))
So, the effect of the second non-linear distortion term is to create a harmonic sine wave component at 2f₀ — twice the input frequency. Real distortion is represented by a more complex distortion term, which leads to components at all harmonic frequencies 2f₀, 3f₀, 4f₀... Generally, we consider harmonics up to 5f₀.
Another useful digitizer performance parameter that may be extracted from a Fourier spectra like Figure 3
ENOB: The Best Digitizer Performance Metric Andrew Dawson, Ph.D.
is the Spurious Free Dynamic Range (SFDR). This aptly named parameter is the vertical measure from the top of the Fundamental frequency peak to the top of the highest non-Harmonic peak in the Fourier spectrum. Valuable in communications, the SFDR determines the effective detectability limit of weak narrowband communication signals.
Discussed above, clocking Phase Jitter leads to broadband noise and a skirt-like swell around the Fundamental peak and so mostly affects the SNR, not the THD. Long term Frequency Drift on the clock leads to frequency and timing errors. Modern digitizers are equipped with a high-stability sampling oscillator disciplined by high-precision 10 MHz reference oscillators in order to minimize both Phase Jitter and Frequency Drift.
Dynamic Parameter Results
Having defined the Dynamic Parameters, we now present measurements on a high-performance 12-bit GaGe digitizer. From the definitions, we can conclude that the ENOB (and the SINAD from which it is trivially derived) is the single most informative digitizer performance parameter since it combines both digitizer noise and distortion into a single metric.
Like the noise and distortion, a digitizer's ENOB and input bandwidth are inversely related; if one improves then the other degrades. A simple illustration is the filtering of a signal by a low-pass filter. This action reduces high frequency noise and attenuates distortion harmonics, thus improving the ENOB while reducing the input bandwidth to the filter's roll-off frequency.
Both Figure 3 and Figure 4 show the Fourier signal spectrum from a GaGe 12-bit digitizer sampling at 500 MS/s with accompanying Dynamic Parameter Measurements. The two figures were produced with input signals frequencies of 10 MHz and 199 MHz, respectively.
The 10 MHz ENOB from Figure 3 is just over 10, which is not especially good for a 12-bit digitizer. The near equality of the SNR and SINAD (or equivalently, the much higher absolute value of the THD) show that the performance is principally limited by noise and that distortion is insignificant.
The impressive performance of the 12-bit digitizer is highlighted only in Figure 4, for which the signal frequency is 199 MHz. First, because of the high signal frequency, harmonics are aliased to lower frequencies. Specifically, they are reflected by the Nyquist frequency of 250 MHz (half the 500 MS/s sampling frequency). For example, the second harmonic at 2 × 199 MHz = 398 MHz is aliased to 500 MHz − 398 MHz = 102 MHz.
In contrast to Figure 3, Figure 4 shows that noise and distortion are significant contributors to ENOB since the SNR and THD have absolute values of the same order. The 9.43 ENOB is excellent for a signal frequency of almost 200 MHz. Taken together, Figures 3 and 4 illustrate how GaGe has sacrificed some ENOB performance at 10 MHz in order to achieve excellent performance at near 200 MHz. This achievement resulted from making design choices to minimize distortion at the expense of noise, which corresponds to choosing the green region over the red region in the simplified picture of Figure 2.
Dynamic Parameter measurements at several signal frequencies allow the digitizer user to understand the performance when using signals from their real-world application. Furthermore, such multiple measurements inhibit digitizer manufacturers from specifying parameters at strategic signal frequencies to maximize performance, for example by hiding spurious peaks under the fundamental.
Superior Dynamic Parameters are paramount in applications where the signal has a high dynamic range and so contains both high and low amplitude components. For example, a high SNR enables a low threshold for the detection of low-level time-domain pulse amplitudes, which routinely occur in the signals acquired in particle physics applications and in ultrasonics and other time-of-flight applications. Alternately, in frequency-domain application like communications and spectroscopy, a high SFDR and THD are required to minimize spurious spectral peaks. Consequently, manufacturers should provide the complete set of Dynamic Parameters (ENOB, SNR, THD, SINAD and SFDR) in the digitizer technical specifications.
Conclusion
We have presented the correct frequency-domain method of characterizing the signal fidelity of a digitizer device. Our discussion focused on the Dynamic Parameters SNR, THD, and the SINAD. The SINAD may be trivially transformed into the ENOB, which is the best overall single metric of digitizer performance. We reported upon a 12-bit GaGe digitizer that has achieved excellent performance at near 200 MHz with slightly compromised performance at 10 MHz. In choosing a digitizer, a user must carefully consider both the operating signal frequency range and the performance needs. A good rule is to target a digitizer input bandwidth that is high enough to meet the signal frequency requirements but no higher.
References
[1] Andrew Dawson, “Choosing a waveform instrument:
DSO or digitizer?” ELECTRONIC PRODUCTS, pp 31- 33 April 2005, IEEE Std 1057, 1994. ISBN 1-55937-488-8. [2] Mateo Bertocco and Cladio Narduzzi, “Sine-Fit Versus
Discrete Fourier Transform-Based Algorithms in SNR
Testing of Waveform Digitizers” IEEE Transactions on
Instrumentation and Measurement, vol. 46, No 2, pp 445448, April 1997.
Additive Manufacturing: New Frontiers for Production & Validation
Peter de Groot
Zygo Corporation
Introduction
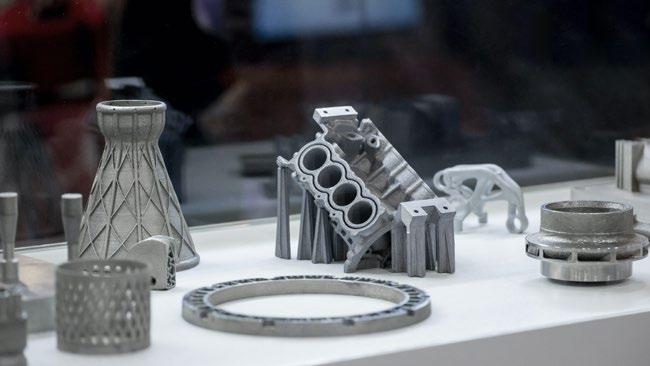
Over the last few decades, additive manufacturing (AM)/3D printing has fundamentally changed the way that manufacturers approach product development. Industry is now almost universally aware of the term rapid prototyping, using AM to convert 3D CAD data into physical models in a matter of hours. The role of AM in prototyping has become embedded across all industrial sectors.
AM has enabled concurrent engineering―where all relevant departments can be engaged early in the product development process. Concurrent engineering replaces traditional “over-the-wall” product development, where design iterations could be delayed by weeks to accommodate tooling and machining considerations. The benefits are dramatic time-to-market reductions and cost savings in product development.
AM is a uniquely disruptive technology. 25-30 years ago, it changed the manufacturing paradigm by altering the way that manufacturers produced prototypes. Today, it is disrupting the way that manufacturers produce end-use parts and components and is increasingly seen as a truly viable production technique. Now the conversation among manufacturers is around the most judicious use of AM for production, its advantages, the sweet spot is in terms of production volumes, key opportunities, and barriers to entry. Many of these barriers relate to precision quality control of AM parts, which challenge traditional methods of surface metrology.
Good Enough?
With the focus today being on the use of AM for production, the analysis of the accuracy and repeatable tolerance attainment of AM has become a far more critical
issue. When used as a prototyping technology, absolute adherence to tolerances and precise design intent is not always necessary, and a “good enough” approach can be taken. Hence the proliferation of inexpensive desktop 3D printing machines that provide sufficiently accurate rapid prototypes that do the job without needing to be perfect.
For production applications, however, “good enough” is no longer sufficient. If an AM part is integral to a safety critical aerospace or medical application, it is essential to achieve dimensional and material tolerance targets consistent with design intent. It is here that the role of metrology to validate the quality of finished parts is so important. It is also an area where providers like ZYGO of 3D optical metrology solutions can make a difference.
Industry Response
Legacy manufacturing processes for metals and plastics have established quality control methods for validating and measuring parts. The production processes are understood, as are the most critical dimensional and surface finish requirements. AM, however, does exactly what the name implies—it produces parts layer by layer “additively,”and this opens up an array of unique issues that can affect the integrity of a finished product, and also a unique set of surface characteristics that make the job of measuring and validating that much more difficult.
How the sector is responding to the metrology and validation conundrum was highly visible at the recent (and largest) AM-related event on the calendar, Formnext in Frankfurt, Germany in November 2021. At various learning events on-site, metrology issues featured prominently, acknowledging the fact that measurement and validation of AM parts is a big deal today. In addition, AM technology providers are now developing in-process metrology (IPM) solutions to overcome the specialized challenges of verifying the integrity of AM processes.
AM technologies and metrology techniques have also captured the attention of professional societies that organize conferences and symposia worldwide. These include the American Society of Precision Engineering (ASPE), the International Society of Optics and Photonics (SPIE), and the International Academy for Production Engineering (CIRP).
Research in AM Metrology
In the search for relevant metrology critical to process control, industry is still trying to understand what to look for on and under the surface of an AM produced part, and how these relate to part functionality. Surfaces of AM parts challenge existing surface topography measurement and defy characterization using standardized texture parameters because of high surface slopes, voids, weld marks, and undercut features.
An area of active research is directed to the physical modelling of optical measurements of surface structures. Significant advances are needed to understand even established optical methods, for the purposes of instrument optimization and uncertainty analysis. Current approaches include Fourier optics analysis using conventional scaler diffraction theory, applied to a wide range of imaging and topography measuring techniques. However, these methods tend to be limited to smooth surfaces such as optical components, and are not directly applicable to complex, steeply sloped surfaces characteristic of AM parts, which generate multiple scattering and nonlinear response in optical instruments. For these situations, more advanced, rigorous methods including boundaryelement methods and rigorous coupled wave analysis are of increasing interest for AM surfaces. Applicationsoriented research is also growing, including best practice configuration of instruments for complex surface structures, in view of the behaviour predicted by advanced models.
Research into new and improved metrology for AM is advancing through a wide range of industry and academic partnerships, many in cooperation with ZYGO. An example is work at the University of Nottingham, where the Manufacturing Metrology Team (MMT) led by Professor Richard Leach is investigating the full range of solutions, from high-precision interference microscopy to X-ray tomography of the internal structure of completed parts.
In just the past four years, the MMT has published 43 research papers on AM, ranging from methods to optimize measurements on specific instruments to new feature-based analysis and machine learning to interpret results. Of particular interest is IPM for evaluating the quality during manufacture, following each additive line and layer in real time. This information can be used to inform control strategies and later in-process metrology developments. An important part of IPM development is correlating to reference metrology, including benchtop surface metrology instruments.
Another example of leading-edge research is at the University of North Carolina at Charlotte, where Professor Christopher Evans and co-workers have been using interferometry and electron microscopy to study AM materials in collaboration with the US National Institute of Standards and Technology (NIST), and Carl Zeiss GmbH at Oak Ridge National Laboratory (ORNL). These researchers have been studying Inconel 625—a high temperature Ni superalloy for AM, that exhibits an intriguing variety of surface signatures. These surfaces have areas rich in oxide films that are visible in true-colour, 3D surface topography maps obtained with ZYGO’s interference microscopes. These instruments also serve as excellent workhorses for examining large areas with high detail, such as distorted weld pools, by assembling or ‘stitching’ together multiple
high-lateral resolution images each with millions of data points.
While the challenges of quality control of AM parts are a great concern for those who make these parts, these same challenges present an attractive opportunity for new solutions and spinoff businesses. Founded in 2018 in the UK, Taraz Metrology is an example of a spinoff enterprise which combines university research, practical engineering, and commercial experience into a unique product development capability customized to the needs of AM. Taraz currently offers freestanding final inspection solutions for all types of AM parts and leverages proprietary software for advanced fringe projection and photogrammetry of topography.
Standardization and Traceability
The ability of AM to produce geometrically complex parts, its role as an enabler of mass customization, and the potential time and cost savings associate with its use are all important for the future of industry. However, when compared to more familiar and established manufacturing methods, AM technology is dynamic and rapidly evolving, and technology innovators are working to overcome the barriers to adoption of AM for production applications, including those related to quality control standards.
Just acquiring dimensional data from AM surfaces is already a significant challenge, but the next step is to establish confidence in the results. The expanding range of application for optical measurements is driving active research in calibration, traceability, and verification for surface topography measurements. ZYGO is working with international collaborators on instrument specification within a general calibration framework based on the metrological characteristics of topography-measuring instruments for advanced manufacturing.
Given the critical nature of data confidence, there are now major international projects linking academics, instrument makers and national metrology institutes with the specific goal of better understanding the data from optical sensors. As an example, ZYGO is a partner in the €2.2M EMPIR 20IND07 TracOptic project, with the title “Traceable industrial 3D roughness and dimensional measurement using optical 3D microscopy and optical distance sensors” —of obvious value to the AM sector.
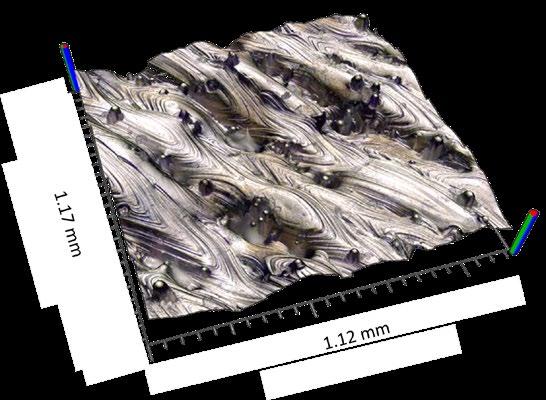
Figure 1. ZYGO’s true-colour interferometric topography measurements of Ti-6Al-4V laser powder bed fusion sample provided by the University of Nottingham illustrates the unusual and challenging surface structure of AM parts. The height range for the topography is 150 µm.
National and international standards are critical both to Industry adoption and to assuring quality control across multiple, developing manufacturing technologies. A clear example is current work within ISO TC213 WG16 to develop the ISO 25178 surface texture standards, including the ISO 25178-603 and 25178-604 standards for interference microscopy, and the 25178-700 standard for instrument calibration and traceability. These developments are directed towards greater consistency in instrument specification, while providing default methods for verifying expected performance.
Post-Process Metrology
Measurements of AM parts post-process serve to validate conformance with design intent, and to provide clues into fabrication problems left by surface signatures. However, the uniqueness of AM processes and produced parts lead manufacturers to use an array of different mechanical and metrology verification techniques. They adopt an empirical approach as no one solution is trusted to provide accurate enough data. Gage R&R is used as a stand-in for a more rigorous measurement uncertainty approach. As a consequence, AM parts are often “overtested” to improve confidence, but this means extra time and extra cost, areas that must be addressed to make AM for production more viable.
The open question is how to improve this situation for greater efficiency while maintaining confidence. The answer is for metrology solutions providers to adapt existing metrology technologies to better align them with the unique characteristics of the AM process and end-use AM parts, which are characterized by irregular, steeply sloped surface topography that many measurement technologies fail to capture.
Through research and development of the foundational coherence scanning interferometry (CSI) technology in the ZYGO 3D optical profilers, high-accuracy AM metrology tools are now available to industry. These instruments use innovative hardware and software upgrades, the package of improvements referred to as “More Data Technology,” which makes the instruments better suited to AM parts.
“More Data” significantly improves the baseline sensitivity of CSI and enables high-dynamic range (HDR) operation making it valuable for a wide range of parts, from steeply sloped smooth parts to exceptionally rough textures with poor reflectivity. Additionally, HDR measures parts with a wide range of reflectance, often a struggle for other instruments that use interferometry as a measurement principle. These advances make it possible to create full-colour surface topography images of metal additive manufactured surfaces using interferometry (see Figure 1).
Summary
With AM now an established production technology for certain applications, there are barriers to mass adoption that are being addressed, including the need for in-process and post-process metrology technologies that can validate the quality and accuracy of the parts produced. AM parts have a unique set of characteristics that render traditional measuring technologies impotent in some situations, and today, innovative metrology technologies are being developed that can provide meaningful measurement data efficiently and cost-effectively. Only when such issues are addressed will the use of AM become mainstream as a viable production technology across an array of industry sectors and applications.
Acknowledgements
Many thanks to Chris Young, PYL Associates, for great discussions and contributions to this article.
Peter de Groot, PhD, is Chief Scientist at Zygo Corporation, which is owned by AMETEK, Inc., a leading global manufacturer of electronic instruments and electromechanical devices with annual sales of approximately $5 billion. ZYGO designs and manufactures optical metrology instruments, high-precision optical components, and complex electro-optical systems. Its products employ various optical phase and analysis techniques for measuring displacement, surface shape and texture, and film thickness. Electro-Optics and Optical Components businesses leverage ZYGO’s expertise in optical design and assembly, and highvolume manufacturing of precision optical components and systems, for the medical/life sciences, defense and industrial markets.


