Executive summary
Headlines
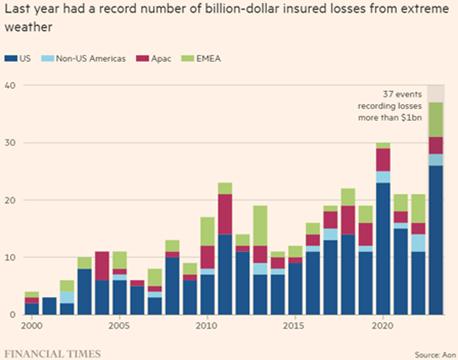
• Disaster records continue to be broken year-on-year, consistent with expected effects from anthropogenic climate change
• Climate change is affecting the severity of hurricanes – the strongest storms are more likely and increased heat leads to more atmospheric moisture and greater flooding. The cost of risk has increased compared to the past
• FEMA spending in the years leading up to a storm is reducing the impact of damages from storms that happen in later years; continued spending to strengthen infrastructure is essential in future years
• Strong building codes have reduced losses in Florida, which helps to suppress insurance premium rates. Damages to buildings built after 2010 were less than 30% of those built prior to 1980 (source: FEMA)
• Avoiding building in high-risk areas is essential, and managed retreat may be necessary
Overview.2 In today's global business landscape, understanding the dynamics of disaster preparedness, climate change impacts and the amplification of hurricane risks is crucial for leaders aiming to navigate and mitigate these challenges effectively.
The key question of this report is whether mitigation efforts are effective in reducing damage of subsequent natural catastrophes. We answer this in two ways in the context of hurricane damage to buildings on the southeast coast of the USA: First, using data from the US Federal Emergency Management Agency (FEMA), we establish a robust statistical relationship which concludes that FEMA spending decreases hurricane damage in subsequent storms; our analysis normalises for inflation - expressed in 2022 US dollars -, windspeed and building stock. Second, we highlight evidence from the National Association of Home Builders (NAHB) regarding the efficacy of building codes after 1994: Better standards lead to lower damages to buildings across the spectrum of storms from lower to higher windspeed events.
This complements and extends the work of our previous report Optimising Disaster Recovery1 , which covered a hundred major disasters from the early twentieth century up to 2017.
Disaster preparedness and response. Effective disaster preparedness begins with the recognition that catastrophes are possible, laying the groundwork for strengthening infrastructure, designing resilient landscapes and conducting rigorous pre-event (evacuation) and post-event (crisis management and recovery) exercises. Our previous report on recovery and resilience from natural disasters2 showed a strong relationship between increased insurance3 penetration, reduced recovery times and improved economic resilience, highlighting insurance as a critical ingredient in disaster mitigation and recovery. Here our focus is on the effectiveness of mitigation investment and stricter standards in “hardening” the building stock of communities against storm damage.
Insurance helps society prepare for disasters. By rewarding mitigation through premium discounts, it incentivises risk-reducing actions and, after disaster strikes, it provides funds for rebuilding. Our previous research showed that each percentage point increase in insurance penetration (non-life premiums divided by a country’s GDP) is associated with a reduction in recovery times by almost 12 months.
In our previously published report Optimising Disaster Recovery5 , we explored over a hundred major disasters occurring from the early twentieth century, including events up to 2017. These were chosen to explore the efficacy of disaster response around the world and how this changes
2 This section is an executive summary and repeats key sections from the full report, as such we have not duplicated citations which can be found in the corresponding sections.
3 In the context of this report, in most places where we speak of insurance, we are also speaking of reinsurance.
over time. The list of disaster events was far from exhaustive but included some of the most devastating events in economic and human terms. Some major events were omitted because the details were still emerging, and we have included some of them in our recent analysis. Since the last publication we have explored 51 new major disasters and find during the period:
• USD 1.2tr in economic damages from events, with each loss more than USD 1bn
• More than 91,000 fatalities
• Tropical cyclones being the most significant type of disaster costing USD 594bn
• Wildfires becoming a significant disaster type, with losses in excess of USD 150bn
Climate modelling leads us to expect more flooding at many locations globally. Consistent with this prediction, we have witnessed major flooding in South Asia in 2020 costing USD 105bn and in Germany in 2021 costing an estimated USD 40bn. The 2022 Pakistan floods devastated communities and led to the forced evacuation of over 20m people.
In 2023, Storm Daniel with tropical cyclone-like characteristics (a “medicane”) devastated Greece, Bulgaria and Turkey with flooding costing USD 21bn. Gaining moisture as it traversed the Mediterranean, Daniel hit the coast of Libya, causing more flooding and the eventual failure of two dams on the outskirts of Derma city. Some 5,000 deaths were recorded in Libya with many tens of thousands missing.
The United States frequently witnesses major hailstorms, but recently various records have been broken in some states. For example, in May 2017 baseball-sized hailstones were produced in one of the most damaging storms ever in Denver. A month later, Minneapolis witnessed a similarly massive hailstorm. Calgary in Canada also suffered losses from this hazard in 2020 when 70,000 homes were damaged by tennis ball-sized hailstones. The combined cost of these events was USD 6.3bn.
Changes in the climate have also lengthened the wildfire season in multiple regions, including the US. It is, therefore, no surprise that we saw a significant number of wildfires in the US since our last report. In California, more than USD88bn of damages arose in 2018, 2020 and 2021.
A string of major North Atlantic hurricanes also made landfall during this time. For example, Hurricane Harvey in 2017 made five landfalls in total with catastrophic flooding and cost a massive USD 125bn in damages, while Hurricane Ian in 2022 generated economic damages of USD 113bn. Hurricane Beryl in June 2024 broke yet another climate record by being the earliest Category 4 and Category 5 hurricane to form since records began, causing devastation to the Caribbean and loss of power to 100,000 residents in Jamaica. We can see that hurricane risk is a huge driver of extreme losses and, also, that efforts to prepare for these risks are vital. For this reason, we have chosen to focus on hurricane risk in the United States in this study.
Overall, more than USD 1tr of economic damages for disasters occurring after our previous study relate to atmospheric threats like rain-induced flooding, hailstorms and windstorms. Each of these is exacerbated by climate change and we can expect disaster costs to increase in the coming years due to warming that will arise in the future due to past emissions. For this reason, whilst it is vital to decarbonise the economy as rapidly as possible to avoid more significant climate extremes in the future, we will also need to prepare our infrastructure and optimise our disaster response.
Impact of climate change on natural disasters. Climate change appears to be exacerbating the frequency and severity of natural disasters such as tropical cyclones, droughts and floods.3 Each degree increase in global temperature correlates with heightened risks of extreme weather events,4 amplifying economic and human costs. Hurricanes, in particular, are showing increased intensity with higher intensification rates. This is associated with greater wind speeds, precipitation and coastal and inland flood risks, and poses significant challenges to vulnerable communities and businesses alike.
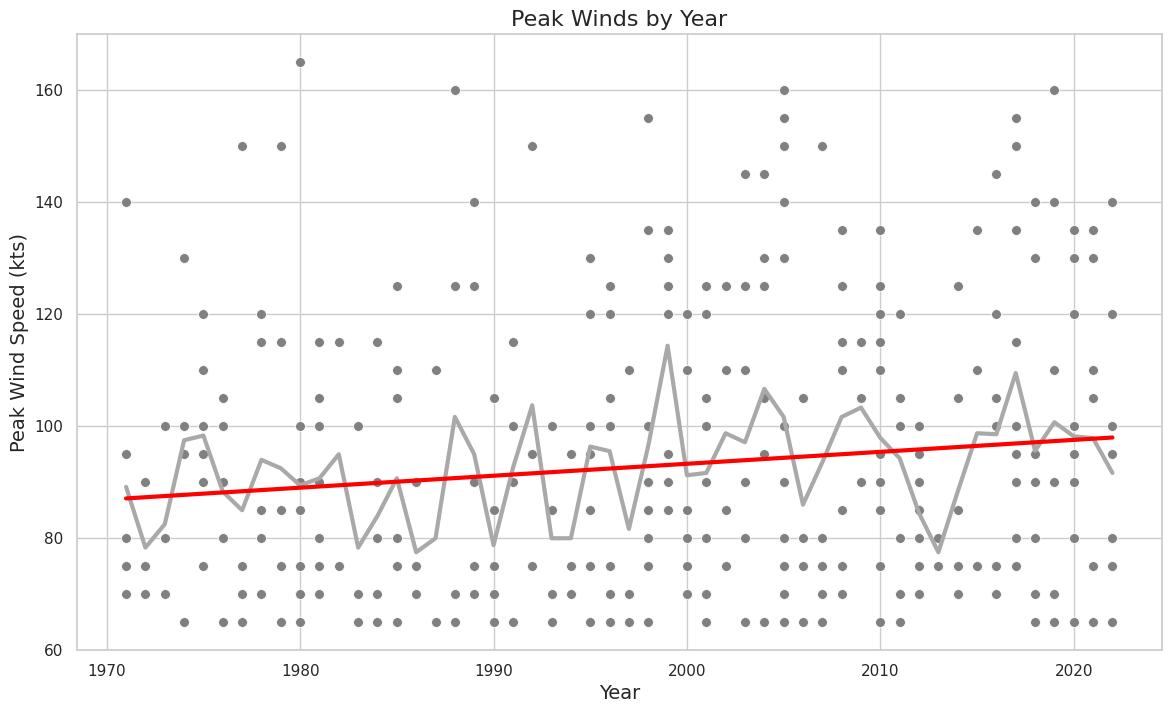
Not only are hurricanes intensifying; the intensification rates are increasing.
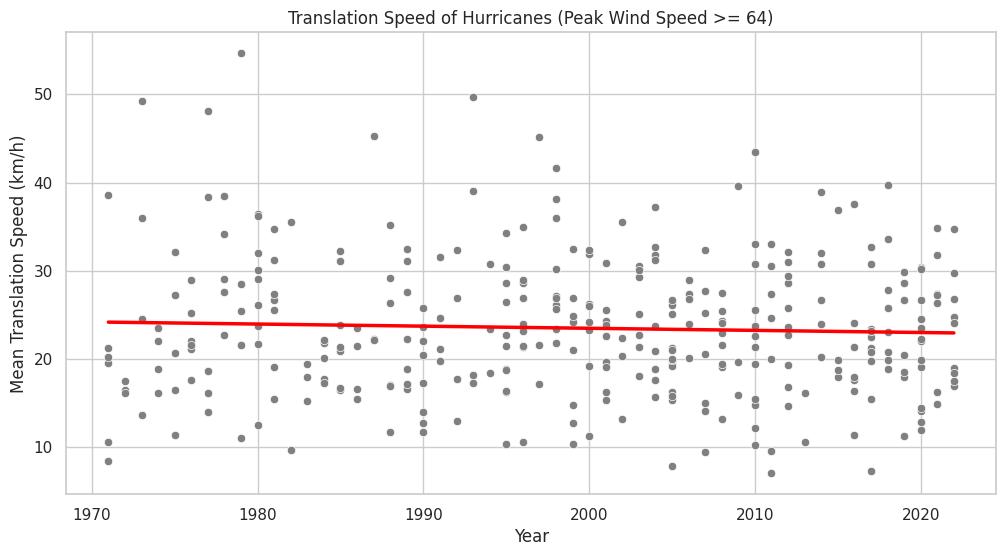
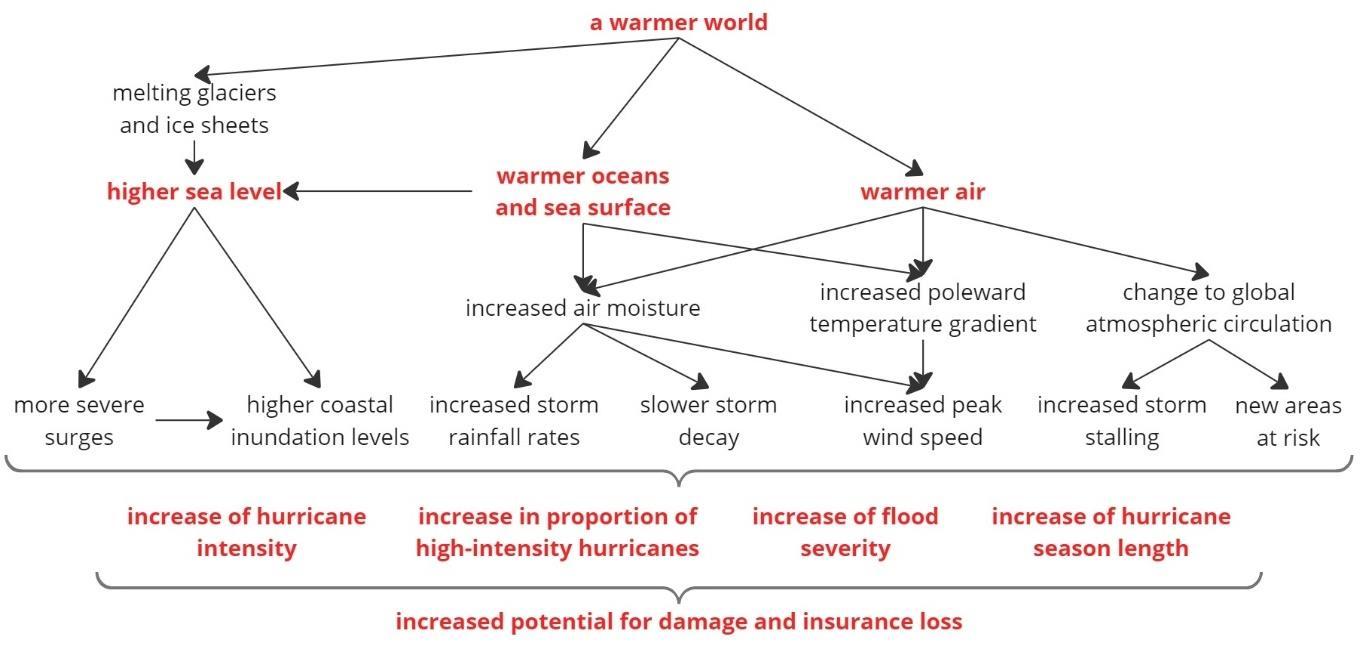
Melting glaciers and ice sheets, together with the expansion from warmer oceans, result in higher sea levels. These sea level increases have already been associated with stronger surges and extreme flooding in coastal areas. The increase in ocean temperature has three main different mechanisms that contribute to hurricane damage: First, additional heat in the oceans increases the sea level as water expands. Second, as water evaporates, warmer oceans provide additional air moisture and convective energy to tropical storms, causing stronger precipitation rates. Third, changes in poleward temperature gradients are likely to affect jet streams, the vertical wind shear, storm tracks and cyclogenesis. Warmer air can withhold more latent energy and water vapour, a 7% increment per 1°C increase in atmospheric temperature.26 As such, the combination of increased air moisture and warmer air temperatures results in increased wind speeds and precipitation rates. On the other hand, there is some evidence that changes to atmospheric global circulation have two potential consequences on storm patterns at regional levels: Changes to translation speed and (possibly) storm stalling. Hurricane intensification has been reflected through the increase in peak wind speeds and precipitation rates, with expected 1-10% increase in peak wind speeds and 12% in global average of precipitation rates according to a 2°C global warming scenario.Not only are hurricanes intensifying; the intensification rates are increasing.
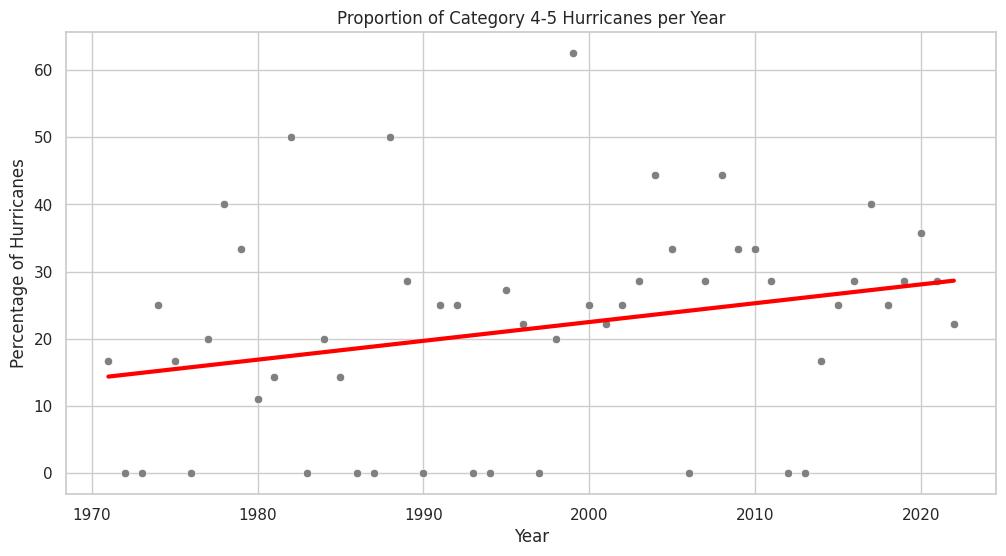
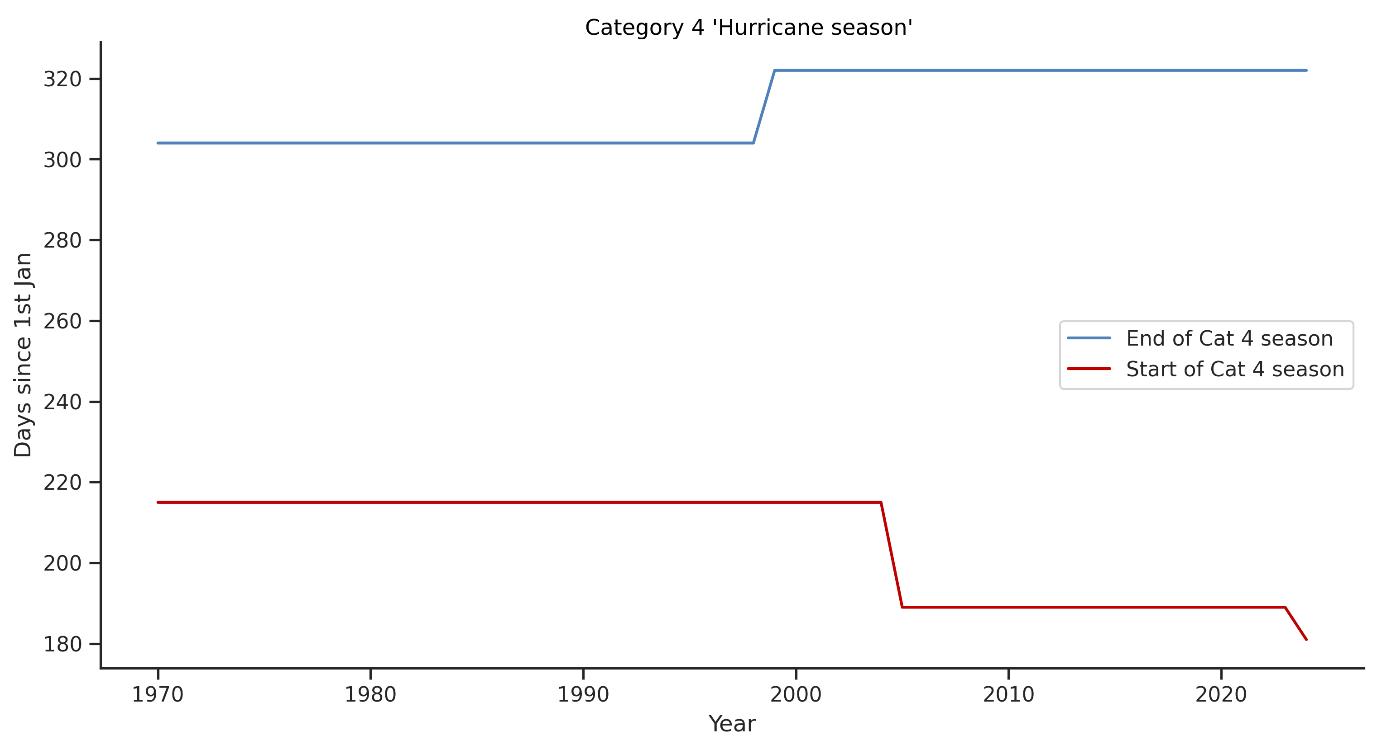
The proportion of high-intensity hurricanes (see Figure E1) is increasing, with a 25% increase trend observed for basin-wide hurricanes Categories 3-5 in the 1979-2017 period (6% per decade)4 Our analysis suggests that since the 1950s, Category 4 storms and above are developing earlier in the hurricane season, allowing for more high-category storms to develop within one season.
Impact of climate change on insurance. Changing global conditions challenge model and scenario design by adding uncertainty to risk prediction, with the risk of falling short by the reliance on past records alone, failing to factor extreme climate events or by rendering future model scenarios obsolete.An increased prevalence of stronger storms may inflate capital requirements for insurers and has the potential to increase insurance premium rates for their customers. Because of global warming, increased storm intensity, the proportion of high-intensity and rapidly intensifying hurricanes could increase costs for state disaster schemes, policyholders and the insurance industry. In early 2023, State Farm and Allstate stated they would no longer offer new policies in California due to “rapidly growing catastrophe exposure” and worsening climate conditions. In Florida, increased hurricane losses and litigation costs have caused seven property insurers to go bankrupt between 2021-2022 and others to reduce their coverage.
4 Kossin et al. 2019
Figure E1: Mechanisms by which global warming aggravates hurricane damage. CCRS analysis
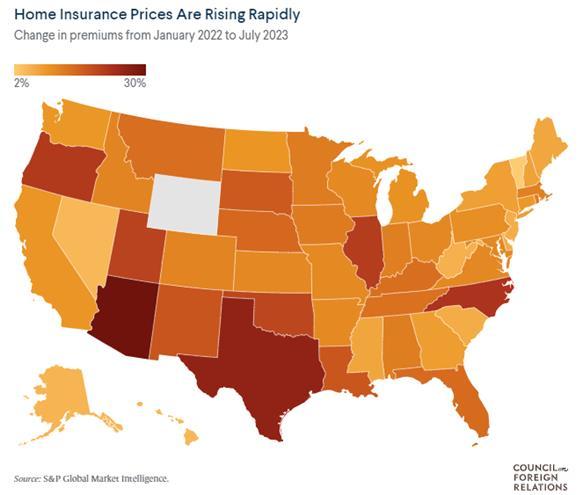
Customers are concerned about the impact from extreme weather events on their homes and household insurance premiums. Homeowners have noticed rises in their insurance premiums and coverage restrictions and are seeking more information on how the insurance industry is reacting to extreme weather events. This suggests that reputational damages are starting to occur for the sector over this subject.
Customers are concerned about the impact from extreme weather events on their homes and household insurance premiums.
Effectiveness of mitigation investments and actions viewed through the US Federal Emergency Management Agency. The majority of Federal Emergency Management Agency (FEMA) spending in the United States is motivated by hurricane impacts in counties along the southeast coast, the region most vulnerable and frequently impacted by hurricanes. Our analysis of FEMA’s spending from 2000-2022 shows that hurricane damage to property in any county is significantly reduced for events that occur after FEMA’s investment on hazard mitigation there: Spending on resilience pays. Nevertheless, FEMA’s spending appears to be triggered more by disastrous events than by pro-active preparation or resilience investments.
Approximately every additional 1 USD of FEMA spend is associated with an average savings of USD 16 in damages between 2000 and 2022, thus highlighting the strong return on investment for disaster mitigation. Our analysis normalises for inflation - expressed in 2022 US dollars, windspeed and building stock across southeast coastal counties. Some of the reduction in property damage by hurricanes may, however, be due to other factors, such as improved building standards in recent decades.
USD 1 FEMA spend has saved on average USD 16 in damages.
The primary role of FEMA has been focused on disaster recovery and response after the occurrence of a natural disaster, with less funding and focus on the role of preparedness (or adaptation) measures before a disaster strikes. Since the establishment of the hazard and mitigation programme in 1989, FEMA has spent more than USD 13bn to help communities implement longterm adaptation projects that are intended to reduce disaster losses and protect life and property from disaster damages. Approximately 76 percent of total adaptation grant funding has been allocated for hurricane, storm and flood-related preparedness.
For the purposes of this study, the counties that are considered hurricane-vulnerable are determined by at least one of two conditions: Either, that the county is considered coastal along the Gulf or the southeastern Atlantic; or that the county reported damages to NOAA-NCEI as resulting from hurricanes. Our analysis combines data on social economic indicators at the countylevel taken from the US Census Bureau database. This includes variables such as population, GDP, number of housing units and the average household income. These indicators have been widely cited in the literature we have reviewed as key determinants to hurricane damages, and hence are included as additional variables to estimating the impact of FEMA hazard mitigation spending on hurricane damages. Other factors defining the intensity of a hurricane, including rainfall, storm surge and central pressure, are also significant factors influencing damages, but are not included in our analysis and could be included in future research. Wind speed overall is recognised as a good predictor of loss and is included to represent physical causes of loss.
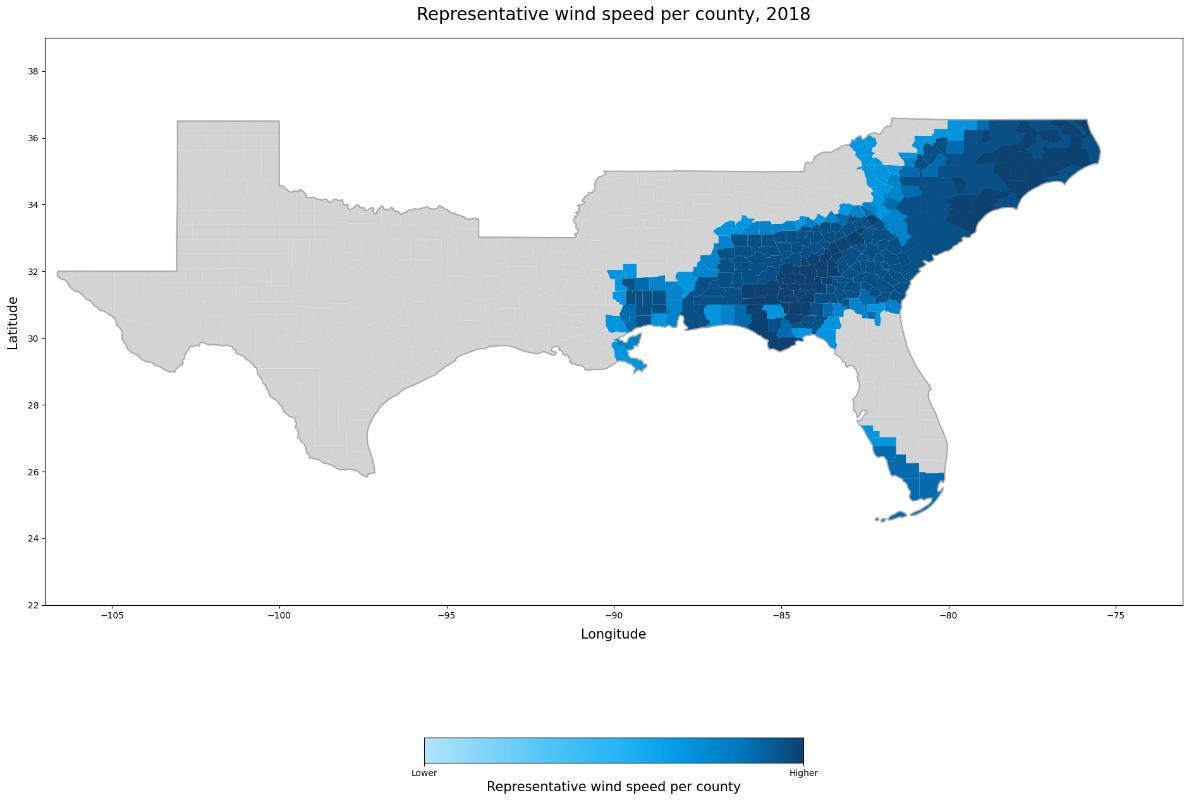
Figure E2 shows the representative wind speed experienced by each coastal county from all storms that hit it in 2018.
E2: Representative wind speed per county, 2018 CCRS analysis based on HURDAT2
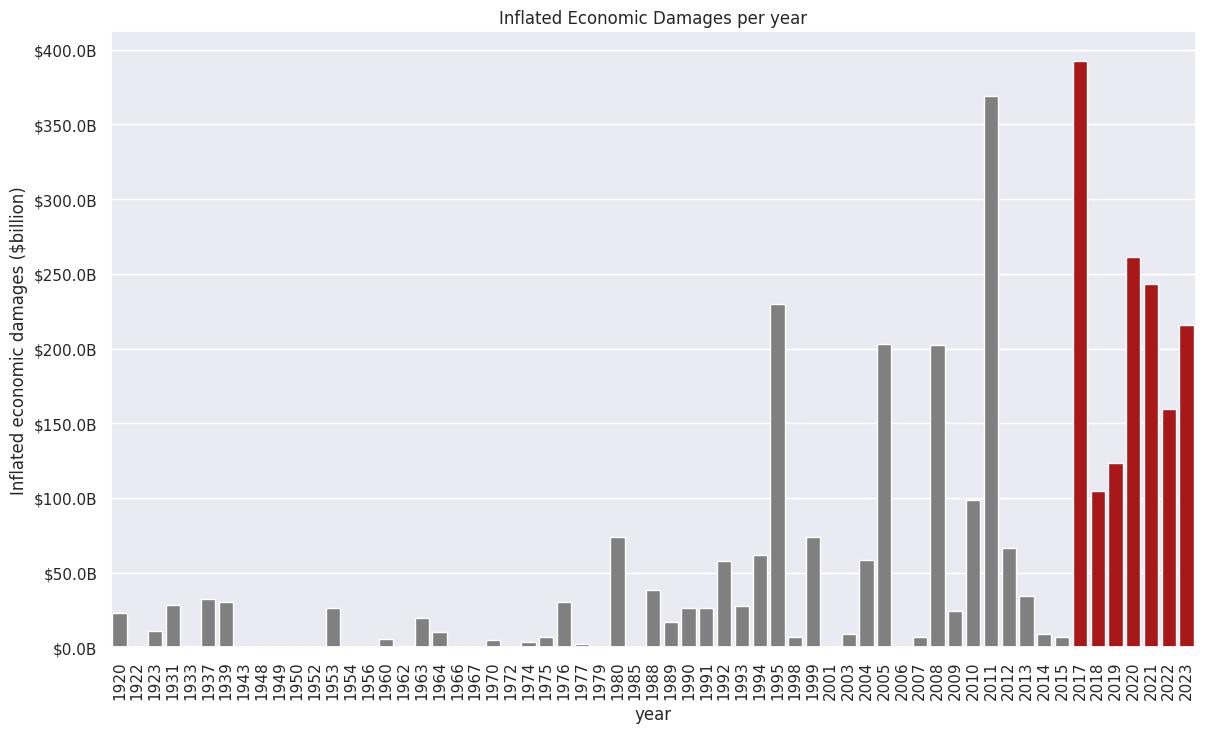
To compare hurricane damages and the effectiveness of FEMA mitigation programmes over time, we normalise damages using county-level social and economic indicators taken from the US Census Bureau. Figure E3 shows that after normalisation, 2005 remains the most damaging year in the US for hurricanes, from a cumulation of hurricanes Katrina, Rita and Wilma, as three basinwide Category 5 hurricanes hit the US. This is consistent with other estimates of normalized hurricane damages.5
E3: Aggregation of normalised hurricane damage at state level. CCRS analysis
5 The data displayed in Figure E3 is for direct hurricane damage according to the NOAA NCEI dataset classification. This excludes damage from storm surges, coastal flooding, flash flooding, heavy rain, high wind, strong wind and thunderstorm wind - which NOAA treats as separate hazards - and therefore explains why some years (e.g. 2017) might have lower losses than would be expected due to damage categorisation under different hazards.
Figure
Figure
We have carried out a multi-variable regression comparing Log damages to the following explanatory variables:
• Wind speed (10 categories)
• Log Population density
• Log Housing density
• Log Average income per housing unit
• Log GDP per capita
• Log FEMA spending
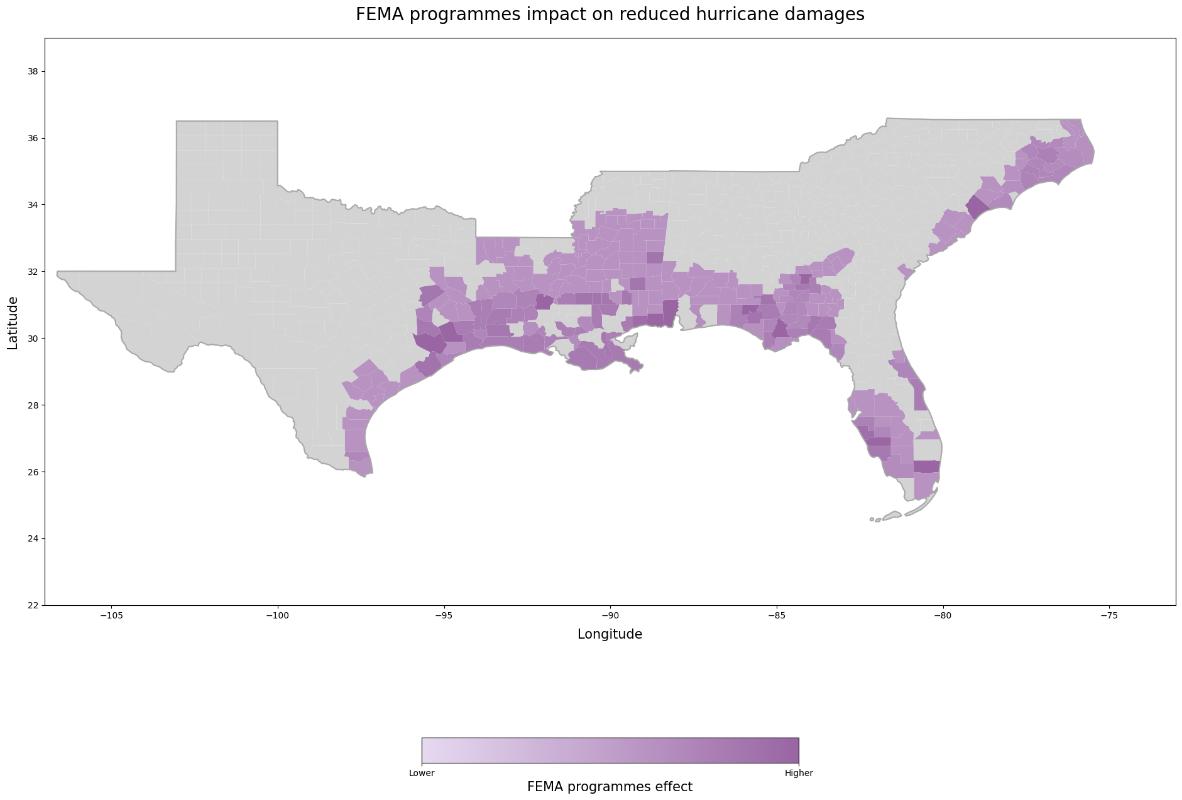
Figure E4 shows our assessment of FEMA’s hazard and mitigation programmes, and the various projects that they fund within a county. The effect is above zero where we have data (dark grey indicates either missing FEMA data or missing hurricane damage data) and shows that measures to developing community resilience, housing and property adaptation can make a significant difference to reducing hurricane damages. While there is some variability in the extent of the impact of FEMA’s programmes affecting hurricane damages in different states and counties, they all show a significant effect in reducing damages over time. We note, however, that FEMA hazard and mitigation programmes show a wide range in their effectiveness across counties of all types, including urban, rural, coastal and inland.

Case studies: Florida hurricanes - Charley (2004), Wilma (2005), and Ian (2022). Previous analysis has looked at the effectiveness of FEMA hazard mitigation programme spending across US states and counties of the southeast that have reported hurricane damages to NOAA between 2000 to 2022, with overall findings demonstrating the efficacy of mitigation and adaptation measures in reducing hurricane damages. In this section, we look more closely at the impacts of three Hurricanes - Ian (2022), Wilma and Charley (2004/5) - to explore the changing levels of resistance and resilience of Florida to hurricanes over time, both from FEMA programmes and building codes, and to explore wider issues such as local politics and impacts to the insurance industry.
Analysing hurricanes that hit Florida, such as Charley, Wilma and Ian, provides valuable insights into the evolution of disaster response and resilience strategies over time. Despite the nearly twodecade gap between these events, similarities in track, wind speeds and location allow for a comparison of the impact of storms over time, highlighting the efficacy of mitigation investments
Figure E4: FEMA impact on reduced hurricane damages. CCRS Analysis
- including those driven through improved building codes and insurance practices, and supported by legislative reforms.
Our analysis suggests that FEMA programmes are becoming more effective over time at reducing damages in counties where the hurricanes made landfall. For those counties that were the initial ones hit, there is not much of a change in FEMA programme efficiency over time, suggesting that hazard and mitigation measures are less effective at a hurricane’s highest intensity and where it makes landfall.
Stricter building codes implemented after hurricane Andrew and further refined over time significantly improved structural resilience, although challenges remain in retrofitting older structures and low-income housing. The insurance industry, strained by hurricanes Charley and Wilma, witnessed reforms to stabilize markets and combat fraudulent claims. Legislative reforms post-Wilma focused on enhancing disaster response and resilience planning, while, 17 years later, post-Ian reforms aimed at stabilizing insurance markets and addressing climate change impacts more equitably.
The National Association of Home Builders (NAHB) carried out a study which explores the impacts on buildings of Hurricane Irma hitting Florida in 2017. The work clearly showed that for buildings satisfying the then-latest codes (i.e. those between 2008-2017), 95% had suffered no damage. FEMA’s Mitigation Assessment Team (MAT) also carried out a study in the wake of Hurricane Ian in 2022 to assess the efficacy of mitigation efforts such as changes in building codes. It uncovered a trend when it came to the average total claim, i.e. the average, per building, of the sum of building damage and content loss claims: Newer houses had smaller average total claims as compared to older houses119 (see Figure 26).

Florida has seen a significant increase in premium rates, reductions in the number of insurers in the region and reductions in coverage levels in recent years. This has been termed an insurance crisis. There is more than one cause. The costs of extreme weather events, excessive litigation, oneway attorney fees and insurance fraud all lead to a major increase in claims costs overall. Consequently, several insurers became insolvent, and some major insurers have withdrawn from the region with others adding exclusions of hurricane and flood coverage. The causes of this crisis have split opinion, with some focussing on climate change as the core cause and others arguing that higher government spending and inflation are the cause.
Major catastrophic losses are a key cause of premium rises. However, even in a year with no hurricanes, insurers lost USD 1.5bn according to a paper by the Davies Foundation, which notes that Florida is eight times more litigious than other states when it comes to challenging claims denials. Indeed, Florida has less than 10% of overall insurance claims in the US but 79% of
Figure E5: Average building damage by date of building construction CCRS figure based on FEMA 2023
insurance-related litigation. Some argue that it has been easier to sue in Florida than other states, leading to Senate Bill 2A, which includes several changes to insurance law to discourage the practice and restrict assignment of benefits. Higher claims costs from all the aforementioned contributing factors mathematically imply higher insurance premiums, since insurers have to cover their cost on average or become insolvent in the long run. This requirement explains why nearly all Florida residents face higher premiums than those in similar properties elsewhere although some believe recent steep rises in premium rates are levelling off.
Should new building be allowed in high-risk areas? This is a difficult question when the availability of affordable homes is a hot political topic. Yet it is clear to some that such areas are being built on to the detriment of homeowners once disaster strikes. Detractors claim the locations of risky areas are known, but federal and state governments provide incentives to build in dangerous zones. Risk maps are themselves changing and must be updated regularly to keep pace with both infrastructure and physical changes.
Should high risk areas be abandoned? This is also a difficult question when people’s homes are lost, and their families and friends are uprooted. Rick Scott, Florida’s junior senator, noted that people want to live in beautiful places so rebuilding must be done safely. FEMA Administrator Deanne Criswell caveated this by saying people should make “informed decisions” by weighing the risks. Nevertheless, “managed retreat” is now on the agenda112 and is likely to remain a divisive subject. Criswell also noted that rebuilding must factor in the latest building codes which will reduce the impact of storms.
Reinsurers outside of the US paid in excess of USD 10bn in claims relating to hurricane Ian. In light of this, it is not surprising that reinsurance rates have been increasing as they are also riskbased. Recognising a shortfall in capacity, the Florida Hurricane Catastrophe Fund was created shortly after Hurricane Andrew. This fund currently has a limit of USD 17bn and an attachment point at approximately USD 9bn of aggregate private market loss. Over 50% of the liabilities of the fund are unfunded and would fall on taxpayers after the fact should losses exhaust available funds. The Reinsurance to Assist Policyholders (RAP) was created in May 2022 to provide a USD 2bn taxpayer-funded cheaper reinsurance layer to insurers in Florida. Shortly thereafter, in December of that year after Hurricane Ian, a second programme - the Florida Optional Reinsurance Assistance programme (FORA) - was enacted to offer further USD 1bn layers in four tranches. This targeted a projected industry retention of around USD 5.7bn. One commentator noted that the attachment point was too high, stating that lower layers of reinsurance were the expensive ones and in a later article suggested only three insurers have made use of FORA.
High population growth from migration into Florida, coupled with increasing risks due to climate change- especially rising sea levels empowering storms surges, increased rainfall and faster winds-, are likely to keep increasing risk levels.
The insurance crisis in Florida is not yet resolved. A bundle of legislative measures has been enacted to ease pressure on rates and we will likely see some of these making an impact in the next year or so. But ultimately, high population growth from migration into Florida coupled with increasing risks due to climate change - especially rising sea levels empowering storms surges, increased rainfall and faster winds - are likely to keep increasing risk levels. Managed retreat from some locations may be necessary and, in the meantime, adaptation by strengthening buildings enforced by strong building codes and a package of protections via major infrastructure, both natural and manmade, will likely be required to keep society safe in Florida in the longer term.
Conclusion. In brief, global business leaders must prioritize disaster preparedness while continually supporting the science of climate change modelling and the translation of that emerging knowledge into effective risk management investments and strategies. FEMA’s hurricane mitigation investments along the southeast coast of the US and the case studies of Florida
hurricanes underscore how much building stock is protected by continuous improvement in hardening of infrastructure and the parallel role of better building codes, insurance practices and legislative frameworks. Given that both climatic risks and the uncertainty in our understanding of these seem to be increasing, expanding insurance activity – across the board, from research to deployment – is essential to building more resilient communities and safeguarding national economic security. By investing in sustainable disaster management solutions and collaborating across sectors, businesses can contribute to a more resilient and adaptive global economy.
Adaptation effectiveness of FEMA spending
FEMA spending in prior years is reducing the impact of storms that happen in later years.
FEMA hazard mitigation programmes
The primary role of the US Federal Emergency Management Agency (FEMA) has been focused on disaster recovery and response after the occurrence of a natural disaster, with less funding and focus on the role of preparedness (or adaptation)86 measures before a disaster strikes. Since the establishment of the hazard and mitigation programme in 1989, FEMA has spent more than USD 13bn to help communities implement long-term adaptation projects that are intended to reduce disaster losses and protect life and property from disaster damages. Approximately 76 percent of total adaptation grant funding has been allocated for hurricane, storm and flood related preparedness. Even more has been spent for public disaster assistance projects, approximately USD 50bn, for affected communities since 1989, in the form of immediate assistance for disaster recovery. Approximately 80 percent of these funds were allocated in response to hurricane flood or severe storm-related events.
FEMA’s hazard and mitigation programme consists of four different funding programmes, three of which contribute to resilience for communities against hurricanes and related hazards, with the fourth being focused on community resilience to wildfire disaster. These three programmes are the hazard mitigation grants (HMGP), the flood mitigation assistance (FMA), and building resilient infrastructure and communities programme (BRIC). All four programmes provide funding for community and household resilience projects based on the submission of a funding application, which are subsequently distributed by FEMA. While FEMA’s funding of resilience projects is confined to funding applications, it is unclear how risk assessments are accounted for in its funding decisions or allocations.
Projects include a variety of different adaptation measures under each programme, some are for individual households, other are organised by local city or county governments. Community grants under HMGP, FMA, and BRIC include projects such as, “flood proofing private structures”, “retrofitting public structures”, the development of “warning systems”, the creation of “stormwater management infrastructure” including flood gates and the construction of detention/retention basins, and environmental adaptation including “shoreline stabilisation”. Individual household resilience projects under HMGP and FMA include building adaptation measures such as building retrofits, floodproofing, acquisition/relocation, and mitigation reconstruction.87
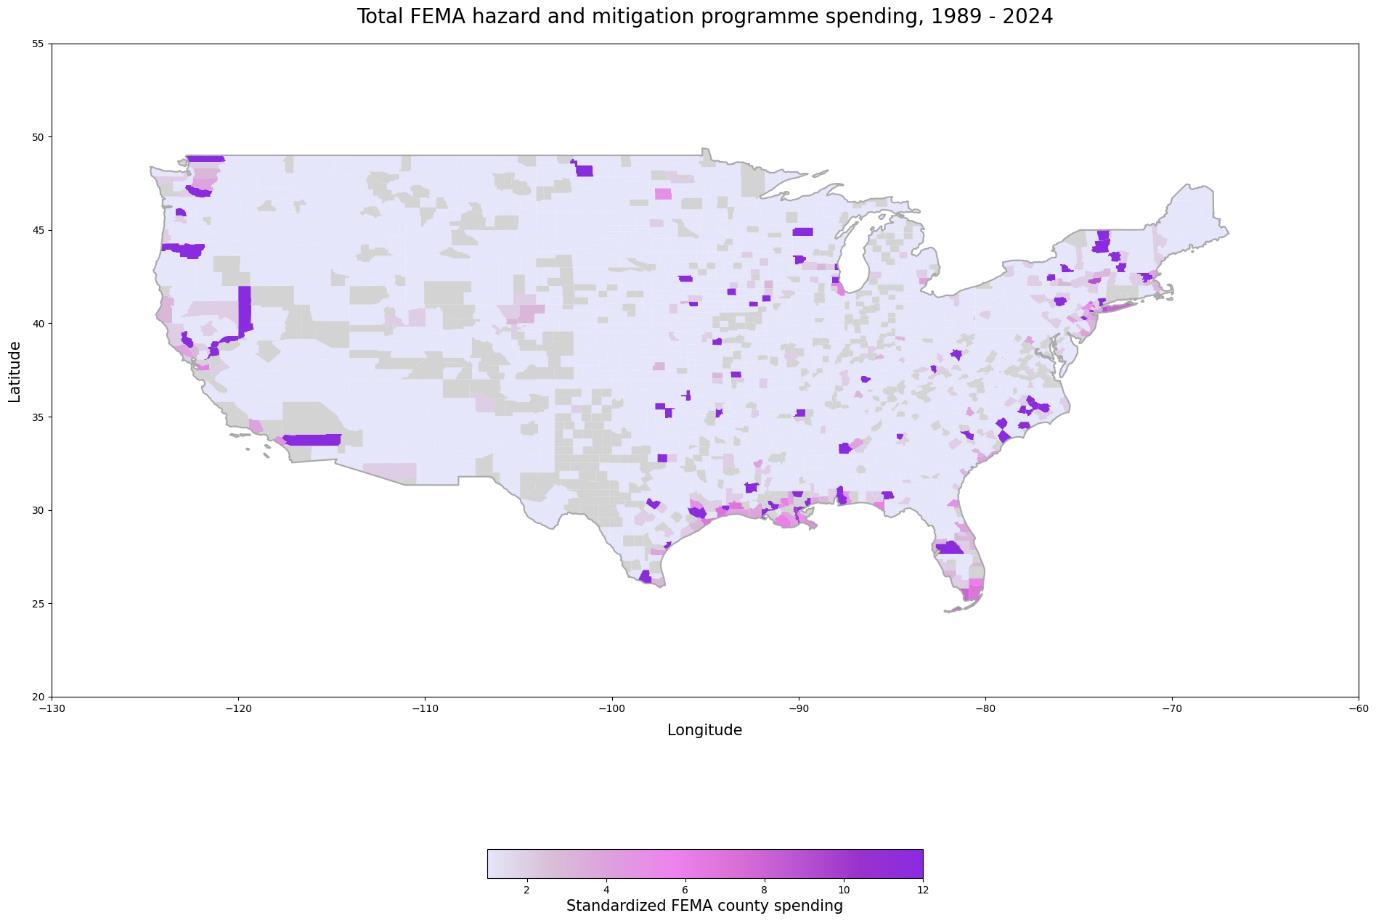
Figure 9 shows the distribution of FEMA’s mitigation programme88 at the county level. Projects are often assigned to specific zip codes, but the data has been aggregated to counties, since this is the primary unit of analysis. The programme contributes to all types of hazard and mitigation efforts, represented by the distribution of spending across geographies, where most spending in the western states is for wildfire protection, and several counties of the northeast and Midwest are for flood protection. From the figure, and as previously cited, most of FEMA’s spending programme has been allocated to counties of the Gulf Coast, for development of projects for adaptation and mitigation programmes against hurricanes.
86 In line with Climate Change literature, we reserve the phrase “mitigation” to mean reduction of greenhouse gases and use the term “preparedness” or “adaptation” to refer to actions taken in advance to reduce the impact of climate effects.
87 FEMA 2023
88 Total FEMA spending on hazard and mitigation programmes is taken from Open FEMA, and online archive of datasets, which includes detailed data on all types of funded programmes between 2000 and 2022, including hazard mitigation assistance, hazard mitigation grants, national flood insurance and building resilient infrastructure and communities programme.
Figure 9: Total FEMA hazard and mitigation programme spending, 1989 – 2024 89 CCRS analysis based on open FEMA datasets
Given the degree to which hurricanes that hit the southeast coast of the US, which are the costliest natural disasters globally, and the fact that most FEMA spending has gone to hazard and mitigation efforts to protect against hurricanes, this report is focused on an assessment of FEMA’s hazard and mitigation efforts against hurricanes in the southeast of the USA.
Data overview
Hurricane-vulnerable counties of the US broadly consist of the states along the Gulf Coast as well as the southeast Atlantic. Nearly all of FEMA’s hazard mitigation projects to protect against hurricane damages are in this region. To observe the efficacy of FEMA projects at mitigating against hurricane damages, data on FEMA programmes is matched to hurricane damages at the county level. Data on hurricane damages is taken from NOAA’s storm database, which is managed by the National Weather Service’s National Centres for Environmental Information. Reports on damages from weather events including hurricanes are collected by NCEI, which is then added to the storm database. Reports are taken from county, state, and federal emergency management officials, as well as local law enforcement, NWS damage surveys, newspaper clippings, the insurance industry, and the public. Hence, the use of the NOAA-NCEI storm database is premised on hurricane damages to counties that are reported but may not necessarily reflect the full assessment of damages that actually resulted from a hurricane, due to the database’s reliance on submissions from a variety of different local reporting sources.90
Consequently, for the purposes of this study, the counties that are considered hurricane-vulnerable are based on at least one of the two conditions: first, that the county is considered coastal along the
89 Values for FEMA programme spending are represented in standardised scale from 0 to 12, with 12 being the largest and 0 the smallest, since the total amount of spending per county varies so widely over the time period, from 1.28 billion USD spent over the period in Harris County, Texas, which is the county for Houston, Texas, and the lowest being 3,000 USD in Sanpete County, Utah. Given the wide range of county-level spending, a standardised scale is used to better illustrate the geographic spread of FEMA programme spending across the country.
90 NOAA-NCEI storm event database, National Weather Service (May 2024).
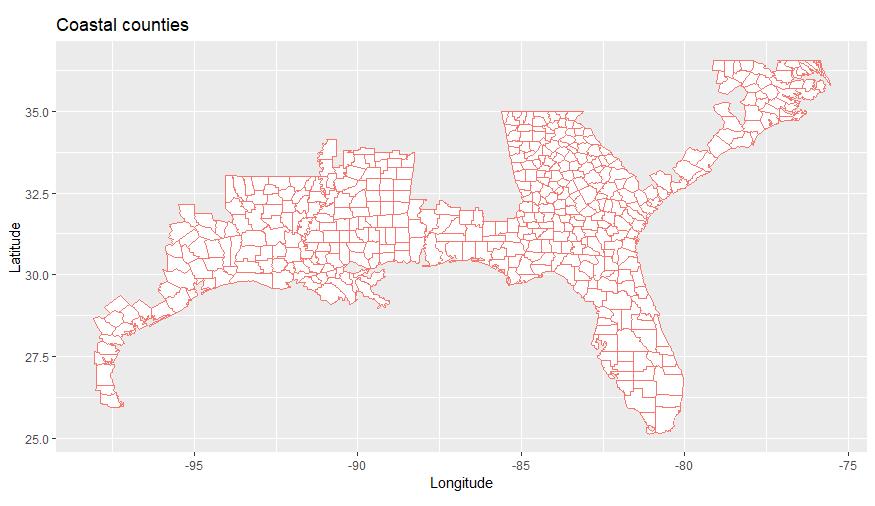
Gulf or the southeastern Atlantic; second, that the county reported damages to NOAA-NCEI as resulting from hurricanes. Figure 10 shows the counties that are included in this analysis based on meeting either one or both criteria. Based on the figure of representative counties, there are some potential biases based on the inclusion of some, but not all counties that experienced hurricane damages. The omission of some counties would be the result of the county not reporting the damages to NCEI, rather than that the county did not experience any damages.
Figure 10: Coastal counties
Additionally, analysis combines data on social economic indicators at the county-level taken from the US Census Bureau database. This includes variables such as population, GDP, number of housing units, and the average household income. These indicators have been widely cited in the literature we have reviewed as key determinants to hurricane damages, and hence are included as additional variables to estimating the impact of FEMA hazard mitigation spending on hurricane damages.91
Finally, the pathway of a given hurricane is stored within the hurricane database (HURDAT2), which provides data tracking the pathway, intensity, and key characteristics of hurricanes. This includes data on maximum sustained wind speed, central pressure, accumulated cyclone energy, maximum rainfall, maximum surge height, maximum hurricane category, global mean surface temperature, soil moisture, and historical hurricane frequency. While all these factors describe the intensity of a hurricane, previous literature has generally cited maximum sustained wind speed as the variable that is most closely associated with hurricane damages. While the other factors defining the intensity of a hurricane, including rainfall, storm surge, and central pressure, are also significant factors influencing damages, wind speed overall is recognised as a good predictor 92 Hence, using wind speed data from HURDAT2, we aggregate observations to the match county level. As a result, when reapplying maximum wind speed to a larger geographic area based on
91 Martinez 2020; Pielke et al. 2008; Bakkensen & Mendelsohn 2016
92 We accept that the inclusion of additional physical climate variables will change the results of our model and estimation. However, since NOAA reports of damages resulting from hurricanes according to attributable physical hazard, such as hurricane, storm surge, or coastal flooding, our study has limited the assessment of hurricane damages specifically to those damages that are attributable to the hurricane itself, and not to flooding or rainfall. Hence, in order to better reflect those specifically attributable damages, we have focused on wind speed as our measure of physical hazard as the predictor of damages resulting from hurricanes, and not to any other hazard that is typically associated with hurricanes, for which damage is categorised separately according to NOAA, such as flooding, rainfall, or storm surges.
county borders, we use categorical levels of representative wind speed, rather than their actual measured wind speed. HURDAT2 allocates winds to swathes a specified distance from the central track into four quadrants. The three levels of windspeed are 34 Kt, 50 Kt and 64 Kt. This does not mean the maximum wind for all points in that swathe was limited to its level, but it indicates that winds were more than the level in that area. Where a county overlaps two or more swathes, we have used the relative area of overlap as weighting factors to calculate the representative wind’s speed in that county. As such, the windspeed allocated to each county is broadly representative of the intensity of the wind field – but cannot be regarded as a maximum wind. For this reason, we describe them as representative wind speeds in our analysis; a county with a high representative windspeed will have experienced strong winds. Figure 11 illustrates how representative categories of maximum wind speed subsequently match to the county-level for a given year. From the figure, the pathway of a hurricane can be observed across the region, but since it is mapped to the countylevel, the spread of wind speed observations across counties represents a wider path of lower wind speed categories. Note however that the graphic shows wind speeds over 2018, and so the graphic merges together all hurricanes which affected a county. If a county is affected by more than one hurricane in a season, we take the maximum representative windspeed for that county.

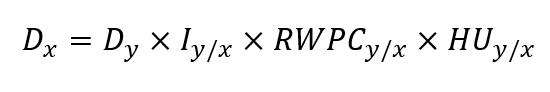
To compare hurricane damages and the effectiveness of FEMA mitigation programmes over time, we normalise damages using county-level social and economic indicators taken from the US Census Bureau. Damages reported from NOAA are taken for the current year, but do not account for change in value from inflation, wage growth, and in the case of normalisation of property damages from hurricanes, normalisation should consider the change in the number of properties in each county.93 Hence, the method for normalising damages is as follows:
93 Weinkle et al. 2018
Figure 11: Representative wind speed per county, 2018. CCRS analysis based on HURDAT2 Methodology
Where ���� is damages in the current year x, ����/�� is the relative rate of inflation from the current year x to the base year y, ����������/�� is the percentage change in real wages per capita for the county and ������/�� is the percentage change in number of housing units in the county between the current year and the base year.
To assess the effectiveness of FEMA hazard mitigation programmes affecting hurricane damages, we take FEMA grant and funding data from 2000 to 2022 compared to the effect on all hurricanes occurring in the southeastern US in the same period. Since data has been collected up to 2022, this is used as the base year to which all other reported damages in previous years have been relatively inflated.
The normalisation of hurricane damages to 2022 allows for hurricane damages to be compared over time. Analysis of hurricane damages is based on reports from NOAA, which is primarily compiled from data submitted by state, county and local officials. Damages are separated into crop and property damage, and only includes direct damages, rather than an estimate for indirect damages. Hence, the results of applying the method of normalisation to the NOAA hurricane damages dataset for direct property damages only, gives the cumulative amount of damages per year per state, based on the set of counties from the previous Figure 10, gives the total amount of property damages in 2022 USD in Figure 12.94

From the figure, after normalisation, 2005 remains the most damaging year in the US for hurricanes, from a cumulation of hurricanes Katrina, Rita, and Wilma, as three Category 5 hurricanes to hit the US. This is consistent with other estimates of normalized hurricane damages. While Hurricane Harvey in 2017 is cited as the second most economically damaging hurricane in the US, it does not appear as high because Harvey was a Category 4 hurricane, and most damages
94 For example, in Figure 12, the bar for 2005 shows a large green section for hurricane damages in the state of Louisiana. The normalisation indicates the amount of damage that would be caused if Hurricane Katrina had hit in New Orleans in 2022 rather than 2005, assuming that all other infrastructure supporting the city was no more effective than in 2005.
Figure 12: Aggregation of normalised hurricane damage at state level. CCRS analysis based on NOAA NCEI
came from the associated storm surges and coastal flooding that occurred with the hurricane, which NOAA treats as a separate hazard compared to direct damages from the hurricane itself. Finally, Hurricane Ian in 2022 that hit the state of Florida appears in the dataset as the second most economically damaging hurricane from the normalisation method, while other methods have generally considered it to be the third most economically damaging hurricane after Harvey.
Taking the normalised hurricane damages from Figure 12, this report addresses the primary factors contributing to or mitigating against hurricane damages from 2000 to 2022. Primarily, this report assesses the role of FEMA’s hazard and mitigation assistance programme in reducing the economic impact of hurricanes. Therefore, the primary interest is in identifying the relative influence of the various determinants of hurricane damages. Hence, the method of analysis is as follows:
From the equation, the log of normalised damages is taken for each county i and each year t. In this report, we explore damages as a function of several social, economic, and physical climate hazard variables. First, ������,�� is the representative wind speed observed in county i and year t. Since hurricane damages reported by NOAA are separated according to the precise hazard causing the damage, with other factors such as coastal flooding or storm surges typically occurring concurrently with hurricanes, but categorised as separate damages, the main physical hazard of interest for specifically hurricane-caused damages is the representative wind speed observed in that county, for that year, rather than the inclusion of rainfall or flooding.
Second, we explore two different measures of county-level density, one that is more directly associated with property damages, which is housing density, and separately we consider population density as a broader measure of damage. Both density measures are taken as the ratio of housing or population per square mile in the county per year. In addition, we include two other social and economic variables related to hurricane damages, which are the income per housing unit, ������,��, and the GDP per capita, ��������,��. Both variables are considered separately, since although they are related, they still represent different characteristics of the county, with the former being a measure of wealth, and the latter a measure of economic activity or output. Additionally, they are related to our specific variable of interest, property damage from hurricanes, in different ways.
The primary variable of interest is the cumulative amount of grant funding provided under FEMA’s hazard and mitigation programme for the county since the year of the last hurricane n, and leading up to the current year of the hurricane t. Hence, the variable refers to FEMA’s spending on long run adaptation and mitigation efforts rather than short-term measures that are implemented when the pathway of a hurricane is already known, and FEMA’s spending in that county increases within that same year to create short-term mitigation efforts.
Finally, to control for other types of variability between counties and over time and refer to the set of controls for each state, county, and year. c is the constant and ����,�� is the error term. The results of applying the model to the normalised hurricane dataset is shown in Table 1. The results of Table 1 broadly show that overall, FEMA hazard mitigation programmes (i.e. pre-disaster) investment have a significant impact in reducing the extent of property damages from hurricanes.
Table 1: Contributing factors to hurricane damages
Notes: The dependent variable is the log value of property damage in USD. Table shows the results of the analysis from the previous equation. Values show the relationship of a variable on influencing hurricane damages averaged over year, county, and state. Separate fixed effect (FE) controls are included for county, state, year, and storm. Parentheses indicate the robust standard error of the values. Models 1 – 6 capture different estimated impacts from the previous equation through added variables. *, **, *** indicate the significance of the relationship at the 0.1, 0.05, and 0.01 level. Table omits population density and housing density together due to collinearity.
Results
Applying the model to evaluate the factors affecting hurricane damages shows the relative influence of each of the variables discussed previously. The table illustrates how the addition of each variable relatively contributes to causally explaining hurricane damages. The first column includes only representative wind speed as the determinant of hurricane damages, which shows a significant influence and a large magnitude coefficient, indicating that an increase in 10 Kt of wind witnessed in a county is related to a 49% increase in hurricane damages when no other factors are considered. However, moving from column 1 in the table to subsequent columns, the role of wind speed is reduced as other variables contribute more to explaining hurricane damages, with the final impact of representative wind speed being a 20% increase in damages for every 10 Kt increase in the wind speed.95
Following column 1 in the table, four variables are explored as determinants of hurricane damages that are typically included in the literature, with two measures representing forms of density by either population and housing, and two measures of county wealth by income per housing unit and by economic output as GDP per capita. From the table, each variable is added to the equation to compare the role of the variable in explaining hurricane damages. Between columns 2 and 3, the model alternates between measures of density being represented by either population or by
95 10 Kt. increase in the wind speed is nearly equivalent to moving from one category hurricane to another. Although not expressed in consistent spreads for knots of wind, the Saffir-Simpson hurricane wind scale for categories of hurricanes ranges in knots from 96 to 112 for a category 3, with a range of 16 Kt, to a 113 - 136 Kt. for a category 4 with a range of 23 Kt.
housing.96 Both variables show significant and positive association of higher hurricane damages with a similar magnitude effect, where every 1% increase in population density is associated with a 0.371% increase in hurricane damages, and every 1% increase in housing unit density is related to a 0.407% increase in hurricane damages. The significance of both density measures and the similarity in magnitude across model specifications is expected since both population and housing density are highly correlated, so they mostly convey the same information at the county-level. Additionally, analysis of hurricane damages only includes reported property damage, rather than total damages, crop damages, or the inclusion of indirect damages. NOAA reported property damages separates damages from a hurricane according to the specific weather event, being either the hurricane itself, or the associated coastal flooding or storm surges, damages for which are categorised separately. Hence, higher housing and population density areas are expected to have higher property damages.
Economic factors that have been included are income per housing unit and GDP per capita. Similar to previous measures of density, both values are associated with higher levels of hurricane damages. Higher average household incomes and higher GDP per capita show positive values indicating that there are higher levels of property damage in higher income counties, and counties with higher GDP per capita. However, when both variables are included in column 5, hurricane damages are significantly determined by GDP per capita rather than average household income.97 Once FEMA spending is added, then the relationship of hurricane damages to GDP per capita is not significant, but is instead primarily related to average household income rather than GDP per capita in columns 6 and 7. With average income per household being the largest determinant of hurricane damages, where a 1% increase in the average household income related to a 1.2% increase in hurricane damages from column 7, this variable is the greatest factor determining hurricane property damages according to percentage change 98
There could be several reasons for the lack of significance of GDP per capita relative to income per housing unit once FEMA spending is added. First, since the focus of the data is on reported property damage, the relationship with average income per housing unit is more closely related to property as a specific type of direct damage, rather than related to the overall economic activity of the county, which would be better observed by the inclusion of all types of damages, such as property and crop damage, as well as indirect damages. Second, wealthier properties and counties are generally built on more favourable terrain than poorer areas, making them less vulnerable to hurricane damages. Third, wealthier areas may also be better protected from hurricanes either by individual property investments in hazard and mitigation, or as recipients of FEMA hazard mitigation programmes. Indeed, closer examination of the factors that drive the allocation of FEMA spending shows that average household income and GDP per capita are both related to higher levels of FEMA spending.99 With a coefficient of GDP per capita of 0.129, this means that for every 1% increase in GDP per capita, this corresponds to an approximately 14% increase in damages.
Finally, the primary variable of interest is the effectiveness of FEMA spending, which is introduced in columns 6 and 7. FEMA hazard mitigation programme spending is included as the cumulative
96 Population density and housing density are highly collinear, with a correlation of 0.9915, hence they are not included together in the model, but they are instead alternated across columns.
97 The two economic indicator variables are similar with a correlation of 0.565. However, since they are not as high as the relationship between population density and housing density, both have been included in the model together. However, the alternating significance for each in columns 5 – 7 suggest that they are capturing similar variation.
98 Similar findings on differentiated impacts of hurricane damages on per capita GDP and incomes have been demonstrated in similar studies showing that losses to scale rise sub-linearly with rising GDP, but that damages rise super-linearly with rising incomes, opposing the traditional assumption of higher protection through higher income Geigner et al. 2016
99 Based on the same model from equation 1 to instead look at the economic variables that determine the allocation of FEMA spending shows that spending is determined by counties with higher GDP per capita and higher average household incomes. The coefficient on household income is 1.294 with a standard error of 0.342, and for GDP per capita it is 0.186 with a standard error of 0.115, indicating that both variables are significant determinants on the allocation of FEMA spending.
amount of FEMA spending per county in the years leading up to the hurricane, but since the last one that hit the county. This assesses the effectiveness of FEMA’s hazard and mitigation programme based on the total amount of FEMA spending used for adaptive and preventative measures to reduce hurricane damages for that county between hurricane strikes. Results confirm that FEMA’s hazard and mitigation programme has a significant role in reducing the amount of property damages resulting from a hurricane. This is represented by the significant and negative coefficient across all model specifications. Further, while the role of wind speed in affecting hurricane property damages is diminished with the addition of new variables that explain hurricane damages, the negative value on FEMA’s programme spending between columns 6 and 7 remains stable, indicating a robust impact of FEMA’s hazard mitigation programmes. Essentially, across specifications, for every 1% increase in FEMA hazard mitigation spending, there is on average a 0.22% reduction in hurricane property damages for that county, holding all other variables constant.100 This corresponds to approximately USD 16 in reduced damages for every USD 1 increase in FEMA spending.
This finding demonstrates that FEMA’s programmes are making a difference in reducing hurricane damages, and that adaptation and mitigation measures play a significant role in supporting the resilience of hurricane-vulnerable counties.
Trends
Figure 13: Effect
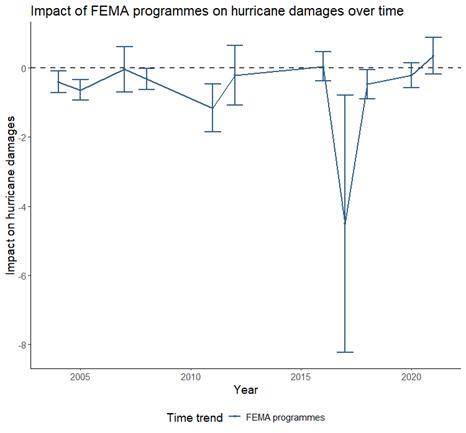
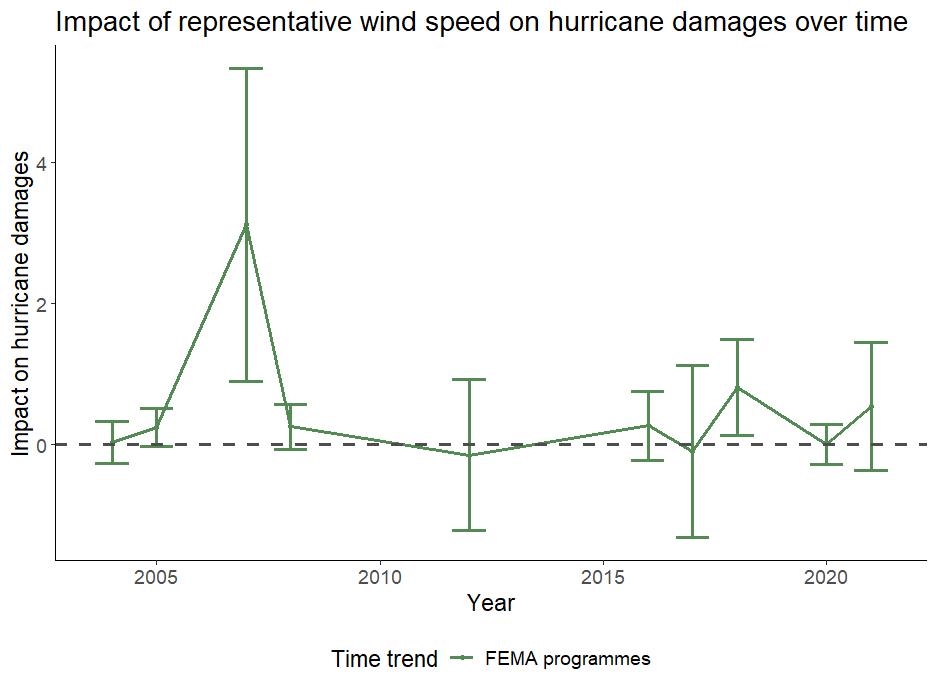
Table 1 shows the average results of each factor determining hurricane damages across counties and across all years from 2000 to 2022; however, they do not capture the differentiated effects in how FEMA programmes affected hurricane damages for each year, or how FEMA programmes affect counties separately. Therefore, to look at trends over time for the key variables of interest, which are FEMA’s hazard and mitigation spending and the impact of wind speed, the equation is modified to interact the variable for FEMA’s programmes for each year. Separately, wind speed is interacted with each year fixed effect to observe the impact of wind speed on hurricane damages over time. These trends are illustrated in Figure 13.
The figures show a fairly stable negative trend over time for the effects of FEMA programmes on reduced hurricane damages, and a positive one for wind speed, indicating that for each hurricane season, the impacts remain largely consistent over time. For both variables on FEMA and wind speed, there are certain years that are far deviations from the overall trend, where each variable had an outsized negative and positive impact, respectively. However, as the trend still reverts to a
100 Davlasheridze et al. 2017
of lagged FEMA spending and representative wind speed on hurricane damage over time CCRS analysis
level closer to the zero x-axis in subsequent years, suggesting that deviations are more specific to the particular hurricane events in that year, rather than representative of a larger trend over time.
Figure 14: FEMA impact on reduced hurricane damages.101 CCRS analysis
Comparing the two trends, annual deviation from the zero x-axis also shows that FEMA programmes have a slightly more significant impact on reduced hurricane damages than wind speed has on increased damages. This is represented by the confidence intervals on the annual impact, which are narrower in the case of FEMA than for wind speed, indicating a more reliable and significant impact of FEMA in reducing hurricane damages than the impact of wind speed in causing damages.
Despite the significance and magnitude of impacts from both wind speed and FEMA’s programmes in driving and mitigating against hurricane damages, the range in the confidence interval as well as the presence of outlying years on the impacts for both variables demonstrate heterogeneity in the impacts across counties.
Figure 14 shows the variation in the impacts of FEMA programmes among counties according to the absolute value, where higher values represent greater impacts of FEMA on lower hurricane damages. From the figure, counties where there is a larger impact are coastal counties all along the Gulf Coast. However, the counties that show the highest impact of FEMA programmes are small, rural, inland counties. The top two counties where FEMA programmes had the highest impact are Avoyelles County, Louisiana and Lee County, Georgia. Both counties are rural, with low GDP per capita and population. However, urban and wealthy counties also show significant benefits from FEMA programmes. Horry county, South Carolina is the third highest county where FEMA programmes had a significant impact, and Jackson, Mississippi is the fifth highest. Broadly, this indicates that FEMA hazard mitigation programmes are effective across all types of hurricaneexposed counties. While some of the most impacted are inland, rural counties, all of those along
101 The individual impact of FEMA programmes for each county represents a narrow range of coefficients with an average value of –0.398 including zero values for counties, and a standard deviation of 1.252. This indicates that the effect of FEMA programmes is broadly the same in reducing damages across counties. However, when mapping individual FEMA coefficients, it is difficult to visually observe between-county variation, hence the scaling for the figure has been adjusted to highlight differences between counties and is simply representative of counties with either higher or lower impacts.
the Gulf Coast, and urban counties also demonstrate significant benefits in reduced damages from FEMA programmes.
Table 2 summarises the social and economic profile of the top ten counties where FEMA programmes have been most effective. From the table, there is a wide mix of urban and rural counties, some with very high GDP and average household incomes, and some that are quite low. The ratio of FEMA spending per capita also shows that counties where FEMA programmes have been most effective at reducing hurricane damages are not necessarily those with the highest ratio of FEMA spending per capita. Generally, the two counties with the highest FEMA spending per capita are the third and fifth poorest counties by average household income, which are Harrison County, Mississippi and Jackson, Mississippi.
Table 2: Summary statistics of the top ten counties where FEMA programmes have had the greatest impact
Figure 15 illustrates the impact of representative wind speed on increased hurricane damages for each county. As previously suggested from the trends over time, there were large differences in the impacts of wind speed represented by the wide confidence interval. The figure shows the range in impacts of wind speed when controlling for all other variables previously discussed, including differences between county GDPs per capita, population, housing units, and average household income. In contrast to the wider range of county impacts from FEMA programmes, findings show that there is not as much variability between counties on the impacts from wind speed. However, there are some differences between states overall, with counties of Florida having a lower impact of wind speed compared to counties in other states such as the Gulf Coast of Louisiana and eastern Texas. Overall, most counties show a similar degree of increased damages caused by higher wind speeds, including both urban and rural counties, inland and coastal.

Table 3 summarises the top ten counties that show the greatest impacts of higher representative wind speed to property damage. First, all counties in the top ten are rural and poor, with the largest county population being Copiah County, Mississippi, with 29,134 residents, and the average income per household being greatest in Cameron County, Louisiana at 87,243 USD per year. Second, eight of the top ten counties in the table are in the state of Mississippi, the poorest state in the US, which further highlights the greater risk to rural and poor counties.
In comparison to table 2 highlighting counties where FEMA programmes have been most effective, table 3 shows that counties with large amounts of FEMA spending per capita, such as Cameron County, Louisiana or Copiah, Mississippi, does not directly contribute to greater mitigation against damages from higher wind speeds. The discrepancies in counties where FEMA programmes have been most effective compared to those that are most vulnerable to wind speed damages suggests that some types of FEMA hazard mitigation projects are better at preventing hurricane damages than other types. Additionally, since counties in table 2 have mostly higher GDP and higher average household incomes than counties in table 3, this suggests that FEMA spending, regardless of the per capita ratio, is generally more effective in wealthier counties.
This could be the result of wealthier counties already having some pre-existing investments in hurricane mitigation infrastructure that is not otherwise captured in the county-level data. For example, several FEMA grant activities include projects such as “stormwater management infrastructure". This type of project is identified in the dataset because it only occurred between the years that are being studied from 2000 to 2022. However, for counties that may have already had equivalent infrastructure prior to 2000, or that was not funded by FEMA programmes, this would not be captured in the analysis. The existence of pre-existing infrastructure to mitigate against hurricane damages is not observed in the data but would most likely be represented in
102 The individual impact of representative wind speed for each county represents a narrow range of coefficients with an average value of 1.30, and a standard deviation of 1.438. This indicates that the effect of wind speed on increased hurricane damages is broadly the same across counties. However, when mapping individual wind speed impacts for each county, it is difficult to visually observe the county-level variation. Therefore, to better represent the differentiated impacts visually, the scaling for the figure has been adjusted to highlight differences between counties and is simply representative of counties with either higher or lower impacts.
Figure 15: Representative wind speed impact on increased hurricane damages.102 CCRS analysis
wealthier counties that would have been able to afford such projects without depending on grants from FEMA programmes.
Table 3: Summary statistics of the top ten counties where representative wind speed has had the greatest impact.
Note: Representative wind speed impacts are standardised out of 10.
The significance of average household income with hurricane damages is broadly consistent with previous findings that shows a significant relationship between higher county GDP per capita and higher average household income as a determinant of where FEMA hazard mitigation funds go, regardless of the ratio of FEMA spending per capita. This could be due to the types of properties and pre-existing adaptation measures that have been incorporated into buildings in wealthier counties rather than in poorer counties, which is not captured by spending from FEMA hazard mitigation programmes alone.
Conclusion
Assessment of FEMA’s hazard and mitigation programmes, and the various projects that they fund within a county show that measures to developing community resilience, housing, and property adaptation can make a significant difference to reducing hurricane damages. While there is some variability in the extent of the impact of FEMA’s programmes affecting hurricane damages in different states and counties, they all show a significant effect in reducing damages over time.
Findings on damages are perhaps as expected for the impact on wind speed, showing that the most vulnerable counties are primarily those that are poorer and rural, with both coastal and inland counties showing similar magnitudes of vulnerability to hurricane damages from higher wind speeds. However, while poorer and rural counties appear as the most vulnerable to wind speed damages, they also benefit the most from FEMA hazard and mitigation programmes. These findings suggest that one of the best and perhaps most important ways to reducing hurricane damages is to focus on rural adaptation and mitigation measures, since they are the most sensitive to both effective adaptation from FEMA programme spending, and to increases from representative wind speeds.
Finally, FEMA hazard and mitigation programmes show a wide range in their effectiveness across counties of all types, including urban, rural, coastal, and inland. While this report has aggregated analysis to the county-level and has considered several types of county-level social and economic variation, the datasets for FEMA hazard mitigation programmes include more detailed information on the types of projects that have been done in each county, including adaptations of
buildings and homes, development of resilient infrastructure, and environmental and naturebased adaptation. Further research should look more closely at the different projects being done in counties where FEMA has been most effective, and in counties where it has been least to identify the types of resilience and adaptation measures that are most effective at reducing hurricane damages.
Case studies: Florida hurricanes
Hurricanes Ian, Wilma and Charley
Previous analysis has looked at the effectiveness of FEMA hazard mitigation programme spending across US states and counties of the southeast that have reported hurricane damages to NOAA between 2000 to 2022, with overall findings demonstrating the efficacy of mitigation and adaptation measures in reducing hurricane damages. In this section, we look more closely at the impacts of three Hurricanes - Ian (2022), Wilma and Charley (2004/5) to explore the changing levels of resistance and resilience of Florida to hurricanes over time both from FEMA programmes and building codes and to explore wider issues and impacts to the insurance industry. In these years, three Category 4 and 5 hurricanes made landfall on the southwestern coast of Florida, and crossing the peninsula in a northeast direction, cause national emergencies. The similarity in tracks and wind speeds allows for a comparative analysis of the FEMA hazard mitigation programme and the particular impacts of each hurricane, while the nearly 18-year gap between Charley/Wilma and Ian allows us to evaluate changes over time, the disaster response dynamics, and resilience capacities of the concerned actors. Variables analysed for this include building codes, and the insurance industry, reinsurance, and legislative reforms.
Hurricane Charley
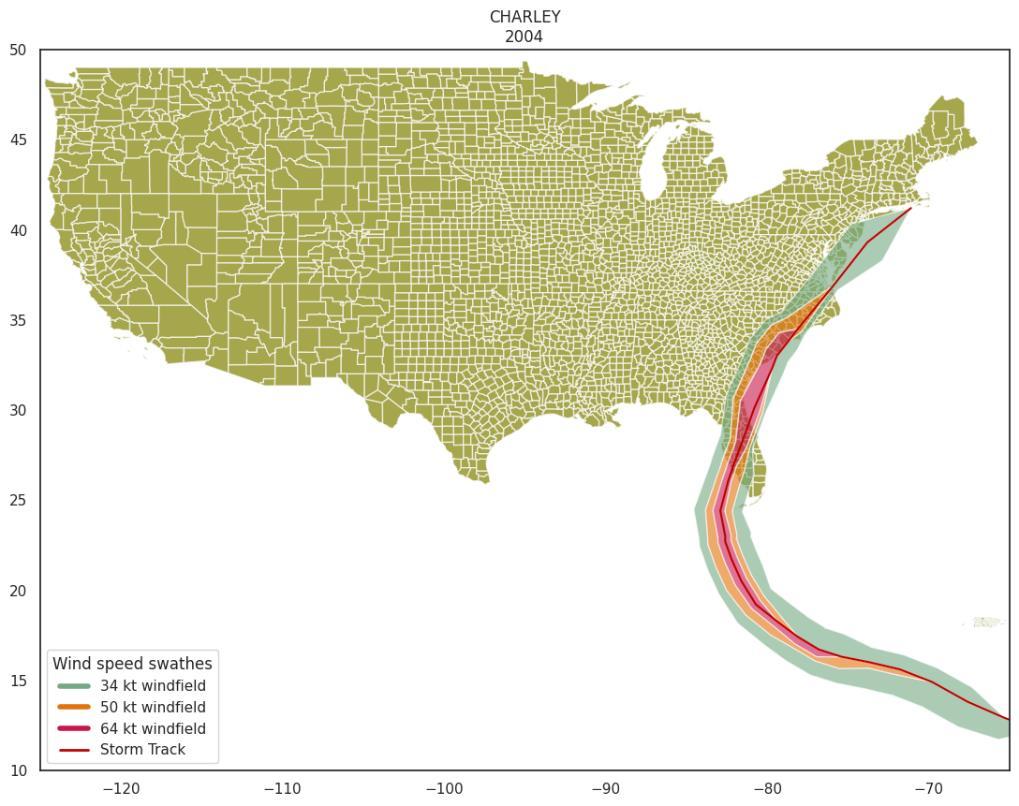
Figures 16, 18 and 20 take information from the HURDAT2103 best track dataset issued by the National Hurricane Centre for NOAA. The red line in the graphics shows the central track of the Hurricane as calculated by NOAA. The coloured bands show where the wind reached at least 30,50 or 64 Kt based on the radii of maximum extent specified in the dataset. These radii are specified for different quadrants (NE, NW, SE, SW) and we have created an algorithm to choose the maximum of these when estimating the wind field, calculating the position of the boundary points perpendicular to the direction of the track (with intermediate interpolation points where the track changes direction). There is more than one way to do this, but we have compared our approach to other published wind field images and believe that our method is a reasonable approximation.
Landea 2022
Figure 16: Hurricane Charley (2004). CCRS analysis based on HURDAT2
Wind fields for all storms since 2004 were created and used in the previous section's regression analysis.
A Category 4 hurricane in 2004, Charley, hit southwestern Florida on 13 August with speeds of up to 150 mph. The hurricane formed as a tropical wave on 4 August, then was classified as a tropical depression 3 on 9 August. On 10 August it was upgraded to a "Hurricane" category by the National Hurricane Centre in Miami, as it rapidly picked up speed in the eastern Caribbean. The next day, Florida governor Jeb Bush issued a state of emergency, requesting the evacuation of 1.9 million people. While up to half a million people shored up supplies and stayed in their houses, 1.42 million evacuated their houses. There were 9 direct deaths and 20 indirect deaths in Florida caused by the storm. The storm caught southwest Florida by surprise as it changed its track within 24 hours from northwest Florida (Tampa Bay Area) to southwest. The storm then made its way through central Florida, before travelling further up north, causing infrastructural damage in Orlando and hitting the states of North and South Carolina, although causing only minor damage there. In addition to an unpredictable change in its track, there was also a sudden shift in its category: Just a mere 5 hours before making landfall in the US, it jumped from a Category 2 to a Category 4 hurricane. Charley cost USD 15.1bn104 and led to 2 million customers losing electricity, with 136,000 still waiting for electricity after a week of the initial damage. 114 food service stations were opened by food bank services, while FEMA opened 4 disaster recovery centres. Later in September, the White House authorized an additional USD 3.1bn for FEMA, bringing the total program assistance in the aftermath of Hurricane Charley to USD 7bn. By that time 2 billion had already been spent on uninsured property loss USD 70m had been directly injected into the American Red Cross, and FEMA itself had received 193,000 applications for assistance, leading to the disbursement of USD 108m. While FEMA continued to provide funds for the uninsured and the underinsured, applicants got anywhere between USD 1.68 to USD 25,600 (the FEMA property loss grant in 2004).
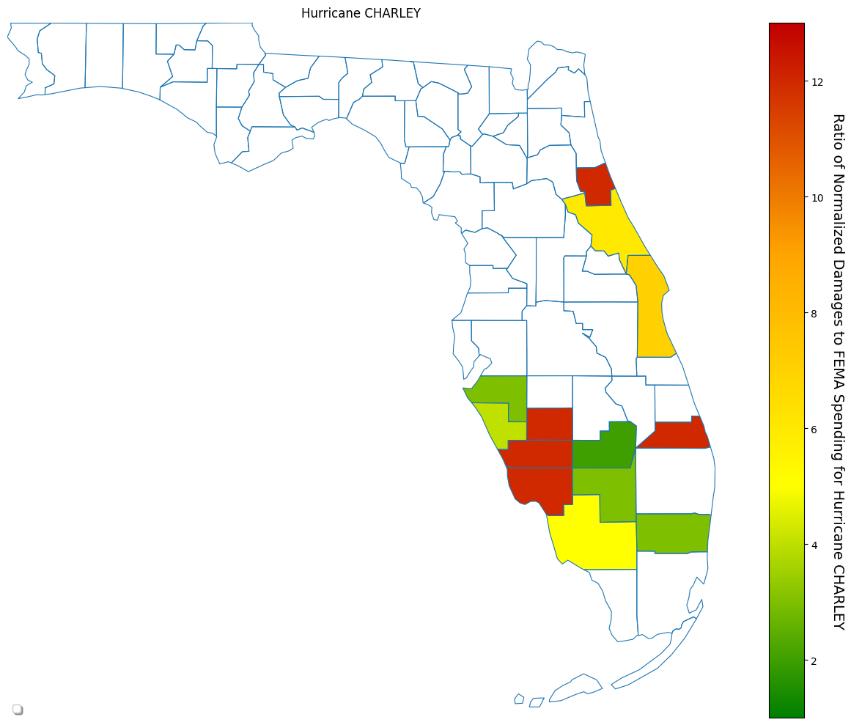
Drawing on the same dataset and analysis used in the previous section, Figure 17 shows the counties of Florida that reported property damages from Hurricane Charley, relative to the amount of FEMA hazard mitigation programme spending in those counties.105 Essentially, the higher value the ratio, the more property damages occurred relative to the cumulative amount of FEMA spending in the county up until Hurricane Charley, but since the last hurricane to strike that county. Hence, the redder the county, the less effective the FEMA programmes were, and the greener the county, the more effective FEMA spending was relative to the amount of damages. We note that two of the red counties were at the point of landfall where the winds are often the strongest, which is consistent with an upper limit of protection against the strongest winds.
Evidence from the figure largely tracks the description of the hurricane’s pathway. The most severely impacted counties where FEMA programmes were least effective were those in central and southwest Florida. As the hurricane crossed Florida heading northeast, it hit counties on the Atlantic coast that also had a high damage to FEMA spending ratio. Interestingly, despite several Florida counties of the southwest showing very high ratio of damages to FEMA spending, directly neighbouring counties show some of the most effective FEMA programmes represented by the low damage to FEMA spending ratio. Although the difference between counties of southwest Florida could be due to the central track of the hurricane, neighbouring counties still experienced very high windspeeds. Nevertheless, given the path of Hurricane Charley and the wide difference in the effectiveness of FEMA programmes for neighbouring counties suggests that some types of FEMA hazard mitigation measures are more effective than others.
104 Blake et al. 2011
105 FEMA programme spending per county is calculated as the amount of money spent for FEMA hazard mitigation assistance programmes in that county for the time leading up to the hurricane hit that county, from the last time a hurricane had previously hit that county.
17: Damages to FEMA spending ratio of Hurricane Charley. CCRS Analysis based open FEMA and NOAA NCEI data
Table 4 shows the social and economic profile of the affected counties from Hurricane Charley arranged by the ratio of damages to FEMA spending from lowest ratio or most efficient, to highest ratio or least efficient. From the table, the counties where FEMA spending was most efficient with lower damages per FEMA spending were not counties that received the most funding support, but were mostly rural and poor. This is the case for Glades and Hendry counties. However, the table also shows that the counties with the least efficient FEMA programmes were those that had the highest number of total damages. For counties with estimates of hurricane damages exceeding 1 billion USD, they were the nineth, eleventh, and twelfth ranked counties by the ratio of damages to FEMA spending. With the latter two counties being located on the southwest coast of Florida, these two counties are where the hurricane made landfall, suggesting that the lower efficiency of FEMA spending is related to the greater intensity of the hurricane, and that greater efficiency of FEMA programmes are for counties that are relatively more rural and poorer.
Figure
Table 4: Summary of social and economic statistics of Florida counties affected by Hurricane Charley

A category 5 hurricane in 2005 at its strongest, Wilma transitioned into category 3 when making landfall in the US. It hit southwestern Florida on 24 October with wind speeds of up to 120 mph. The hurricane formed as a broad low-pressure area in the Caribbean Sea on 13 October. Two days later it was large enough to be classified as “Tropical Depression 24”. Five days later, on October 17, it became a tropical storm. The next day the National Hurricane Centre declared it to be a hurricane, the fastest storm intensification on record Within 30 hours, it reached peak speeds of 185, a category 5 hurricane. Wilma’s central pressure106 at 882mb is still the lowest ever recorded, as a measure of storm strength it illustrates how powerful it was. Governor Jeb Bush declared a state of emergency in Florida and ordered the mandatory evacuation of 160,000 residents.107 As it made it its first landfall on October 22 on the Yucatan Peninsula of Mexico, Wilma became a category 4 hurricane. Wilma dropped 1,633 mm of precipitation: This was the highest amount of torrential rainfall recorded within a 24-hour period in the Western Hemisphere. Despite the threat, most residents decided to shore up supplies and “ride-out” the Hurricane, specifically in the Florida Keys region. This led to Florida’s Director of Emergency Management appealing: "All I can tell people in the [Florida] Keys that are going to ride this one out, one of these days your luck's going to run out".108 By the time it hit southwestern Florida on 24 October it had become a category 3 hurricane. It still managed to spawn 10 tornadoes in the state, and left 3.41 million people without electricity, the largest event in the state’s history.109 The storm caused USD 21bn in terms of property damage, USD 10.7bn in insured losses,110 and led to 5 direct and 15 indirect casualties in the US. After having crossed Florida, Wilma was eventually absorbed by another storm near Nova Scotia (Canada) on 26 October. The ensuing relief efforts were marred by discoordination as cellular services between relief centres and state officials went down. Relief centres either did not arrive on time, or prematurely distributed their supplies.
106 Byrne 2020
107 FEMA 2005
108 Follick 2005
109 Pasch et al. 2006
110 III 2024
Figure 18: Hurricane Wilma (2005) CCRS analysis based on HURDAT2
Given the speed with which Wilma intensified to a hurricane, there was not much time for officials to do much in terms of adaptation efforts in the days immediately preceding the hurricane’s landfall. Hence, any efforts at mitigation had to rely on longer term projects from FEMA’s hazard mitigation programmes. Figure 19 shows the effectiveness of FEMA spending relative to property damage for the affected counties. As shown previously, the central track of the hurricane went across southern Florida, which corresponds to the affected counties. The ratio of damages to FEMA spending appears to be higher where Wilma made landfall, and subsequently less intense as it crossed Florida. Given the wide wind field of Wilma we would have expected more damage in neighbouring counties, but such damages were not reported to NOAA and hence are not shown in the figure. This is suggested by the ratio of damages to FEMA spending in the figure, which shows that FEMA programmes were more effective against the total amount of damages on the Atlantic coast rather than the Gulf Coast, which similarly tracks to the Wilma’s path from the southwestern Gulf Coast and up across the peninsula heading northeast toward the Atlantic.

19:
Table 5 summarises the results for the two counties, with ranking arranged by the efficiency of FEMA spending. In contrast to Hurricane Charley, the more urban and wealthier county shows a more efficient ratio of damages to FEMA spending. However, this could also be since Lee County was where Wilma first made landfall before crossing the peninsula to Broward County, which is also observed from the total amount of damages, with damages much higher for Lee than Broward County. Hence, comparing the two tables 4 and 5, it suggests that regardless of the social and economic profile of the county, efficiency of FEMA programmes relative to hurricane damages is more related to the intensity of the hurricane rather than the extent of spending on preventative measures.
Table 5: Summary social and economic statistics of Florida counties affected by Hurricane Wilma
1
2
Figure
Damages to FEMA spending ratio of Hurricane Wilma. CCRS Analysis based open FEMA and NOAA NCEI data
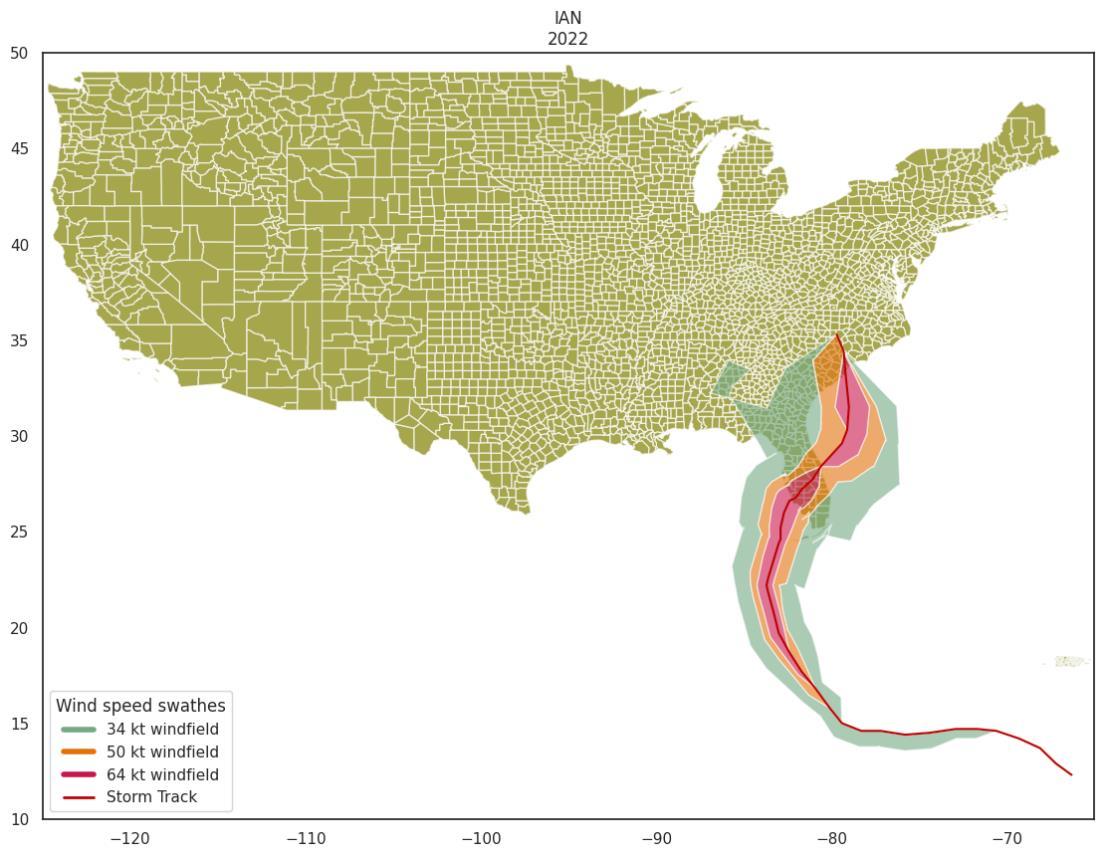
Figure 20: Hurricane Ian (2022). CCRS analysis based on HURDAT2
Making landfall at 150 mph in southwest Florida, on 28 September 2022, Ian began as a benign tropical wave, near the west coast of Africa, moving across the Atlantic on 14 August 111 After nearly a month, on September 23, it was classified as “Tropical Depression 9” as it picked up speed. The next day it was classified as “Tropical Storm Ian”, as its wind speed reached 40 mph. Only 12 hours later, it had to be reclassified as a Hurricane. The same day, Florida Governor Ron DeSantis declared a state of emergency. 2.5 million residents were issued mandatory evacuation orders, and the Biden Administration declared a federal state of emergency. 24 hours later, on 26 September, Ian became a major Category 3 hurricane, making its first landfall in western Cuba the same day, with speeds reaching 125 mph. After leaving Cuba, it strengthened to a category 5 hurricane, travelling towards mainland US. However, on 28 September, as Ian made landfall in southwest Florida, it quickly degraded to a Category 4 storm and then a category 3 storm. After ripping across Florida for 12 hours, it became a tropical storm. Upon exiting Florida, it restrengthened to a hurricane (category 1), hitting the coast of South Carolina, before fully dissipating the next day on 30 October. Ian caused damages of USD113bn over half of which were insured.
Assessing the ratio of hurricane property damages to FEMA spending for Hurricane Ian in Figure 21 shows a similar pattern as that observed with other hurricanes, which is that the highest ratio of damages to FEMA spending, as in the least effective FEMA programmes, are the counties where the hurricane first made landfall, which is the southwest Gulf Coast of Florida. However, in contrast to previous hurricanes, the ratio of damages to FEMA spending shows that FEMA spending was much more effective at lowering damages in counties that were still along the central track of the hurricane, but were not coastal counties exposed to the highest hurricane intensity where the hurricane first made landfall, which are counties on the Atlantic coast.
When considering the increased efficiency of FEMA programmes for counties that were not where the hurricane made initial landfall from Figure 21 in the case of Hurricane Ian, compared to the lower efficiency of FEMA programmes in the case of Hurricane Charley, this suggests that FEMA
111 Bucci et al. 2022
programmes are becoming more effective over time at reducing damages in counties that were not the initial ones to be hit. For those counties that were the initial ones to be hit, there is not much of a change in FEMA programme efficiency over time, suggesting that hazard and mitigation measures are less effective at a hurricane’s highest intensity and where it makes landfall. However, this could also be due to differences in the particular profile and intensity of the hurricane itself.

Evidence of this is supported by the social and economic profile of counties in table 6. From the table, counties with lower efficiency in FEMA spending were exposed to the most intense damage from Hurricane Ian from where it made landfall on the southwestern Gulf Coast, each county with damages greater than 1 billion USD. There is a similar distinction for Hurricane Ian as with Hurricane Charley, where counties with higher FEMA spending efficiency are less populated and poorer than those with lower FEMA spending efficiency. Nevertheless, when considering the change in FEMA spending efficiency over time for counties of Florida that were exposed to hurricanes with a similar trajectory and intensity, evidence from Hurricane Ian in Table 6 suggests that FEMA programmes have improved in their efficiency in limiting damages outside of the counties where the hurricane made landfall, represented from Figure 24.
Figure 21: Hurricane Ian (2022). CCRS Analysis based open FEMA and NOAA NCEI data
Table 6: Summary social and economic statistics of Florida counties affected by Hurricane Ian.
The balance between long-term planning and short-term relief
Hurricanes cannot be avoided but infrastructure can be made more resilient. The frequency of other disasters, such as floods, can arguably be reduced in the long-term by building dams and barrages. However, it is short-term relief that appears to hold more importance with some research showing that voters reward short-term relief efforts more than long-term planning, even if the latter is more effective at minimizing disaster relief.112
Some concerns113 were raised that residents were not given enough warning to evacuate. In response, disaster planning experts noted the storm’s unpredictable track stating that many affected areas were not in the forecast just 72 hours before landfall. It has been argued114 that categorisation of hurricanes into the Saffir-Simpson scale is flawed because it only refers to peak windspeed. It does not include flooding and storm surge potential; for example, potentially giving the wrong signals about damage potential, although that could hardly apply to Hurricane Ian with its 150mph windspeeds and category 5 rating.
Initially, Ian cut power to four million customers in Florida. Much of this was quickly restored but some 391,000 homes were still suffering a blackout more than five days after landfall.115 Post event analysis has noted that socially vulnerable populations suffer more than most during power outages116 Concerns were also raised over the robustness of the electricity grid in Florida with energy companies117 seeking to apply USD 1.1 bn costs from customers to restore services, again falling hardest on poorer communities. The energy companies noted118 that they had spent billions on “storm hardening” following Charley and Wilma and that this had reduced the impact of Ian significantly; therefore, we conclude things could have been much worse if pre-disaster adaptation had not occurred. These companies also pointed to supply chain effects leading to delays in sourcing parts such as transformers where lead times quadrupled compared to pre-disaster levels, the war in Ukraine was even cited as a supply chain issue demonstrating the interconnectedness of all nations when it comes to systemic effects.
The impacts of climate change have also been discussed during the aftermath of Ian. Gulf of Mexico sea surface temperatures were some 0.8C above the long term normal,119 a feature consistent with climate effects, providing the core energy for Ian. Extreme rainfall caused by Hurricane Ian increased by 18%120 well in-excess of the simple 7% per degree centigrade rule mentioned earlier in this paper. Flooding accounted for USD 18-35bn of the total damages caused by Ian according to one study121 with over half of this uninsured. Karimiziarani & Moradkhani122 mined 20 million tweets using a variety of Natural Language AI methods such as sentiment analysis, classification and co-word analyses. They point out that at times of disaster people share their thoughts on social media ranging from offers of help, expressions of dismay over disaster and comments on the emergency and political response. They found that political decisions on aid packages were a key topic along with climate change. Indeed Figure 22 shows that the word “politician” was most strongly associated with phrases related to “help” and “funding”, but a third material topic was the “changing climate”, a social trend that is likely to continue as the world warms further.
112 Healy & Malhotra 2009
113 Helmore 2022
114 Rukovets 2022
115 Reuters 2022
116 Entress & Stevens 2023
117 Entress & Stevens 2023
118 Lee & Swartz 2022
119 Milman 2022
120 Reed & Wehner 2023
121 CoreLogic 2022
122 Karimiziarani & Moradkhani 2023
Figure 22: “Chord charts representing top keywords' co-occurrences [...] (c) with keywords clustered together and classified into top subjects of interest in tweets”. Source: cropped from Karimiziarani & Moradkhani 2023
Should new building be allowed in high-risk areas? This is a difficult question when the availability of affordable homes is a hot topic. Yet it is clear to some that such areas are being built on123 to the detriment of householders once disaster strikes. Detractors claim the locations of risky areas are known, but federal governments and states provide incentives to build in dangerous zones.
Should high risk areas be abandoned? Also, a difficult question when people’s homes are lost, and their families and friends uprooted. Rick Scott, Florida’s junior senator, noted124 that people want to live in beautiful places so rebuilding must be done safely. FEMA Administrator Deanne Criswell caveated this by saying125 people should make “informed decisions” by weighing the risks. Nevertheless, “managed retreat” is now on the political agenda.126 Criswell also noted that rebuilding must factor in the latest building codes which will reduce the impact of storms, this is discussed in the next section.
Building codes
After Hurricanes Charley and Wilma (2004/5), a Lloyd’s assessment cautioned that the Herbert Hoover Dike at Lake Okeechoobee in Central Florida was at the risk of structural disintegration 127 After Charley, the US Army Corps of Engineers commenced work on the structural reinforcement of the dike which was completed in early 2023128 some 3 years ahead of schedule. Such large-scale infrastructure projects are important to maintain public safety, but it is just as important to consider risk house by house and this is achieved by adopting robust building codes
In 1974, Florida first adopted the requirement of constructors to adhere to a building code. Over 400 of its local jurisdictions could autonomously decide to adhere to one of the following 4 building codes: Standard Building Code (SBCCI), Dade and Broward County Code, National Building Code (BOCA), and the Uniform Building Code (ICBO).129 This resulted in a lack of uniformity, so when Andrew hit in 1992, non-uniform but widespread damage was the result. This led to the need for state-wide legislation to avoid regulatory chaos. In 1996, the aforementioned councils merged to form the International Code Council. In 2002, the Florida state legislature adopted the ICC code as its base standard for its own code, allowing supplemental requirements to safeguard Florida against state-specific issues such as hurricanes. This supplemented building code was henceforth called the Florida Building Code (FBC). The National Association of Home Builders (NAHB)
123 Young 2022
124 Collinson 2022
125 Helmore 2022
126 Fecht 2022
127 Lloyd’s 2007
128 Nicol 2023
129 Gianmanco et al. 2023
carried out a study130 which explores the impacts on buildings of Hurricane Irma hitting Florida in 2017. The work clearly showed that for buildings satisfying the then latest codes (i.e. those between 2008-2017), 95% had suffered no damage.131 FEMA’s Mitigation Assessment Team (MAT) carried out a study132 in the wake of Hurricane Ian in 2022. The survey attempted to assess the efficacy of mitigation efforts such as changes in building codes. It uncovered a clear trend when it came to the average total claim, i.e. the average, per building, of the sum of building damage and content loss claims Newer houses had smaller average total claims as compared to older houses133 (see Figure 23). For example, houses built before 1980 had an almost 3.5 times larger average total claim (approx. 191,400 USD) than houses built after 2010 (approx. 54,900 USD).134
Building code revisions
The ICC codes were based on a minimum standard requirement for safety requirements established field-specific technical committees that had expertise within a specific safety requirement. In 2017, Florida’s state legislature devolved the technical review of building codes back to itself. This meant that the Florida Building Commission would take the ICC’s codes only as its base, and then adopt only those requirements of the ICC building code that it deemed relevant to state. In 2017, American International Assurance (AIA) filed an unsuccessful lawsuit against the Florida Building Commission.135 AIA had been worried about the business and operational effects of the new rules. Additionally, for the insurance company, there was an absence of scientific grounds for breaking away from ICC scheme. Time will tell whether buildings built under the new optional codes will be less able to withstand future storms.

The International Code Council (ICC) in its own assessment headlined FEMA’s Mitigation Assessment Team’s (MAT) findings after Hurricane Ian “a mitigation success story for building codes,”136 decisively describing the correlation between improved building codes and reduced hurricane damages:
130 NAHB 2019
131 NAHB 2019
132 FEMA 2023
133 FEMA 2023
134 FEMA 2023
135 Logan 2022
136 Fippinger 2024
Figure 23: Average building damage by age of building. CCRS figure based on FEMA 2023
“The MAT’s analysis indicates progressive reductions in both numbers of submitted claims and average dollar totals of claims for buildings and contents by decade which highlights strengths and advancement in codes, materials and methods by which homes were built.” - Karl Fippinger, International Code Council
Insurance, reinsurance and reforms
A day after Charley disintegrated on August 15, A.M. Best Co. stated that “virtually all” companies would remain unaffected after Charley and would be able to fulfil their commitments to their customers. Hurricane Wilma occurred in a devastating year along with Katrina and Rita and while Hurricane Katrina did not largely affect Florida, the scale of damage in 2005 caused global insurance companies to raise their premiums commensurate with the underlying risk. In the following year, dozens of insurers decided to leave the state and “citizens” had to raise their rates by 45% after the 2005 Atlantic hurricane season. By the time of Hurricane Ian in 2022 features such as hurricane deductibles had led many residents to purchase inexpensive “bare-bones” policies, i.e policies that did not have expensive wind and flood covers and were consequently cheaper.
Florida has seen a significant increase in premium rates, reductions in the number of insurers in the region and reductions in coverage levels in recent years an ‘insurance crisis’, that has more than one cause, including the costs of extreme weather events, excessive litigation, one way attorney fees and insurance fraud, all leading to a major increase in claims costs overall.137,138
Real estate deals in both commercial and residential property have been affected as some potential buyers have had to withdraw offers due to the lack of insurance at rates they are prepared to pay or due to costly property alterations stipulated as a requirement for coverage such as new roofs or removal of trees 139
Extreme weather has been explored within this report and in the case of Florida, is summarised by noting that some 22 major events occurred between 2019 and 2023 costing USD 239bn.140 Flood damage is excluded from standard home policies but often required by mortgages and purchased either from the National Flood Insurance Programme or the private markets. The average riskbased premium level is thought to be in excess of USD 2,000 with the NFIP charging less than USD 1,000 and increases capped at 18% per year 141 Yet the NFIP paid USD 3.9bn in claims to 48,000 policyholders after Hurricane Ian 142 Conversely the Excess and Surplus markets are permitted to charge full risk-based rates but will seem expensive when compared to the heavily subsidised NFIP rates. Citizens Insurance company was set up to be an insurer of last resort but now has over 1.5 million policyholders a quadrupling in numbers in four years, they are also seeking to increase their rates and had expected claims of USD 3.8bn from Hurricane Ian although USD 1.4bn of this was ceded to reinsurers and pools. Since 2023, to encourage more competition, six new insurance companies have been approved143 and a bundle of legal changes have been made to encourage insurers to return to the region.
Major catastrophic losses are a key cause of premium rises. However, even in a year with no hurricanes, insurers lost USD 1.5bn according to a paper by the Davies Foundation144 who note that Florida is eight times more litigious than other states when it comes to challenging claims
137 Carbonaro 2024
138 Martin 2024
139 Cohn 2024
140 Martin 2024
141 Martin 2024
142 FEMA 2023
143 Sczesny 2023
144 Kuhns & Ott 2022
denials. Indeed, Florida has less than 10% of overall insurance claims in the US but 79% of insurance-related litigation.145 Some argue that it has been easier to sue in Florida than other states146 leading to Senate Bill 2A, which includes several changes to insurance law to discourage the practice and restrict assignment of benefits. Assignment of benefits occurs when the insured passes their insurance rights to a third party who can then negotiate the value of a claim. Whilst this may seem a positive outcome, it is notable that the average insurance claim in Florida is argued to be between 1.5-5 times the average elsewhere 147 The requirement to cover costs caused by a wide variety of factors as discussed in this report, explains why nearly all Florida residents face higher premiums than those in similar properties elsewhere, although some believe recent steep rises in premium rates are levelling off.148 Senate bill 2A has now revised the law to state there is no right to attorney fees under either residential or commercial policies.
Recognising the growing physical risks, policyholders are encouraged to make changes to their properties to withstand the force of nature, including protecting roofs, windows and exterior doors and adding flood barriers. The My Safe Florida Home programme has again been funded by the state which allows the public to apply for grants with each $1 provided by the homeowner matched by $2 from the state. Such home improvements are expected to reduce the risk, and this must, by law, be reflected in premium rates of local insurers.
Reinsurers outside the US paid in excess of USD 10bn in claims relating to hurricane Ian. Recognising a shortfall in reinsurance capacity the Florida Hurricane Catastrophe Fund was created shortly after Hurricane Andrew. This fund currently has a limit of USD 17bn, and an attachment point at approximately USD9bn of aggregate private market loss. Over 50% of the liabilities of the fund are unfunded and would fall on taxpayers after the fact should losses exhaust available funds.149 Following the increases in reinsurance rates in recent times (magnified later by Hurricane Ian) the Reinsurance to Assist Policyholders (RAP) was created in May 2022 to provide a USD 2bn taxpayer funded cheaper reinsurance layer to insurers in Florida.150 Shortly after this, in December, that year after Hurricane Ian a second programme the Florida Optional Reinsurance Assistance programme (FORA) was enacted offering further USD 1bn layers in four tranches 151 This targeted a projected industry retention of around USD 5.7bn.152 One commentator noted that the attachment point was too high stating that lower layers of reinsurance were the expensive ones,153 and in a later article suggested only three insurers have made use of FORA 154
To conclude, the ‘insurance crisis’ in Florida is not yet resolved. A bundle of legislative measures has been enacted to ease pressure on rates and we will likely see some of these making an impact in the next year or so. But ultimately, high population growth from migration into Florida155 coupled with increasing risks due to climate change, especially rising sea levels empowering storms surges, increased rainfall and faster winds, are likely to keep increasing risk levels. Managed retreat from some locations may be necessary and, in the meantime, adaptation by strengthening buildings enforced by strong building codes and a package of protections via major infrastructure, both natural and manmade, will likely be required to keep society safe in Florida in the longer term.
145 Rosanes 2023 (1)
146 Nixon-Jones 2024
147 Cohn 2024; Edinger 2024; Nixon-Jones 2024
148 Edinger 2024
149 Raymond James 2023
150 Rohrer 2022
151 Evans 2022
152 SBA Florida 2024
153 Rabb 2022
154 Rabb 2023
155 Junge 2023
Glossary
Adaptation: In the climate change literature, the phrase is reserved for actions taken to prepare society for inevitable effects due to expected emissions. In this report we use the phrase in a similar way to the “preparedness”.
Billion-dollar disasters: Disasters whose overall damage/costs exceeds USD 1bn. (NOAA)
BRIC (Building Resilient Infrastructure and Communities Programme): BRIC is an annual programme that supports the implementation of hazard mitigation projects to reduce the risks from disasters and natural hazards. The programme aims to categorically shift the federal focus away from reactive disaster spending and toward proactive investment in community resilience.
FEMA funds BRIC with a 6% set-aside from the federal post-disaster grant fund.
CCRS: Cambridge Centre for Risk Studies.
Central pressure: The central pressure is measured in the eye of a hurricane. Hurricanes are low pressure systems where high winds are drawn towards the low pressure at the centre of the hurricane. Typically, the lower the pressure the more severe the hurricane.
Compound risks: Co-occurrence of multiple hazards that increases the overall risk severity (Zscheischler et al. 2018).
Controls: Also referred to as fixed effects. From the regression analysis, controls for state, county, and year are included to account for unobserved variation that is not included in the model or the data, but that is fixed across states, counties, or years.
Cyclogenesis: The development and intensification phases of extratropical cyclones (Britannica).
DRF (FEMA’s Disaster Relief Fund): FEMA-managed funding for domestic disaster and emergency relief programmes.
Extreme events: Unusually severe weather, climate or environmental conditions. These include extreme weather events such as heat waves and tropical cyclones, and climate-related extreme events such as droughts or wildfire outbreaks (USDA Climate Hubs).
FBC (Florida Building Code): State-level building codes that constructors must legally adhere as a bare minimum when constructing buildings. The codes are passed by the Florida state legislature.
FEMA (US Federal Emergency Management Agency): Established by President Carter in 1979 with a dual mission of civil defence and emergency management.
FMA (Flood Mitigation Assistance programme): FMA provides grants to states and local governments to reduce or eliminate the risk of repetitive flood damage to buildings insurance under the National Flood Insurance programme.
FORA (Florida Optional Reinsurance Assistance programme): A temporary taxpayer funded reinsurance programme introduced to Florida following Hurricane Ian in response to increases in reinsurance rates.
Hazard: Generally with reference to mitigation efforts, hazards are physical climate risks. They are either acute hazards such as heatwaves and floods, or chronic hazards such as drought and rising sea levels.
HMGP (Hazard and Mitigation Grant programme): HMGP funds projects that reduce or mitigate future natural disaster loss in local communities.
HURDAT 2: A data set containing: hurricane tracks, windspeed and radii of wind fields provided by NOAA. The dataset includes information from a historical reanalysis of stems going back to the mid-1800s. The most accurate data relates to the satellite era and before this lower quality, but still useful information was gathered by hurricane hunter aircraft.
Hurricane: A tropical cyclone formed over tropical or subtropical waters (NOAA), with maximum wind speeds above 64 Kt. according to the Saffir-Simpson scale.
Hurricane intensity: The most commonly used measure of hurricane intensity is based on wind hazard; the SSHWS category, for example, relies on maximum sustained wind speed. Nonetheless, other scales consider its strength, duration and frequency (see PDI) or maximum wind speed combined with size of the wind field (Hurricane Severity Index, HSI) to categorize hurricane severity.
ICC (International Code Council): A consortium comprising of construction and technical experts. Based in the US, the ICC creates building codes that states in the US adopt or modify when creating buildings.
Insurance: In the context of this document, “insurance” also includes “reinsurance”.
MAT (Mitigation Assessment Team): FEMA’s in-house team that assesses the effectiveness of natural disaster mitigation strategies and practices such as building codes.
Mitigation: In the climate change literature this phrase is reserved for actions taken to reduce emissions of greenhouse gasses. In general (and in this report) the term is similar to “preparedness” and includes actions taken to reduce risk.
NAHB (National Association of Home Builders): A membership organisation of building professionals with an elected board. The Association aims to promote home ownership and shares best practices through knowledge sharing and networking.
NCEI (National Centres for Environmental Information): NCEI provides environmental data, products, and services on atmospheric, coastal, geophysical, and oceanic data.
NFIP (National Flood Insurance Programme): Managed by FEMA the NFIP is accessed by the public via 50 participating insurance companies. It provides Flood insurance to businesses and the public.
NHC (National Hurricane Centre) Located in Florida the NHC is one of nine National Centres for Environmental Prediction run under the auspices of NOAA. It provides hurricane forecasts.
NOAA: National Oceanic and Atmospheric Administration: Formed in 1970 by executive order of President Nixon it brought together various observatories that had been existence since the 1800s. The Administration carries out multiple strands of earth observations from atmosphere to oceans. Its mission is to “provide daily weather forecasts, severe storm warnings, climate monitoring to fisheries management, coastal restoration and supporting marine commerce.
Normalisation: With reference to hurricane damages, normalisation of hurricane damage data accounts for changes over time in the reported, current US dollar value assessment of damages in order to provide a consistent, comparable measure over time. This takes into account changes in damage assessments based on growth in the number or housing units per county, growth in average household incomes, and the rate of overall inflation over time.
PDI (Power Dissipation Index): It is an indicator of a tropical cyclone’s activity based on its strength, duration and frequency (Global Change Data Lab).
Precipitation rate: Amount of precipitation collected on a specific area over a defined period (NASA Earth Data).
Preparedness: A general phrase including actions taken to protect property, processes or people against natural disasters. Preparation leads to preparedness.
RAP (Reinsurance to Assist Policyholders): A taxpayer funded reinsurance programme providing layers below the Florida Hurricane Catastrophe Fund to participating local insurers.
Regression: A statistical methodology which relates a variable of study - the “response” (e.g. level of disaster losses from hurricanes) to one or more explanatory variables (e.g. windspeed, FEMA
spending or GDP). Regression results in a “model” which predicts the response given the specific values of the explanatory variables. The difference between the predicted response and the observed value is known as the residual.
SSHWS (Saffir-Simpson hurricane wind scale): Tropical cyclone categories scale based on the maximum sustained wind speed (NOAA). Higher windspeed correlate with increased damage but omit other characteristics such as forward speed and rainfall levels.
Tropical depression Tropical
Storm stalling: Slow-down of a tropical cyclone transition speed to the point where it stops or hovers over a certain area for a prolonged period. A stalling storm results in the local accumulation of damage from extended hazard exposure (NASA Earth Observatory).
Storm surge: Abnormal sea water level rise generated by a storm (NOAA).
Tropical cyclone: A low-pressure system and rapidly rotating storm formed over tropical waters. Depending on the region and intensity, tropical cyclones receive the denominations of hurricanes or typhoons (World Meteorological Organization).
Tropical depression: The weakest form of tropical cyclones, with maximum wind speeds below 34 Kt.
Tropical storm: A tropical cyclone with maximum wind speeds of 34-63 Kt.
USD: United States Dollars.
Vertical wind shear: Change in wind speed and direction with a change in altitude. A strong vertical wind shear may affect the development of tropical cyclones by disrupting the warm-core structure of the cyclone (Hong Kong Observatory).
References
Akperov, M., Rinke, A., Mokhov, I., et al. 2019. “Future projections of cyclone activity in the Arctic for the 21st century from regional climate models (Arctic-CORDEX).” Global and Planetary Change, Vol. 18. https://www.sciencedirect.com/science/article/pii/S0921818119301742
Alloway, T. & Weisenthal, J. 2023. “Here’s Why Insurers Are Leaving Disaster-Prone Places.” Bloomberg UK. https://www.bloomberg.com/news/articles/2023-09-26/transcript-why-insurers-are-pulling-out-of-high-risk-areas
Amadeo, K. 2019. “Hurricane Harvey Facts, Damage and Costs What Made Harvey So Devastating.” Lamar University. https://www.lamar.edu/_files/documents/resilience-recovery/grant/recovery-and-resiliency/hurric2.pdf
Anderson, A. 2024. “What does climate change mean for homeowners’ insurance?’ Greenly. https://greenly.earth/engb/blog/ecology-news/what-does-climate-change-mean-for-homeowners-insurance
Aon. 2024. "Climate and Catastrophe Insight" Aon. https://assets.aon.com/-/media/files/aon/reports/2024/climate-andcatastrophe-insights-report.pdf
Bakkensen, L.A. & Mendelsohn, R.O. 2016. “Risk and adaptation: Evidence from global hurricane damages and fatalities ” Journal of the Association of Environmental and Resource Economists, 3, pp. 555 – 587. https://www.journals.uchicago.edu/doi/10.1086/685908
Balaguru, K., Xu, W., Chang, C.C., et al. 2023. “Increased U.S. coastal hurricane risk under climate change.” Science Advances, 9: 14. https://www.science.org/doi/10.1126/sciadv.adf0259
Bane, B. 2024. “Coastal Hurricanes Around the World are Intensifying Faster.” Pacific Northwest National Laboratory (PNNL). https://www.pnnl.gov/news-media/coastal-hurricanes-around-world-are-intensifying-faster Bassetti, F. 2023. “Insuring against climate change: how companies can improve their risk assessments.” Climate Foresight. https://www.climateforesight.eu/articles/insuring-against-climate-change/
BBC. 2022. “Rivals Biden and DeSantis project unity over Hurricane Ian.” https://www.bbc.co.uk/news/world-us-canada63153031#:~:text=US%20President%20Joe%20Biden%20and,and%20they%20complimented%20each%20other.
Berardelli, J. 2019. “How climate change is making hurricanes more dangerous.” Yale Climate Connections. https://yaleclimateconnections.org/2019/07/how-climate-change-is-making-hurricanes-more-dangerous/
Bhatia, K., Baker, A., Yang, W., et al. 2022. “A potential explanation for the global increase in tropical cyclone rapid intensification.” Nature Communications, 13: 6626. https://www.nature.com/articles/s41467-022-34321-6
Bhatia, K., Vecchi, G., Knutson, T., et al. 2019. “Recent increases in tropical cyclone intensification rates.” Nature Communications, 10:635. https://www.nature.com/articles/s41467-019-08471-z
Blake, S., Landsea, C., Gibney, E. 2011. “The deadliest, costliest, and more intense United States tropical cyclones from 1851 to 2010 (and other frequently requested hurricane facts).” NOAA Technical Memorandum NWS NHC-6. https://repository.library.noaa.gov/view/noaa/6929
Brinkmann, H. 2022. “Colorado's costliest hailstorm caused $2.3 billion in damage.” Updated 2023. Fox Weather. https://www.foxweather.com/weather-news/5-years-ago-denver-hailstorm
Bryan, K. 2024. “Swiss Re says industry failed to estimate impact of extreme weather.” Financial Times. https://www.ft.com/content/48b3e54a-771a-4a12-a412-527c34311ca9
Bucci, L., Alaka, L., Hagen, A., et al. 2022. “Hurricane Ian (AL092022). National Hurricane Center Tropical Cyclone Report.” NOAA. https://www.nhc.noaa.gov/data/tcr/AL092022_Ian.pdf
Byrne, K. 2020 “Forecasters recall the 'phenomenal' intensity of a storm that was overshadowed by Katrina.” AccuWeather. https://www.accuweather.com/en/hurricane/15-years-later-forecasters-recall-the-phenomenal-intensity-of-hurricanewilma/833923
Cambridge Centre for Risk Studies, AXA XL. 2020. “Optimising Disaster Recovery: The Role of Insurance Capital in Improving Economic Resilience.” Cambridge Centre for Risk Studies at the University of Cambridge Judge Business School. https://axaxl.com//media/axaxl/files/optimizing-disaster-recovery.pdf
Carbonaro, G. 2024. “Florida Homeowners Are Relocating in Droves Over Insurance Crisis.” Newsweek. https://www.newsweek.com/florida-homeowners-relocating-insurance-crisis-cost-1893248
Center for Climate and Energy Solutions (C2ES). 2024. “Hurricanes and Climate Change.” https://www.c2es.org/content/hurricanes-and-climate-change/
Center for Insurance Policy and Research (CIPR) & National Association of Insurance Commissioners (NAIC). 2021. “Extreme Weather and Property Insurance: Consumer Views.” CIPR. https://content.naic.org/sites/default/files/CIPR%20Consumer%20property%20ins%20report%208-21_0.pdf
Copyright
Chand, S., Walsh, K., Camargo, S., et al. 2022. “Declining tropical cyclone frequency under global warming.” Nature Climate Change, 12: 655-661. https://www.nature.com/articles/s41558-022-01388-4
Chaplin, R., Pahuja, M. & Ryan, F. 2023. “Climate Change and Its Undeniable Impact on Insurance: How to Respond?’ https://www.skadden.com/insights/publications/2023/12/2024-insights/corporate-trends/climate-change-and-its-undeniableimpact
Chen, J. 2013. Voter partisanship and the effect of distributive spending on political participation. American Journal of Political Science, 57, 200–217. https://onlinelibrary.wiley.com/doi/abs/10.1111/j.1540-5907.2012.00613.x
Citizens. 2020. “Press release: Citizens Updates Hurricane Ian Estimates”. https://www.citizensfla.com/-/20221115-citizensupdates-hurricane-ian-estimates
Climate Signals 2024. “Hurricanes.” https://www.climatesignals.org/pillars/climate-change-hurricanes
Climate Signals 2024. “Tropical Cyclone Steering Change.” https://www.climatesignals.org/climate-signals/tropical-cyclonesteering-change#more
Cohn, S. “Insurance crisis that started in Florida, California is spreading. Your state could be next.” CNBC. https://www.cnbc.com/2024/07/02/florida-california-insurance-crisis-spreading-your-state-next.html
Colbert, A. 2022. “A Force of Nature: Hurricanes in a Changing Climate.” NASA. https://science.nasa.gov/earth/climate-change/aforce-of-nature-hurricanes-in-a-changing-climate/
Collinson, S. 2022. “Politics of rebuilding intensify as Florida’s devastation is laid bare.” CNN https://edition.cnn.com/2022/10/03/politics/hurricane-ian-florida-rebuilding-politics-analysis/index.html
Colón, F., Christianson, A., Childs, C. 2022. “How the Inflation Reduction Act Will Drive Global Climate Action.” Centre for American Progress (CAP). https://www.americanprogress.org/article/how-the-inflation-reduction-act-will-drive-global-climate-action/ Congressional Budget Office. 2022. “FEMA’s Disaster Relief Fund: Budgetary History and Projections.” https://www.cbo.gov/publication/58840
Cooper, C. 2022 “Florida Insurance Reform Law SB-2D Approved.” Chartwell Law. https://www.chartwelllaw.com/resources/florida-insurance-reform-law-sb-2d-approved CoreLogic. 2022. “CoreLogic Analysis Shows Final Estimated Insured and Uninsured Damages for Hurricane Ian to be Between $41 Billion and $70 Billion.” Core Logic. https://www.corelogic.com/press-releases/corelogic-analysis-shows-final-estimated-insuredand-uninsured-damages-for-hurricane-ian-to-be-between-41-billion-and-70-billion/
Coumou, D., Lehmann, J. & Beckmann, J. 2015. “The weakening summer circulation in the Northern Hemisphere mid-latitudes.” https://www.science.org/doi/10.1126/science.1261768
Curry, T. 2004. “In election year, hurricanes, too, are political.” NBC News. https://www.nbcnews.com/id/wbna5716031
Davlasheridze, M., Fisher-Vanden, K., Klaiber, H. A. 2017. “The effects of adaptation measures on hurricane induced property losses: Which FEMA investments have the highest returns?” Journal of Environmental Economics and Management, 81: 93 – 114. https://www.sciencedirect.com/science/article/abs/pii/S0095069616302923?via%3Dihub
Deventer, C. & Cornelius, N. 2023. “Can lawmakers save the collapsing Florida home insurance market?’ Bankrate. https://www.bankrate.com/insurance/homeowners-insurance/florida-homeowners-insurance-crisis/ Dimock, M., Kiley, J., Keeter, S., et al. 2014 “Political Polarization in the American Public.” Pew Research Center. https://www.pewresearch.org/politics/2014/06/12/political-polarization-in-the-american-public/ Eaglesham, J 2023. “Home Insurers Are Charging More and Insuring Less.” https://www.wsj.com/economy/housing/home-insurersare-charging-more-and-insuring-less-9e948113
The Economist. 2023. “Parts of America are becoming uninsurable.” https://www.economist.com/united-states/2023/09/21/partsof-america-are-becoming-uninsurable
Edinger, M. 2024. “Florida home insurance crisis persists with soaring premiums ” Fox 35 https://www.fox35orlando.com/news/florida-home-insurance-crisis-persists-soaring-premiums Ehrlich, G. 2023. ‘Building Codes, Results- Florida.” National Association of Home Builders (NAHB). https://www.nahb.org/advocacy/top-priorities/building-codes/construction-codes-standards-research/damage-assessment-fromhurricanes-harvey-and-irma/results-florida
Emanuel, K. 2024. “Cyclone Jasper’s rains in the context of climate change.” PNAS. https://www.pnas.org/doi/epdf/10.1073/pnas.2400292121
Emanuel, K. 2023 “Physically Based Weather Hazard Modelling: Accounting for Climate Change.” Journal of Catastrophe Risk and Resilience. https://journalofcrr.com/physically-based-weather-hazard-modelling-accounting-for-climate-change/ Emanuel, K. 2020. “Response of Global Tropical Cyclone Activity to Increasing CO2: Results from Downscaling CMIP6 Models.” https://journals.ametsoc.org/view/journals/clim/34/1/jcliD200367.xml
Copyright
Entress, R., Stevens, K. 2023. “Public values failure associated with Hurricane Ian power outages.” Frontiers in Sustainable Energy Policy, Perspective Article. https://www.frontiersin.org/journals/sustainable-energypolicy/articles/10.3389/fsuep.2023.1304673/full
Environmental Defense Fund. 2024. “How climate change makes hurricanes more destructive.” https://www.edf.org/climate/howclimate-change-makes-hurricanes-more-destructive
England, J. 2024. “California Screaming: The Future of Insurance in the Golden State.” Insurtech Insights. https://www.insurtechinsights.com/california-screaming-the-future-of-insurance-in-the-golden-state/
Evans, S. 2022. “Florida bills propose more state-backed reinsurance, no one-way attorney fees, no AOB.” Artemis. https://www.artemis.bm/news/florida-bills-propose-more-state-backed-reinsurance-no-one-way-attorney-fees-no-aob/
FEMA. 2023. “Nearly $4 Billion in Flood Insurance Payments Reach Policyholders After Hurricane Ian.” FEMA Release 069 https://www.fema.gov/press-release/20230504/nearly-4-billion-flood-insurance-payments-reach-policyholders-after
FEMA. 2023. “Mitigation Assessment Team Report: Hurricane Ian in Florida Building Performance Observations, Recommendations, and Technical Guidance.’ FEMA P-23420 https://www.fema.gov/sites/default/files/documents/fema_rm-hurriance-ian-mat-report12-2023.pdf
FEMA. 2023. “Hurricane Ian in Florida Mitigation Assessment Team Report FEMA P2342.” FEMA. https://www.fema.gov/sites/default/files/documents/fema_rm-hurriance-ian-mat-report-12-2023.pdf
FEMA. 2005. “USA national situation update: 22 Oct 2005.” https://reliefweb.int/report/united-states-america/usa-nationalsituation-update-22-oct-2005
Fenske, T. 2022. “Calling on the Legislature to hold a special session regarding property insurance.” Florida Government. https://www.flgov.com/2022/04/26/calling-on-the-legislature-to-hold-a-special-session-regarding-property-insurance/
Fecht, S. “Should Coastal Communities Rebuild or Retreat After Hurricane Ian?’ Columbia Climate School 2022. https://news.climate.columbia.edu/2022/10/07/should-coastal-communities-rebuild-or-retreat-after-hurricane-ian/
Fippinger, K. 2024. “Hurricane Ian in Florida: A Mitigation Success Story for Building Codes.” Building Safety Journal. International Code Council (ICC). https://www.iccsafe.org/building-safety-journal/bsj-technical/hurricane-ian-in-florida-a-mitigation-successstory-for-building-codes/
Flavelle, C., Cowan, J., Penn, I. 2023. “State Farm Stops Offering Insurance in California.” The New York Times. https://www.nytimes.com/2023/05/31/climate/climate-change-insurance-wildfires-california.html
Follick, J. 2005. “Governor encourages evacuations for Wilma.” The Gainesville Sun. https://eu.gainesville.com/story/news/2005/10/24/governor-encourages-evacuations-for/31462804007/
Frank, T. 2023. “Depleted' by Ian, Fla. state insurer faces $14B shortfall ClimateWire. https://subscriber.politicopro.com/article/eenews/2023/03/21/depleted-by-ian-fla-state-insurer-faces-14b-shortfall-00087949
Garner, A. 2023. “Observed increases in North Atlantic tropical cyclone peak intensification rates.” Scientific Reports, 13: 16299. https://www.nature.com/articles/s41598-023-42669-y
Geffner, M. 2019. “Rebuilding After a Disaster: What You Should Expect.” NewHomeSource. https://www.newhomesource.com/learn/what-to-expect-when-rebuilding-from-natural-disaster/ Geiger, T., Frieler, K., Levermann, A. 2016. “High-income does not protect against hurricane losses.” Environmental Research Letters 11 (8): pp. 1 – 10. https://publications.pik-potsdam.de/rest/items/item_21026_4/component/file_21027/content
GIanmarco, I., Newby, E., Pogorzelski, W. et al. 2023. ‘Observations of Building Performance in Southwest Florida During Hurricane Ian (2022): Part II: Performance of the Modern Florida Building Code.” Insurance Institute for Business & Home Safety (IBHS). https://ibhs1.wpenginepowered.com/wp-content/uploads/HurricaneIan_PartII_FBC.pdf
Gori, A., Lin, N., Xi, D., et al. 2022 “Tropical cyclone climatology change greatly exacerbates US extreme rainfall–surge hazard.” Nature Climate Change, 12: 171-178. https://www.nature.com/articles/s41558-021-01272-7
The Guardian Associated Press. 2024. “Caribbean prepares as Hurricane Beryl becomes earliest category 4 on record.” The Guardian. https://www.theguardian.com/world/article/2024/jun/30/hurricane-beryl-earliest-category-4-on-record
Gutterman, I. 2023. ‘Will the FHCF survive 2023?’ The Insurer. https://www.theinsurer.com/viewpoint/will-the-fhcf-survive-2023/ Hall, T. & Kossin, J. 2019. “Hurricane stalling along the North American coast and implications for rainfall.” NPJ Climate and Atmospheric Science, 2: 17. https://www.nature.com/articles/s41612-019-0074-8
Hallam, S., McCarthy, G., Feng, X., et al. 2022. “The relationship between sea surface temperature anomalies, wind and translation speed and North Atlantic tropical cyclone rainfall over ocean and land.” Environmental Research Communications, 5: 025007. https://iopscience.iop.org/article/10.1088/2515-7620/acb31c
Hamid, S. 2022. “The big reason Florida insurance companies are failing isn’t just hurricane risk – it’s fraud and lawsuits.” FIU News. https://news.fiu.edu/2022/the-big-reason-florida-insurance-companies-are-failing-isnt-just-hurricane-risk-its-fraud-and-lawsuits
Copyright
Healy, A., Malhotra, N. (2009). “Myopic voters and natural disaster policy.” American Political Science Review, 103(3), 387–406. https://www.cambridge.org/core/journals/american-political-science-review/article/abs/myopic-voters-and-natural-disasterpolicy/039708A3223EC114365ADF56F1D26423
Helmore, E. 2023. “DeSantis snubs Biden as president tours Hurricane Idalia damage in Florida.” The Guardian. https://www.theguardian.com/us-news/2023/sep/02/ron-desantis-snubs-joe-biden-hurricane-idalia
Helmore, E. 2022. “Hurricane Ian: Americans urged to weigh risks of rebuilding in vulnerable areas.” The Guardian. https://www.theguardian.com/us-news/2022/oct/02/hurricane-ian-risks-rebuilding-vulnerable-areas
Herring, J. 2022. “Massive June 2020 hailstorm left lasting scars for Calgarians, study finds.” Calgary Herald. https://calgaryherald.com/news/local-news/massive-june-2020-hailstorm-left-lasting-scars-for-calgarians-study-finds
Hill, A. 2023. “Climate Change and U.S. Property Insurance: A Stormy Mix.” Council on Foreign Relations. https://www.cfr.org/article/climate-change-and-us-property-insurance-stormy-mix
Hornstein, T. 2024. “Insurance crisis in Florida, across the nation, gets national spotlight.” CBS Miami. https://www.cbsnews.com/miami/news/insurance-crisis-in-florida-across-the-nation-gets-national-spotlight/
Hulse, C. & Wald, M. 2004. “Hurricane Charley: The President; President’s Response to Hurricane Carries Reminders of Political Fallout for Past Candidates.” The New York Times. https://www.nytimes.com/2004/08/15/us/hurricane-charley-presidentpresident-s-response-hurricane-carries-reminders.html
Insurance Information Institute (III). 2024. “Hurricane’ in A Firm Foundation: How Insurance Supports the Economy. https://www.iii.org/publications/a-firm-foundation-how-insurance-supports-the-economy/supporting-resiliency-and-disasterrecovery/hurricanes
Intergovernmental Panel on Climate Change (IPCC). 2021. “Climate Change 2021: The Physical Science Basis.” https://www.ipcc.ch/report/sixth-assessment-report-working-group-i/
Israel, J. & Mehta, A. 2011. “As FEMA funds run out, senators from states with most disasters oppose funding bill.” The Center of Public Integrity. https://publicintegrity.org/politics/as-fema-funds-run-out-senators-from-states-with-most-disasters-opposefunding-bill/
James, J. 2006. “Bush finishing second term on positive note.” St. Petersburg Times. https://www.newspapers.com/article/thenaples-daily-news-bush-finishing-sec/130984147/
Junge, M. 2023. “After Ian: Swiss Re models show population growth is driving a hurricane loss risk imbalance.” Swiss Re. https://www.swissre.com/risk-knowledge/mitigating-climate-risk/after-hurricane-ian.html
Kaufman, L. 2024. “Florida’s Home Insurance Industry May Be Worse Than Anyone Realizes.” Bloomberg. https://www.bloomberg.com/news/features/2024-04-24/home-insurance-with-lax-oversight-hides-florida-climate-risk
Karimiziarani, M., Moradkhani, M. 2023 “Social response and Disaster management: Insights from twitter data Assimilation on Hurricane Ian.” International Journal of Disaster Risk Reduction, 95: 103865. https://www.sciencedirect.com/science/article/pii/S221242092300345X?ssrnid=4292734&dgcid=SSRN_redirect_SD
Kossin, J., Knapp, K., Olander, T., et al. 2019 “Global increase in major tropical cyclone exceedance probability over the past four decades.” PNAS, 117(22): 11975-11980. https://www.pnas.org/doi/10.1073/pnas.1920849117
Kossin, J. 2018. “A global slowdown of tropical-cyclone translation speed.” Nature, 558: 104-107 https://www.nature.com/articles/s41586-018-0158-3
Knutson, T. 2024. “Global Warming and Hurricanes.” Geophysical Fluid Dynamics Laboratory (GFDL). https://www.gfdl.noaa.gov/global-warming-and-hurricanes/
Knutson, T., Camargo, S., Chan, J., et al. 2020 “Tropical Cyclones and Climate Change Assessment Part II: Projected Response to Anthropogenic Warming.” Bulletin of the American Meteorological Society, 101, E303–E322 https://journals.ametsoc.org/view/journals/bams/101/3/bams-d-18-0194.1.xml
Kuhns, A., Ott, A. 2022. “Can The Florida Homeowners Insurance Market Crisis Be Fixed?” Davies Foundation. https://daviesgroup.com/northamerica/knowledge/can-the-florida-homeowners-insurance-market-crisis-be-fixed/ Landea, C. 2022. “The revised Atlantic hurricane database (HURDAT2).” https://www.nhc.noaa.gov/data/hurdat/hurdat2-format-atl1851-2021.pdf
Lee, M., Swartz, K. 2022. “4 things holding back restoration of Florida’s electric grid.” Politico. https://www.politico.com/news/2022/09/30/florida-power-grid-hurricane-00059859
Leefeldt, E. 2023. “Why Is Homeowners Insurance in Florida Such a Disaster?” Forbes. https://www.forbes.com/advisor/homeowners-insurance/why-is-homeowners-insurance-in-florida-such-a-disaster/ Lewis, M. 2021. “Florida’s governor just locked ‘Florida into a dirty fossil fuel future’.” Electrek. https://electrek.co/2021/06/23/florida-governor-bill-thfossil-fuels/
Copyright
Lewis, R. 2006. “Florida Citizens Shocked by Shifting Insurance Market.” NPR. https://www.wmra.org/2006-06-01/florida-citizensshocked-by-shifting-insurance-market
Li, L. & Chakraborty, P. 2024. “Slower decay of landfalling hurricanes in a warming world.” Nature 587: 230-234. https://www.nature.com/articles/s41586-020-2867-7
Lindsey, R. 2022. “Climate Change: Global Sea Level.” NOAA. https://www.climate.gov/news-features/understandingclimate/climate-change-global-sea-level
Lloyd’s. 2007. “The Herbert Hoover Dike: A Discussion of the Vulnerability of Lake Okeechobee to Levee Failure: Cause, Effect and the Future.” Risks Lloyd’s Emerging Risks Team Report. https://assets.lloyds.com/media/528d8f9c-c805-4b60-a592847b44201bd3/Lake_Okeechobee_Report.pdf
Logan, R. 2022. “Florida Building Code Changes.” AIA Florida Summer Series Webinar. https://www.aiafla.org/upload_documents/Material-ChangetoFBC-Final-2.pdf
Louie, D. 2020. “Damage from California's wildfires estimated at $10 billion, experts say.” ABC News. https://abc7news.com/california-wildfires-cost-of-cal-fire-stanford-wildfire-research/6897462/
Mac, R. 2023.’ Allstate Is No Longer Offering New Policies in California.” The New York Times. https://www.nytimes.com/2023/06/04/business/allstate-insurance-california.html
Mann, R. 2023. “2017 U.S. Midwest hailstorm caused $2.5bn in damages in Minnesota.” The Weather Network. https://www.theweathernetwork.com/en/news/weather/severe/this-day-in-weather-history-june-11-2017-us-midwest-hail-storm MAPFRE. 2023. “How would just one degree of temperature rise affect our planet?” MAPFRE. https://www.mapfre.com/en/insights/sustainability/rising-temperatures-planet-climate-change
Marra Cox, A. 2004. “Charley victim gets check from FEMA for only $1.69.” https://www.tampabay.com/news/floridapolitics/2024/06/05/floridas-insurance-crisis-goes-washington/
Martin, S. 2024. “Florida remains hot housing destination despite home insurance crisis.” Bankrate. https://www.bankrate.com/insurance/homeowners-insurance/florida-housing-market-insurance-challenges/#the-cost-of-living-inflorida
Martinez, A. 2020. “Forecast accuracy matters for hurricane damages.” Econometrics 8 (2). https://www.inet.ox.ac.uk/publications/forecast-accuracy-matters-for-hurricane-damage
Martinez, A. (2017). “How quickly can we adapt to change? An assessment of hurricane damage mitigation efforts using forecast uncertainty.” Oxford Department of Economics Discussion Papers 831. https://ora.ox.ac.uk/objects/uuid:2e1a30b2-15f5-4e28b064-26df29c38842
Maynard, T., Smith, N., Gonzalez, S. 2013. “Wildfire: a burning issue for insurers?” Lloyd’s Emerging Risks Team report. https://www.lloyds.com/news-and-insights/risk-reports/library/wildfire-a-burning-issue-for-insurers
Met Office. 2024. “Past and future sea level rise.” https://www.metoffice.gov.uk/weather/climate-change/organisations-andreports/past-and-future-sea-level-rise
Milman, O. 2022. “Extreme rainfall from Hurricane Ian worsened by climate breakdown – study.” The Guardian. https://www.theguardian.com/environment/2022/sep/30/climate-crisis-hurricane-ian-extreme-rainfall
Montanaro, D. 2022. “How local and national leaders are tested by major natural disasters.” Ocala StarBanner. https://eu.ocala.com/story/news/2004/08/29/charley-victim-gets-check-from-fema-for-only-169/31317377007/
Mower, L. 2024. “Florida’s insurance crisis goes to Washington.” Tampa Bay Times. https://www.tampabay.com/news/floridapolitics/2024/06/05/floridas-insurance-crisis-goes-washington/
Murakami, M., Levin, E., Delworth, T. 2018. “Dominant effect of relative tropical Atlantic warming on major hurricane occurrence.” Science, 362: 794-799. https://www.science.org/doi/10.1126/science.aat6711
Murrin, M. 2023. “Part I: The Shift in Florida Insurance Litigation with the End of One-Way Attorneys’ Fees.” Jimerson Birr https://www.jimersonfirm.com/blog/2023/09/part-i-the-shift-in-florida-insurance-litigation-with-the-end-of-one-way-attorneysfees
Nagchoudhary, S. 2020. “Cyclone Amphan loss estimated at $13 billion in India, may rise in Bangladesh.” Reuters. https://www.reuters.com/article/world/cyclone-amphan-loss-estimated-at-13-billion-in-india-may-rise-in-bangladeshidUSKBN22Z0G2
NAHB. 2019. “Damage Assessment from Hurricanes Harvey and Irma- Summary Report.” https://www.nahb.org//media/NAHB/advocacy/docs/top-priorities/codes/codes-and-research/damage-assessment-hurricanes-harvey-irma-2019.pdf NASA. 2024. “Understanding Sea level: Thermal expansion.” https://sealevel.nasa.gov/understanding-sea-level/global-sealevel/thermal-expansion/
NASA. 2024. “Understanding climate: Air & Water.” https://sealevel.jpl.nasa.gov/ocean-observation/understanding-climate/air-andwater/
Copyright
NASA. 2022. “Steamy Relationships: How Atmospheric Water Vapor Amplifies Earth’s Greenhouse Effect.” https://science.nasa.gov/earth/climate-change/steamy-relationships-how-atmospheric-water-vapor-amplifies-earths-greenhouseeffect/
NASA Earth Observatory. 2024. “A Devastating Stall by Hurricane Dorian.” https://earthobservatory.nasa.gov/images/145559/adevastating-stall-by-hurricane-dorian
National Association of Insurance Commissioners (NAIC). 2021. “Extreme Weather and Property Insurance: Consumer Views.” https://content.naic.org/sites/default/files/CIPR%20Consumer%20property%20ins%20report%208-21_0.pdf
NBC News. 2005. “Jeb Bush accepts blame for slow aid efforts.” https://www.nbcnews.com/id/wbna9823799
Nicol, R. 2023. “Officials, stakeholders celebrate completion of Herbert Hoover dike renovations.” Florida Politics. https://floridapolitics.com/archives/583962-officials-stakeholders-celebrate-completion-of-herbert-hoover-dike-renovations/ Nixon-Jones, L. 2024. “How Florida’s home insurance market became so dysfunctional, so fast.” The Conversation. https://www.wlrn.org/business/2024-03-11/florida-home-insurance-market-hurricanes-litigation
Pacific Northwest National Laboratory (PNNL). 2024. “Coastal Hurricanes Around the World are Intensifying Faster.” https://www.pnnl.gov/news-media/coastal-hurricanes-around-world-are-intensifying-faster
Pasch, R., Blake, E., Cobb, D., et al. 2006. “Tropical Cyclone Report Hurricane Wilma 15-25 October 2005.” NOAA. https://www.nhc.noaa.gov/data/tcr/AL252005_Wilma.pdf
Pielke, R. A., Gratz, J., Landsea, C. W., et al. 2008. “Normalized hurricane damage in the United States: 1900 – 2005.” Natural Hazards Review 9 (1): 29 – 42. https://www.tropicalstormrisk.com/docs/NormalizedHurricane2008.pdf
Porter, J. & Freeman, N. 2018. “Hurricane Florence: Sea Level Rise, Storm Surge and Damage.” First Street. https://firststreet.org/research-library/-hurricane-florence-sea-level-rise-storm-surge-and-damage
Poynting, M. 2024. “How record-breaking Hurricane Beryl is a sign of a warming world.” BBC. https://www.bbc.co.uk/news/articles/c9r3g572lrno
President Office. 2024. “Senate Moves Slate of Bills to Reduce Property Insurance Costs.” The Florida Senate. https://www.flsenate.gov/Media/PressRelease/Show/4543
Puleo, M. 2021. “2021 wildfire season: AccuWeather estimates $70 billion to $90 billion in damages.” AccuWeather. https://www.accuweather.com/en/severe-weather/2021-wildfire-season-economic-damages-estimate-70-billion-to-90billion/1024414
Rabb, W. 2023. “Only 3 Insurers Sign Up for Florida Re Plan and Hopes for a New Plan Are Fading Fast.” Insurance Journal. https://www.insurancejournal.com/news/southeast/2023/04/19/717140.htm
Rabb, W. 2022. “Florida Senate Committee Passes Reform Bill; Would Make Citizens ‘Noncompetitive’.” Insurance Journal. https://www.insurancejournal.com/news/southeast/2022/12/13/699191.html
Raymond James. 2023. “Report Prepared for the Florida Hurricane Catastrophe Fund: claims paying capacity estimates.” Raymond James. https://fhcf.sbafla.com/media/uqwdz4rs/fhcf-may-2023-bonding-capacity-report.pdf
Reed, K., Stansfield, A., Wehner, M., et al. 2020. “Forecasted attribution of the human influence on Hurricane Florence.” Science Advances, 6:1. https://www.science.org/doi/10.1126/sciadv.aaw9253
Reed, K., Wehner, M. 2023. “Real-time attribution of the influence of climate change on extreme weather events: a storyline case study of Hurricane Ian rainfall ” Environmental Research Climate. 2: 043001 https://iopscience.iop.org/article/10.1088/27525295/acfd4e
Reeves, A. 2004. “The Politics of Disaster.” Harvard Magazine. https://www.harvardmagazine.com/2004/03/the-politics-of-disasterhtml
Reuters. 2022. “Over 391,000 still without power in Florida after Hurricane Ian.” Reuters. https://www.reuters.com/world/us/overmillion-customers-without-power-florida-hurricane-ian-2022-09-28/
Roach, J. 2020. “Australia wildfire damages and losses to exceed $100 billion, AccuWeather estimates.” AccuWeather. https://www.accuweather.com/en/business/australia-wildfire-economic-damages-and-losses-to-reach-110-billion/657235
Rohrer, G. 2022. “Lawmakers plan $1B for reinsurance to stabilize property insurance industry”. Florida Politics. https://floridapolitics.com/archives/575542-lawmakers-plan-1b-for-reinsurance-to-stabilize-property-insurance-industry/
Rosanes, M. 2023. “What is a Florida reinsurance all about?" Insurance Business. https://www.insurancebusinessmag.com/us/guides/what-is-a-florida-reinsurance-all-about-451039.aspx
Rosanes, M. 2023. “Why Florida insurance rates are going up.” Insurance Business. https://www.insurancebusinessmag.com/us/guides/why-florida-insurance-rates-are-going-up-450869.aspx
Royal Meteorological Society (RMETS). 2020. “What is a hurricane?” https://www.rmets.org/metmatters/what-hurricane
Copyright
Rukovets, O. 2022. “Hurricane Ian’s Aftermath: A Rising Death Toll and Questions About Preparedness.” Columbia Climate School. https://news.climate.columbia.edu/2022/10/05/hurricane-ian-preparedness/ SBA Florida. 2024. “Florida Optional Reinsurance Assistance (FORA) Program.” SBA Florida. https://www.sbafla.com/about-thesba/sba-additional-programs/florida-optional-reinsurance-assistance
Schneider, B. 2004. “The politics of Hurricane Charley.” CNN. https://edition.cnn.com/2004/ALLPOLITICS/08/13/politics.of.charley/index.html
Sczesny, M. 2023. “6 new insurance companies approved in Florida as state looks to reduce Citizens Insurance policies.” West Palm Beach WPTV https://www.wptv.com/money/real-estate-news/6-new-insurance-companies-approved-in-florida-as-state-looks-toreduce-citizens-insurance-policies
Sebastian, A., Bader, D., Nederhoff, C., et al. 2021 “Hindcast of pluvial, fluvial, and coastal flood damage in Houston, Texas during Hurricane Harvey (2017) using SFINCS.” Natural Hazards. 109: 2343–62. https://link.springer.com/article/10.1007/s11069-02104922-3
Seneviratne, S.I., Zhang, X., Adnan, M., et al. 2021 “Weather and Climate Extreme Events in a Changing Climate” in Climate Change 2021: The Physical Science Basis. Contribution of Working Group I to the Sixth Assessment Report of the Intergovernmental Panel on Climate Change Cambridge University Press, pp. 1513–1766 https://www.ipcc.ch/report/ar6/wg1/downloads/report/IPCC_AR6_WGI_Chapter11.pdf
Smith, A. 2023. “2022 U.S. billion-dollar weather and climate disasters in historical context.” NOAA Climate. https://www.climate.gov/news-features/blogs/beyond-data/2022-us-billion-dollar-weather-and-climate-disasters-historical
Smith, A. 2024. 2023 “A historic year of U.S. billion-dollar weather and climate disasters.” NOAA Climate.gov https://www.climate.gov/news-features/blogs/beyond-data/2023-historic-year-us-billion-dollar-weather-and-climate-disasters
Smith, I., Mooney, A., Williams, A. 2024. “The Uninsurable World: What Climate Change Is Costing Homeowners.” Financial Times. https://www.ft.com/content/ed3a1bb9-e329-4e18-89de-9db90eaadc0b
Smith, I. & Bryan, K. 2024. “The uninsurable world: how the insurance industry fell behind on climate change.” Financial Times. https://www.ft.com/content/b4bf187a-1040-4a28-9f9e-fa8c4603ed1b
Solomon, S. 2024. “New Zealand faces ‘long shadow’ of Cyclone Gabrielle one year on from disaster.” The Guardian. https://www.theguardian.com/world/2024/feb/10/new-zealand-faces-long-shadow-of-cyclone-gabrielle-one-year-on-fromdisaster
Stendel, M., Francis, J., White, R., et al. 2021. “The jet stream and climate change ” Climate Change (Third Edition): Observed Impacts on Planet Earth. https://www.sciencedirect.com/science/article/pii/B9780128215753000153?via%3Dihub
Theodorou, J. 2024. “Florida insurance market on the mend.” The Insurer. https://www.theinsurer.com/viewpoint/florida-insurancemarket-on-the-mend/
Tillmann, K. & Amin, S. 2024. “Consumers Worried about Impact of Extreme Weather on Homes and Insurance Premiums.” Fannie Mae. https://www.fanniemae.com/research-and-insights/perspectives/consumers-worried-about-impact-extreme-weatherhomes-and-insurance-premiums
Tomazin, F. 2022. “Biden and DeSantis strike a ceasefire after Hurricane Ian.” Syndey Morning Herald. https://www.smh.com.au/world/north-america/biden-and-desantis-strike-a-ceasefire-after-hurricane-ian-20221001-p5bmh0.html
UCL. 2020. “Full cost of California’s wildfires to the US revealed.” UCL News. https://www.ucl.ac.uk/news/2020/dec/full-costcalifornias-wildfires-us-revealed
FEMA. 2023. “FEMA Hazard Mitigation Assistance Programme and Policy Guide.” FEMA. https://www.fema.gov/grants/mitigation/hazard-mitigation-assistance-guidance
Vazquez, M. & Judd, D. 2022. “Biden signs Inflation Reduction Act into law.” CNN Politics. https://edition.cnn.com/2022/08/16/politics/biden-inflation-reduction-act-signing/index.html
Walsh, K. 2015. “The Undoing of George W. Bush. U.S. News.” https://www.usnews.com/news/thereport/articles/2015/08/28/hurricane-katrina-was-the-beginning-of-the-end-for-george-w-bush
Wehner, M. & Kossin, J. 2024. “The growing inadequacy of an open-ended Saffir–Simpson hurricane wind scale in a warming world.” Proceedings of the National Academy of Sciences, 121(7): e2308901121. https://www.pnas.org/doi/full/10.1073/pnas.2308901121
Weinkle, J., Landsea, C., Collins, D., et al. 2018. “Normalized hurricane damages in the continental United States, 1900 – 2017.” Nature Sustainability 1 (12): 808 – 813. https://www.nature.com/articles/s41893-018-0165-2
Wikipedia. 2023. “Pacific typhoon season.” https://en.wikipedia.org/wiki/Pacific_typhoon_season
Wikipedia. 20204. “2020 California wildfires.” Wikipedia. https://en.wikipedia.org/wiki/2020_California_wildfires
Yamaguchi, M., Chan, J., Moon, I., et al. 2020. “Global warming changes tropical cyclone translation speed.” Nature Communications, 11: 47 https://www.nature.com/articles/s41467-019-13902-y
Copyright
Young, R. 2022. “To Save America’s Coasts, Don’t Always Rebuild Them.” New York Times guest essay. https://www.nytimes.com/2022/10/04/opinion/hurricane-ian-coast-rebuilding.html
Zhang, G., Murakami, H., Knutson, T., et al. 2020. “Tropical cyclone motion in a changing climate.” Science Advances, 6(17) https://www.science.org/doi/10.1126/sciadv.aaz7610
Copyright
Cambridge Centre for Risk Studies
Acknowledgements
Cambridge Centre for Risk Studies gratefully acknowledges AXA XL for supporting the research efforts summarised in this report. The Centre is grateful for the expertise provided by our research team, collaborators and subject matter specialists.
Cambridge Centre for Risk Studies Research Team
Professor Daniel Ralph, Academic Director
Dr Michelle Tuveson, Chairman & Executive Director
Dr Trevor Maynard, Vice Chair & Director of Systemic Risk
Jayne Tooke, Communications Assistant
Taha Tariq, Geopolitical Risk Research Lead
Dr María Fernanda Lammoglia Cobo, Research Associate
Steve Enyegue, Research Assistant
Dr Kevin Tang, Research Associate
Cambridge Centre for Risk Studies
Cambridge Judge Business School University of Cambridge Trumpington Street Cambridge, CB2 1AG United Kingdom enquiries.risk@jbs.cam.ac.uk Website and Research Platform www.jbs.cam.ac.uk/faculty-research/centres/risk