2 minute read
MAPPED OUT


A new spatial mapping system in the Mossman District is a one-stop decision support tool for growers.
The spatial maps on Mossman Agricultural Services’ website tell a story. Multiple datasets have been used to develop the decision-making support tools. Information on everything from pest and disease risks to productivity and even block cut dates are available to growers at the click of a button.
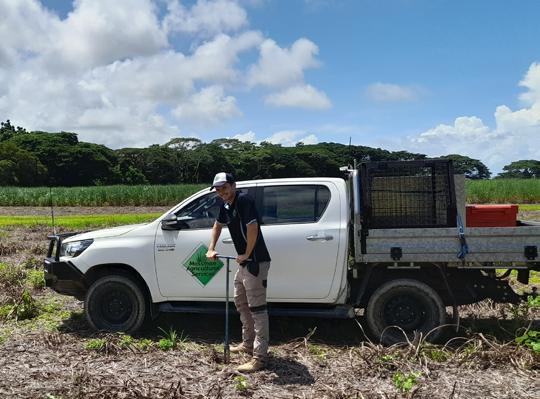
Created by Extension Agronomist Simon Engdahl, the spatial maps are based on Mossman Mill’s grower shapefiles, which have been edited using QGIS and collated with block and varietal specific data from various Microsoft Excel files. Simon has written all the code for the program using R, a programming language for statistical computing and graphics. The result is a data-rich farm management tool.
“It initially started as a soil map – as a graduate just over a year ago, I just wanted to look at the different soil types,” Simon said. “Then I found you can just keep adding other things. It was originally an agronomist’s tool but has been quickly adapted for growers to access too.”
Eight growers have so far had free custom maps made up since the program was made available in January 2023.
The overlays include soil types, varieties, crop classes and much more. Growers can view their pachymetra results from each block over the past decade, along with resistance for yellow spot and smut and blocks with RSD or grub damage. Nutrient Management Plans (NMPs) are available for each block, along with productivity reports from the past two seasons.
Some information is for owners of each farm only, while some overlays can be viewed by all.
“We have permission from all the growers to be able to see each other’s farms,” Simon said. “They’re happy to share. They can see what other people are doing, for instance if another grower has a variety they might be interested in or where the smut susceptible areas are.”
Any Excel data you have can be mapped spatially
“We’ve mapped early, mid and late sugar varieties and growers can see when a block was cut so they can plan their harvest rotations.”
A search function adds to the userfriendliness of the site. Unlike many of its competitors, the software is free, with Mossman Agricultural Services spending just a few hundred dollars on website hosting.