CarilionClinic.org/community-health-assessments
Executive Summary
Carilion Clinic is committed to joining with our partners to pursue the essential work of improving and maintaining the health of the New River Valley in accordance with our mission. Periodically assessing the health concerns of each community is a key component of addressing needs Every three years, the New River Valley Community Health Assessment (NRVCHA) aims to uncover issues, indicate where improvement is needed and track and promote progress in key areas so that there is demonstrated, ongoing change. The CHA process and the public availability of its findings enable and empower our community to effectively improve and maintain health.
Carilion, the New River Health District (NRHD) and the Community Health Center of the New River Valley (CHCNRV) partnered with existing community networks/coalitions to conduct the 2024 NRVCHA, forming the Community Health Assessment Team (CHAT) After review and discussion of the data collected, the 2024 NRVCHA led the CHAT to identify seven priority health issues in the community.
Community Health Improvement Process
Carilion believes in continuous quality improvement. The triennial CHA serves as a formal way of identifying community needs and developing plans to address them. It shapes the ways we support our mission in the community and encourages collaboration and alignment with clinical teams Not only does this process identify current needs and disparities, but also helps to ensure we are regularly evaluating and shifting to meet emerging needs

Priority Health Needs
In collaboration with the CHAT, we identify key health needs to align resources and other efforts for the following three years. The CHAT reviews extensive data, asks questions and participates in a consensus-building prioritization process. The 2024 NRVCHA resulted in the following health priorities:


Drivers of Priority Health Needs
The CHA process focused on prioritizing health conditions and outcomes, rather than a broader focus on their root causes. We recognize that access to healthcare and other services and the social determinants of health (SDOH) are key facilitators of good health and well-being. As such, we are focused on those and other health factors as a strategic component of action planning. The key drivers of each priority health condition, as identified by the CHAT, are discussed in the corresponding sections of this report.
Board Adoption
This document was approved by the Carilion New River Valley Medical Center (CNRV) Board of Directors on July 23, 2024, and formally adopted as the 2024 New River Valley Community Health Assessment.
Disclaimers
This document has been produced to benefit the community. Carilion encourages the use of this report for planning purposes and is interested in learning of its utilization. Comments and questions are welcome and can be submitted to Carilion at communityoutreach@carilionclinic.org.
Members of the leadership team reviewed all documents prior to publication. Every effort has been made to ensure the accuracy of the information presented in this report; however, accuracy cannot be guaranteed. Members of the New River Valley CHAT cannot accept responsibility for any consequences that result from the use of any information presented in this report.
Carilion began conducting CHAs prior to the IRS adoption of the 501(r)(3) standard which requires not-for-profit hospitals to conduct a Community Health Needs Assessment (CHNA) every three years. While meeting the CHNA requirement, Carilion maintains the longstanding formal name Community Health Assessment for our process and reports. A crosswalk of this document based on the 501(r)(3) standards can be found in Appendix A.
Our Partners
Community Health Assessment Leadership Team
The CHA Leadership Team collaborates to guide major functions of the CHA, including CHAT recruitment, data collection/analysis and shaping meeting structure. In addition to Carilion staff, membership includes leadership from the local health district, the local federally qualified health center, population health experts and representation from local community networks. Carilion organizes and facilitates leadership team meetings.
• Carilion Clinic:
o Shirley Holland, VP, Community Health and Development
o Molly Roberts, Manager, Community Benefit
o Ashley Hash, Community Health Improvement Program Manager
o Holly Ostby, Community Health Improvement Program Manager
o Nicholas (Nick) Bilbro, Community Benefit Analyst
• New River Health District:
o Noelle Bissell, MD, Health Director
• Community Health Center of the NRV:
o Michelle Brauns, CEO
• Virginia Tech Department of Population Health Sciences
o Sophie Wenzel, Assistant Professor of Practice
• Healthy Roots NRV:
o Jessica Wirgau, CEO, The Community Foundation of the NRV
• NRV Partnership for Access to Healthcare (PATH):
o Cayla Trueheart, Population Health Manager, New River Health District
• Giles County FOCUS (Focus on Communities Utilizing Services)
o Jeff Dinger, Giles County Administration
Community Health Assessment Team
The CHAT is a dynamic group of health and human service agency leaders, individuals/organizations serving/representing the interests of priority populations and local representatives from various community sectors. The following community partner organizations participated in the 2024 NRVCHA:
Organization
Agency on Aging
Carilion Community Benefit
Carilion Community Health and Outreach
Carilion Division of Equity and Inclusion
Carilion New River Valley Medical Center
Older adult population* NRV
Healthcare provider/community health center Regional
Healthcare provider/community health center Regional
Healthcare provider/community health center Regional
Healthcare provider/community health center NRV
Community Foundation of the NRV Philanthropy NRV
Community Health Center of the NRV
Disability Resource Center
Healthcare provider/community health center NRV
Minority population* NRV
Feeding America - Feeding Southwest Virginia Food access Regional
Giles Christian Mission
HCA - LewisGale
Literacy NRV
Faith community* Giles
Healthcare provider/community health center Pulaski
Medically underserved population* NRV
Organization
Montgomery County Public School System
Montgomery-Floyd Regional Library System
Montgomery County Administration
Montgomery County Dpt. of Social Services
NAACP Montgomery-Radford-Floyd
Ninevah
New River/Mt. Rogers Workforce Development
New River Community Action
NRV CARES
NRV Regional Commission
New River Valley Community Services
Onward NRV
Pulaski County Public Schools
Radford City Department of Social Services
Town of Blacksburg
Tri-Area Community Health
United Way SWVA
VDH - New River Health District
Virginia Foundation for Healthy Youth
Virginia Poverty Law Center
Virginia Tech
Women's Resource Center of the NRV
Wythe Hospice/Alzheimer’s Association
Local school district
Montgomery
Local community spaces Mont , Floyd
Local government Montgomery
Local government Montgomery
Minority population* NRV
Faith community* Radford
Labor/workforce NRV
Low-income population* NRV
Medically underserved population* NRV
Economic development NRV
Medically underserved population* NRV
Labor/workforce NRV
Local school district Pulaski
Medically underserved population* Radford
Local government Blacksburg
Healthcare provider/community health center Floyd
Philanthropy Regional
Public health department NRV
Philanthropy NRV
Minority population* NRV
Academic expert Regional
Medically underserved population* NRV
Older adult population* Wythe
*member of or individual/organization serving/representing the interests of this population
To see a list of specific 2024 CHAT participants, and for more information about our stakeholder convening (CHAT invitation) methodology, please see Appendix B
Data Team
Additional data support was provided by the Virginia Department of Health (VDH) Division of Population Health Data.
• Khristina Morgan, Community Health Epidemiology Regional Coordinator
• LeeAnn Gardner, Community Health Epidemiologist, Central Shenandoah Health District
• Taiwo Ilechie, Community Health Epidemiologist, Roanoke City and Alleghany Health Districts
Our Process
The first step in the ongoing community health improvement process is to conduct a CHA. Every three years, Carilion follows the formal process described below to identify community needs and develop plans to address them. The 2024 NRVCHA officially began October 10, 2023, and concluded with the final CHAT meeting on June 11, 2024.
STEP 1: Define Community Served
Carilion New River Valley Medical Center (CNRV) serves the Southwest Virginia counties of Montgomery, Pulaski, Floyd, Wythe and Giles in addition to the City of Radford. CNRV is part of Carilion Clinic, a not-for-profit healthcare organization based in Roanoke, Virginia.
Centrally located in Virginia’s New River Valley, the 110-bed acute care facility serves as Carilion’s Western Region hub, providing a variety of inpatient and outpatient services, specialty care, medical education, a Level III Trauma Center and Birth Center.
The service areas for Carilion’s CHAs are determined by unique patient origin of the hospital in each respective market. Focus is placed on areas that are considered Medically Underserved Areas (MUAs) and Health Professional Shortage Areas (HPSAs).
In fiscal year 2023, CNRV served 53,264 unique patients. Patient origin data revealed that during this year, 85% of patients served by CNRV lived in the following localities:
• Montgomery County (33%)
• Pulaski County (16%)
• City of Radford (15%)
• Floyd County (8%)
• Wythe County (8%)
• Giles County (5%)
These localities comprise the NRVCHA service area, excluding Giles County. It is important to note that Giles County is also served by Carilion Giles Community Hospital (CGCH) located in Pearisburg, Virginia.

CGCH also conducted its own CHA of Giles County and Monroe County, West Virginia, concurrently. Giles County data are included in secondary data so complete data for the New River Valley will be available in this report. Please note that while Wythe County is included in the service area, it is not traditionally considered part of the New River Valley.
Additional Community Demographics
The New River Valley is composed of the independent City of Radford and the counties of Floyd, Giles, Montgomery and Pulaski. It is nestled among the Blue Ridge and Appalachian
Mountains in Southwest Virginia. The valley is home to two universities, Virginia Tech and Radford University, and New River Community College. Their presence enriches the local culture and workforce. A rich mix of urban and rural communities, the New River Valley boasts scenic views and thriving communities complete with restaurants, arts and culture offerings and an abundance of outdoor recreation and relaxation opportunities.
The New River Valley has many small-town communities, each with a different feel and array of resources. These small towns vary greatly in the demographic and economic makeup of the individuals who live there. Each locality is unique, with their own specific resources and challenges. The presence of the universities particularly impacts their home communities’ diversity, resources, workforce, housing market, health needs and societal structure.
The Weldon Cooper Center for Public Service predicts positive population change by 2040 for all communities except Giles County, Pulaski County and Radford City, which may have slight population loss.1
Table 1. Select Demographics of the NRVCHA Service Area
Source: US Census Bureau, ACS, 2018-2022
1 https://www.coopercenter.org/virginia-population-projections
Table 2. Income Data for the NRVCHA Service Area
Source: US Census Bureau, ACS, 2018-2022
Specific to CNRV inpatients and outpatients in fiscal year 2023, 20% received Medicaid while 3% were self-pay, a proxy for uninsured.2
Table 3. Insurance Status of NRVCHA Service Area
Source: US Census Bureau, ACS, 2018-2022
Montgomery County and Radford City, each home to Virginia Tech and Radford University, respectively, are more racially and ethnically diverse than the rest of the Metropolitan Statistical Area All localities are more racially homogenous and below the state average (10%) for the percentage of the population identifying as Hispanic or Latino, with the highest percentage (3.5%) in Montgomery County. 2 Strata internal data
Table 4. Racial Demographics, NRVCHA Service Area
Source: US Census Bureau, ACS, 2018-2022
The region is divided into urban and rural areas, which vary greatly in the economic means of the residents who live there. Primary care HPSAs cover the entire counties of Floyd and Giles, and the low-income population of Wythe County. Dental health HPSAs exist for the low-income population of each locality. Mental health HPSAs exist for the high-needs population in Wythe County, and the New River Valley’s low-income population.3 Additionally, Floyd, Giles, Montgomery and Wythe counties are all MUAs, along with Radford City.4
Target Population
The target population for Carilion’s CHA projects consists of underserved/vulnerable populations disproportionately impacted by SDOH, including poverty, race/ethnicity, age, education, access and/or lack of insurance. Data are reviewed where available by different life stages, including parents of children and adolescents, women of child-bearing age, adults and the elderly. Other considerations include race, ethnicity and income levels. All patients are included in this assessment regardless of insurance payments or financial assistance eligibility. Distinct efforts are taken to ensure the CHA reflects those residing in MUAs and HPSAs.
STEP 2: Convene Community Health Assessment Team
A 52-member CHAT participated in the assessment activities Hearing voices from across our service area is crucial to a CHA’s success. Broad-interest community reach is a main qualification when inviting individuals to join the CHAT, which was achieved through engaging the many collaborative networks working to improve various aspects of well-being in the New River Valley The CHA Leadership Team included representatives from two of these networks PATH and Healthy Roots NRV as well as the New River Health District (the regional health district) and the Community Health Center of the New River Valley (a regional Federally Qualified Health Center)
To honor existing network structures, invitations for CHAT meeting participation were sent through network email lists and shared openly at network meetings Additional invitations extended by the CHA Leadership team included representation from local governments, the
3 https://data.hrsa.gov/tools/shortage-area/hpsa-find
4 https://data.hrsa.gov/tools/shortage-area/mua-find
local school system, social service organizations, other community organizers and nonprofit leaders. For a list of the community networks/coalitions please see our Stakeholder Convening Methodology in Appendix B.
The CHAT met four times throughout the process, with each meeting serving a distinct purpose.
• Meeting 1: Introduction and Overview of the Process; Launch of Community Health and Well-Being Survey
• Meeting 2: Data Presentation and Data Walk
• Meeting 3: Prioritization of Needs and Discussion
• Meeting 4: Action Planning: Key Drivers and Impact/Feasibility Activity
Each meeting built on the one prior and fostered dialogue amongst CHAT members. Meetings were held in person with interactive opportunities to participate and engage with data and facilitated discussions with other CHAT members.
All members of the leadership team were engaged from the beginning of the planning process (spring of 2023) throughout the assessment period and CHAT meetings Their involvement helped shape all aspects of this assessment. The team identified community partners to serve on the CHAT, provided discussion points and suggestions on structure of CHAT meetings and offered feedback on the prioritized needs. Additionally, leadership team representatives were active on the CHAT and participated in all CHAT activities including the Stakeholder Listening Session and the prioritization activity.
The CHAT included several individuals or organizations serving or representing the community’s medically underserved, low-income and minority populations. Examples include:
• Local health district (e.g., VDH - New River Health District)
• Federally qualified health centers (e.g., Community Health Center of the NRV)
• Social service agencies (e.g., New River Valley Community Action)
• Community services (e.g., New River Valley Community Services, Literacy NRV, Women’s Resource Center of the NRV, NRV CARES)
• Philanthropy (e.g., Community Foundation of the NRV)
• Economic development organizations (e.g., NRV Regional Commission, New River/Mt. Rogers Workforce Development Board)
These organizations and individuals helped gather community input by distributing the Community Health Survey. CHAT member input was solicited through the Stakeholder Survey and Listening Session. Combined, these efforts led to the identification and prioritization of community health needs.
STEP 3: Collect and Review Relevant Health Data
Various data were collected and shared with the CHAT regularly, including primary and secondary data on health outcomes, health status, socioeconomic factors and quality of life. Secondary data served as a key driver of the process, with primary data adding community context and perspectives to understand the needs of subpopulations within the community.
Community Health and Well-Being Survey
A Community Health and Well-Being Survey was conducted as part of the NRVCHA. This survey was used to evaluate the health of the community and identify potential geographic
areas to target improvements. Input and oversight of survey development was provided by the CHAT and the CHA leadership team
A 27-question survey instrument was utilized. It asked questions about access to care and other services, health status, community strengths, quality of life, subjective well-being and demographics (Appendix C: Community Health and Well-Being Survey). The survey instrument included commonly used questions and metrics from the following established community surveys:
• Cantril’s Ladder
• Community Themes and Strengths Assessments, National Association of County and City Health Officials (NACCHO), Mobilizing for Action through Planning and Partnerships (MAPP)
• Community Healthy Living Index, YMCA
• Behavioral Risk Factor Surveillance System, CDC
• National Health Interview Survey, CDC
• Youth Risk Behavior Surveillance System, CDC
• Martin County Community Health Assessment, Martin County, North Carolina
• Previous New River Valley Community Health Surveys
The population of interest for the survey was NRVCHA Service Area residents 18 years of age and older. Surveys were distributed from October 2023 through December 2023. A drawing for a $50 grocery store gift card was offered as an incentive for those completing the survey.
The following subpopulations were especially targeted for sampling:
• Underserved/vulnerable populations disproportionately impacted by SDOH, including:
o Poverty
o Race/ethnicity
o Education
o Lack of insurance
o Insecure/unsafe housing
A non-probability sample method was used, where respondents were not randomly selected. Although the survey was available to all residents living in the service area, oversampling of the targeted subpopulations occurred through specific outreach efforts through community partners. Oversampling ensured that needs and assets specific to this subpopulation of interest were captured.
Oversampling was achieved through CHAT members’ relationships with the community populations they serve. Examples of oversampling methodology include:
• Collaborative effort with New River Community Action for survey collection and “read aloud” assistance at To Our House, a rotating-site shelter for unhoused NRV community members
• Survey collection/distribution in waiting rooms at Community Health Center of the NRV (FQHC) locations across the service area
The survey instrument was available in both English and Spanish via the following methods:
• Qualtrics link and QR code
• Phone line (888-964-6620)
• Paper surveys (collected by volunteers and/or staff of partner agencies)
Outreach strategies for survey distribution included:
• Social media
• Flyers and posters distributed throughout the community with survey QR code, URL and phone line information
• Survey URL posted on partner agency websites
• Recruitment of participants on site at CHAT member organizations
In total, 380 surveys were collected and validated. Full survey results and validation methodology can be found in Appendix D
All responses were entered into Qualtrics by survey respondents or by Carilion staff who entered responses from paper surveys. Surveys were analyzed and reported using Qualtrics and Microsoft Excel.
Stakeholder Listening Sessions and Survey
CHAT members were invited to provide an additional perspective on the needs and barriers to health facing our community. Carilion staff from across the organization facilitated small group discussions. To quantify focus group data, CHAT members were asked to complete the Stakeholder Survey. A summary of the data can be found in Appendix E.
Community stakeholders, leaders and providers were encouraged to complete the Stakeholder Survey after participating in a listening session. The survey was also shared with leaders who may not have attended a listening session. The online survey was shared at the CHAT meetings and via email. Surveys were analyzed and reported using Qualtrics and Microsoft Excel.
Community Listening Sessions
Community members were invited to participate in Community Listening Sessions to collect qualitative data to further understand health-related needs. The Community Health Center of the NRV successfully hosted two sessions at their Christiansburg location in partnership with Carilion staff. Additional community sessions were organized across the New River Valley, one in each locality, that were subsequently cancelled due to no/low registration. A summary of the data can be found in Appendix E
Secondary Data
Secondary data came from two primary sources: SparkMap and the VDH Division of Population Health Data. SparkMap is a product from the University of Missouri that quickly and accurately aggregates data across geographies for 80+ indicators from publicly available sources such as the American Community Survey, County Health Rankings and the CDC. Secondary data analysis was provided through SparkMap’s tables, maps and visual diagrams depicting indicators that are better or worse than the state average, trends over time and comparisons across different population segments such as race and life cycle.
A team of VDH epidemiology staff provided and analyzed data from specific VDH departments a critical component of the data walk. Data provided included mortality due to specific chronic diseases, incidence rates of sexually transmitted infections, sociodemographic data, cancer rates and others. VDH also provided data broken down by gender and race/ethnicity for many health topics. All data shared with the CHAT for review can be found in the final section of this document, Appendix H.
Table 5. Data Sharing Summary
Community Demographic Data Secondary - CHAT 1 Presentation
Health Factors Data Secondary - CHAT 1 Presentation - CHAT 2 Overview in Presentation - Data Packet Email prior to CHAT 3
Health Outcomes Data Secondary - CHAT 1 Overview in Presentation - CHAT 2 Data Walk - Data Packet Email prior to CHAT 3
Community Health & Well-being Survey
Community Listening Sessions (CLS)
Stakeholder CLS
STEP 4: Prioritize Community Health Needs
- Data Packet Email prior to CHAT 3
- Data Packet Email prior to CHAT 3
- Data Packet Email prior to CHAT 3
Using their community knowledge, data collectively reviewed and additional data requested and shared, CHAT members were asked to complete an electronic survey to prioritize community health needs. The community health needs included for prioritization were specific health conditions or health outcomes reflecting those conditions which contribute to morbidity and mortality in the service area. The prioritization survey matched the structure utilized during the data walk at CHAT Meeting 2. This resulted in the identification of 13 health needs in the community.
During CHAT Meeting 3, CHAT members completed a dot voting activity to further refine the priority list, and a discussion ensued to determine the final prioritized need based on scope of issue, burden on community and feasibility to address at the community level based on CHAT member perspectives and perceptions.
The 2021 NRVCHA and the subsequent Implementation Strategy were posted publicly though multiple electronic channels and shared widely by community partners. An email address was provided for submission of written comments, but none were received for consideration in the identification and prioritization of health needs in the 2024 NRVCHA
STEP 5: Strategic Planning to Address Priority Health Needs
The final CHAT meeting served as a springboard into both hospital and community action planning. The prioritized needs were again reviewed with the CHAT and a two-part activity ensued. CHAT members identified key drivers of the prioritized health outcomes/conditions using the Robert Wood Johnson County Health Rankings framework as reference. Following the identification of drivers, an impact and feasibility analysis was completed in small groups to help identify leading strategies for community change.
Our Impact: Evaluation of Actions Taken in Response to 2021 NRVCHA
The prioritized needs established in the 2021 NRVCHA fell into three overarching categories: mental health, socioeconomic factors and health behaviors. Key strategies included health education, grant funding to address SDOH and support for the efforts of community partners in addressing the needs, both directly and indirectly. Below is a snapshot of outcomes from these efforts through June 30, 2024.


Our Priority: Health Equity
Carilion is part of a growing movement of health system stewards committed to unlocking our community’s potential to thrive. We, along with key partners, strive to identify and address health and socioeconomic factors that impact our communities’ health and well-being. We know that where you live is an important contributing factor of health status and outcomes. We are committed to advancing a culture of health where policies, systems, education, research and resources align for optimal health status.
Our mission calls for us to meaningfully address health inequities and disparities. Equity is a key lens for the CHA process, guiding our actions as we seek to understand community health needs. As we move forward into developing community heath improvement strategies, we will remain focused on identifying and serving those who need it most, seeking to broaden the potential for everyone across our communities to thrive.
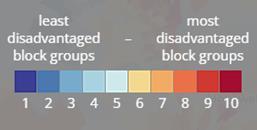
The Area Deprivation Index (ADI), a tool developed by the University of Wisconsin-Madison, sheds light on what are considered disadvantaged areas of the community based on census block groups (neighborhoods).5 This granular data helps emphasize the importance of conditions that shape our daily lives. The image below shows the extreme variation seen across the service area in ADI scores and illustrates challenges experienced both within pockets of the central business/shopping locations and some of the most rural locations. Data used in creating the index includes factors for income, education, employment and housing quality some of the key social determinant factors that influence health outcomes.
Map 1. Area Deprivation Index Map

5 https://www.neighborhoodatlas.medicine.wisc.edu/
Source: University of Wisconsin School of Medicine and Public Health.Area Deprivation Index (ADI). 2022.
As we work to improve health equity across our region, our guiding principles include improving access to care and addressing SDOH. This assessment focuses on those principles in the context of specific prioritized health outcomes. To expect a shift in health outcomes, we must focus on improving the underlying factors that lead to them—seen in the figure below—in a coordinated manner. We will be addressing specific SDOH needs as aligned with the CHA focus areas.
Figure 1. Social Determinants of Health

Source: Institute for Clinical Systems Improvement; Going Beyond Clinical Walls: Solving complex Problems, 2014. Analysis and adaptation from the University of Wisconsin Population Health Institute’s County Health Rankings model, 2010. Graphic designed by ProMedica and shared by the American Hospital Association.

Our Priority: Addressing Chronic Disease
Our prioritization process resulted in the elevation of two specific chronic diseases as a focus area: overweight/obesity and hypertension. The following data indicates potential areas for opportunities
Data shows need
• NRV residents have a higher-thanaverage occurrence of physically unhealthy days
• Self-reported height and weight data indicate high rates of adult obesity
• Hypertension (high blood pressure) data shows variation across localities
Key informants indicate need
• Community survey respondents indicated:
o Overweight/obesity as a top health condition affecting their/their family’s health and well-being
o Lack of exercise and poor eating habits were two of the top health factors affecting their/their family’s health and well-being
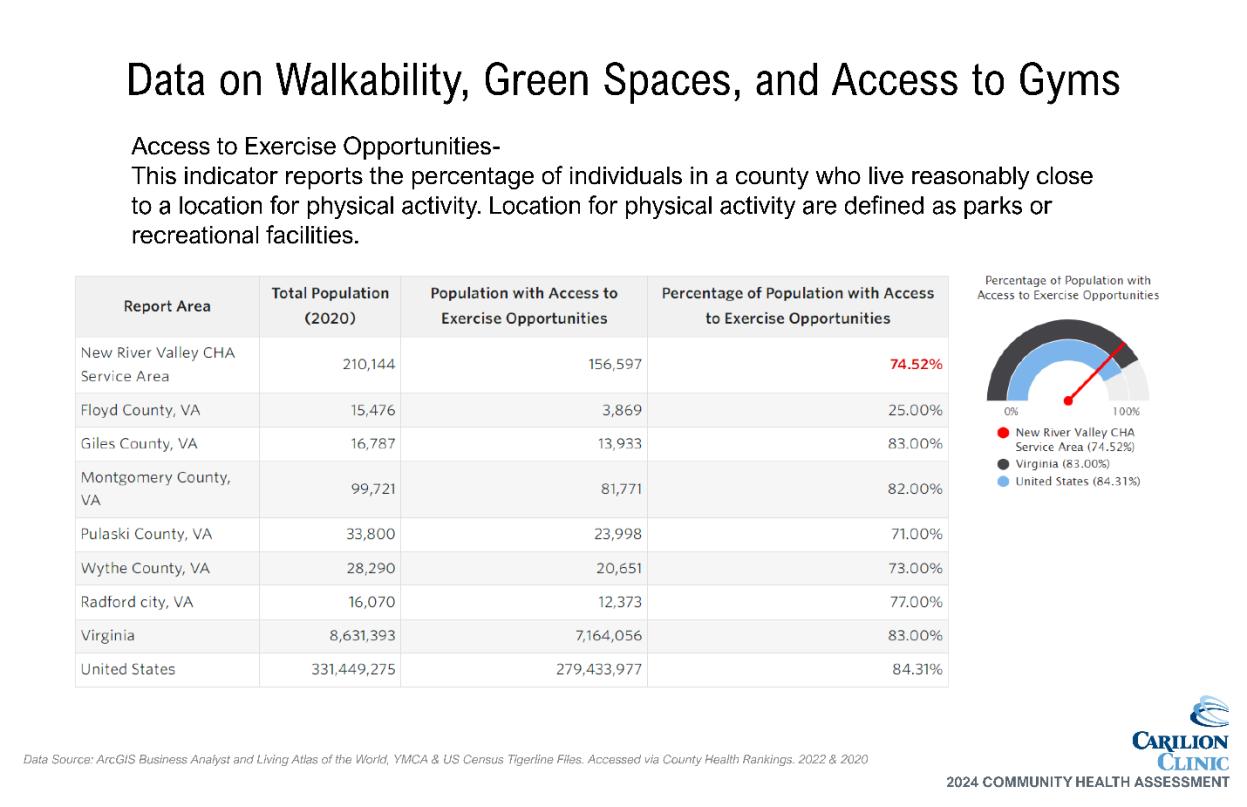
o Access to parks and recreation and educational opportunities were two top responses to our community’s greatest strengths
• CHAT participants noted the interwoven relationship between chronic disease, mental health and many other identified priorities
Why This Matters
According to the Institute for Health Metrics and Evaluation (IHME), high body-mass index (BMI), high blood pressure and dietary risks are within the top 10 risks driving death and disability. In other words, these are some of the key impacts on overall health, well-being and life expectancy.6 Additionally, chronic diseases are a leading driver of healthcare costs 7
Data below shows physically unhealthy days and obesity across all service area localities as reported by the CDC’s Behavioral Risk Factor Surveillance System (BRFSS). Notably, the number of physically unhealthy days reported for all NRVCHA localities exceeded the Virginia state average and only Montgomery and Floyd counties had lower reported obesity prevalence rates than the Virginia state average
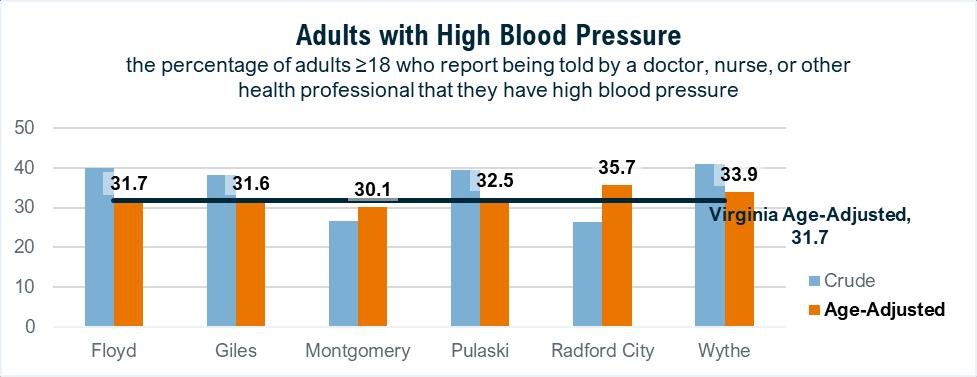
High blood pressure is another indicator reported through BRFSS. The graph below shows key differences when viewing crude rates versus age-adjusted rates by county. Radford City, which indicated the lowest prevalence of high blood pressure when analyzing the crude rates, ended up with the highest percentage when considering the age of the locality’s occupants. Because blood pressure is known to increase with age for most people,8 utilizing an age-adjusted rate can help lead to discovering other underlying variables that may be leading to these differences.
6 United States | Institute for Health Metrics and Evaluation (healthdata.org)
7 https://www.cdc.gov/chronic-disease/about/index.html
8 Franklin, Stanley S., et al. "Hemodynamic patterns of age-related changes in blood pressure: the Framingham Heart Study." Circulation 96.1 (1997): 308-315.
Chart 1. Physically Unhealthy Days


Source: Behavioral Risk Factor Surveillance System. 2021. Accessed via
Chart 2. Adults With Obesity
Chart 3. Adults With High Blood Pressure
SparkMap.
Key Drivers
Community partners identified many key drivers of these chronic diseases, including access to healthy foods, access to care, education of prevention and disease management, culture/readiness to change and the impact of stress and trauma According to the CDC, many preventable chronic diseases are caused by the same behaviors, which include smoking, poor nutrition, lack of physical activity and excessive alcohol use. This was evident in the CHAT participants’ discussion of the interwoven relationship of many of these priority areas. By adopting strategies to influence these behaviors, we can ultimately impact multiple diseases (and perhaps priority areas) with coordinated strategies
Resources Available
A detailed list of community partners is available in Appendix G. Key resources to address chronic diseases in the New River Valley Area include:
• Carilion health education programming
• Diagnostic, management and treatment services through healthcare systems
• Prevention and self-management education services
• Healthy behavior support services
• Healthy food access network (Thrive NRV)

Our Priority: Addressing Mental Health and Substance Use
Our prioritization process resulted in the elevation of mental health challenges, substance use and overdoses as focus areas. The following data indicates potential areas for opportunities.
Data shows need
• Residents of the service area have a higher average occurrence of:
o Depressive disorder
o Cigarette smoking
• Overdose deaths vary by locality with high occurrence in some localities
• Higher occurrence of mentally unhealthy days than physically unhealthy days
Why This Matters
Key informants indicate need
• Community survey respondents indicated:
o Stress and mental health problems as two of the top health conditions impacting their/their family’s health
o Mental health/substance use services would improve quality of life in our community
o High concern for access to substance use services
According to IHME research, drug use disorders are the number two cause of death and disability in the United States. Depressive disorders and anxiety disorders, both mental health challenges, are ranked at fifth and eighth, respectively.9 All of these health conditions have been worsening in recent years, especially in relation to the impacts of the COVID-19 pandemic.
Adults with depressive disorder and cigarette smoking are both reported through BRFSS for the service area localities. All are higher than Virginia’s average, with Radford City experiencing the highest rates of depressive disorder and cigarette smoking
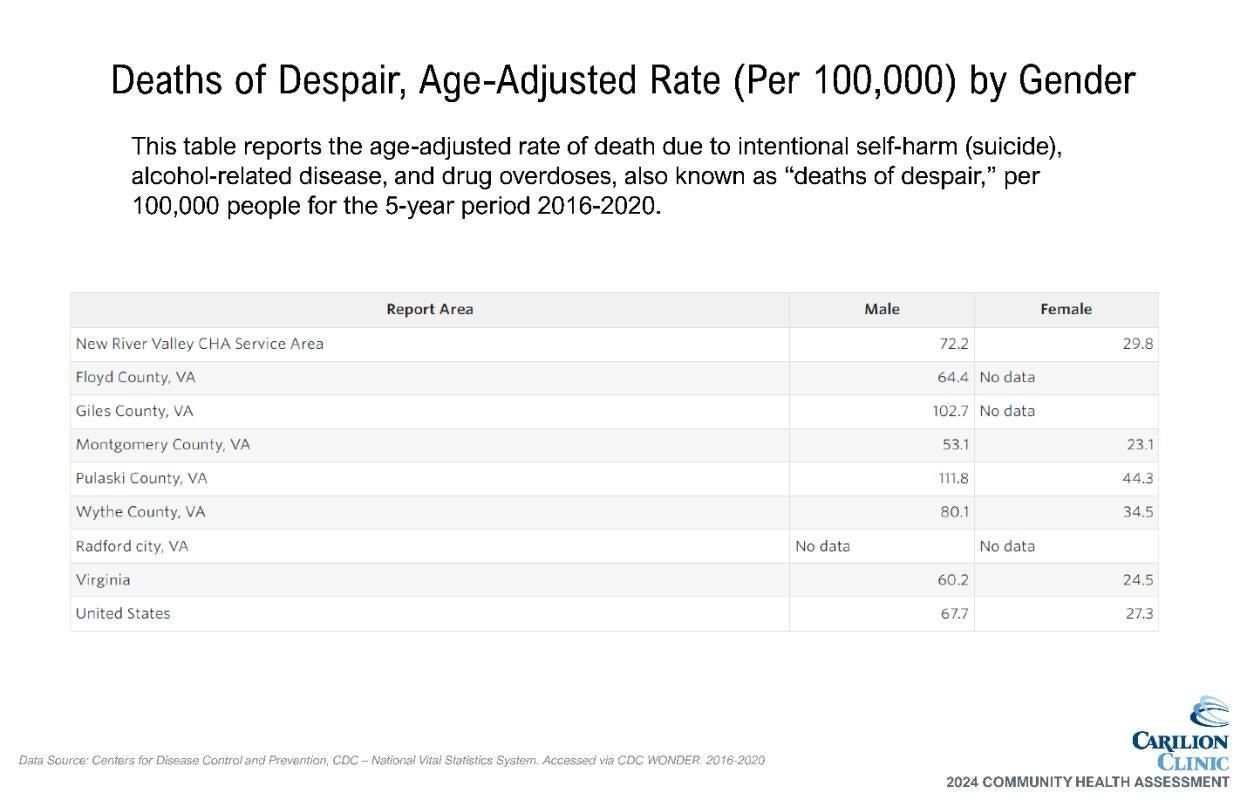
Overdose deaths are particularly high in Pulaski and Giles counties. No data is available for Floyd and Radford City due to small population sizes.
9 United States | Institute for Health Metrics and Evaluation (healthdata.org)
Chart 4. Adults With Depressive Disorder

5. Cigarette Smoking Prevalence


Chart
Chart 6. Deaths From Overdose
Chart 7. Mentally Unhealthy Days

Key Drivers
Community partners identified many key drivers of substance use, including poverty, trauma, mental health challenges, lack of access to services, the home environment and housing instability. Identified drivers of mental health challenges were similar and included lack of awareness, stress, trauma, stigma, the home environment, financial circumstances, lack of access to services and housing instability Mental health and substance use are intertwined. Both areas can benefit from some of the same strategies, especially related to prevention. However, there are key differences in effective strategies with individuals who are actively experiencing challenges in those topic areas, which allows for all community partners to have a role in the work to address them.
Resources Available
A detailed list of community partners is available in Appendix G. Key resources to address mental health and substance use in the New River Valley Area include:
• Counseling, treatment and prevention services
• Harm reduction and other recovery services
• Opioid abatement funds
• Locality-based prevention coalitions

Our Priority: Addressing Interpersonal Violence
Our prioritization process resulted in the elevation of interpersonal violence as a focus area. The following data indicates potential areas for opportunities.
Data shows need
• NRVCHA area is lacking data on assault deaths (homicides)
• Deaths from firearms are higher than average in most localities where data is available
• Deaths from accidents exceed the state average in four of the six localities
Why This Matters
Key informants indicate need
• CHAT participants indicated concern for intimate partner violence/child abuse and the resulting generational impact
• CHAT participants noted difficulties in measuring the need:
o Underreporting
o Data suppression
o Stigma/safety concerns
• Survey respondents indicated public safety and health (law enforcement, fire/EMS, public health) as one of the greatest strengths in our community
The American Public Health Association issued a policy brief in 2018 recommending that violence be deemed a public health crisis 10 Since that time, data shows that violence in our communities has increased. Violence as defined by the policy brief refers to “the intentional use of physical force or power, threatened or actual, against oneself, another person, or against a group or a community, which either results in or has a high likelihood of resulting in injury, death, psychological harm, maldevelopment, or deprivation.” This encompasses a wide range of challenges including child maltreatment, elder maltreatment, intimate partner violence, bullying and broader community violence.
The impact of violence is far-reaching and includes not only the directly affected individual, but also those who are exposed indirectly and the community at-large. Gun violence, for example, continues to be an issue of national concern and negatively impacts entire groups of people in addition to direct victims. While CHAT partners did not raise firearms as a priority concern for the NRVCHA area, deaths from firearms are higher than the state average in Wythe and Pulaski counties and twice the state average in Giles County.
Adolescents are especially at risk for experiencing violence and research has shown that children who experience violence are at risk for long-term physical, behavioral and mental health problems.11 Violence prevention strategies that protect children, therefore, can create lasting, even generational, improvements to their health and well-being
10 https://apha.org/policies-and-advocacy/public-health-policy-statements/policy-database/2019/01/28/violence-is-a-public-healthissue
11 https://health.gov/healthypeople/objectives-and-data/browse-objectives/violence-prevention


Chart 8. Firearm Deaths
Chart 9. Accident Deaths
Key Drivers
Community partners identified many key drivers of interpersonal violence, including lack of healthy family/social support, mental health and substance use challenges, generational patterns/witnessing of unhealthy and/or violent behaviors, poverty, unemployment, trauma and unhealthy relationships. Interpersonal violence can be very closely related to both SDOH and mental health and substance use challenges, further emphasizing the importance of crosscutting strategies to address multiple health priorities.
Resources Available
A detailed list of community partners is available in Appendix G. Key resources to address interpersonal violence in the New River Valley Area include:
• Crisis hotlines
• Emergency shelters/transitional housing
• Law enforcement
• Emergency healthcare services
• Resiliency Network (area trauma-informed community network)

Our Priority: Dental Health
Our prioritization process resulted in the elevation of dental health as a focus area. The following data indicates potential areas for opportunities.
Data shows need
• When compared to the state average, the NRVCHA area has substandard measures of dental health:
o Higher rates of adults with poor dental health
o Lower rates of adults with a recent dental appointment
o High ratios of residents to dentists
Why This Matters
Key informants indicate need
• Concern for access to routine dental care services indicated through community survey
• CHAT participants indicate various challenges that need to be addressed to increase area resources and utilization of existing resources
Many people do not receive the dental care they need, even though dental health problems are easier to treat when they are caught early through regular preventative dental care. Untreated oral health problems can cause pain and disability and are linked to other diseases.12
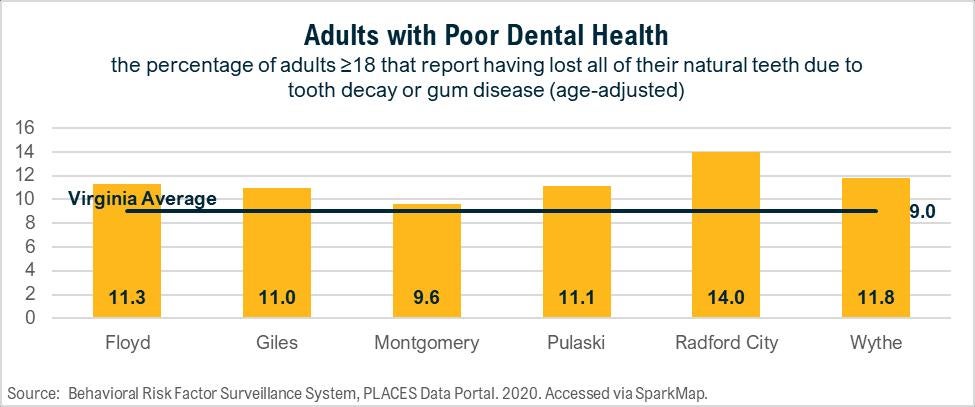
BRFSS survey data reflects that all NRVCHA localities have a higher than the state average percentage of the adult population reporting that they have lost all their natural teeth due to tooth decay or gum disease Radford City has the highest percentage of the population reporting poor dental health, at 14%.
Radford City also reports the lowest percentage of the population with a recent dental appointment (one occurring within the past six months). All localities have a lower percentage than the state average, indicating many NRVCHA residents could be missing routine dental care.
12 https://health.gov/healthypeople/objectives-and-data/browse-objectives/oral-conditions
Chart 10. Poor Dental Health


Key Drivers
Community partners identified many key drivers of dental health problems, including lack of providers accepting Medicaid, provider office hours, lack of awareness/education, lack of providers, affordability, insurance availability and generational/cultural habits. There is a strong advocacy component of work needed in order to overcome barriers within dental health access.
Resources Available
A detailed list of community partners is available in Appendix G. Key resources to address dental health in the New River Valley Area include:
• Preventative and reactive treatment services
• School dental screenings
• PATH (NRV Partnership for Access to Healthcare)
Chart 11. Dental Care Utilization
Chart 12. Dental Care Access

Our Priority: Addressing Sexual Health
Our prioritization process resulted in the elevation of sexual health as a focus area. The following data indicates potential areas for opportunities.
Data shows need
• Teen birth rate well above average in multiple localities and experienced at different rates across the NRVCHA area
• Sexually transmitted infection (STI) rates higher in Radford City and experienced at various rates across the NRVCHA area
• Hepatitis C rates above average across NRVCHA area and experienced at different rates in multiple localities
Why This Matters
Key informants indicate need
• Discussed need for more communicable disease testing rates of STIs and hepatitis C could be higher than what data is currently reflecting due to lack of testing resources/outreach
• Discussed relationship between sexual health (unplanned pregnancies, STIs) and mental health/substance use, including parallels between injection drug use and various communicable diseases
Unintended pregnancy is linked to many negative outcomes for both women and infants such as preterm birth and postpartum depression 13 Adolescents are at especially high risk for unintended pregnancy National data shows that teen births vary among different racial ethnic, geographic and socioeconomic groups,14 and locality and racial disparities can be seen in our local data.
CHAT partners discussed the relationships between mental health, substance use and health behaviors. Research supports these links between mental health/substance use and sexual health behavior choices the likelihood of making risky behavior choices increases as substance use increases15 and a person who injects drugs is more likely to have a sexually transmitted disease than those who do not.16
Hepatitis C, spread by exposure to blood containing the virus, may be spread through sexual contact but it is not categorized as an STI. More often, viral hepatitis is spread by sharing needles used for injecting intravenous drugs.17 Due to the relationship between sexual health and substance use mentioned above, hepatitis C data is included here.
13 https://health.gov/healthypeople/objectives-and-data/browse-objectives/family-planning
14 Romero L, Pazol K, Warner L, et al. Reduced Disparities in Birth Rates Among Teens Aged 15–19 Years United States, 2006–2007 and 2013–2014. MMWR Morb Mortal Wkly Rep 2016;65:409–414. DOI: http://dx.doi.org/10.15585/mmwr.mm6516a1.
15 https://www.cdc.gov/healthyyouth/substance-use/dash-substance-use-fact-sheet.htm
16 Brookmeyer, Kathryn A., et al. "Sexual risk behaviors and STDs among persons who inject drugs: a national study." Preventive medicine 126 (2019): 105779.
17 https://www.hepatitis.va.gov/hcv/background/transmission-modes.asp


Chart 13. Teen Birth Rate
Chart 14. Teen Pregnancies by Race/Ethnicity
Chart 15. Chlamydia Incidence
Chart 16. Hepatitis C Incidence

Key Drivers
The CHAT did not discuss key drivers of sexual health concerns with the same framework used during CHAT Meeting 4 prior to the completion of this report. However, key drivers included in previous CHAT discussions included mental/behavioral health, substance use, family and social support networks, generational/cultural examples, media examples, community (free, discreet) STI/pregnancy testing resources, family planning education, sexually transmitted disease education and healthy relationships education Resources Available
A detailed list of community partners is available in Appendix G. Key resources to address sexual health in the New River Valley Area include:
• Healthy relationships, behaviors, prevention and awareness education
• Harm reduction services
• Testing and treatment services
Next Steps
Carilion New River Valley Medical Center Health Improvement Strategy
Carilion will continue to work with partners and develop a Community Health Improvement Plan for the New River Valley, with expected completion before the end of calendar year 2024. Key focus areas will include not only the priority health outcomes, but also cross-cutting ways to address those outcomes by improving access to care and addressing SDOH.
Carilion will also participate in planning processes with other community coalitions and networks as applicable to address health needs in conjunction with a hospital-specific plan.
Appendices
501R Requirement
Define the community served.
Take into account the geographic area served. 7 Take into account target populations served. 10
Take into account principal functions 7
Does not delineate to exclude medically underserved, low-income, or minority populations. 1
Account for patents without regard to insurance payments or FAP eligibility. 10
Assess the health needs of the community. Identify significant health needs 7-14
Prioritize those needs. 14
Health needs include requisites for improvement of maintenance of health status in the community at large. Appendix F
Health Needs Include requisites for improvement of maintenance of health status in particular parts of the community. Appendix F
Identify resources potentially available to address them. Appendix G
Solicit and take into account input from persons representing the broad interests of the community, including those with special knowledge of public health.
Include all of the following sources to Identify and prioritize significant health needs and identify potentially available resources:
501R Requirement Page
Document the CHNA in a written report that is adopted for the hospital facility by an authorized body.
Definition of community served and how this was determined. 7-10
Description of process and methods used to conduct the CHNA. 7-14
Description of how broad-interested community input was solicited and taken into account. 10-14
Description of the process and criteria used to identify needs as significant. 11-14, Appendix F
Prioritize the significant needs. Appendix F
Description of resources potentially available to address identified significant health needs. 2
, 28, 31 Appendix G
Evaluation of impact of actions taken to address previous CHNA-identified significant health needs. 15
Describe the data and other information used in the assessment. 18-31, Appendix H
Describe the method of collecting and analyzing this data and information. 11-14
Identify any CHNA- related collaborative or contracted parties n/a
Describe how Carilion takes into account input received from persons representing broad interests of the community:
Input provided. 10-14
How and over what time period input provided. 10-14
Name, nature, and extent of organizations providing input. 5-6, Appendix B
Describe medically underserved, low-income, or minority populations being represented by those providing input. 11, Appendix B
Adopted by Board 3
Appendix B: CHAT List and Stakeholder Convening Methodology
CHAT List
Representative Organization Type Organization
Abby Ferguson Health care provider/community health center Carilion Community Health & Outreach
Alexandria Strickler Local government Montgomery County Department of Social Services
Amanda Talbert Public health department VDH - New River Health District
Andi Golusky Medically underserved population* NRV Cares
Ashley Hash Health care provider/community health center Carilion Community Benefit
Blake Hritz Medically underserved population* Literacy NRV
Brad St.Clair Local government Montgomery County Administration
Caroline Ramirez Public health department VDH - New River Health District
Casey Edmonds Low-income population* New River Community Action
Cayla Trueheart Public health department VDH - New River Health District
Debora Bratton Health care provider/community health center Tri-Area Community Health
Dee Frith Medically underserved population* New River Valley Community Services
Don Mankie Food access
Feeding America - Feeding Southwest Virginia
Emily Altizer Local school district Montgomery County Public School System
Emily Gibson Academic expert Virginia Tech
Erica Short Public health department
VDH - New River Health District
Ginny Ayers Medically underserved population* Literacy NRV
Holly Lesko Economic development NRV Regional Commission
Holly Otsby Health care provider/community health center Carilion Community Benefit
Jenny Martin Philanthropy Virginia Foundation for Healthy Youth
Jessica Wirgau Philanthropy Community Foundation of the New River Valley
Jill Maher Local government Town of Blacksburg
Karen Jones Minority population* NAACP Mont-Rad-Floyd
Karim Khan Local community spaces (libraries, rec centers) Montgomery-Floyd Regional Library System
Katie Boswell Labor/workforce Onward NRV
Kim Thurlow Local government Town of Blacksburg
Kinsey Weaver Economic development NRV Regional Commission
Laura Groseclose Minority population* Disability Resource Center
Libby Pfaff Faith community* Ninevah
Margaret Hurst Philanthropy Community Foundation of the New River Valley
Marty Holliday Labor/workforce
New River/Mt. Rogers Workforce Development Board
Michelle Anderson Older adult population* Wythe Hospice/Alzheimer’s Association
Michelle Brauns Health care provider/community health center Community Health Center of the New River Valley
Mike Wade Medically underserved population* New River Valley Community Services
Molly Roberts Health care provider/community health center Carilion Community Benefit
Mona DiGiulian Medically underserved population* NRV Cares
Morris Fleischer Faith community* Giles Christian Mission
Representative Organization Type Organization
Nathaniel Bishop
Nick Bilbro
Health care provider/community health center Carilion Division of Equity and Inclusion
Health care provider/community health center Carilion Community Benefit
Pam Ray Public health department
VDH - New River Health District
Rhonda Seltz Minority population* Virginia Poverty Law Center
Robert Graham Local school district Pulaski County Public School System
Sarah Frazier
Shana Murphy
Sherry W. Kramer
Health care provider/community health center Carilion Community Health & Outreach
Health care provider/community health center
Carilion New River Valley Medical Center
Medically underserved population* Women's Resource Center of the NRV
Sophie Wenzel Academic expert Virginia Tech
Teresa Thornton Health care provider/community health center HCA - LewisGale
Terrie Sternberg Faith community* HCA - LewisGale
Tina King Older adult population* Agency on Aging
Trina Porterfield Low-income population* New River Community Action
Victoria Collins Medically underserved population* Radford City Department of Social Services
Whitney Caton Philanthropy United Way SWVA
Stakeholder Convening (CHAT Invitation) Methodology
The CHAT Leadership Team was convened by Carilion through direct invitations to key stakeholders including: the local health district, the local federally qualified health center, and representatives from key community networks
To honor existing network structures, invitations for CHAT meeting participation were sent through network email lists and shared openly at network meetings by the CHA Leadership Team. Additional invitations extended by the CHA Leadership team included representation from local governments, local school systems, social service organizations, other community organizers and nonprofit leaders.
The following table lists the NRV Networks that received CHAT Meeting 1 invitation emails through internal network communications. Additional invitations and meeting reminders were sent to all meeting attendees, all direct invitees, and as requested.
Network
Network Topic
First Steps NRV Early Childhood Educators/Service Providers
Healthy Roots NRV - Network Development Groups*
(C-Team, Government Taskforce, Leadership Team)
Long-term Care Council
NRV Aging in Community
NRV Livability Leadership Team
Develop a “network of networks” to address regional shared goals
Long-term Care Organizations
Support an Aging-Friendly Community
Supports the NRV Livability Regional Exchange
NRV Partnership for Access to Healthcare (PATH) Access to Healthcare Prevention Councils: (Floyd Multidisciplinary Team, Montgomery County Prevention Partners, Pulaski County Prevention Coalition, Radford Youth-Adult Partnership)
Youth Mental Health/Substance Use Prevention
Network
Reentry Council
Network Topic
Support for Returning Citizens Resiliency Network
Support a Trauma-Informed Community Thrive NRV Food Access
*Healthy Roots NRV was still developing its governing structure during the 2024 NRVCHA CHAT invitations were sent to “subnetworks” (listed separately in this table) as well as to any groups that previously met regularly for HRNRV network development.
CHAT meetings were open to all community members and interested parties were invited to join the process at any time. Brief summaries were provided at the beginning of each meeting to cover any previous work.
Appendix C: Community Health and Well-Being Survey


Appendix D: Survey Results and Validation Methodology
Due to the nature of the Community Health and Well-Being Survey and its public availability through online methods, data validation was necessary. To validate survey responses, data was filtered by zip codes within Carilion’s entire service area. These responses were used for further data analysis.


Appendix E: Qualitative Data Results


Appendix F: Prioritization Table
Prioritization Survey
Using their community knowledge, data collectively reviewed, and additional data shared, CHAT members were asked to complete an electronic survey to prioritize community health topics:
• The survey matched the structure utilized during the data walk at CHAT Meeting 2
• First prioritized broad categories, then specific topics within those categories
• CHAT facilitators ranked the following to develop results:
o Broad categories (resulting top 3 indicated by bold type below)
o Topics within each of the 3 top broad categories
o Remaining topics
• Results include:
o Top 3 topics of each of the top 3 broad categories
o Top 5 topics of the remaining categories
Method
Mental Health/Substance Use
• Substance use
• Mental health
• Overdoses Chronic Disease
• Overweight/obesity
• Diabetes
• Poor dental health Maternal/Child Health
• Teen pregnancy
• Infant mortality
• Low birthweight Injury/Violence & Infectious/Communicable Disease
• Firearm injuries/deaths
• Domestic violence/intimate partner violence
• Childhood injury
• STIs
• Hepatitis C
Dot Voting Activity Group Discussion
Using the results of the Prioritization Survey, the group was asked to individually choose 5 topics to prioritize:
• The CHAT facilitators hung pages around the meeting room, each with one of the topics from the Prioritization Survey results.
• Each CHAT meeting attendee was given 5 dot stickers and instructed to place one sticker on each of the 5 topics they felt were most important to address in the next three years.
• After voting was completed, the CHAT facilitators quickly tallied and ranked the results.
• The CHAT was presented with the top 5-7 topics, unranked. The number of results presented depended on any ties and how closely votes were distributed. If topics were additional (i.e. not in the true top 5), CHAT facilitators noted this to the group and separated them visually on the screen.
Top 5:
• Substance use
• Mental health
• Overdoses
• Overweight/obesity
• Poor dental health Additional:
• STIs
• Teen pregnancy
The group was asked to reflect on the results of the dot voting exercise. The following points were made during that discussion:
• Mental Health vs. Substance Use vs. Overdose
o Mental Health should be considered separately from Substance Use
o Overdose should fall under the category of Substance Use
o Substance Use should include tobacco use, vaping
• Heart Disease did not make the list considering Overweight/obesity as a contributing factor, no need to add/change
• Domestic Violence did not make the list but should be included
• STIs & Teen Pregnancy
o Sexual Health better fit STIs and pregnancy planning across multiple populations
Top 6:
• Mental health
• Substance use
• Overweight/obesity
• Dental health
• Sexual health
• Domestic violence/intimate partner violence
Appendix G: Resources to Address Prioritized Needs
Organization Organization Type Contact Information Programs/Services
CHRONIC DISEASE
Carilion Community Health and Outreach Community HealthCarilion (540) 512-5200
Carilion Giles Community Hospital Hospital - Carilion (540) 921-6000
Carilion New River Valley Medical Center Hospital - Carilion (540) 731-2000
Community Health Center of the NRV Federally Qualified Health Center (540) 381-0820
LewisGale Hospital Montgomery Hospital - LewisGale (540) 951-1111
LewisGale Hospital Pulaski Hospital - LewisGale (540) 994-8100
New River Health District Local Health District (540) 585-3300
Pulaski Free Clinic Free/Charitable Clinic (540) 980-0922
Chronic Disease Prevention Education
Stress Management Education
Emergency Care
Diagnostic and Treatment Services
Emergency Care
Diagnostic and Treatment Services
Disease Management Education (by physician referral)
Primary Health Care (w/Medicare, insured, & sliding scale)
Emergency Care
Diagnostic and Treatment Services
Emergency Care
Diagnostic and Treatment Services
Community Health Workers Prevention Education
Primary Health Care (w/Medicare & cost-free)
Thrive NRV Network - Food Access https://cfnrv.org/thrive/ Food Assistance Directory
Tri-Area Community Health Center Federally Qualified Health Center Floyd: (540) 745-9290
Virginia Cooperative Extension Cooperative Extension
Floyd: (540) 745-9307
Giles: (540) 921-3455
Mont: (540) 382-5790
Pulaski: (540) 980-7761
Wythe: (276) 223-6040
MENTAL HEALTH AND SUBSTANCE USE
Community Health Center of the NRV Federally Qualified Health Center (540) 381-0820
New River Health District Local Health District (540) 585-3300
New River Valley Community Action Community Action (540) 394-3255
New River Valley Community Services Community Services Board (540) 961-8300
Resiliency Network
Trauma Informed Community Network https://www.facebook.com/ NRVResiliencyNetwork/
Tri-Area Community Health Center Federally Qualified Health Center Floyd: (540) 745-9290
Virginia Cooperative Extension
Cooperative Extension
Floyd: (540) 745-9307
Giles: (540) 921-3455
Mont: (540) 382-5790
Pulaski: (540) 980-7761
Wythe: (276) 223-6040
INTERPERSONAL VIOLENCE
Primary Health Care (w/Medicare, insured, & sliding scale)
Chronic Disease Prevention and Control Education
Nutrition Education
Food Safety Education
Behavioral Health Care (w/Medicare, insured, & sliding scale)
Rise Above Mobile Unit (harm reduction services)
Blood-borne pathogen and STI testing Community Health Workers
Children's Health Improvement Program (CHIP) Home Visiting
501 Peer Center
RAFT Crisis Hotline: (540) 961-8400
Behavioral Health Care (w/Medicare, insured, & sliding scale)
Group Trauma Informed Basics Training (cost-free)
Behavioral Health Care (w/Medicare, insured, & sliding scale)
Stress Management Education
Child Development/Parenting Education
Family Financial Education
Organization Organization Type
Department of Social Services Domestic Violence Services
Contact Information Programs/Services
Floyd: (540) 745-9316
Giles: (540) 726-8315
Mont: (540) 382-6990
Pulaski: (540) 980-7995
Radford: (540) 731-3663
Wythe: (276) 228-5493
New River Valley Community Services Community Services Board (540) 961-8300
NRV CARES Child Advocacy (540) 381-8310
NRV Resiliency Network
Trauma Informed Community Network https://www.facebook.com/ NRVResiliencyNetwork/
Women's Resource Center of the New River Valley Domestic Violence Services (540) 639-9592
DENTAL HEALTH
Community Health Center of the NRV Federally Qualified Health Center (540) 381-0820
PATH (Partnership for Access to Healthcare)
Network - Healthcare Access https://www.vdh.virginia.go v/new-river/path/
SEXUAL HEALTH
New River Health District Local Health District (540) 585-3300
Planned Parenthood of Southwest Virginia Pregnancy Planning Education (800) 230-7526
Women's Resource Center of the New River Valley Domestic Violence Services (540) 639-9592
Virginia Domestic Violence and Sexual Assault Hotline: 1-800838-8238
Domestic Violence Prevention Program
Protective Services (Child, Adult)
RAFT Crisis Hotline: (540) 961-8400
Child Advocacy - CASA (Court Appointed Special Advocates)
Parenting Education
Child Abuse Awareness and Prevention Education
Group Trauma Informed Basics Training (cost-free)
24/7 Crisis Hotline: (540) 639-1123
Emergency Advocacy
Emergency Shelter Healthy Relationships Education
Primary Dental Health Care (w/Medicare, insured, & sliding scale)
Community Dental Screenings
Community Dental Care Advocacy
Family Planning Education Contraception and Vaccination Services
Pregnancy, STI, and blood-borne pathogen testing
Rise Above Mobile Unit (harm reduction services)
Pregnancy Prevention Community Education
Healthy Relationships Education
Appendix H: Data Packets
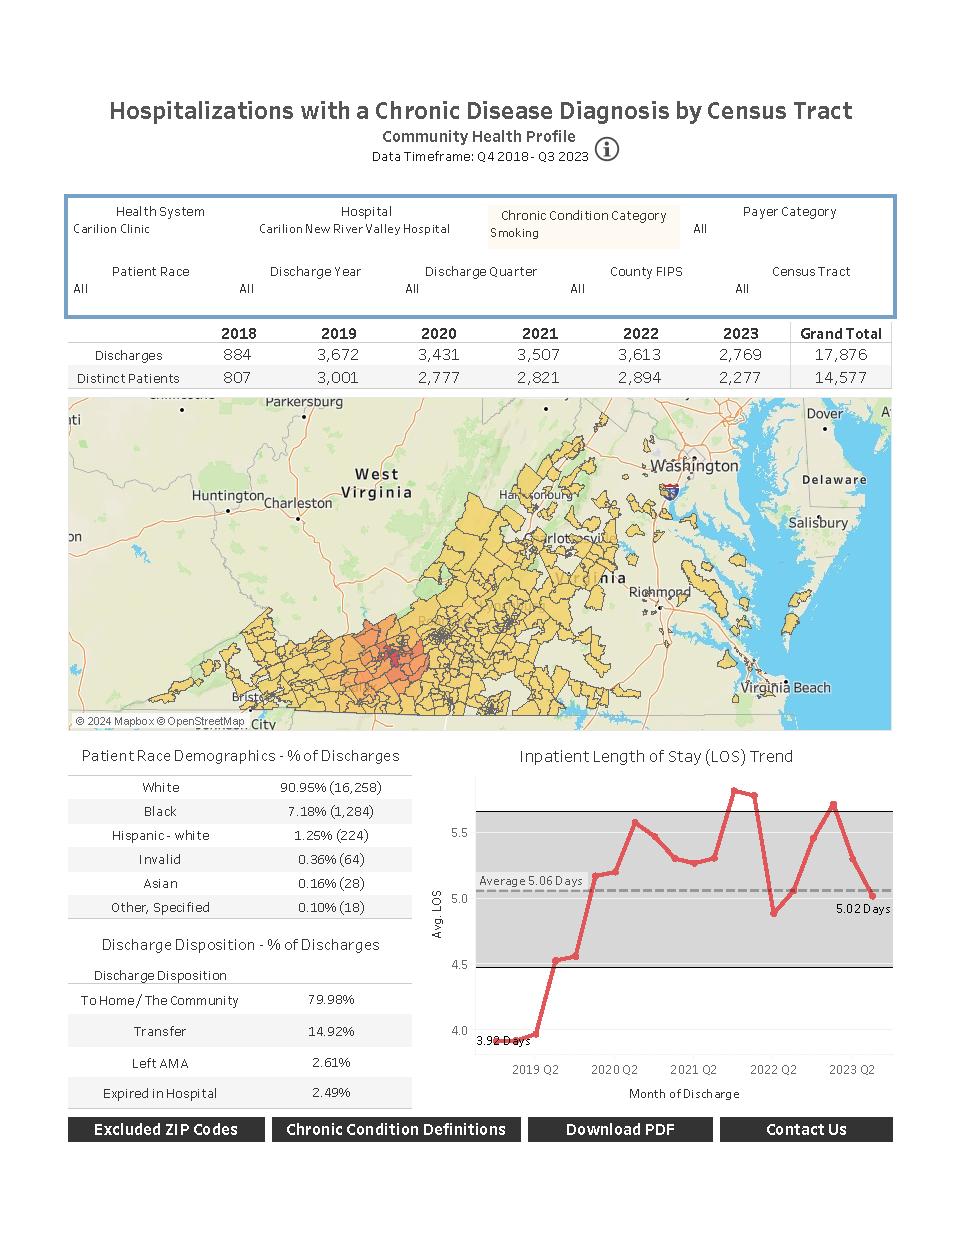
The following pages include secondary data shared with the CHAT as well as chronic disease hospitalization data access through the Virginia Hospital and Healthcare Association (VHHA) Analytics data portal.
Key Takeaways- Secondary Data shared with the CHAT for Data Walk
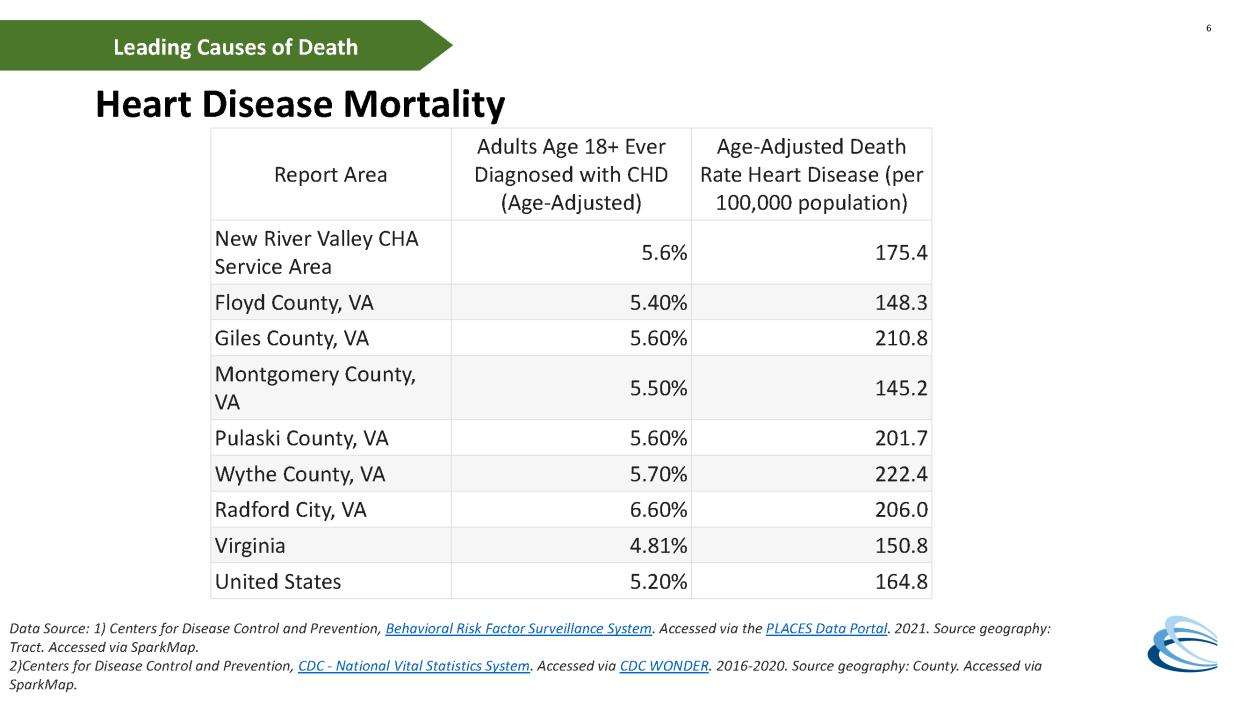
Leading causes of death (2018-2021); generalized across service area
1. Diseases of the heart
2. Malignant neoplasms
3. Chronic lower respiratory diseases
4. Cerebrovascular diseases
5. Accidents (unintentional injuries)
Mental Health/Substance Use
• Overdose deaths variable across service area and much higher in Pulaski County. Trends show increases in all localities since 2018.
Maternal/Child Health
• Teen pregnancy rates high in Wythe, Pulaski, and Giles. 5-year average rates for the Black population in Pulaski are especially high 37 compared to the state average for all teens 12.
• Infant mortality is higher than the state average in both Montgomery and Pulaski Counties.
• Child mortality rate is much higher in Pulaski County and all localities experience a higher rate than that of Virginia’s average.
• Low birth weight is experienced at a much higher weight among black women in Radford city, with notable disparities showing in Pulaski and Virginia.
• Smoking during pregnancy is highest in Giles, Pulaski, and Wythe counties.
Injury/Violence
• Firearm mortality (all cause) is higher than VA averages in Pulaski, Wythe and Giles with the highest in Giles County.
• Fatal motor vehicle crash deaths are highest in Wythe County, where the annual rate is more than twice the Virginia state average.
Infectious/Communicable Disease
• Gonorrhea and chlamydia consistently higher in Radford than the other localities; all localities below the state average in recent years for gonorrhea. All localities except for Radford are below the state average for chlamydia.
• Rate of new diagnosis of hepatitis C infection seems to be on a decreasing trend
Chronic Disease
• Consistently higher rates of cancer and chronic disease mortality are experienced in the NRV community compared to the Virginia state average. o Highest malignant cancer and chronic disease rates seen in Giles County
o Mortality rates for cancer and top chronic diseases are much higher in males than females, except for breast cancer, COPD, and obesity. Note: Montgomery County’s lung cancer rates are less disparate by gender.
o Heart disease mortality is reported four times as often as COPD the next most reported chronic disease.