
CAROLINA PLANNING JOURNAL VOLUME 48 2023 URBAN ANALYTICS
Carolina Planning Journal : Volume 48 / Urban Analytics
The Carolina Planning Journal is the annual, student-run journal of the Department of City and Regional Planning at the University of North Carolina at Chapel Hill.
COPYRIGHT AND LICENSE
© Copyright 2023, Carolina Planning Journal. This work is licensed under a Creative Commons Attribution-NonCommercial-ShareAlike 4.0 International License.
PRINTING
A Better Image
Durham, North Carolina
ACKNOWLEDGEMENTS
Funding for this publication was generously provided by the Nancy Grden Graduate Student Excellence Fund, which supports graduate students working directly with the department’s Carolina Planning Journal, the John A. Parker Endowment Fund, and the North Carolina Chapter of the American Planning Association, and by our subscribers.
CAROLINA PLANNING JOURNAL
Department of City and Regional Planning
University of North Carolina at Chapel Hill
CB #3140, New East Building Chapel Hill, NC 27599-3140 USA
EDITOR-IN-CHIEF
Lance Gloss
EDITORIAL BOARD
Abigail Cover
Kathryn Cunningham
Asher Eskind
Walker Harrison
Sarah Kear
Cameron McBroom-Fitterer
Jo Kwon
Henry Reed
Christopher Samoray
Nicholas Stover
Emma Vinella-Bruscher
GRAPHIC DESIGNER
Lance Gloss
COVER PHOTOGRAPHER
Emma VInella-Bruscher
CONTRIBUTORS
Cynthia Albright
Candela Cerpa
David Dixon
Christy Fierros
Ryan Ford
Henry Maher
Isabel Maletich
Gianluca Mangiapane
Kayla Myros
Jiwon Park
Amy Patronella
Preeti Shankar
Malcolm Smith Fraser
Avinash Srivastava
Isabel Soberal
Jun Wang
www.carolinaangles.com
carolinaplanningjournal@gmail.com
SPECIAL THANKS
The Carolina Planning Journal would also like to thank the many people who have helped us all year long. These people and organizations include ________ from the North Carolina Chapter of the American Planning Association; our faculty advisor Dr. Allie Thomas; DCRP Chair Noreen McDonald; Mike Celeste and the entire team at A Better Image Printing; former Carolina Planning Journal Editor-in-Chief W. Pierce Holloway and Angles
Managing Editor Emma Vinella-Bruscher; Planners’ Forum student leaders Jen Farris, Cameron McBroomFitterer, Maggie Simon, and Laurina Bird; and, of course, all of our subscribers.
2
The University of North Carolina at Chapel Hill
Department of City + Regional Planning
VOLUME 48: URBAN ANALYTICS
CAROLINA PLANNING JOURNAL
3
CONTENTS
FEATURE ARTICLES
10 CITY OPEN DATA PORTALS IN THE UNITED STATES
Kayla Myros
18 REDEFINING SMART: THE ROLE OF TECHNOLOGY AND GOVERNANCE IN INNOVATION
Malcolm Smith-Fraser
26 INTERROGATING SMART CITY PRACTICES: THE SIDEWALK LABS’ QUAYSIDE PROJECT
Jun Wang
32 STRATIFIED COLOMBIA: FORCED DISCRIMINATION OR EMPOWERED SOCIAL HIERARCHY?
Gianluca Mangiapane
38 USING DATA ANALYTICS TO SUPPORT COMMUNITY-BASED ORGANIZATIONS
Cyatharine Alias, Preeti Shankar, and Anna Wolf
48 ERRORS OF OMMISSION: UNDERCOUNTS OF INDIGENOUS PEOPLES AND TRIBAL HOUSING
David Dixon and Harry Maher
56 THE VALUE AND APPLICATION OF DIGITAL DATA FROM LOCATION-BASED SERVICE VENDORS
Cynthia Albright
64 EXPLORING OPTIMUM HOMELESS SHELTER SERVICE DELIVERY
Jiwon Park
DATA VISUALIZATION FEATURES
76 IMPACTS OF URBAN HEAT ISLAND ON RENTERS IN PORTLAND, OR Melissa Ashbaugh
78 VISUALIZING WEATHER-RELATED ROAD CLOSURES IN NORTH CAROLINA
Julia Cardwell
80 NAVIGATING THE PULSE OF SHANGHAI’S DAILY TRANSIT
Xijing Li
06 FROM THE EDITOR 08 EDITORIAL BOARD
Carolina Planning Journal : Volume 48 / Urban Analytics 4
BOOK REVIEWS
82 SOUL CITY: RACE, EQUALITY, AND THE LOST DREAM OF AN AMERICAN UTOPIA
Book Review by Candela Cerpa
84 THE MINISTRY FOR THE FUTURE
Book Review by Isabel Soberal
86 UNDOING OPTIMIZATION: CIVIC ACTION IN SMART CITIES
Book Review by Ryan Ford and Isabel Maletich
88 ARBITRARY LINES: HOW ZONING BROKE THE AMERICAN CITY AND HOW TO FIX IT
Book Review by Amy Patronella
90 BICYCLE / RACE: TRANSPORTATION, CULTURE, & RESISTANCE
Book Review by Lauren Caffe and Kathryn Cunningham
STUDENT WORK
92 BEST MASTER’S PROJECTS
84 MASTER’S PROJECT TITLES Class of 2023
98 YEAR-IN-REVIEW: AN UPDATE FROM NEW EAST
100 NC-APA CONFERENCE ANNOUNCEMENT
VOLUME 49 CALL FOR PAPERS
5
FROM THE EDITOR
LANCE GLOSS is the Editor-in-Chief of the Carolina Planning Journal and a second-year Master’s student in the Department of City and Regional Planning at the University of North Carolina-Chapel Hill. His work spans natural resources, planning, and economic development. He received a B.A. in Urban Studies from Brown University, where he was Managing Editor of the Urban Journal
DEAR READERS,
Times change, these days faster than usual. We live in a world we would not have recognized a decade ago. New technologies infuse every facet of life. Social media, Zoom meetings, artificial intelligence, and cryptocurrencies shake the earth. We all have a high-powered computer in our pocket… unless it happens to be in our hand.
Volume 48 of the Carolina Planning Journal, titled Urban Analytics, takes a close look at how the digital era is transforming the planning profession. Cities, organizers, and businesses across the across the country have more information than ever. They also have new means of analyzing that datathat may offer solutions to age-old problems .
To help our readership come to grips with this change, we assembled work that examines both the best applications of new analytical tools and the ethical conundrums that these tools present.
Some of our authors assess iconic examples of big data in urban planning.
Kayla Myros performs an innovative assessment of Open Data Portals. Municipalities use these platforms to make datasets about urban issues publicly available. She measures the goals of these Open Data Portals against their functionality, showing us which cities get it right.
Zooming out, Malcom Smith-Fraser offers a data scientist’s view on the relationship between innovation, technology, and governance. Crossing borders, Gianluca
Carolina Planning Journal : Volume 48 / Urban Analytics 6
Mangiapane shows how a spatialized approach to public goods provision might be transplanted and adapted from Colombia to Philadelphia, PA.
Jun Wang walks us through the high-profile Quayside smart cities project in Toronto. We learn how Sidewalk Labs—a subsidiary of Alphabet—saw their vision of a data-driven urban future collapse under community pressure.
For a look at how cities and non-profits can leverage technology for the public good, we have articles from the Center for Neighborhood Technology and Jiwon Park. Preeti Shankar and Anna Wolf share what the Center has learned about integrating big data with community knowledge, wherein members of the public participateas co-experts. Jiwon Park offers an excellent example of how GIS technology can make the most of investments in services to the homeless.
For planners working with third-party vendors to use location-based service data, Cynthia Albright provides a detailed guide that clarifies this booming and complex field. Rounding out the volume’s feature articles, David Dixon and Harry Maher dive into the 2020 US Census, showing how the resultant dataset managed to miss fully 5.6% of indigenous Americans living on tribal land.
In a new section this year, we also showcase four innovative applications of data visualization in planning. As always, we bring you a set of book reviews addressing the best work in the field from recent years—including some fiction. Online, you can dive deeper with our Angles blog, managed by the incredible Jo Kwon (a PhD candidate at DCRP).
This year’s cover photo comes from Emma Vinella-Bruscher (a DCRP Masters student and former Managing Editor of Angles). It prompts the same questions that anyone engaged in the digital transformation of urban planning will have asked. As our infrastructure becomes more complex and increasingly abstract, what will be the role of human residents? Will there be room for agency? Or will residents be reduced to shadows, imprinted in abstract form on the digital architecture of the future?
I hope that readers find this volume stimulating and challenging. We are in uncharted territory. While the CPJ cannot hope to provide a map, we have tried to assemble a compass.
Thank you very much for reading.
Lance Gloss
7
EDITORIAL BOARD
The following people are integral to the success of the Journal and its online platform, CarolinaAngles.com:
JO KWON / Managing Editor of Carolina Angles
Jo (Joungwon) Kwon is a fourth-year Ph.D. student in the Department of City and Regional Planning. She is interested in using visuals in plans, specifically in environmental planning. She has been a part of CPJ since 2019. With a background in Statistics and English Literature, she received her M.A. in Computational Media at Duke University. In her free time, she enjoys indie films, live performances, climbing, and drinking coffee.
IAN BALTUTIS / Online Contributor
Ian Baltutis is an inventor, serial entrepreneur, planner, and Master’s student at UNC DCRP. After founding Burlington Beer Works, the first co-operatively owned brewery and restaurant in NC he made the jump into public service when he was elected Mayor of the City of Burlington, NC in 2015. He served 3 terms leading the launch and expansion of the city’s Link Transit bus system, construction of a greenway network, and modernization of planning, zoning, and development ordinances. He is passionate about place-making, walkable communities, and trains. He loves riding trains and visiting railroad museums all around the world.
CANDELA CERPA / Online Content Editor and Incoming EIC
Candela Cerpa is a first-year master’s student in the Department of City and Regional Planning at UNC-Chapel Hill. She is interested in equitable disaster planning, particularly around floods. Born and raised in Uruguay, she received her bachelor of science in Environmental Science and Policy from the University of Maryland, College Park. Outside of work and school, she enjoys cooking and eating good food, listening to audiobooks, and organizing around climate and social issues.
ABBY COVER / Content Editor
Abby is in her first year of the City and Regional Planning Master’s Program, and is looking forward to sharing all she has learned with her future employers. She previously studied Sociology and Gender, Sexuality, and Women’s Studies at the University of Pittsburgh. Before coming to UNC, Abby could be found galivanting through her native Philadelphia (Go Birds!). Her planning interests include climate adaptations, sustainable development, and fostering community engagement. Outside of planning you can find her grabbing a bagel sandwich, watching horror movies, and wishing for better public transit.
KATHRYN CUNNINGHAM / Content Editor and Incoming ME of Carolina Angles
Kathryn Cunningham is a first year Master’s student with the Department of City and Regional Planning whose interests include climate change adaptation, parks, and public space. She studied Environmental Studies at Williams College, and before coming to graduate school, she was in the San Francisco Bay Area managing sustainability projects for a law school. When not in class, she enjoys reading, running, and exploring the Triangle.
ASHER ESKIND / Content Editor
Asher is a first-year DCRP master’s student specializing in transportation planning. He grew up in Charlotte and earned a bachelor’s degree in economics from the University of Colorado Boulder in 2021. His interests within planning include active transportation, rural planning, public land management, and the effects of physical geography on urban spatial organization. You might see him out of breath after biking up Raleigh Road or in the computer lab late at night perfecting a map in ArcGIS Pro. Outside school, Asher is an avid skier and a big road-tripper, having traveled to over forty states and over twenty national parks.
RYAN FORD / Online Content Editor
Ryan Ford is a Master’s student in the Department of City and Regional Planning at UNC Chapel Hill. He is interested in the intersection of urban design and transportation specifically around active mobility. Outside of classes, you can find Ryan playing tennis or catching a movie at Varsity Theater.
WALKER HARRISON / Content Editor
Walker is a second-year master’s student in the Department of City and Regional Planning. He is interested in sustainable mobility, pedestrian safety, and climate resiliency. Walker worked as a planner for Spindale, North Carolina before joining DCRP and currently works for Chapel Hill Planning Department. He enjoys playing mandolin and planning his next bike adventure.
Carolina Planning Journal : Volume 48 / Urban Analytics 8
SARAH KEAR / Content Editor
Sarah is a dual master’s student in the Department of City and Regional Planning at the University of North Carolina at Chapel Hill and in the Nicholas School of the Environment at Duke University. Sarah has interests in sustainable and equitable transportation and its intersection with energy. She received her undergraduate degree from the University of Wisconsin-Madison in political science, gender and women’s studies, and Chicanx and Latinx studies. In her free time, Sarah enjoys trying out different recipes and collecting pottery.
CAMERON MCBROOM-FITTERER / Content Editor
Cameron McBroom-Fitterer is a second year Master’s student in City and Regional planning whose interests include climate change adaptation, coastal hazards, and mass transit. Before moving to Carolina, he was raised in Miami, FL, where he earned an undergraduate degree in History from the University of Miami in Coral Gables. In his free time, Cameron enjoys playing music, watching good films, and supporting his hometown sports teams.
AMY PATRONELLA / Online Content Editor
Amy Patronella is a second year Master’s student in City and Regional Planning. Her upbringing in Houston, TX informs her interest in the nexus of mobility, green space, and climate resilience. She received an undergraduate degree in Political Communication with minors in Public Policy and Sustainability from George Washington University. In her free time, she enjoys reading, biking, and talking Texas politics with anyone who will listen.
HENRY READ / Online Content Editor
Henry Read is a Master’s student in the Department of City and Regional Planning, with a focus on land use policy. He is fascinated with the minutia of development regulation and doesn’t understand why so many people think zoning is boring. He hopes to work in the public sector after graduation and would like to be remembered as the guy who got your town to stop requiring bars to have customer parking and start planting native fruit trees in parks.
NIK REASOR / Online Content Editor
Nik Reasor is a first-year Master’s student in the Department of City and Regional Planning at Chapel Hill where he specializes in Land Use and Environmental Policy. In particular, Nik is interested in climate change adaptation and how to best help disadvantaged communities survive the challenges the future presents. Previously, Nik earned his BA in Sociocultural Anthropology, Medieval studies, and Urban Planning at UNC. You can usually catch him around Chapel Hill biking to local cafes to catch up on work or at the gym coaching UNC’s boxing team.
CHRISTOPHER
SAMORAY / Content Editor
Chris is a doctoral student in the Department of City and Regional Planning specializing in land use and environmental planning. His research interests relate to issues at the coast, including sea level rise, flooding, and storm surge. Chris has a background in marine biology and science communication, having published in several science outlets. Chris earned his Master’s in landscape architecture at the University of Maryland.
NICHOLAS
STOVER / Online Content Contributor
Nicholas Stover is a first-year master’s student at the University of North Carolina, Chapel Hill in the Department of City and Regional Planning. At UNC, he concentrates on land use and environmental planning with interest in the intersection of design and policy. In this area, he is most interested in the effect of policy outcomes on resilience in the built environment, and sustainable development. In his free time, he enjoys woodworking, movie going, and drinking good coffee.
EMMA VINELLA BRUSCHER / Content Editor
Emma Vinella-Brusher is a third-year dual degree Master’s student in City and Regional Planning and Public Health interested in equity, mobility, and food security. Born and raised in Oakland, CA, she received her undergraduate degree in Environmental Studies from Carleton College before spending four years at the U.S. Department of Transportation in Cambridge, MA. In her free time, Emma enjoys running, bike rides, live music, and laughing at her own jokes.
9
CITY OPEN DATA PORTALS IN THE UNITED STATES
KAYLA MYROS
Kayla Myros is currently a master’s student at Harvard University Graduate School of Design, where she is studying urban analytics and planning theory. Her work at the Boston Planning and Development Agency informs her studies on how data and technology are used in planning processes. An advocate of qualitative and quantitative analyses, Kayla explores how technology can create new avenues for participation and co-creation of data between planners and communities.
ABSTRACT
Digital technologies have transformed governance. Open data initiatives are one such major innovation. Also called open government data portals, these platforms publish free, publicly available datasets relevant to the local government, changing the way the residents obtain information from their government. Such initiatives are characterized as fostering government transparency and public participation, and these values are reflected in the missions of government initiatives. But do open data portals embody their mission statements? This study examines the extent to which U.S. municipalities incorporate features into their open data portals that support the stated goals of the initiative. Results show that most cities do not include features to support public participation on their open data portals, with the exceptions of Austin, TX, New Orleans, LA, and Philadelphia, PA. This study calls on planners to become more involved in local open data initiatives. The planning profession has data-analysis and public engagement skills that are critical to the success of open government data.
Carolina Planning Journal : Volume 48 / Urban Analytics 10
OPEN DATA PORTALS
Digital technologies have altered governance and changed what the public can expect—and demand—from their government. Open data initiatives are an example of new forms of government-to-public communication channels. Open data refers to collections of data both publicly-available and government-owned. These datasets are accessible for use and distribution within the public domain (Boston, n.d).
The movement for opening government data has its origins in Web 2.0—also known as the internet-era—in the mid1990s (Chignard, 2013). The internet ethos of this era was for open source, open access, and unrestricted knowledge sharing (Chignard, 2013).
Moving into the new millennium, interest grew to “open up” government data. The broadly stated purpose of open data is to foster government transparency and civic engagement, with the loftier aim of encouraging innovation
and economic development (Janssen 2011, Schalkwyk et al. 2017, Zhu and Freeman 2019, U.S. Data).
In 2009, the Obama administration signed an executive order for an Open Data Policy (ODP), which required that federal government agencies make their data open, readable, and accessible to the public. The policy led to federal agencies publishing internal datasets on publicfacing repositories known as open data portals. The datasets to which the Open Data Policy gave rise became broadly popular and saw quick adoption at the local level.
This growth of open data initiatives prompts us to examine their effectiveness. Immediately, we can see that open data portals have superficially similar designs and functions. This may correspond to the pressures of the open data software market, and aligns with evaluations made by consultants and NGOs.
But are all open data portals in U.S. municipalities the same? Or do cities tailor their open data portals to
FEATURE ARTICLES
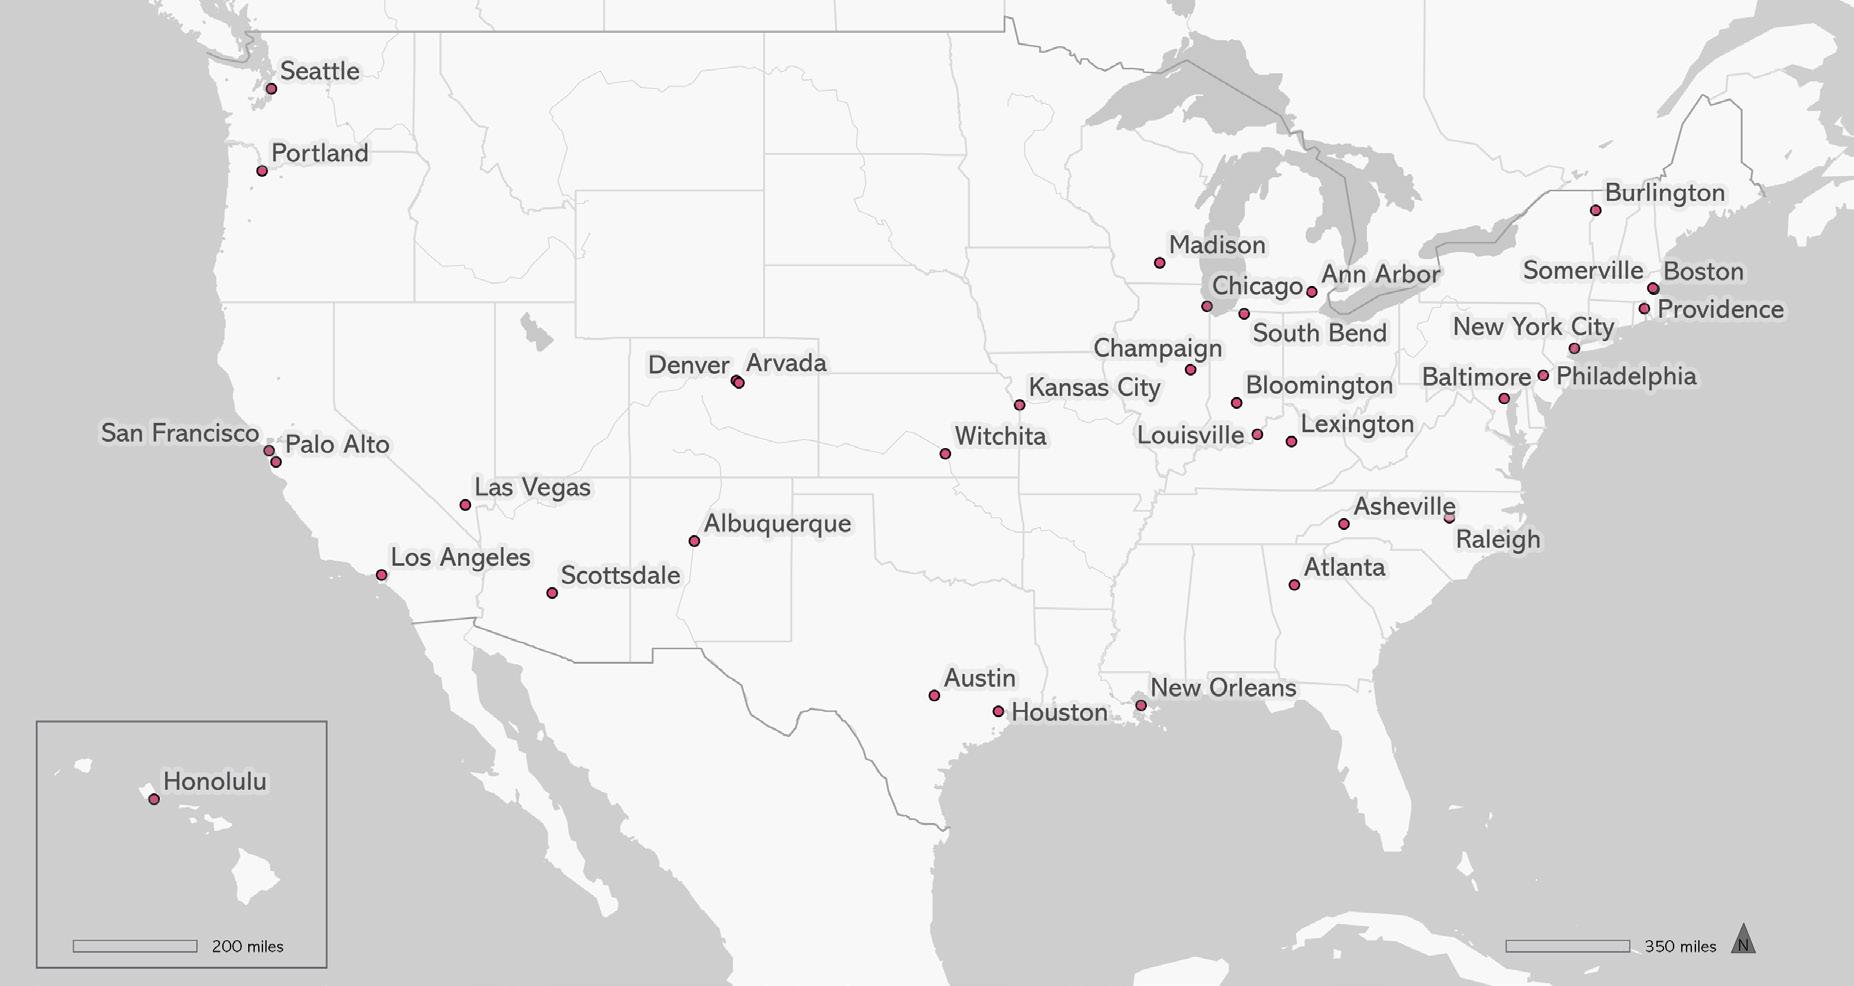
FIGURE 1- A map of 34 US cities with open data portals.
11
Credit: Kayla Myros
reflect differing missions and goals? To what extent do US municipalities design their open data portals to support their stated goals?
(HOW) DO OPEN DATA PORTALS WORK?
Open government data is a 21st century phenomenon addressed by a growing body of academic research. In the recent years, evaluations of open data portals addressed in terms of their implementation, quality, and use. Benchmarking open data at the national level is broad, scoring portals primarily on ease of use and quality of data (Lourenco 2015; Máchová and Lnénicka 2017).
Such benchmarking processes have been adopted at the municipal level in the United States. The foundational study for benchmarking U.S. municipal data portals was Thorsby et. al (2016), which focused on surveying features and content. While Zhu and Freeman (2018) adopted similar metrics, their analysis was weighted to understanding the user interaction interface of open data portals.
Beyond comparisons across different open data portals,
researchers have also evaluated use and outcomes. Wilson and Cong (2021) conducted semi-structured interviews to understand who uses open data; they found that successful open data portals prioritize usability, such as by incorporating easy-to-use features that fosters user interaction and engagement. Lock et al. (2020) researched use-cases for participatory features on open data portals and urban dashboards, such as participatory mapping, realtime surveying, and participatory budgeting to create, in many instances, real-time data.
Leveraging city digital technologies can improve communications between bureaucrats and the public, and it creates a system wherein the public can have more influence over service delivery and in the planning process. Hivon and Titah (2017) and found that public participation is central to the success of open data initiatives. These studies indicate the academic interest in the performance of open data initiatives.
By contrast, only limited research investigates the match between goals and outcomes of municipal open data initiatives. The purpose of this study is to assess
Carolina Planning Journal : Volume 48 / Urban Analytics 12
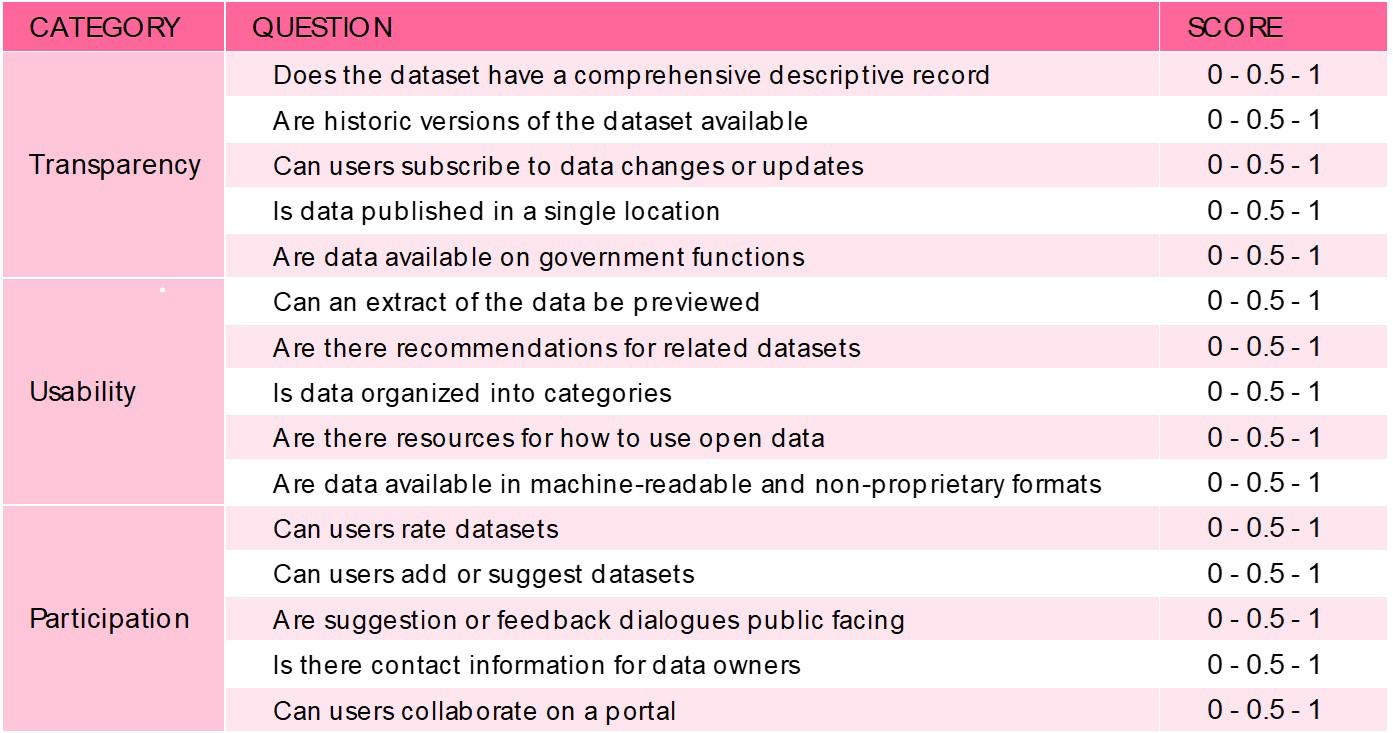
FIGURE 2- The portal evaluation scorecard.
the priorities of municipal data portals for three values: transparency, usability, and participation, and evaluate whether the features on municipal data portals align with the stated goals.
MEASURING FEATURES AND MISSIONS
To measure how well municipal data portals match their stated objectives, this study analyzes features and mission statements for U.S. municipalities. A common study sample for research on U.S. municipal open data is the national register of open data portals from data.gov (Nahon 2015; Thorsby et al, 2017; Zhu and Freeman, 2020). The sample involves 34 cities and towns across the United States, as shown in Figure 1.
Key actors of the open data movement such as the Sunlight Foundation, Open Knowledge Foundation, Code for America, and the U.S. Open Data Initiative identify core values for open data portals. These values are to foster government transparency, end-user accessibility, and public participation. This study aims to qualitatively analyze U.S. municipal open data portals based on if the features and functionality upheld these core values.
It draws from benchmarking and evaluation studies completed by European Commission (2020), Zhu and Freeman (2019), and Máchová and Lnénicka (2017).
The original scorecard below allowed this assessment of features on municipalities’ portals. The sample set of U.S. municipalities’ open data portals are scored for the clear presence (1 point), infrequent presence (0.5), or absence (0) of the features listed in Table 1. A municipality could score a maximum of 15 points if all features were consistently present.
To measure a municipality’s values, mission statements sourced from each portal were rated by three reviewers for the presence of participation, usability, and transparency values. To determine how mission statements aligned with the criteria, raters again used a three-point scale: clear presence (1 point), vague reference (0.5) or clear absence (0).
A given city can receive a top score of three points per value per review, and nine points combined points across all reviewers. Municipalities with no description received a score of zero for the mission statement coding. The mission statements provided to the reviewers were
FEATURE ARTICLES
13
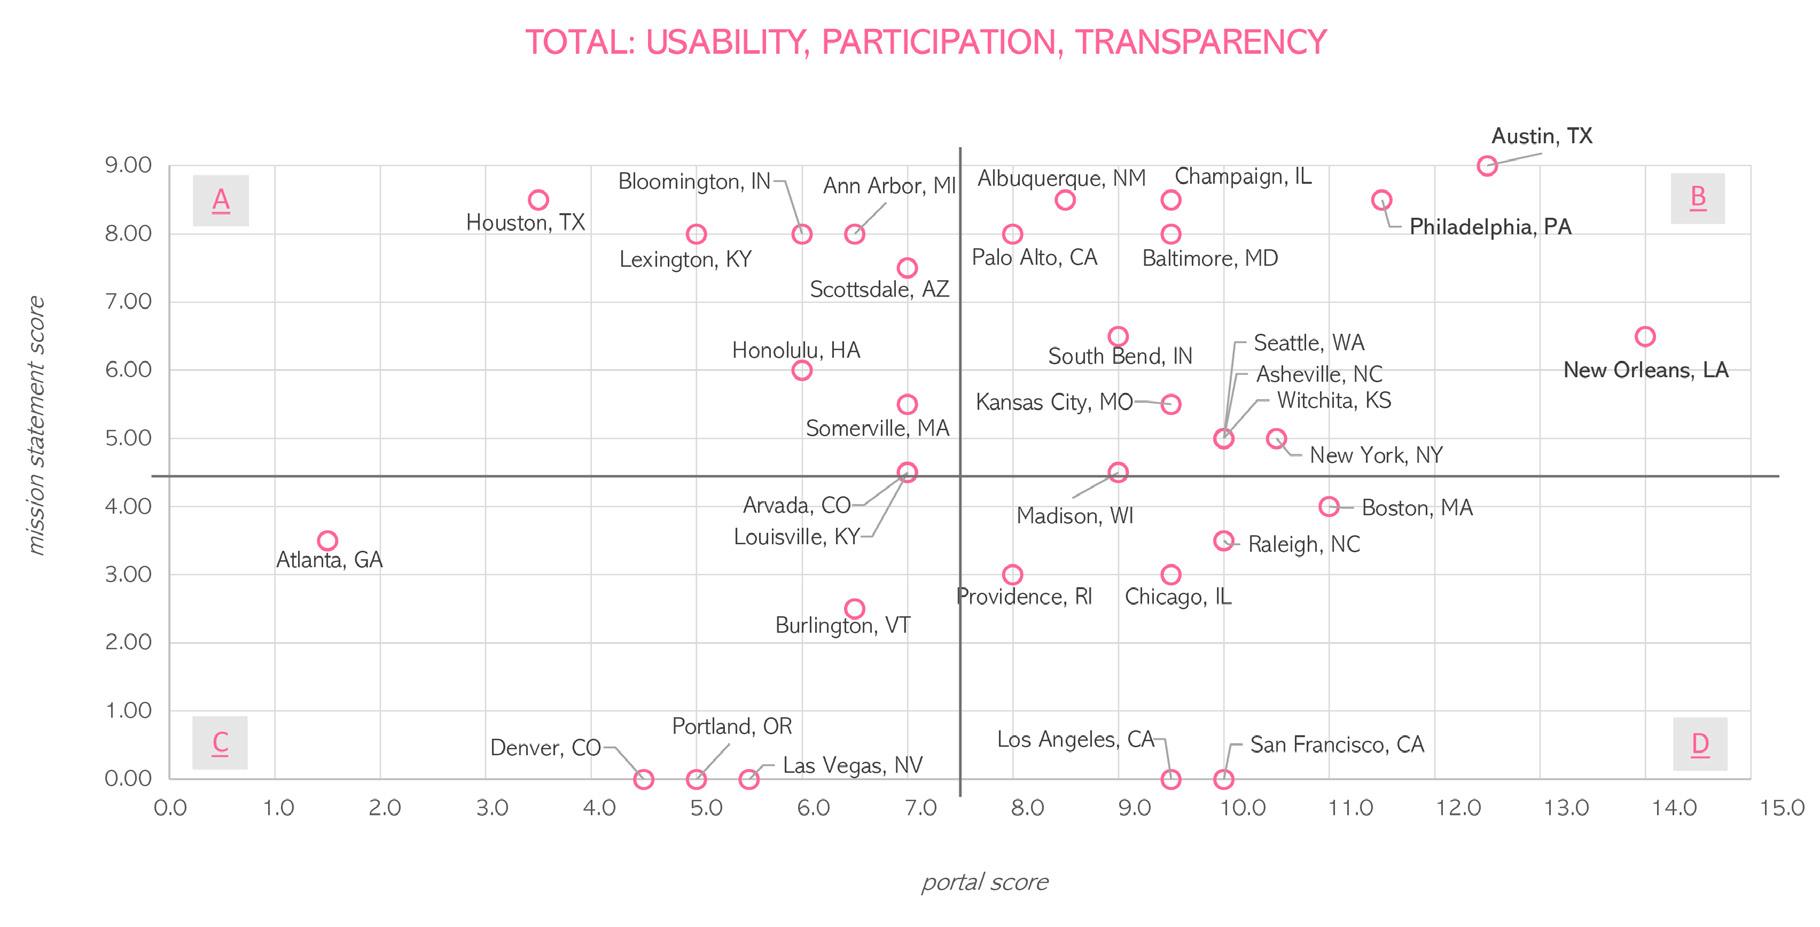
FIGURE 2- Combined value outputs for open data portals against their mission statement scores.
anonymized to limit affinity bias or preconceptions associated with different municipalities.
Thirteen cities had a high match between mission statement values and portal features, as shown in Figure 2. Quadrant B shows a high indication on mission statement and a high indication of portal features, referred to as match. Quadrant C is the inverse of this relationship.
Quadrant A has a high indication on the mission statement but a low portal score. This is a mismatch. The other mismatch shown in quadrant D shows the inverse relationship, with high scores for portal features and low indication on the mission statement.
Most cities surveyed identify transparency as a goal for the open data initiatives. Since government transparency is the
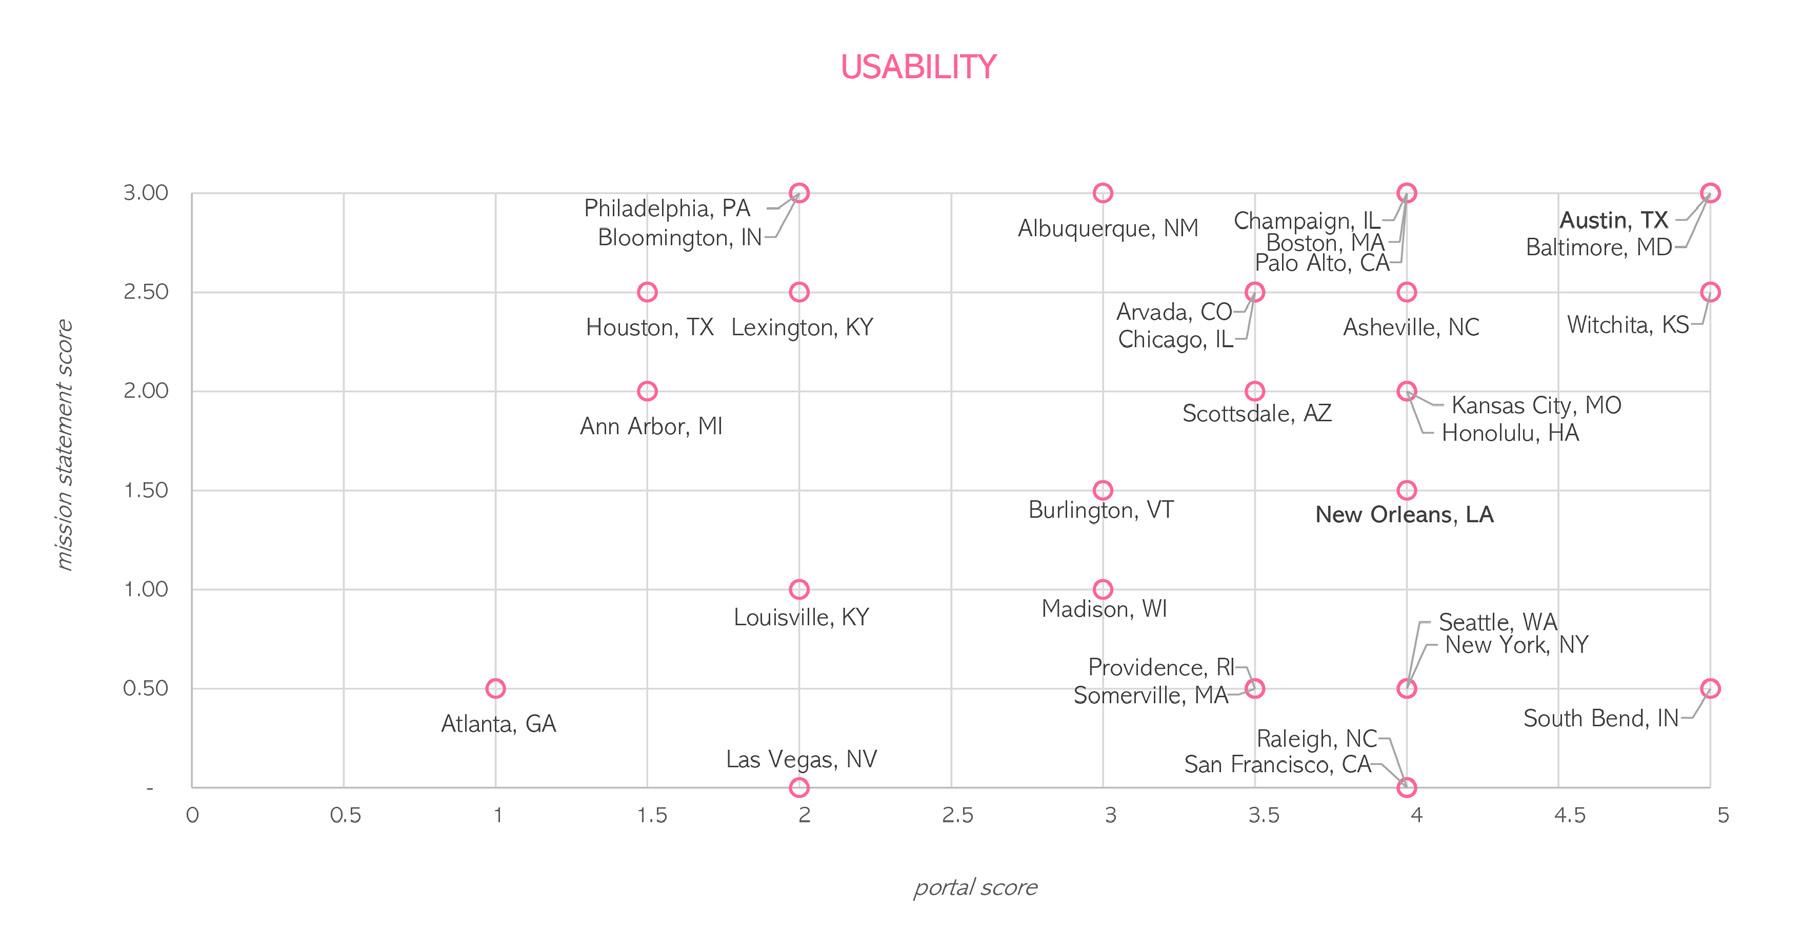
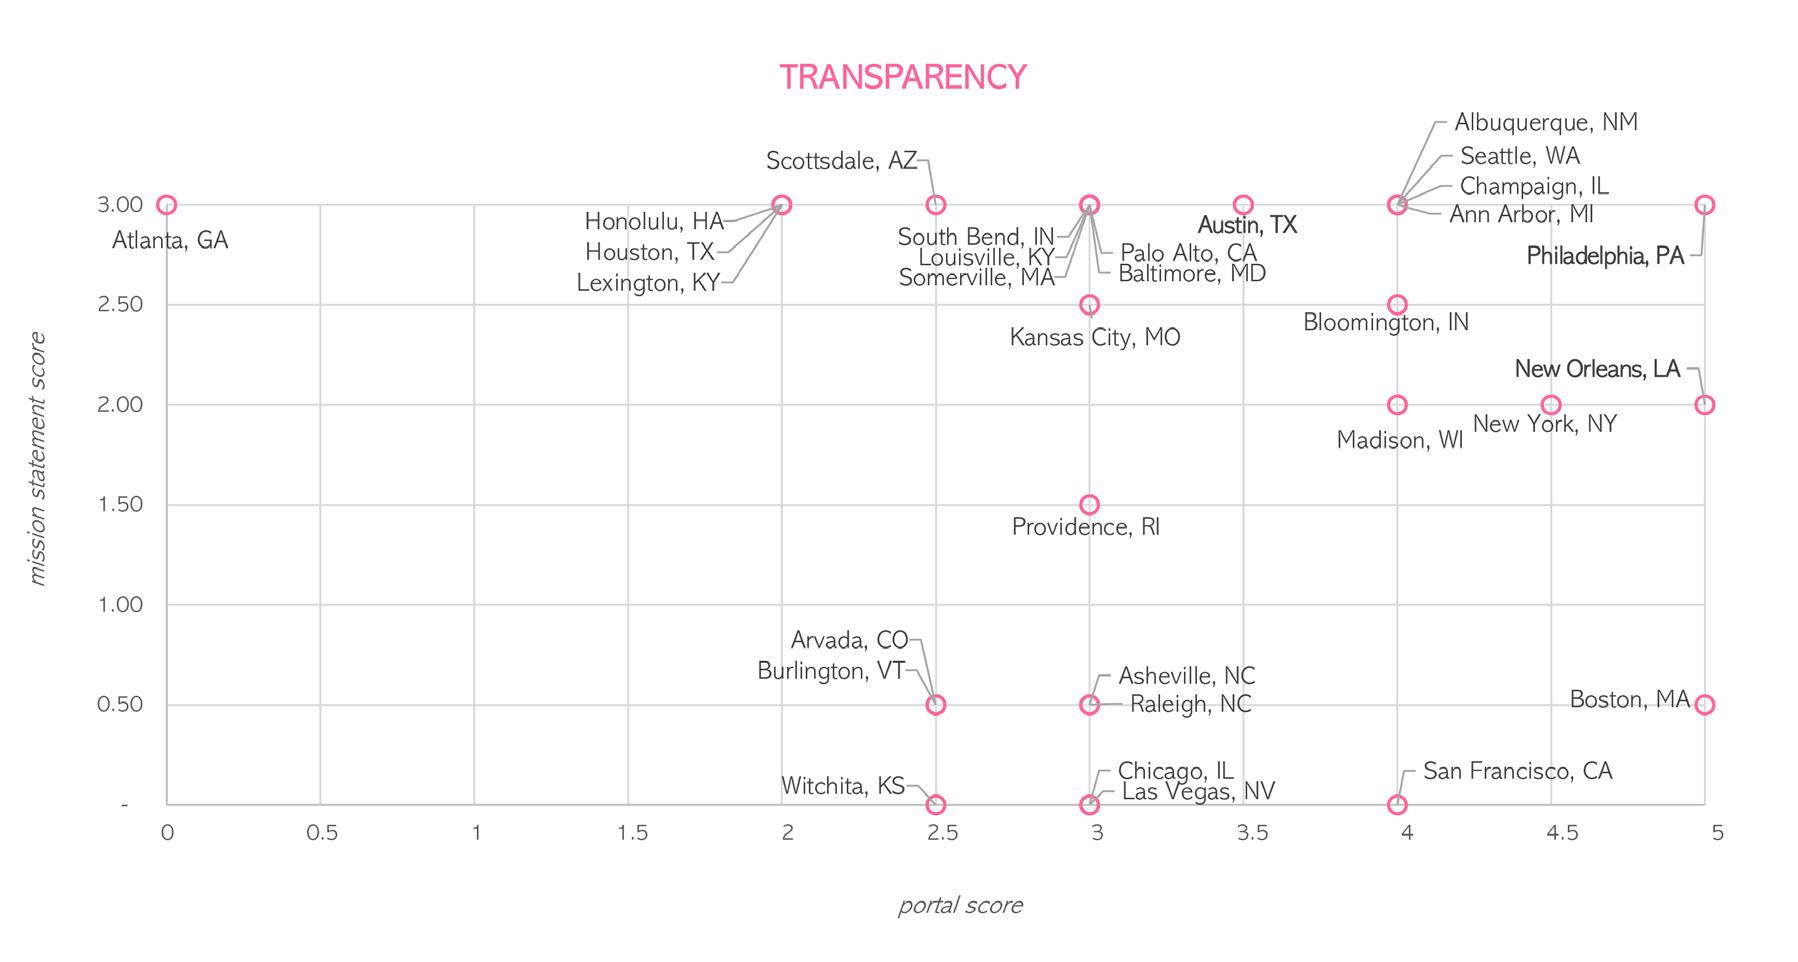 FIGURE 4 - Transparency value outputs for open data portals against their mission statement scores.
Carolina Planning Journal : Volume 48 / Urban Analytics 14
FIGURE 5- Usability value outputs for open data portals against their mission statement scores.
foundational goal for open data initiatives, it is a promising result to see the majority of cities incorporating features that foster greater government transparency. These features include having datasets regarding government operations, budgeting, and decisions. They also offer clear and forthright details about the data origins, owners, and history.
Baltimore, MD and Austin, TX received “perfect” scores in terms of matching usability features on the cities’ open data portals and identifying usability as a goal for their portals. Usability is an inherently necessary feature of open data portals. However, for some cities their portals may function more like a repository of data than an interactive website. The more use-functions that are built into the portal, the wider the audience that is likely to access and use the portal. Correspondingly, a majority of these cites prioritize usability in their portal features as an overall goal of their open data initiative.
Most cities identify public participation or civic engagement as a goal of their open data portals, however few have features to support engagement directly on the
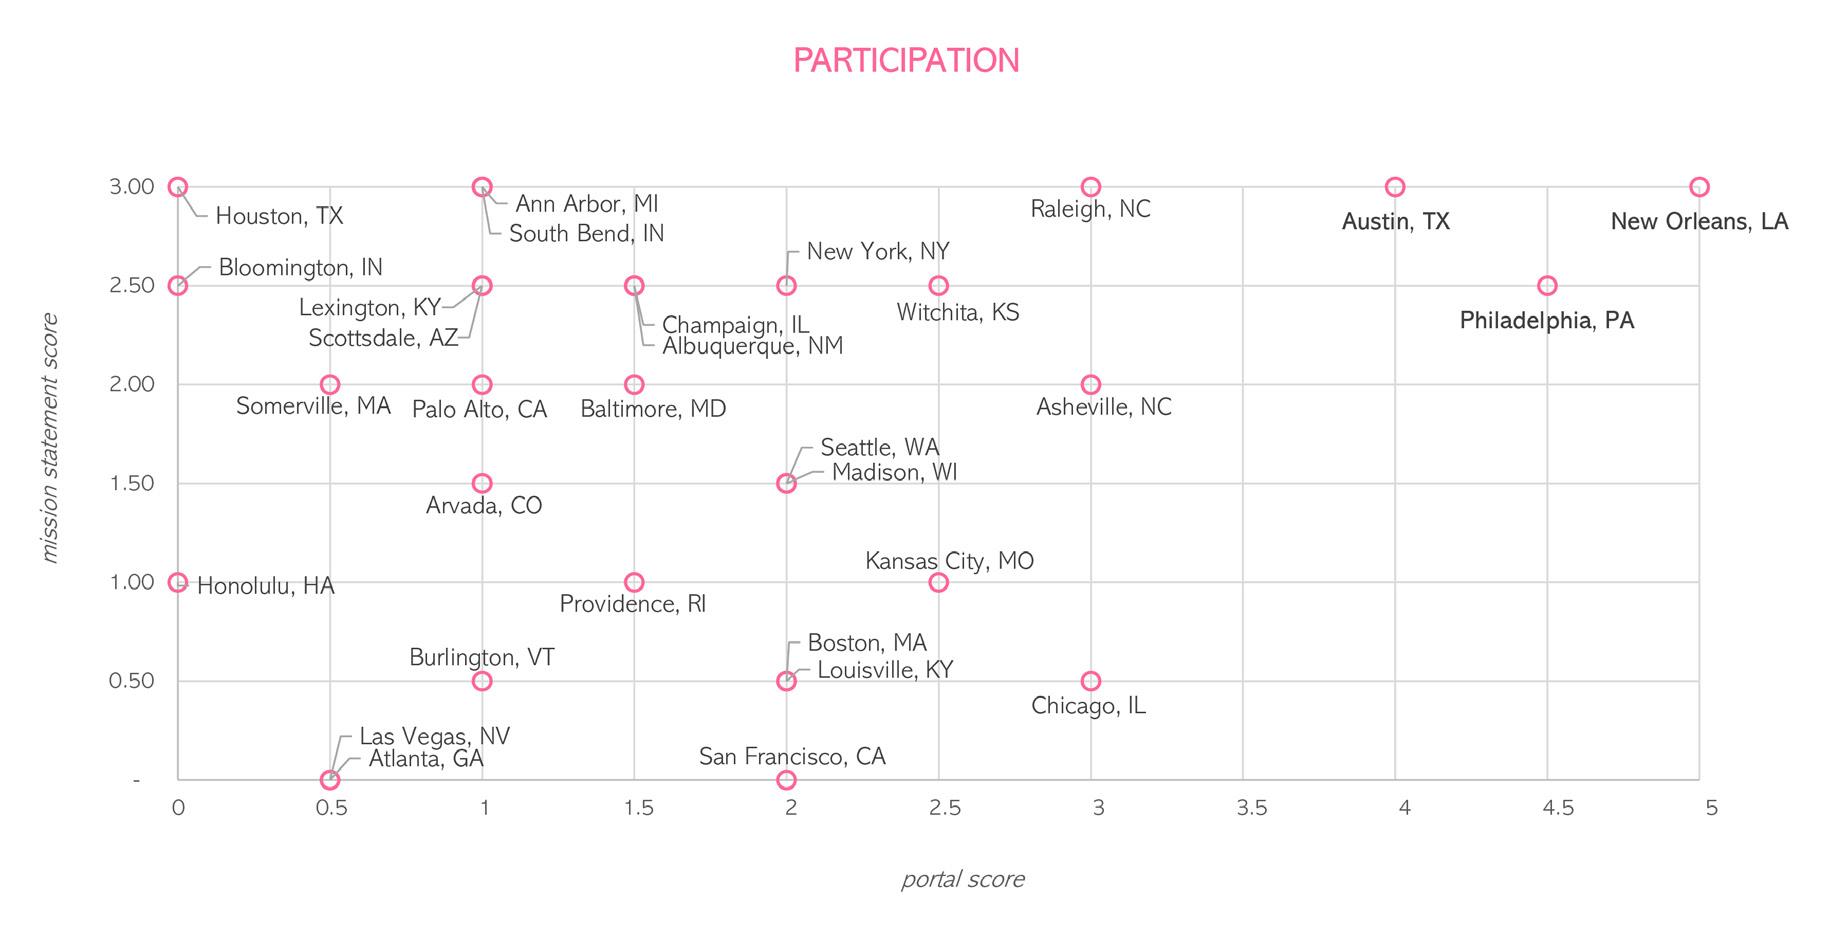
portal. Uniquely, three cities, Austin, TX, New Orleans, LA, and Philadelphia, PA, prioritize engagement as a goal and incorporate participatory and engagement features on the portal. Such features include the ability to suggest a dataset, publicly communicate with data owners, and a public forum or discussion board. A limitation is that this study does not measure how well engagement is achieved, but simply whether it exists as a function on the data portal.
LESSONS FROM EFFECTIVE PORTALS
We see that, while it is a commonly cited goal, participation rarely corresponds to user-friendly features on portals. Open data portals, apparently by default, are designed for a one-way flow of information, despite participation being an explicitly stated goal or outcome of open data initiatives. Very few municipalities or states prioritize a two-way flow of information between the public and the government with open data (Ricker et al, 2020; Lock et al, 2015).
However, the results of this study also emphasize that
FEATURE ARTICLES FIGURE 5 - Participation value outputs for open data portals against their mission statement scores. 15
some open data initiatives succeed in actively fostering usability, transparency, and participation. The three edge cases noted above help us to understand the portals of cities that aspire to accessibility in their missions and deliver in their portal designs. Austin, New Orleans, and Philadelphia are the matches with highest scores on both mission and portal features, but their participatory features look different and are tailored to suit the needs of its constituents.
New Orleans’ portal focuses on engaging residents to improve service delivery. The city’s mission statement includes actionoriented descriptions, such as building an app or developing a website to foster engagement and solve local problems. New Orleans has many interactive dashboard features that demonstrate how one could start these endeavors.
Austin has a growing tech industry, and its mission statement identifies “establishing a system of public participation, collaboration, and accountability.” This is exemplified on the portal’s “Suggest a Dataset” discussion board, where viewers can see suggested datasets and whether they were accepted by the review board. Additionally, Austin has a separate community board where users can discuss data, share information, and post meeting-group details. This site enables users to collaborate and participate in analyses and other programs that use government data.
Philadelphia also features a public-facing discussion board, and it is moderated by both the city and volunteers. Philadelphia’s tech sector is active in shaping the product as the portal was created with a partnership from a local technology non- profit. A further analysis that could be completed is determining the presence of a tech-sector and if it has any influence on the portal design and offerings.
These high-match edge gases reflect aspects of various open data initiatives across the world. In the UK, residents of a Brighton neighborhood were equipped with energy meters to monitor their household’s electricity usage. The individual household data was made public, a local artist painted the streets of the neighborhoods according to the block’s energy consumption. Seeing the results of their energy consumption right outside of their homes, participants were motivated to reduce their usage (Lock et. al, 2020).
In Cape Town, South Africa, activists fostered partnerships between the data-savvy and the general public to understand the current state of service delivery and propose new systems to their local government (Ricker et. al, 2020). Findings from Hivon and Titah (2017) support these engagement projects, suggesting that more hands-on public participation with governmental data is essential for the success of open government initiatives.
PLANNERS’ ROLES IN PARTICIPATORY DATA
This supports a case for planners to further involve themselves in open data to improve public engagement. Planning professionals possess a unique skillset that is valuable to the effectiveness and success of open data initiatives. Whether or not a planner is employed in their local municipality, there are many ways that one can become involved to elevate the usefulness and power of open data within their communities. For example, planners have data-analysis skills and can work to develop tools and resources that makes using data more approachable and accessible.
When open data initiatives began in the late 2000s, there was not much guidance beyond ‘make internal datasets public facing’ on a website. The call to action came and was executed before there were proscriptions on what to include and how to design the platform. Now, as many of the initiatives are mature, it’s a perfect time to reflect and evaluate how the initiative is successful and how the portals are useful to the public.
Open government data initiatives are complex; they involve many government agencies and require data analysts and IT specialists to prepare data and launch a site. For this reason, evaluations have come from a technologist perspective—but planners have formal training in meaningful public engagement and the value of transparent government processes.
For that reason, planners should get more involved in thinking about, designing, and promoting open data initiatives in their municipalities. Imagine, a planner can support local open data initiatives by joining the team or
Carolina Planning Journal : Volume 48 / Urban Analytics 16
giving feedback; they could leverage open data in planning initiatives; or planners could use the portal as a tool to engage with communities—like co-creating data about a community issue.
Planners should be inspired to assess the state of their local open data initiative. If your city showed up on this analysis with less than stellar results, maybe this is a sign to work with your local municipality. Or if your city didn’t show up at all, perhaps this is the sign to start an initiative in your town or city, guided by some precedent setting cities. Planning is an iterative process as is creating a useful and successful open data portal, it is an exciting prospect to think about the evolution of the portals as more planners become actively involved.
Kuk, George, and Marijn Janssen. 2011. “The Business Models and Information Architectures of Smart Cities.” Journal of Urban Technology 18 (2): 39–52. https://doi.org/10.1080/10630732.2011.601109.
Lock, Oliver, Tomasz Bednarz, Simone Z. Leao, and Christopher Pettit. 2020. “A Review and Reframing of Participatory Urban Dashboards.” City, Culture and Society 20 (March): 100294. https://doi.org/10.1016/j. ccs.2019.100294.
Lourenço, Rui Pedro. 2015. “An Analysis of Open Government Portals: A Perspective of Transparency for Accountability.” Government Information Quarterly 32 (3): 323–32. https://doi.org/10.1016/j.giq.2015.05.006.
Máchová, Renata, and Martin Lnenicka. 2017. “Evaluating the Quality of Open Data Portals on the National Level.” Journal of Theoretical and Applied Electronic Commerce Research 12 (1): 21–41. https://doi. org/10.4067/S0718-18762017000100003.
Nahon, Karin, Alon Peled, and Jenniver Shkabatur. 2015. “OGD Heartbeat: Cities’ Commitment to Open Data.” JeDEM - EJournal of EDemocracy and Open Government 7 (2): 116–36. https://doi.org/10.29379/jedem.v7i2.410.
“Open Government Data: Towards Empirical Analysis of Open Government Data Initiatives.” 2013a. OECD Working Papers on Public Governance 22. Vol. 22. OECD Working Papers on Public Governance. https://doi.org/10.1787/5k46bj4f03s7-en.
“———.” 2013b. OECD Working Papers on Public Governance 22. Vol. 22. OECD Working Papers on Public Governance. https://doi. org/10.1787/5k46bj4f03s7-en.
Publications Office of the European Union. 2020. Sustainability of (Open) Data Portal Infrastructures: Open Data Portal Assessment Using User Oriented Metrics. LU: Publications Office. https://data.europa.eu/ doi/10.2830/51660.
Ricker, Britta, Jonathan Cinnamon, and Yonn Dierwechter. 2020. “When Open Data and Data Activism Meet: An Analysis of Civic Participation in Cape Town, South Africa.” The Canadian Geographer / Le Géographe Canadien 64 (3): 359–73. https://doi.org/10.1111/cag.12608.
WORKS CITED
Bennett, Abbie. “Sunny day flooding’ worsens at NC beaches — a sign sea Chignard, Simon. 2013. “A Brief History of Open Data,” Paris Tech Review.
Gagliardi, Dimitri, Laura Schina, Marco Lucio Sarcinella, Giovanna Mangialardi, Francesco Niglia, and Angelo Corallo. 2017. “Information and Communication Technologies and Public Participation: Interactive Maps and Value Added for Citizens.” Government Information Quarterly 34 (1): 153–66. https://doi.org/10.1016/j.giq.2016.09.002.
Hivon, Julien, and Ryad Titah. 2017. “Conceptualizing Citizen Participation in Open Data Use at the City Level.” Transforming Government: People, Process and Policy 11 (1): 99–118. https://doi.org/10.1108/TG-12-2015-0053.
Hoe‐Lian Goh, Dion, Alton Yeow‐Kuan Chua, Brendan Luyt, and Chei Sian Lee. 2008. “Knowledge Access, Creation and Transfer in E‐government Portals.” Online Information Review 32 (3): 348–69. https:// doi.org/10.1108/14684520810889664.
Thorsby, Jeffrey, Genie N.L. Stowers, Kristen Wolslegel, and Ellie Tumbuan. 2017. “Understanding the Content and Features of Open Data Portals in American Cities.” Government Information Quarterly 34 (1): 53–61. https://doi.org/10.1016/j.giq.2016.07.001.
Wilson, Bev, and Cong Cong. 2021. “Beyond the Supply Side: Use and Impact of Municipal Open Data in the U.S.” Telematics and Informatics 58 (May): 101526. https://doi.org/10.1016/j.tele.2020.101526.
Zhu, Xiaohua, and Mark Antony Freeman. 2019. “An Evaluation of U.S. Municipal Open Data Portals: A User Interaction Framework.” Journal of the Association for Information Science and Technology 70 (1): 27–37. https://doi.org/10.1002/asi.24081.
Zuckerman, Ethan. n.d. “What Is Digital Public Infrastructure?,” 20.
Zuiderwijk, Anneke, and Marijn Janssen. n.d. “Participation and Data Quality in Open Data Use: Open Data Infrastructures Evaluated,” 9.
FEATURE ARTICLES
17
REDEFINING ‘SMARTNESS’
Urban Technology and the Need for Collaboration
MALCOLM SMITH-FRASER
Malcolm currently works as a machine learning data scientist at DoorDash. He is skilled at applying a variety of data analysis tools and programming languages, including Python, SQL and Matlab. Prior to DoorDash, Malcolm has worked in international development roles with Sankofa and through internships in Ghana and Kenya, focused on promoting innovation and entrepreneurship among youth, and assisting in agriculture and biosciences research. Malcolm holds a Master’s in Interdisciplinary Data Science from Duke University and a Bachelor of Science in Biomedical Engineering from California Polytechnic State University, San Luis Obispo.
ABSTRACT
The development of effective urban technologies requires that we center thoughtful problem solving rather than blind technological integration. In pursuit of this goal, conversations around urban tech could benefit from extending beyond theory towards intentional application. This is not a recommendation, but a requirement for ensuring that new technologies are problem focused, and context specific—and thus deserving of being labeled “smart.” Furthermore, data, engineering, and urban professionals all need a seat at the table during every phase of the development process, from design to deployment and monitoring. Urban analytics presents opportunities for innovating established systems and creating more efficient cities. In addition to this, innovative technical collaboration methodologies should be explored.
Thankfully, urban and data researchers have developed a compatible set of tools for appropriately directing the “smartness” of our initiatives. In showing the similarities between the smart urban governance framework developed by Jiang et al. and ethical data and AI practices, this article hopes to empower data and urban professionals to initiate the cross-sectoral conversations needed to direct contextual-tuning and guardrail-setting processes.
Carolina Planning Journal : Volume 48 / Urban Analytics 18
REDEFINING ‘SMARTNESS’
No matter the amount of wishful thinking, algorithms and technology are not magic. ChatGPT the conversational AI, DALLE-2 the AI artist, and other neural networkbased models are all the rage—but their capabilities are enabled by a robust, intentional training and guardrailsetting process designed to meet a relatively standard and generalizable set of expectations. As these technologies make their way into products we regularly interface with, their utility and fairness will depend on how they are finetuned and on the thoughtfulness of the guardrails coded into them. Unfortunately, many smart initiatives do the opposite—emphasizing tech as a source of truth rather than a thoughtful solution that leverages technology as the powerful tool it is.
The urban sector is not safe from these challenges. In fact, many smart urban governance initiatives are isolated from the governance frameworks into which they are deployed. This reality is often rooted in the divergent goals of local governance actors seeking solutions and their tech partners tasked with building tools. From the technologists’ perspective, such a disconnect can result in undesirable effects such as algorithmic bias or trust and privacy issues. For urbanists, it means technocratic decision-making that ignores the intricacies of the diverse populations they support.
Concerns around technocratic governance are often rooted in ethics, and thus the teachings of ethicists from technology and urban sectors are rife with lessons. A prominent recommendation centered by emergent strategies from both domains is that of an effective governance structure. Without effective structure, the end result is the same: a technological intervention that not only fails to achieve its desired outcome, but that enables the perpetuation of the underlying biases and inequities we often look towards technology to eliminate.
A FRAMEWORK FOR SMART URBAN GOVERNANCE
In 2019, urban scientists at Utrecht University proposed a smart urban governance framework made up of three components . Born out of an analysis of smart city projects from across the globe, the framework is designed to help urban governance practitioners avoid the pitfalls of technocratic governance by integrating “the ‘smart’ from smart governance literature” with “the ‘urban’ from urban governance literature”(Jiang et al., 2020b). Importantly, the role of technology within the framework is that of a tool to support the process, rather than a source of “smartness.”

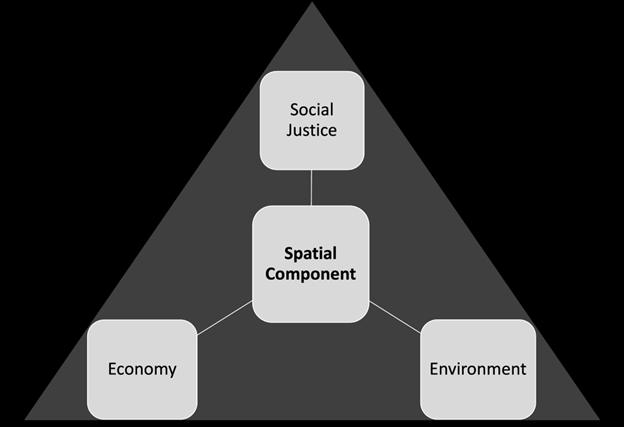
SPATIAL COMPONENT
The spatial component relates to what interventions are targeting, promoting the idea that the focus of any urban project should be on addressing specific urban challenges. Rather than merely focusing on the problem-solving powers of technologies (e.g., big data solutions, city sensors, or intelligent infrastructure), practices might focus on how urban challenges demand the functional support of technological innovations.
While this might seem straight forward, we must consider the complex requirements for effectively addressing urban issues - including but not limited to problem identification, prioritization, and resourcing. For a city whose explicit goal is to “grow the economy, distribute growth fairly, and in the process not degrade the ecosystem,” the spatial component involves balancing economic, social, and environmental goals (Jiang et al., 2020b).
FEATURE ARTICLES
19
FIGURE 1 - Smart Urban Governance Framework, adapted from Jiang et al., 2020b.
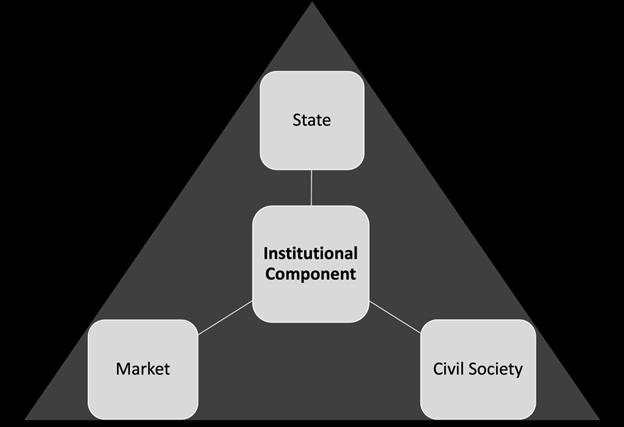
INSTITUTIONAL COMPONENT
The institutional component is based on the idea that continuous input and contribution from various groups is required for an intervention to truly be “smart.” More than just town halls centered on discussing proposed initiatives, the authors of the framework emphasize that in order to successfully address the most pressing urban issues, “actors from the state, market, and civil society have to collaborate in innovative ways.” This position contrasts with the technocratic notion of smart governance, which focuses on either the government or the private sector to provide innovative solutions.
The Smart Ulaanbaatar Program and the Hangzhou City Brain Project —two of the case studies that guided the development of the framework— both illustrate the importance of a balanced institutional component and demonstrate how that balance varies in different urban contexts.
Smart Ulaanbataar was a 2014 initiative with the goal of revitalizing Mongolia’s capital city. Fighting a stagnant economy since the fall of the Soviet Union and deteriorating infrastructure due to disorderly expansion, Ulaanbaatar officials sought to address a wide range of urban challenges. Ulaanbaatar’s plan had an adequate spatial component— targeting core needs like public housing, emergency services, social welfare, food subsidies, and energy.
Unfortunately, the institutional component of the plan was lacking. A gap in local technological capacity resulted in state partnerships with foreign tech companies who, in turn, took full control of introducing and implementing technological innovations in the city. Voices representing the perspectives of residents were not included, resulting in a suite of technologies that the local population did not have the digital literacy nor the connectivity to fully utilize (Jiang et al., 2020a).
In 2017, city officials in Hangzhou, China proposed the City Brain initiative with the help of local tech giant, Alibaba. The goal of City Brain was to address challenges caused by the city’s rapid economic development. A major idea behind the initiative was to diagnose challenges in the city, in particular
serious traffic congestion, like one would diagnose a disease. This would be achieved with a big data approach to the collection, processing, and analysis of traffic operation data. Similar to Smart Ulaanbaatar, the City Brain initiative also lacked a participatory component for local residents. However, the outcomes highlight the importance of local context. Hangzhou is a city with well-established ties between universities, tech companies, and the government. Even though this network of relationships has historically not prioritized input from the general public, it was able to be successfully leveraged to address Hangzhou’s goal of decreasing traffic congestion (which has been cut by 15 percent) (Jiang et al., 2020a).
Both of these examples demonstrate a technocratic approach to addressing a specific urban challenge. Where Smart Ulaanbaatar fell short in meeting an explicit need, City Brain failed in achieving a solution that also fostered local trust, with one survey reporting that nearly 80 percent of respondents were concerned with the impact of City Brain on their privacy (Toh & Erasmus, 2019). Researcher Ezra Ho points out that “the neoliberaldevelopmental logics of the state [to a large degree] facilitate authoritarian consolidation” (Ho, 2016).
This is a reality that could result in an initiative’s catastrophic failure if implemented in a local context that is openly hostile towards authoritarian governance. A desire to avoid technocratic governance is rooted in a
Carolina Planning Journal : Volume 48 / Urban Analytics 20
FIGURE 2- Spatial component of the Smart Urban Governance framework, adapted from Jiang et al., 2020b.
belief that equity and fairness are core values, and it is through the institutional component that local values can integrate into solutions.
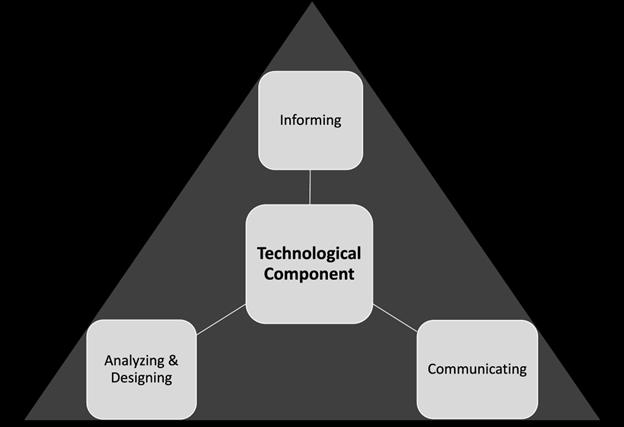
TECHNOLOGICAL COMPONENT
The technological component relates to the functional intelligence of a tool. In essence it stresses that technology does not have to (and often should not) be the primary solution to the challenge at hand. Rather, how we use technology should serve to facilitate robust spatial and institutional components by providing urban actors with the proper support capabilities to deal with the diverse urban challenges they face. These technologies are categorized into three groups: informing; communicating; and analyzing and designing.
Informing technology is designed to make governancerelated knowledge and information accessible and interpretable. This could be a website or public application that interfaces with a project. Communicating technology is designed to facilitate communication and discussion processes between those involved in governance by supporting those flows of information. It is these first two goals that enable the innovative collaboration required by the institutional component.
Analyzing and designing technologies, often referred
to as planning support systems (PSS), are “intended to facilitate the advanced processing of data to detect urban patterns and the underlying processes, in order to facilitate the perception, creation, and presentation of design ideas” (Jiang et al., 2020b). For example, if an urban governance initiative aims to reduce homelessness, technology in this category would aid in measuring and tracking homelessness in the city.
The components of the smart urban governance framework are intended to work together to help urban governance practitioners create impactful innovations that are community-based, context-driven, and fair. As we look towards further integrating analytics and other forms of data-driven technologies into the urban sector, it is important to understand how the components in this framework align with strategies within the tech sector to better enable collaboration.
ETHICS, FAIRNESS, AND BIAS
As the applications for data-driven technology continue to broaden, the ethics of artificial intelligence has been a popular topic. Questions around algorithmic bias and transparency are two areas where data ethics research has been focused.
Technology might often be considered the holy grail of unbiased decision-making. In reality, any recommendation output by a piece of technology comes coded with the same biases present in the data or the scientist. When outcomes are systematically less favorable to individuals in a particular group and when there is no relevant difference between groups to justify such harms, the system generating those outcomes is considered biased. We might define unbiased (or at least bias-aware) technology more succinctly as fair technology.
Bias finds its way into our algorithms and systems in a wide variety of ways, but avoiding algorithmic bias begins with asking the right questions (Mehrabi et al., 2022). As Vincent Warmerdam, a founder of PyData Amsterdam points out in his appropriately titled presentation The profession of solving (the wrong problem), “algorithms
FEATURE ARTICLES
21
FIGURE 3 - Institutional component of the Smart Urban Governance framework, adapted from Jiang et al., 2020b.
are sort of starting to distract us from what we’re actually supposed to do.” While there can be a great deal of hype surrounding the next new algorithm, Warmerdam makes the argument that “it’s all the stuff around the algorithm that is actually the solution” (Warmerdam, 2019).
While Warmerdam focuses primarily on challenges in tech industry operations, data ethicist Ruha Benjamin brings this same perspective to challenges faced by urban governance practitioners. Benjamin—whose work on innovation and equity focuses on the intersection of race, justice, and technology— states that truly fair technology is not achieved by attempting to rebalance biased outcomes downstream, but must start at (or before) a problem is defined. Creating or searching for a dataset without obvious biases may be necessary to a point, but this should never overshadow the need to evaluate why the systems we attempt to automate have left us with so many biased datasets to begin with. This theme is echoed by clinical technology ethicists such as Llana James and Dorothy Roberts (Tang, 2021; Roberts, 2011).
In the context of urban technology, predictive policing systems like PredPol have been viewed as controversial because of runaway feedback loops and their potential to perpetuate historical biases in the criminal justice system (Ensign et al., 2018). Additionally, the rapid adoption of these tools suggests bias towards the assumption that increased law
enforcement and mass incarceration are adequate proxies for how safe a city is.
Regardless of any personal perspectives around that assumption’s validity, a common theme in data ethics literature is the importance of revisiting our guiding assumptions and North Star metrics. Another tool, The City of Boston’s Street Bump application that uses crowdsourcing to better identify potholes for maintenance prioritization, was also a victim of unintended algorithmic bias (Niu & Silva, 2020; Crawford, 2018). Street Bump relied on data from drivers actively using the smartphone app. Without an adequate focus on ensuring broad access and usage of the application, it inadvertently excluded more elderly and resource-poor parts of the city, where first adopters of the app did not frequent and where smartphone ownership is lower.
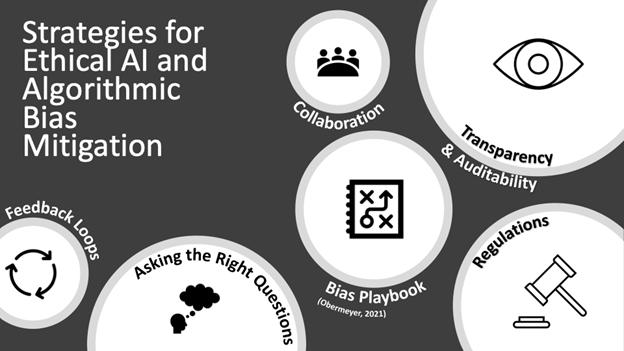
Tackling issues in this domain requires a focus on questions and design—a focus that can be gained through the smart urban governance framework. Systems like Ziad Obermeyer’s Algorithmic Bias Playbook move beyond the planning stage, laying out strategies for stakeholder engagement as well as techniques for target variable identification, bias evaluation and avoidance, and best practices for retraining or terminating a model (Obermeyer et al., 2021). These aspects of the playbook directly map to the institutional and technological components of the smart urban governance framework, just within a new problem space of data and technology.
ACCOUNTABILITY
Trust is an often-overlooked aspect of an interaction. Central to trust is accountability, which demands access to information. Our ability to peek inside the black box and interrogate inputs and outputs, along with a governance structure that enables actors to make changes when things behave undesirably, is crucial for accountability. Transparency, auditability, and feedback loops are three practices that data ethicists point to as a means to hold data-driven systems accountable.
Transparency defines our ability to look inside a process
Carolina Planning Journal : Volume 48 / Urban Analytics 22
FIGURE 5 - Technological component of the Smart Urban Governance framework, adapted from Jiang et al., 2020b.
or algorithm. Closely related is the idea of auditability, which focuses on the collection of data to enable robust interrogation of the system. Feedback loops relate to our ability to protest or challenge an algorithm when an output seems erroneous. In the face of a complaint claiming bias in an algorithm, it is not enough to conclude that a system is void of racial and gender bias simply because information on race or gender was never collected.
This is because factors like ZIP code or height and weight can be proxies for race or gender, respectively. To make any conclusion, we need to have the ability to compare outputs across race and gender, which requires that we collect information about these characteristics. This capacity to make an evidence-based conclusion is what we call auditability. Not only do these three factors emphasize the importance of moving away from “magical” black box algorithms, but they also emphasize addressing the power dynamics in the development process.
Outside of the tech giants, technology development is typically outsourced, with access to algorithms often blocked by proprietary clauses. Northpointe’s (now Equivant) COMPAS system, an algorithm designed to predict recidivism for inmates up for parole, is a perfect
illustration of the challenges this can present. Since it was deployed nearly a decade ago, multiple articles and papers have been published arguing the ethics and effectiveness of the COMPAS algorithm. Most notably, a 2016 analysis by ProPublica found that the algorithm was racially biased (Larson et al., 2016). In 2020, Cynthia Rudin, a renowned machine learning researcher at Duke University, published a contradictory report that called out a deeper issue: the system’s lack of transparency (Rudin et al., 2020).
This lack of transparency eroded trust at two levels. First, defendants and their lawyers were legally denied access to any information about how the risk scores that played pivotal roles in their judgments were generated. Take the case of Glenn Rodriguez, who was denied parole almost entirely on the basis of a high COMPAS score despite having an otherwise clean record. Rodriguez and his attorney suspected that the high score was due to a clerical error in one of the 137 inputs to the algorithm, but without access to the inner workings of the COMPAS system they were unable to investigate that claim (Wexler, 2017).
Second, the proprietary nature of the algorithm severely limited the rigor in which any third-party investigation
FEATURE ARTICLES
7 - xxx 23
FIGURE
could be conducted. Blocked from accessing the true design, ProPublica investigators made various assumptions about how the 137 COMPAS inputs generated risk scores. Rudin elaborates that “faulty assumptions about a proprietary model led to faulty conclusions that went unchecked until now. Were the model transparent in the first place, this likely would not have occurred” (Rudin et al., 2020). Regardless of what is true or effective, the tool’s lack of transparency has severely impacted its reputation. Even today, the top result when researching the COMPAS algorithm is ProPublica’s report.
Similar to fairness and bias, strategies for ensuring accountability in data-driven technologies closely map to the smart urban governance framework. Central to the framework’s technological component is the dissemination of information about how systems work and the facilitation of feedback. Auditability aligns well with these tenets and enables practitioners (i.e., auditors) to do their jobs effectively.
CONCLUSION
In our push to build smarter cities and better urban governance tooling, how we define “smartness” is of critical importance. A definition that centers context specific problem solving is likely to lead to the creation of effective and equitable solutions. On the contrary, a definition that centers rapid technological infusion can lead us down the path of technocratic governance.
In healthcare, medicine, education, and agriculture, a prefix of “smart” is synonymous with increased precision in addressing core needs. Rather than being an industry that tackles specific and urgent urban challenges, smart cities are too often limited to existing as consumers of solutions dreamt up by billionaires and tech giants. In her work on uneven innovation, Jennifer Clark argues that the sector of urban technology should be viewed as an industry and should behave as such when expanding and integrating into incumbent systems. To this end, she emphasizes the importance of valuing regional differences as the constraints around which these technologies are defined, rather than just another problem to solve in search of a one-size-fits-all answer (Clark, 2021).
Jiang et al.’s smart urban governance framework suggests that cities do not need the newest algorithms; they need data and urban governance professionals collaborating in innovative ways. As data and urban practitioners, we have the tools to define the trajectory of what “smartness” means in our cities—a definition that depends on how we ask questions, understand the unique contexts of our communities, and creatively leverage technologies to enable new solutions.
Carolina Planning Journal : Volume 48 / Urban Analytics 24
WORKS CITED
Crawford, K. (2021, August 27). The hidden biases in big data. Harvard Business Review. Retrieved October 1, 2022, from https://hbr.org/2013/04/ the-hidden-biases-in-big-data
Elish, M. C. (2020, September). Repairing innovation: A study of integrating AI in clinical care. Data & Society. Retrieved October 1, 2022, from https:// datasociety.net/wp-content/uploads/2020/09/Repairing-InnovationDataSociety-20200930-1.pdf?trk=public_post_comment-text
Ensign, D., Friedler, S. A., Neville, S., Scheidegger, C., & Venkatasubramanian, S. (2018, January 21). Runaway feedback loops in predictive policing. Proceedings of Machine Learning Research. Retrieved October 1, 2022, from https://proceedings.mlr.press/v81/ensign18a.html
Ho, E. (2016). Smart subjects for a smart nation? governing (smart) mentalities in Singapore. Urban Studies, 54(13), 3101–3118. https://doi. org/10.1177/0042098016664305
Jiang, H., Geertman, S., & Witte, P. (2020). A sociotechnical framework for Smart Urban Governance. International Journal of E-Planning Research, 9(1), 1–19. https://doi.org/10.4018/ijepr.2020010101
Jiang, H., Geertman, S., & Witte, P. (2020). Smart urban governance: An alternative to technocratic “smartness.” GeoJournal, 87(3), 1639–1655. https://doi.org/10.1007/s10708-020-10326-w
Larson, J., Angwin, J., Kirchner, L., & Mattu, S. (2016, May 23). How we analyzed the compas recidivism algorithm. ProPublica. Retrieved October 1, 2022, from https://www.propublica.org/article/how-we-analyzed-thecompas-recidivism-algorithm
Mehrabi, N., Morstatter, F., Saxena, N., Lerman, K., & Galstyan, A. (2022, January 25). A survey on bias and fairness in machine learning. arXiv. org. Retrieved October 1, 2022, from https://arxiv.org/abs/1908.09635v3
Niu, H., & Silva, E. A. (2020). Crowdsourced data mining for urban activity: Review of data sources, applications, and methods. Journal of Urban Planning and Development, 146(2). https://doi.org/10.1061/(asce) up.1943-5444.0000566
Obermeyer, Z. (2021, December 2). Algorithmic bias playbook presentation. Federal Trade Commission. Retrieved October 1, 2022, from https://www.privacydesign.ch/2021/12/02/ziad-obermeyer-universityof-california-at-berkeley-algorithmic-bias-playbook-presentation/
Roberts, D. E. (2011). What’s Wrong with Race-Based Medicine?: Genes, Drugs, and Health Disparities . The University of Minnesota Law School Scholarship Repository . Retrieved October 1, 2022, from https://scholarship.law.umn.edu/cgi/viewcontent. cgi?httpsredir=1&article=1095&context=mjlst
Rudin, C., Wang, C., & Coker, B. (2020). The age of secrecy and unfairness in recidivism prediction. 2.1, 2(1). https://doi. org/10.1162/99608f92.6ed64b30
Tang, H. (2022, June 6). Race, medical data and AI with University of Toronto’s Llana James. AIMed. Retrieved October 1, 2022, from https:// ai-med.io/essential-listening/race-medical-data-and-ai-with-universityof-torontos-llana-james/
Toh, M., & Erasmus, L. (2019, January 15). Alibaba’s ‘City brain’ is slashing congestion in its hometown. CNN. Retrieved October 1, 2022, from https://www.cnn.com/2019/01/15/tech/alibaba-city-brain-hangzhou/ index.html#:~:text=Alibaba%27s%20%27City%20Brain%27%20is%20 slashing%20congestion%20in%20its%20hometown&text=Traffic%20 used%20to%20be%20a,to%2057th%20on%20the%20list.
Warmerdam, V. (2019, June 24). Vincent Warmerdam: The profession of solving (the wrong problem) | PyData Amsterdam 2019. YouTube. Retrieved October 1, 2022, from https://www.youtube.com/watch?v=kYMfE9u-lMo.
Wexler, R. (2017, June 13). When a computer program keeps you in jail. The New York Times. Retrieved October 1, 2022, from https://www.nytimes. com/2017/06/13/opinion/how-computers-are-harming-criminal- justice. html
FEATURE ARTICLES 25
INTERROGATING SMART CITY PRACTICES
JUN WANG
Jun Wang is a Ph.D. candidate at the Georgia Institute of Technology specializing in Urban Design and Transportation. Jun earned her Bachelor of Engineering in City and Regional planning at Huazhong University of Science and Technology in China. She also earned an MS in Urban Design and an MIS in GIS Technology at Georgia Tech. Jun’s work involves interdisciplinary theories and practices in urban design, city planning, GIS technology, and transportation modeling.
ABSTRACT
This article uses Sidewalk Labs’ Quayside project in Toronto, Canada as a case study to elaborate on the challenges that smart city projects face in the real world. The controversial project faced challenges with data privacy law, loss of trust among agencies and the public, as well as insufficient communication. These appear to be generalizable obstacles impeding success of smart city projects. The project sheds light on future smart city practices with strategies proposed for the public and private sector, as well as planners and designers.
The failure of the Quayside project prompts future smart city practices to build trust among the designing agency, the public sector, and residents. Design firms should be transparent with the public, and they must be responsible for the techniques they apply. The government shoulders responsibility for initiating appropriate data privacy laws and monitoring collaboration with the private sector in smart city contexts. Designers and planners, must be alert to tech chauvinism and technological solutionism. The actual demands of the residents should always be prioritized.
A VISION UNFULFILLED
Originally billed as a first-of-its-kind “smart city” prototype, Sidewalk Labs promised a new kind of IT and IoT-laden district for Toronto. Sidewalk Labs partnered with Waterfront Toronto, a public-private partnership, in 2017 to redevelop 12 acres of former docklands on the Toronto waterfront. Sidewalk Labs is linked to Google, and serves as Alphabet’s urban innovation organization aimed at designing, testing, and building tech-centric projects to help cities overcome persistent challenges.
Sidewalk Labs envisioned Quayside as a neighborhood infused with experimental technology that could eventually change how humans everywhere live, work, build, commute, and make use of public space. In this sense, it was a pilot project for a far more global vision.
In an extensive master plan, Sidewalk Labs depicts the scene of future waterfront residents playing among the wooden skyscrapers on the site. In a deja-vu of spinning rural space-habitats from 1970s futurism, the plan shows the Quayside project in its completed state. In a verdant
The Sidewalk Labs Quayside Project
Carolina Planning Journal : Volume 48 / Urban Analytics 26
low-carbon city, plants proliferate, people and their pets stroll along the riverside avenue. There’s no clear sign of high technology. The message appears to be that this smart city is no different from any other place—except that it is, perhaps, better. Aspirations toward a “sense of community” take center stage. Sidewalk Labs uses the familiar language new urbanism to show a comforting, familiar scene, avoiding cyberpunk-style unsettledness.
The organization’s vision statement made lofty claims to design a “place with safer streets. More breathable air. More walkable sidewalks. A place where people are more engaged with their world than with their phones... A place where, quite simply, everyone who wishes to call it home, can” (Sidewalk Labs, 2019). The company also aspired to tremendous economic impact. They estimated that it would create some 44,000 jobs for locals, generate $4.3 billion in annual tax revenues, and spur at least $38 billion in private sector investments by 2040 (Sidewalk Labs, 2019).
Such claims generated a flood of media attention. Some eagerly endorsed this potential gamechanger for Toronto’s housing, transportation system, and employment market. Others noted the potential for controversies now familiar in the smart cities debate: personal privacy; data security; and the power of private companies over public assets. Skeptics believed Sidewalk Labs’ smart master plan— packaged in a series of beautiful street view renderings— masked intentions to collect and manage sensitive data.
In the end, controversy overtook aspiration. Sidewalk Labs terminated its effort to design and build a smart community in Toronto in May 2020, blaming unprecedented economic uncertainty (Doctoroff, 2020).. Was economic uncertainty truly to blame? Or was the leap from smart city concept to smart city development too large?
DATA PRIVACY AND PROFIT MOTIVES
Smart cities rely on data—lot’s of data. The Quayside project required huge amounts of personal information from citizens in order to achieve promised efficiencies. This was especially true of certain tools such as Replica,
a movement modeling approach based on cellphone data, which would have let Sidewalk Labs monitor realtime traffic volume in suggesting navigationroutes. The generative design tool, like Replica, could optimize urban design patterns with machine learning, potentially supporting decisions of the local planning department. Such tools could even monitor the energy consumption of every building, allowing improved performance standards for city buildings.
Many raised their eyebrows at the project’s total scope. Unlike existing smart city projects that often only focus on one aspect of urban governance, the Quayside project presented a complete plan addressing architecture, urban design, city management, transportation, stormwater, logistics, and even waste management. Ambition abounded. “It’s never been possible to bring everything together in one place,” said Dan Doctoroff, CEO of Sidewalk Labs (Bliss, 2019).
But compounding concerns about scope, critics fretted about proprietary data access. Many Canadian residents expressed distrust of Google. Concerns arose over Sidewalk Labs’ refusal to publicly disclose their data collection, usage framework, or privacy protection measures during the first year and a half of the Quayside project, resulting in widespread concerns over personal information security (Devlin, 2019).
MANAGING SKEPTICISM
Sidewalk Labs sought to thread the needle of data privacy restrictions. Per Canadian law, private information cannot be sold or leased to third-party profiters without authorization. Thus, after a series of discussions and negotiations with Waterfront Toronto, Sidewalk Labs made efforts and actions to protect personal information. On March 23rd, 2019, Sidewalk Labs published an article describing the mechanism of data collection and protection and insisted that collecting data is not part of Sidewalk Labs’ business model. All original information collected was to be anonymized and managed by a thirdparty organization Urban Data Trust. By incorporating third-party data management by the Urban Data Trust,
FEATURE ARTICLES
27
Sidewalk Labs sought to ensure that urban data would be used in a way beneficial to the community without losing its opportunity to pilot this tool.
The pivot did little to assuage concerns. Sidewalk Labs discussion of third-party management were highly conceptual, leaving suspect the management structure and composition method (Walker, 2019). Although Sidewalk Labs completed a Responsible Data Impact Assessment as an accessible resource for cities, the company subsequently removed the assessment from its website. Suspicions that third-party management would not resolve privacy concerns were well-founded. Sidewalk Labs claimed that data is minimized, secured, and de-identification occurs by default. However, data can be relatively easily reidentified by using neural network and other predictive algorithms. For example, researchers at MIT and the Université Catholique de Louvain analyzed data on 1.5 million cellphone users in a small European country to demonstrate this potential. They found that, with just four points of reference and a low spatial and temporal resolution, one could retroactively identify 95 percent of de-identified data (Lubarsky, 2010 & Cecaj et. al, 2014).
CANADA’S FAILING DATA PRIVACY LAW
This flaw in the privacy arrangement stems from outdated and inadequate provisions in Canada’s privacy laws (Scassa, 2019). Much of the data Sidewalk Labs required was personal travel data and real-time movement data of all citizens on this site, whether a person walked or drove. But personal travel data is not protected in Canada’s Privacy Act, which limits government use of data. Moreover, this Act has extremely weak law enforcement. In many cases, public harm due to algorithmic bias and manipulation of personal data stems from the use of personal information. The ethical use of data requires a better framework, such as the consent-based mechanism of the Personal Information Protection and Electronic Documents Act.
In many respects, Canada’s legal infrastructure has siloed various aspects of data privacy. Critics have called on the government to develop laws and policies to address the ambiguities in managing and utilizing public and private
data, promote remedial measures, and minimize judicial barriers (VanDiver, 2019). In the absence of such legal reforms, Toronto residents cannot depend on laws to protect their data security. They also cannot confirm whether Sidewalk Labs sought to take advantage of legal loopholes. This did much to undermine public confidence in the Quayside Project.
UNEXPECTED SITE EXPANSION
Those already observing the project with a critical eye found still further cause for concern with a surprising development on June 24, 2019. Sidewalk Labs proposed a 16-fold expansion of the site footprint for the experimental Smart City. No one expected this—not even Sidewalk Labs’ public partner. As the actual landholder, Waterfront Toronto failed to fulfill its responsibility to monitor the progress of Sidewalk Labs’ work, and Sidewalk Labs ran with their concept. They did so without agreement from either the local government or the public.
The most plausible explanation is that the original site was too small to realize a complete smart city plan—especially one so comprehensive as Sidewalk Labs’ envisioned. Perhaps the larger site was genuinely necessary to realize the full services that the initiative pursued. It was, however, a fatal mistake to exclude the users of the proposed design. The sudden change triggered an outpouring of dissent on Internet forums and in the media. The move elevated already widespread distrust from the public.
PUBLIC BACKLASH
To understand the scope and evolution of public backlash, consider the #BlockSidewalk campaign. These citizen activists alleged that the project handed over what was meant to be a democratic, government-led development process to a private company. The movement emerged from a Twitter group of 30 locals who held their first public meeting in April 2019. Many members saw inspiration in the grassroots movement that caused Amazon to cancel its plan to build a second headquarters in Queens, New York. According to Professor Shauna Brail at the University of Toronto, the size and scale of #BlockSidewalk is challenging
Carolina Planning Journal : Volume 48 / Urban Analytics 28
to estimate (Personal conversation with Professor Brail on July 23, 2020).
Nevertheless, #BlockSidewalk was no isolated event and shares much with other campaigns that stigmatize smart cities projects. Conservatives in the United States have long associated Silicon Valley and technology firms with liberal elitism. In 2012, talk show host Glenn Beck fired up his conservative base against “sustainable development” and “smart growth” with his dystopian novel portraying conspiracy theories about Agenda21, the United Nation’s Millennial goals. This politicization of smart city concepts and sustainable development has further complicated understanding and public acceptance.
The #BlockSidewalk group continued to be organized and vocal, but they appeared to struggle against prevailing disinterest. The majority of the citizens didn’t know anything about Sidewalk Labs. Certainly, the presence of an internet-based opposition usually cannot be credited with the cancellation of such a large project, as most large projects seem to generate such groups. However, when Sidewalk Labs eventually cancelled the project, #BlockSidewalk claimed that the withdraw of the Quayside project was a victory for democracy over “surveillance capitalism.”
FAILURE AND LESSONS FOR FUTURE SMART CITY PROJECTS
The failure of the Quayside project leaves planners and designers with three lessons for the era of smart cities. First, governments must take responsibility for protecting the interests of citizens. Second, all involved must commit to actions that will foster trust, and avoid secrecy and disruptive actions like the surprise site expansion. Third, planners and designers must be alert to chauvinistic bullying by big tech, and should be wary of elitist wouldbe managers of smart city mega-projects.
LESSON 1: GOVERNMENTS MUST TAKE RESPONSIBILITY
The Quayside project teaches us that the public sector has a lot of work to do to earn the public’s trust when dealing with smart city technology. Policy-makers need to take
data and intellectual property seriously. Data is used to determine everything from traffic flows to access to welfare. The government should prepare data and intellectual property laws before starting partnerships with private entities that specialize in data.
Canada’s Privacy Act is too rigid and narrow. The Privacy Act defines personal information as any recorded information about an identifiable individual. Personal mobility data does not meet the Act’s definition of personal privacy, and mobility data is a huge part of what Sidewalk Labs requests. Under these terms, citizens have no privacy rights for their own mobility data. Further, under this Act, no clear plan exists to implement, monitor, and enforce its provisions. Should new legislation emerge, it must be accompanied by clear enforcement.
Governments must also act in ways that reflect the public will when corporations show an interest in circumventing it. Google CEO Larry Page said that “[t]here are many exciting things you could do that are illegal or not allowed by regulation…we don’t want to change the world, but maybe we can set aside a part of the world…we need some safe places where we can try things and not have to deploy to the entire world” (Ingraham, 2013).
No citizen wants their home to become a test field for technology giants. As planners, we should be vigilant not to trust big tech offhand, and develop regulations and routines that ensure technology solves practical problems and improves quality of life. To achieve good results, governments also need to develop digital-centered skills with their staff. In the 2018 report on the Toronto Waterfront, the Auditor General of Ontario concluded that neither the Toronto Waterfront nor Ontario has the expertise to deal with smart city issues. This must occur at all levels of government. We need people who understand the difference between the digital economy, more familiar sectors, and related social policy issues.
“Governments need policies to deal with these issues, and while there have been some moves on this front, we are woefully behind where we should be”, said Dr. Teresa Scassa (Scassa, 2019). This becomes more crucial daily,
FEATURE ARTICLES
29
as data governance will encompass more and more of the problems at stake in a knowledge economy.
LESSON 2: BUILD AND REBUILD TRUST
The profit-seeking nature of private enterprises makes it difficult for the public to fully trust them. A democraticallyelected government must assure its responsibilities, improve institutional guarantees, protect its people in the wave of data science, and still make profitable choices. The government should act to gain the trust and confidence of the people. If the rollout of smart cities is inevitable as its advocates claim, then citizens need informed leaders, and the government should not shirk this responsibility.
Waterfront Toronto’s trouble started from its March 2017 proposal that asked to share policy-setting power on crucial issues like data and intellectual property with a private company. This is not just a problem for public accountability, but can lead to fundamental conflicts of interest when it comes to deciding who controls and uses data. Governments must reconsider the role of private platforms in delivering public services. Certainly, the principle notion of Sidewalk Labs was for private interest to become indispensable in the provision of public services. We need to have a broad discussion about the desirability and long-term viability of privatizing public services in the digital age.
Private design agencies should also be honest with residents. All urban design projects naturally have public interest attributes. Governments and companies must generate digestible and honest materials about design projects for citizens. These cannot be merely beautiful renderings; they must get into actual purposes and functions. A sophisticated design that wraps a high-tech core in an appealing traditional package is dishonest if it does not come clean about the differences between a 30-story wooden skyscraper and an old wooden cabin. Citizens must be helped to see beyond the veneer.
Meanwhile, residents need to engage in trust-building, too. They should increase their appetite to understand urban design and smart city pros and cons. The Quayside project, like many other smart city designs, could have brought
economic benefits and management innovation to the city, such as more affordable housing, smoother public transportation, more walkability, and more jobs. The era of data is coming, and residents should not dismiss it out of hand. This is particularly true as we generate data on mobile phone signaling data, bank card transaction records, and online browsing. These data may have appropriate uses, and all parties must be involved in determining the legitimate uses.
BE ALERT TO TECH CHAUVINISM
Technology is not the answer to all questions. The core of technology should not be technological progress itself, but the ability to solve problems in real life. Using real-time travel data to sequence traffic signals to reduce traffic jams is an often-cited example of smart city technology solving a problem. Some solutions, however, are searching for problems that may not exist. In this regard, future smart city developments would do well to learn from the Sidewalk Labs experiment.
The world is awash in smart city ideas. Toronto’s Quayside, New York’s Hudson Wharf, Abu Dhabi’s Masdar, South Korea’s Songdu City, and Japan’s Woven City are just a few on the list. China and India have announced national strategies to plan, build and improve several smart city projects at the same time. Global technology firms and startups are racing to provide customers with urban data platforms, smart homes, and cutting edge transportation systems to make life more comfortable and efficient.
Urban development should start with community engagement and avoid technological solutionism. Sidewalk Labs started with a set of cool techs that they tried to convince Torontonians they needed. They should have started by asking residents what they needed, then considered options. Instead, they assumed the answers without engaging locals.
Governments will be courted by more smart city projects in the future. Once initiated, these projects require supervision from designers and government to ensure that data management remains ethical in the long term.
Carolina Planning Journal : Volume 48 / Urban Analytics 30
They should continue to develop systems for third-party supervision and be on the lookout for ulterior motives. The fall of Sidewalk Labs was seen as a victory for some, but Toronto lost potential benefits, too. Tech firms, planners, and residents have much work to do to realize the potential of the smart city.
WORKS CITED
Bliss, L. (2019). A Big Master Plan for Google’s Growing Smart City. https:// www.bloomberg.com/news/articles/2019-06-25/toronto-s-alphabetpowered-smart-city-is-growing

Cecaj, A., Mamei, M., & Bicocchi, N. (2014). Re-identification of anonymized CDR datasets using social network data [Conference presentation]. 2014 IEEE International Conference on Pervasive Computing and Communication Workshops. https://doi.org/10.1109/percomw.2014.6815210
Chambers, E. (Ed.). (2019). The Routledge companion to African American art history. Routledge.
Dawson, A.H.(2019). An Update on Data Governance for Sidewalk Toronto, Sidewalk Labs. https://quaysideto.ca/wp-content/uploads/2019/07/AnUpdate-on-Data-Governance-for-Sidewalk-Toronto.pdf
Devlin, M. (2019). Time to ‘start over’ on Sidewalk Labs development, Balsillie says. THE GLOBE AND MAIL. https://www.theglobeandmail. com/business/article-time-to-start-over-on-sidewalk-labs-developmentbalsillie-says/
Doctoroff, D. L. (2020). Why we’re no longer pursuing the quayside project — and what’s next for sidewalk labs. Medium. https://medium. com/sidewalk-talk/why-were-no-longer-pursuing-the-quayside-projectand-what-s-next-for-sidewalk-labs-9a61de3fee3a
Ingraham, N. (2013). Larry Page wants to “set aside a part of the world” for unregulated experimentation. THE VERGE. https://www.theverge. com/2013/5/15/4334356/larry-page-wants-to-set-aside-a-part-of-theworld-for-experimentation
Lubarsky, B. (2010). Re-identification of “anonymized data.” UCLA Law Review, 1701-1754.
Scassa, T. (2019). Why Canada needs a national data strategy. Policy Options Politiques. https://policyoptions.irpp.org/magazines/ january-2019/why-canada-needs-a-national-data-strategy/
Sidewalk Labs. (2019). Master Innovation and Development Plan, Sidewalk Labs, https://sidewalk-toronto-ca.storage.googleapis.com/wp-content/ uploads/2019/06/23135500/MIDP_Volume0.pdf
Sidewalk Labs. (2019). Master Innovation and Development Plan Volum 2, Sidewalk Labs, https://sidewalk-toronto-ca.storage.googleapis.com/ wp-content/uploads/2019/06/23135715/MIDP_Volume2.pdf
Sidewalk Labs. (2019). Master Innovation and Development Plan Volum 3, Sidewalk Labs, https://sidewalk-toronto-ca.storage.googleapis.com/ wp-content/uploads/2019/06/23135812/MIDP_Volume3.pdf
VanDiver, R. (2019). Breaking Ground: Constructions of Identity in African American Art 1. In The Routledge Companion to African American Art History (pp. 440-449). Routledge.
FEATURE ARTICLES
31
IMAGE 1: Rendering of the Quayside Project vision. Courtesy Alphabet.
STRATIFIED COLOMBIA:
Forced Discrimination or Empowered Hierarchy?
GIANLUCA MANGIAPANE
Gianluca is accomplished in the field of data analytics, with an accelerating interst in spatial analytics. His career began in logistics and manufacturing in Australia and New Zealand, and currently performs spatial analysis for solar PV systems. He earned his Bachelor’s in business and economics at the Virginia Military Institute and his Master’s of Urban Spatial Analytics from the University of Pennsylvania.
ABSTRACT
In 2019, the controller of Philadelphia reported that the data and method used to assess property value in the city of Philadelphia was inaccurate and inconsistent. In low-income areas especially, properties were appraised at higher-than-actual values, creating unfair higher property tax. Discriminatory policy in the past has created bias in spatial data that could influence the methods and means of making these assessments. This raises the question of whether another means of data categorization might provide a more accurate viewpoint of a household’s standard of living.
To this end, this paper explores Colombia’s stratification system. In 1996, the central government of Colombia passed Law 142, which nationalized municipal stratification schemes and creating cross-subsidies to fund public utilities by charging above-market rates to high-income households and thereby reduce or eliminate costs for low-income households and help pull them out of poverty. This stratification system split households into six classes, all based on the visual inspections of the physical household and adjoining neighborhoods. This paper applies this stratification system as a thought experiment in Philadelphia, PA, with the impact being an increase in participation of energy benefit relief for low-income households.
Carolina Planning Journal : Volume 48 / Urban Analytics 32
THE STATE OF PHILADELPHIA’S POVERTY
One of the core problems facing Philadelphia for many years has been entrenched poverty. Philadelphia’s poverty rate has remained around the same level of 25% for the past five years, even while the national poverty rate has not, with approximately 400,000 residents living below the poverty line in 2017 (The Pew Charitable Trusts 2019). In fact, among the top 10 highest populated cities in the United States, Philadelphia has the highest poverty rate, and is 3rd when looking at overall comparisons of cities in the United States (The Pew Charitable Trusts 2019). Poverty is also dispersed in clustering patterns across Philadelphia.
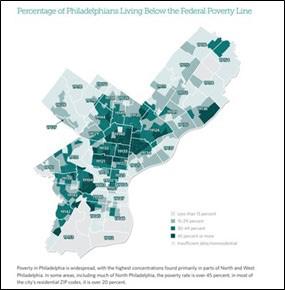
Figure 1 highlights clustering patterns at the census tract level in Philadelphia by showing the percentage of Philadelphians living below the Federal poverty line in 2017, with zip codes over laid. As evident, the largest concentration of poverty is clustered in parts of North Philadelphia, along with West Philadelphia and Southwest Philadelphia. These neighborhoods are unsurprisingly also the one’s with the lowest median income levels in the city, ranging from $18,000 in North Philadelphia to $26,000 in West Philadelphia (Rhynhart 2019).
Many census tracts in North Philadelphia have poverty rates at 45% or above, with these rates only clustering in certain areas. Looking into the way poverty (and by an extent income segregation) is defined to certain parts of the city, it raises the question as to why. What is the pattern or underlying characteristic that has caused these classified “poor” parts of the city to be affected negatively in their certain area, and what has allowed low-poverty areas of the city to thrive?
THE BIAS OF DATA
The Redlining Map of Philadelphia from 1937 appears in Figure 2, republished in a 2020 report from City of Philadelphia Controller’s Office. In 1937, the Homeowners Loan Corporation—part of the New Deal era of policy designed to combat the economic effects of the Great Depression— labeled parts of the city of Philadelphia on a scale of A-D. A represented the areas in the city with
the “best” citizens to grant loans to and D represented the areas with “hazardous” citizens to grant loans to. These labels were meant to differentiate the perceived higher or lower risks of recouping on a house loan or investment (Rhynhart 2020). The redlined areas “typically [had] an ‘undesirable population’ of African American, immigrants, and Jews, while the yellow areas showed evidence of an ‘infiltration of a lower grade population’. These assessments stand in stark contrast to those for the green and blue zones, which were considered ideal for investment…and contained a ‘homogenous’ while and affluent population” (Rhynhart 2020).
Since these “redlined” areas were unable to be approved for lending and legal deed ownership, they were denied the same access to investments as those in the desirable areas, to improve their way of life. This discriminatory policy denying equal opportunity compounded over the years, leading the redlined areas of Philadelphia to still today “experience disproportionate amounts of poverty, poor health outcomes, limited educational attainment, unemployment, and violent crime compared to other neighborhoods in the city” (Rhynhart 2020). Areas
FEATURE ARTICLES
33
FIGURE 1 - Percentage of Philadelphians Living Below the Federal Poverty Line. Image by The Pew Charitable Trusts, 2019.
identified as “hazardous” and “declining” in the Redlining Map of 1937, especially in North Philadelphia and West Philadelphia, are those also identified as low-income/highpoverty census tracts in the recent Pew Report. The effects of a discriminatory policy in the city from 1937 are still evident in census reporting 80 years later.
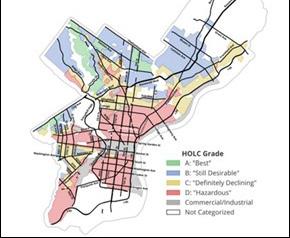
This spatial bias in the data also has detrimental effects on municipal administration. Agencies such as the Office of Property Assessments (OPA) in Philadelphia will realistically use available city data in their methodology for determining property tax in residential areas. Yet, the OPA’s methodology does not adequately factor in historical bias that is inherent to spatial data, leading to a chain of inaccurate data eventually used to validate ineffective or harmful government policy. In 2019, the Philadelphia Controller’s Office found the OPA’s assessments to have strong correlation to both high regressivity (less-expensive homes are over-assessed relative to more expensive homes) and low uniformity (comparable properties are assessed similarly) (Rhynhart 2019) across various geographical zones throughout Philadelphia (Rhynhart 2019).
Indeed, for tax year 2019, while the OPA reported that they met International Association of Assessing Officers (IAAO) standards in the overall citywide accuracy ratio,
when analyzed by the Controller’s Office at determined geographical zonal levels, the OPA failed to meet standards in 7 out of the 14 zones. The analysis found that OPA’s assessments in properties located in West Philadelphia, Southwest Philadelphia and North Philadelphia had the least uniform and most regressive assessments in the city (Rhynhart 2019). Unsurprisingly, these are the same areas identified as both low-income in the 2017 census and “undesirable” in the 1937 Redlining policy. The report showed that the ODA did worse in assessing properties in the lowest income neighborhoods, assessing them to be valued higher than what they are worth, relative to more expensive homes (Rhynhart 2019). This in turn bears a greater property tax burden on the residents, ultimately paying more than what would be deemed fair by IAAOrecommended bounds (Rhynhart 2019).
THE COLOMBIAN STRATIFICATION SYSTEM
In 1996, Colombia was experiencing high levels of income inequality, with a Gini coefficient of 0.56 (the Gini coefficient measures income inequality dispersion where a value of 0 indicates everyone in the population has the same income, and a value of one indicates one person in the population has all the income), a poverty rate of 32.4% and an urban to rural population distribution of approximately 70 to 30 (Quiñones et al. 2021). Thus, the central government of Colombia passed Law 142, which nationalized local city stratification schemes, and created cross-subsidies to fund public utilities through charging high-income households more to reduce the costs for lowincome households (Quiñones et al. 2021).
This stratification system split cities into 6 classes, with class 1 being the most disadvantaged and class 6 being the wealthiest. Classes 5 and 6 are charged above market rate for their utility usage, class 4 is charged market rate, and classes 1,2, and 3 are charged below market rate (Quiñones et al. 2021). The stratification system documented levels of wealth and determined property tax levels while also helping the government identify where poor communities were building illegal housing, i.e., shanty towns, in which the government needed to start constructing and providing basic utilities (Pachon 2021).
Carolina Planning Journal : Volume 48 / Urban Analytics 34
FIGURE 2 - 1930 Redlining Map of Philadelphia, Philadelphia Controller’s Office, 2020. Image by Rhynhart, 2020..
Since Colombia introduced the stratification system in 1996, the national poverty rate has dropped down to below 14%, yet the Gini coefficient and stratification proportion has remained virtually unchanged (Quiñones et al. 2021). This is due to one of the largest criticisms of the stratification system, mainly how classes are decided on household inspection, and not income levels. When stratification was implemented, income and tax reporting were unreliable, and physically going to inspect the house was the best means to assess a household’s level of wealth. Physical characteristics of the house, both inside and outside, are reviewed, including number of bedrooms, bathrooms, building quality, along with neighborhood characteristics and proximity to amenities (Pachon 2021). Inspection remains the current method of stratification classification, even though governmental documentation of household income has improved significantly.
Since poverty levels in the country have decreased but stratification split has remained constant, there are those whose income levels would realistically put them more in line in the stratification classes of 5 or 6 but are still currently remaining in a lower stratification class that gives them a utility subsidy. There is no incentive to improve their class and move into a higher stratification level, because they can stay in the current one, making level 5 or 6 income while paying level 2 or 3 utility rates
(Quiñones et al. 2021). Additionally, there is no precedent within the government to force a reassessment of the residence. This “incorrect identification of taxpayers to the group of beneficiaries caused city governments to reach maximum allowed percentages to subsidize each stratification category. This limitation placed stress on the cities; limited budgets, jeopardized their financial stability, [and] necessitated more support from the central government, and created a tax regressive system” (Quiñones et al. 2021). In effect, this has created a new form of bias in the data collected, with those being defined in a class that is not representative of what their income would indicate. In addition, residences of higher and lower stratification classes are found to cluster in separate areas of a city (Pachon 2021).
While one could find a class 3 residence neighboring a class 5 or 6 residence, this income segregation by physical residences did end up creating clusters of residences in similar classes. Figure 3 shows clear spatial distribution of the stratification system in 3 cities in Colombia, with shades of green representing stratification levels 4, 5, and 6, and shades of purple representing the more disadvantaged stratification levels of 1,2, and 3 (Quiñones et al. 2021). The pattern and distribution of spatial clustering observed in Colombian cities mirrors spatial clustering of poverty as observed in Philadelphia in the previous sections.
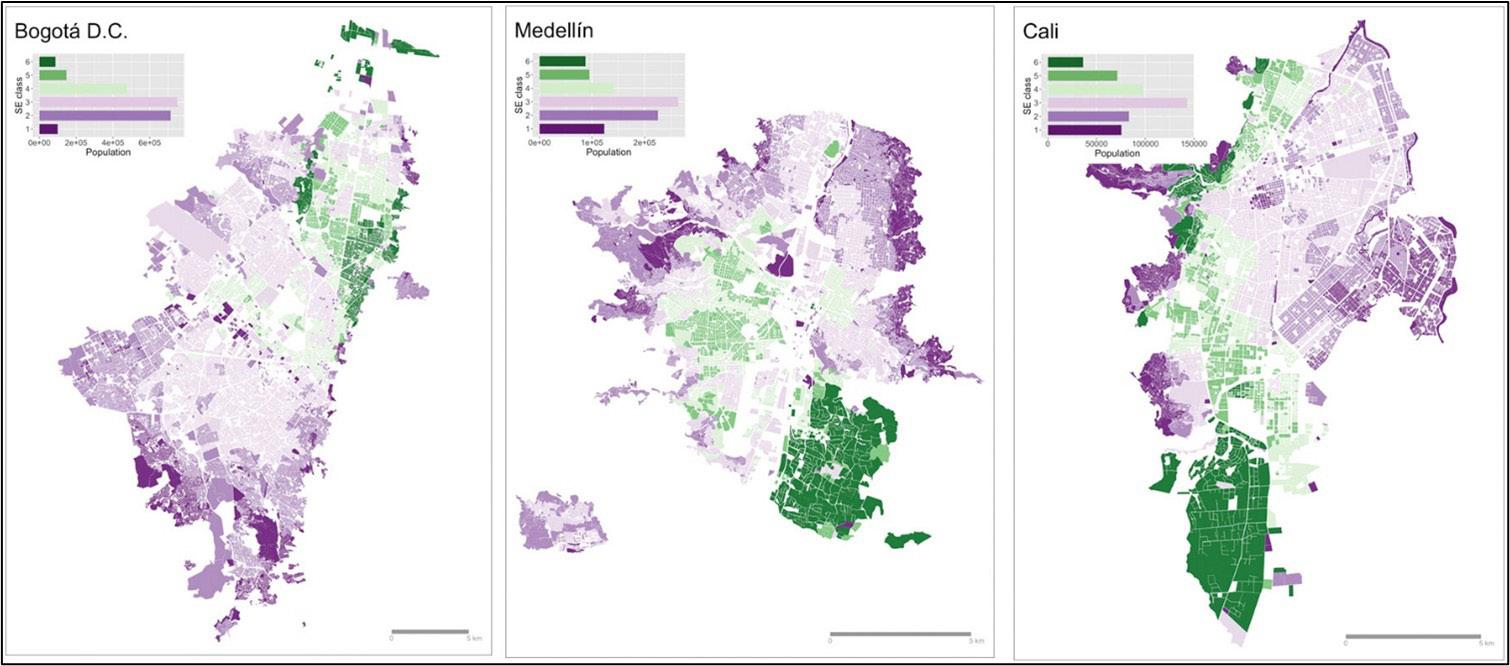
FEATURE ARTICLES
35
FIGURE 3 - Spatial distribution of stratification by census block in the three Colombian cities. Image by Mauricio Quiñones, Lina M. Martínez, Juan C. Duque, and Oscar Mejía (2021).
USING STRATIFICATION TO DISTRIBUTE ENERGY BENEFITS IN PHILADELPHIA
Currently in Philadelphia, there are several main energy programs that are open to customer application and approval. An important one is LIHEAP, a federally funded Low-Income Home Energy Assistance Program that provides heating assistance payment to qualified households, or those at or below the 150% federal poverty level with their household size, along with payments to help weatherize a house and heating infrastructure repair (“Low-Income Home Energy Assistance Program (LIHEAP) | PECO - an Exelon Company,” n.d.). According to the Environmental and Energy Study Institute (EESI) however, one of the issues of LIHEAP is that “only 1 in 5 eligible households are served, demonstrating the enormous gap in meeting energy needs through LIHEAP” (“The Multiple Benefits of Federal Housing and Energy Programs | Briefing | EESI” n.d.).
LIHEAP functions as a block grant, and not as an entitlement program, in that funds are capped and don’t change based on need. As fuel prices increase, LIHEAP serves fewer households with that constant funding (“The Multiple Benefits of Federal Housing and Energy Programs | Briefing | EESI” n.d.). Indeed, a study done by the U.S. Bureau of Labor Statistics in 2018 looked at families that were eligible for government benefits to see their participation and spending habits. Only 7% of eligible families applied for public assistance (Foster and Rojas 2018), with LIHEAP and other energy benefits falling under this category. The system is passive, requiring those in need to make the effort to apply. In contrast, all households in Colombia are assessed, classified, and then either pay the subsidized benefits or receive them, depending on their stratification.
The visual inspection of household wealth method for Colombia’s stratification system suited the country at a time of inaccurate income documentation. However, the United State’ census system can accurately report a household’s purchasing power. Using the 2019 ACS statistics on Philadelphia, Figure 4 outlines census tracts which have a poverty rate equal to or greater than 25%. If using the city poverty rate of 25% as a threshold and providing those census tracts with subsidized
or free utility rates, which is a cost spread out amongst the remaining tracts or federal funds, the number of households in poverty that would benefit from this policy would be 83,890, out of a reported 137,566 households in poverty. This already increases the participation rate to 61% for a public assistance program, compared to the 7% observed in the Bureau of Labor Statistics Study.
In looking at the census tracts impacted by this threshold of 25%, the clustering pattern remains consistent to what is observed in the spatial clustering of poverty in the city, along with clustering patterns with similarities to the income segregated cities of Colombia. However, this census data derived classification system includes 137,382 households above the poverty threshold level, thereby providing the energy benefit and subsidy to households that might not necessarily need it.
There are also indications that stratification has not negatively impacted social cohesiveness in Colombia. A study in 2018 conducted a field experiment to measure trust perceptions amongst high to low stratification classes in Bogotá. While it confirmed that low stratification classes are associated with stereotypes of low trustworthiness, observations showed significant prosocial behavior in the low stratification participants, along with no differences in trustworthiness across different stratifications (Bogliacino, Jiménez Lozano, and Reyes 2017). Perhaps most strikingly, the study showed that participants from the high stratification classes in general were more altruistic towards those from a low stratification, consistent to what they felt was justified redistribution (Bogliacino, Jiménez Lozano, and Reyes 2017). This shows societal approval of stratification, with a sense that those in the low stratifications deserve to be receiving the benefits, and those in the higher stratifications have no issue funding those benefits.
CONCLUSION
Patterns of poverty and income levels clustered across Philadelphia make it easy to identify communities where government action should be directed towards, yet the discriminatory bias in Philadelphia’s data can
Carolina Planning Journal : Volume 48 / Urban Analytics 36
end up creating ineffective policies that only exacerbate the inequality, as seen in recent city housing assessment reports. Contrarily, Colombia embraced the identification of societal classes in order to provide utilities and tax relief to those in low income levels, funded through subsidies paid for by those in the highest income levels. While this has not changed the level of income inequality in Colombia, the national poverty rate has decreased through this classification system and those in low income levels are being provided with energy and water standards on par with the most part with the rest of the country.
Since government reporting on income was unreliable in Colombia at the time, classification was done through physical inspection of housing and location, with reclassification done at the discretion of the occupant, and not the government. This has led to recent trends of those choosing stay in their low-classed housing and official lower classed stratification, despite having income that would be classify them in a higher stratification level, creating a type of bias in the data being represented as well. However, despite this trend, studies out of Colombia indicate that stratification has had no negative impact to social perceptions of each class. If Philadelphia looks to bring in this stratification system as a form of distributing government benefits, the City could use the reliable census structure to record purely household income levels and
classify census tracts through the city-wide average poverty rate of 25%. Such a change could potentially lead to increased participation in energy benefits from 7% to 61%.
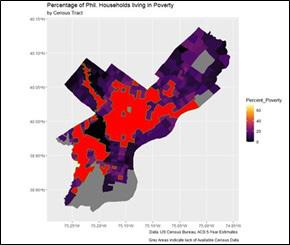
WORKS CITED
Bogliacino, Francesco, Laura Jiménez Lozano, and Daniel Reyes. 2017. “Socioeconomic Stratification and Stereotyping: Lab-In-The-Field Evidence from Colombia.” International Review of Economics 65 (1): 77–118. https://doi.org/10.1007/s12232-017-0285-4.
Foster, Ann, and Arcenis Rojas. 2018. “Program Participation and Spending Patterns of Families Receiving Government Means-Tested Assistance.” Monthly Labor Review, January. https://doi. org/10.21916/mlr.2018.3.
“Low-Income Home Energy Assistance Program (LIHEAP) | PECO - an Exelon Company.” n.d. ww.peco.com. https://www.peco.com/MyAccount/ CustomerSupport/Pages/LIHEAP.aspx.
Shields, Mike, and Song Zhong. 2022. Review of Income Inequality in Philadelphia – the 2020 Gini Coefficient. Economy League. B.Krist for Visit Philadelphia. April 5, 2022. https://economyleague.org/providinginsight/leadingindicators/2022/04/05/gini2020.
Pachon, Angela. 2021. Review of Understanding the Colombian Stratification System Interview by Gianluca Mangiapane.
The Pew Charitable Trusts. “The State of Philadelphians Living in Poverty, 2019.” 2019. Pewtrusts.org. April 11, 2019. https://www.pewtrusts.org/en/ research-and analysis/fact-sheets/2019/04/the-state-of-philadelphiansliving-in-poverty-2019
Quiñones, Mauricio, Lina M. Martínez, Juan C. Duque, and Oscar Mejía. 2021. “A Targeting Policy for Tackling Inequality in the Developing World: Lessons Learned from the System of Cross-Subsidies to Fund Utilities in Colombia.” Cities 116 (September): 103306. https://doi.org/10.1016/j. cities.2021.103306.
Rhynhart, Rebecca. 2019. Review of The Accuracy and Fairness of Philadelphia’s Property Assessments. Office of the Controller. City of Philadelphia’s Controller’s Office. January 17, 2019. https://controller. phila.gov/philadelphia-audits/property-assessment-review/.
Rhynhart, Rebecca. 2020. Review of Mapping the Legacy of Structural Racism in Philadelphia. Office of the Controller. City of Philadelphia Controller’s Office. January 23, 2010. https://controller.phila.gov/ philadelphia-audits/mapping-the-legacy-of-structural-racism-inphiladelphia/.
“The Multiple Benefits of Federal Housing and Energy Programs | Briefing | EESI.” n.d. Www.eesi.org. Accessed December 23, 2022. https://www. eesi.org/briefings/view/020819housing.
FEATURE ARTICLES
37
FIGURE 4 - Census tracts with poverty rate equal to or greater than 25% in Philadelphia, PA. Image by Author.
USING DATA ANALYTICS TO SUPPORT COMMUNITY BASED ORGANIZATIONS
CYATHERINE ALIAS
Cyatherine Alias started at the Center for Neighborhood Technology in 2020. As Senior Manager of Community Infrastructure and Resilience, she supports organizational partnerships, research, writing, and administration of projects. She is interested in how community science and qualitative data can be better interwoven with typical quantitative data sources. Cyatharine holds a master’s degree in Urban and Environmental Policy and Planning from Tufts University and a bachelor’s degree and middle school teaching certification from Harvard University.
PREETI SHANKAR
Preeti Shankar is the Managing Director for Urban Analytics at the Center for Neighborhood Technology. Her expertise spans research and analysis on the benefits of transit, economic development, geographic information systems (GIS), and urban design. Since joining CNT in 2015, she led the analysis to examine the increase in assessed property values along a proposed bus rapid transit line in New Mexico. She performed research and is a co-author on a report that formulated metrics for integrated efficient freight movement and community economic development, and conducted mapping and analysis on freight infrastructure and job location. Preeti holds a Master of Urban Planning from Texas A&M University and bachelor’s in architecture from Visveswaraya Technological University, India.
ANNA WOLF
Anna Wolf is the Program Director for Water Equity at the Center for Neighborhood Technology. She works on a variety of projects across the organization’s Water and Transportation departments. She manages research and municipal outreach for CNT’s Great Lakes Water Infrastructure Project, coordinates efforts on stormwater management components of the Elevated Chicago(link is external) initiative, and facilitates the organization’s work on water infrastructure financing. Prior to joining CNT, Anna worked at the Alliance for the Great Lakes on water resource management projects and the organization’s invasive species policy campaign. Anna has a Master of Urban Planning and Policy from University of Illinois at Chicago, and a Bachelor of Arts in International Development and Spanish from Indiana University – Bloomington.
Carolina Planning Journal : Volume 48 / Urban Analytics 38
ABSTRACT
As the nation has awakened to past injustices and harms caused by racist policies and planning practices, there is momentum to amplify the work of community-based organizations (CBOs) working on issues and solutions with residents, many in Black and Brown communities, to improve their quality of life. A critical step to ensuring equitable outcomes involves the direct participation of CBOs representing marginalized communities in decision-making processes. Their participation must extend to the often-overlooked data analysis and technical processes that inform decision-making. This article lays out the philosophy employed by the Center for Neighborhood Technology, a research and data analytics firm based in Chicago, while partnering with CBOs on analytical projects. CNT has benefitted from broadening their analytical processes by nuancing quantitative data to avoid unintended interpretations, in incorporating qualitative data to tell a comprehensive story and calling out the limitations of existing data and data collection methods.
INTRODUCTION
The Center for Neighborhood Technology (CNT)—a 42-year-old nonprofit, based in Chicago, IL—has long worked at the neighborhood scale. The intentionality with which CNT pursues local partnerships with communitybased organizations has ensured that its work is nonextractive and responsive to community needs and priorities. This work gains strength as CNT works to codify community partner practices and processes, ensuring that staff feel supported and guided in the work, and that good practices last as the organization changes.
Throughout the 1980s, CNT worked deeply with residents and neighborhood groups on a variety of burgeoning “sustainability” challenges of the time – energy efficiency, local food production, among others. Historian Beryl Satter highlighted CNT’s unique approach to sustainable urban neighborhoods in her 2022 article “The Right to Define the Question: The Center for Urban Affairs and Neighborhood Activism in 1970s Chicago”. She notes: “When most environmental technologies were designed for rural areas, [CNT] researched technologies to protect urban environments and generate jobs… As [CNT’s] mission statement explained, it aimed ‘to promote public policies, new resources and accountable authority which support sustainable, just and vital urban communities.’”
At that time, a commitment to working with community
residents as experts was groundbreaking. And while CNT’s commitment to community members and communitybased organizations as experts remained a central part of CNT’s operational ethos as its work became more focus on scaling local approaches, the ways in which the organization worked in authentic, non-extractive partnership with community was never codified. As a result, engagement approaches became reliant on individual staff to carry it as a priority throughout the work , marginalized and minoritized voices. Codification of the ways in which power-holding, nonprofit planning and data analytics institutions, like CNT, endeavor to work in community is critical for both current and future staff composition – it ensures a standard and accountable approach to engagement.
In recent years, CNT has recommitted itself, in letter and spirit, to authentic and non-extractive community based organizational engagement. In 2021, the organization underwent a mission/vision rewrite, to reflect the ways in which it wanted to work with community partners moving forward.
The new mission: CNT delivers innovative analysis and solutions that support community-based organizations and local governments to create neighborhoods that are equitable, sustainable, and resilient.
Alongside the mission, staff worked to establish principles
FEATURE ARTICLES
39
for engagement, informed by the Jemez Principles , and a series of processes that inform how we go about fundraising, scoping projects, entering partnerships, and evaluating projects. Central to CNT’s approach to engagement is continually reminding ourselves that we are not community experts—our community partners are. They define their challenges, needs, assets, and joys—and these are the factors that inform the ways in which we offer technical support.
Herein, we describe our approach to and outcomes from our work as a technical partner to CBOs. These elements have evolved over the years as we’ve learned and fine-tuned our engagement principles and processes and will likely continue to shift and evolve as we continue to learn and evaluate our approach with community partners.
PHILOSOPHY OF SUPPORTING CBOS
The sequence described in the following section outlines steps employed by CNT when collaborating with a CBO. This practical roadmap concludes with a case study to showcase
how the steps are applied in a real partnership. The valuable lessons learned through several partnerships are offered along with the steps to inform other technical organizations who are seeking authentic engagements with CBOs.
STEP 1: CBO LEADS RESEARCH AGENDA
Communities possess a rich knowledge base and are experts on the issues affecting them. CNT follows the CBO’s lead in defining the research agenda and problem statement to ensure that the analysis is supportive of the CBO’s current priorities. This partnership structure acknowledges that residents and organizations living and working on the front lines of environmental injustices must be engaged as experts in defining the problem and identifying the solution.
Recognize community expertise. Community expertise refers to the on-the-ground knowledge that residents and CBOs have of their community. It encompasses a profound
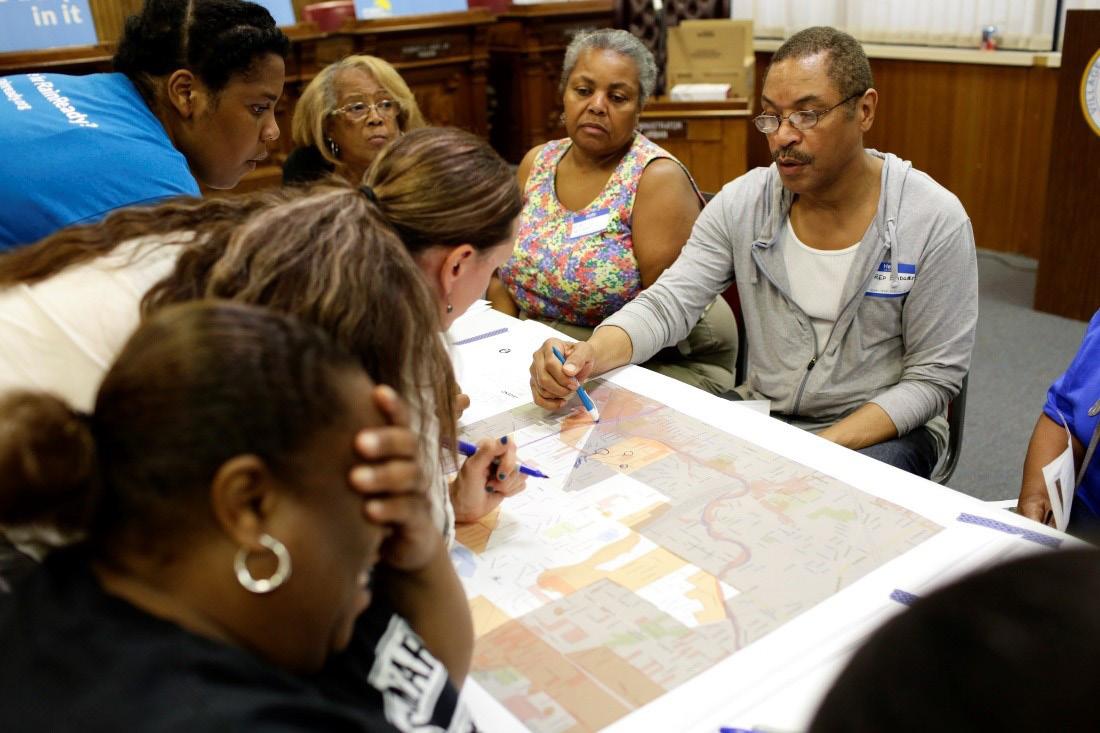
Carolina Planning Journal : Volume 48 / Urban Analytics 40
FIGURE 1 - A town meeting in Dolton, IL. Photo by Center for Neighborhood Technology.
body of knowledge: historical information passed down through informal gatherings; cultural understandings of community members’ world views and the nuances within a community that can impact policy or project implementation; and awareness of the unintended consequences a new or altered policy or project may cause.
Community expertise also refers to local relationships and social networks that are often sought after by outside researchers to “understand” a community. It is up to residents and leaders to share these relationships and networks depending on the level of trust with the partner and the research project. Community expertise also includes the critical eye towards data analytics methods, challenging typical methods to make sure that the data better captures community reality, nuances, and granularity.
STEP 2: TECHNICAL PARTNER FINDS DATA TO ILLUSTRATE THE PROBLEM
CNT, the technical partner, then evaluates available qualitative and quantitative data and analytical methods, prioritizes datasets that are appropriate for the issue, and workshops these options with the CBO partner. Evaluation and conversations about the data consider who collected the data, how the data was collected, and limitations of the data.
Discussion can identify data deemed valuable to illustrate the problem but are unavailable. Then, the project team might decide to collect or create new data. Examples of data collection include conducting walk audits to map local conditions, collecting truck counts on a neighborhood street by stationing team members at crucial nodes or co-creating surveys to capture resident experiences.
Scrutinize available data. It is important to individually evaluate available datasets for their purposes and collection methods in order to identify potential limitations. Discussing even widely available quantitative and qualitative data with CBOs can highlight assumptions that we, as analysts, have about the data. Thorough scrutiny of the data challenges conventional thinking and can uncover new methods of analysis.
The value of crowdsourced local data. Our work with communities has led us to recognize the value of crowdsourced data and community science in creating more robust datasets while building data literacy and topic knowledge among residents.
STEP 3: ANALYZE THE DATA
Analysts develop and propose methods to analyze datasets at the appropriate geographic level and employ analytical and visualization techniques to showcase the results for discussion with the CBO.
Maintain data integrity. As CNT analyzes the data, we maintain data integrity for accurate and reproducible analyses. CNT selects visualizations through graphs, charts and maps to convey the results in a simple and easy-to-understand manner. Additionally, we draft methodology documents to ease sharing of analytical methods that can be verified and used by others.
STEP 4: GROUND TRUTH THE DATA
The results of the analysis are then presented to the CBO staff. The project team collectively discusses the results, and the CBO compares their community experience with the results. These conversations inform the technical partner whether they might need to go back and modify the analytical approach or find additional datasets. This iterative process of modifying the analysis and ground truthing the results enriches the analysis and gets closer at encapsulating the community’s lived experiences. This process also aims to undo any unintentional bias based on the assumptions and experiences of the analysts.
No hierarchy of data. The use of quantitative data is ubiquitous and considered as “real data” by many planners, analysts, and elected officials. However, CBO partners have shared concerns about the broad brushstrokes of quantitative data misrepresenting community experiences. Qualitative data can illuminate these nuances, crystallizing its place among “real data”. We use both qualitative and quantitative data as appropriate and do not value one over the other.
FEATURE ARTICLES
41
STEP 5: COMMUNICATE THE RESULTS
The team works together to package and communicate the analysis to the intended audience(s). Every effort is made to create communication materials that can be shared with the residents – which include materials in multiple languages, visuals for dense technical language, and co-authored materials with the CBO.
Sharing credit. CNT avoids taking sole credit for innovation, recognizing that co-ownership with the affected community is critical to valuing their role in the process. We attempt to avoid the unfortunately common, extractive research model, which provides little benefit to the community. We instead pursue equitable partnerships that rely on sustained dialog, compensate CBOs and other community representatives for their work, and share in publicity and other project benefits.
STEP 6: REFLECT AND APPLY LESSONS LEARNED IN NEXT PHASE/PROJECT
At the end of a project, the team reflects on the partnership and identifies processes that worked well (right from foundational steps of scope development to final execution),

anticipated and experienced challenges, areas of future improvement and ways to apply the lessons learned in future projects.
Committing to learn and apply lessons learned. CNT has been intentional in learning from every CBO partnership and in applying the lessons learned in future projects. Project work plans include documenting reflections and sharing learnings across teams to inform ongoing and upcoming work
KEY PILLARS OF DATA ANALYTICS SUPPORTING CBOS
Three key pillars bolster CNT’s approach to providing technical support to CBOs. These pillars are challenging the status quo, commitment to iteration at multiple scales, and continuous learning and organizational evaluation. Organizations supporting CBOs should continuously strive to center these pillars to ensure authentic and nonextractive collaborations. When these pillars are instilled as part of organizational culture, the above steps follow organically.
(continued page 45)
FIGURE 2 - Olga Bautista, Executive Director of SETF, giving CNT a tour of the neighborhood.
Carolina Planning Journal : Volume 48 / Urban Analytics 42
Photo by Jack Cottle..
CASE STUDY: SOUTHEAST ENVIRONMENTAL TASK FORCE
One of CNT’s core partners, the Southeast Environmental Task Force (SETF), a community-based environmental justice organization led by area residents, is instrumental in shaping how we carry out technical support partnerships with CBOs. The following is an overview of how we apply our community partnership philosophy and key pillars with SETF.
Chicago’s Southeast Side is a majority Latinx community bordering Indiana and Lake Michigan with bungalow housing, several rail lines, and a Planned Manufacturing District beset with several heavy industrial land uses. Southeast Side residents experience health inequities associated with proximity to industrial pollution, including higher rates of heart disease and respiratory conditions than other Chicago neighborhoods.
In 2019, CNT was invited to collaborate with SETF through Calumet Connect: a network that advocates for a community-centered process to modernize one of Chicago’s many Industrial Corridors. CNT’s and SETF’s partnership has evolved over the past three years as both groups have been responsive to shifting community priorities and new advocacy goals. Since 2020, CNT and SETF have been working on a Climate Justice study, to better understand local climate change impacts, and how industrial development may exacerbate existing community sensitivities. This recent work has necessarily centered collaboration, iteration, and flexibility, and provides a rich example of how we apply our engagement philosophy and key pillars.
CBO LEADS RESEARCH AGENDA
SETF knows its community’s assets, priorities, sensitivities, and exposures first-hand. As noted, the organization’s staff and leadership are area residents, many of whom have lived
on Chicago’s southeast side for decades. The organization is well connected to other EJ groups in Chicago and has an understanding of the shared needs and priorities of other frontline communities throughout the City.
SETF had been working to understand how industrial users were impacting and exacerbating flooding, and what water and air quality issues existed in the area. SETF’s and CNT’s Climate Justice work came about because SETF also wanted to investigate how coming climate change impacts would further aggravate impacts toward an already vulnerable population.
TECHNICAL PARTNER FINDS DATA TO ILLUSTRATE THE PROBLEM
CNT had previously worked on climate vulnerability projects and had a host of datasets and resources to draw from. Once SETF identified their goals for the project, CNT identified the readily available, mostly quantitative datasets to analyze. Finalizing which datasets to use was an iterative process. We collaboratively developed research questions, found relevant datasets, and then revisited the research questions to continue to refine our dataset selection before diving into analysis. Throughout this process, biweekly meetings occurred, and a digital shared workspace was created so all partners had ongoing access to the resources developed. CNT continued to refine our datasets and research questions as we moved through analysis. Based on feedback from SETF and other local partners, we narrowed our focus to secure more relevant granular and recent datasets.
VISUALIZING, ANALYZING, AND GROUNDTRUTHING THE DATA
The visualization and analysis of data is an iterative process. Once we secured an agreed upon set of data, CNT began visualizing data and sharing maps, charts, and tables with SETF to collect feedback and refine our approach.
FEATURE ARTICLES
43
There are several data limitations that we confronted throughout this project – e.g., outdated datasets, datasets missing data or not covering the entire geography, data that conflicted with what SETF had heard from residents. In all cases, these limitations require ground truthing exercises and community science efforts to fill in data gaps. This process ensures that when the maps and other visualizations are shared with other nonprofits, municipal staff, and elected officials, they can’t be mischaracterized or used out of context to support a narrative that runs counter to the lived experience of Southeast side residents. CNT and SETF will be kicking off an extensive community science and ground truthing effort in 2023 to fill in the data gaps identified.
COMMUNICATING THE RESULTS
Both organizations established shared goals for how to communicate findings. Analysis and subsequent findings from this work are high stakes and foundational, which is to say they may influence municipal policies and programs, and thus have implications on zoning and other land use decisions that directly impact Southeast side residents. CNT deferred to SETF to determine how and when to communicate our findings to ensure a “no harm” approach to our work.
Often, grant-funded organizations, like CNT, fall into the habit of publishing research and findings at the end of a grant period, as a requirement of the grant or to ensure that our grantor has insights into how we’ve spent grant dollars. For this project, CNT developed a series of internal facing resources like fact sheets that highlight our analytical findings; however, public-facing resources are sparse because we have not ground truthed all data and thus
cannot paint a complete picture of community sensitivities and climate change exposure.
OUTCOMES
The partnership process has had programmatic and operational outcomes. CNT and SETF staff developed additional skills to scrutinize quantitative data and began learning how to incorporate qualitative data into quantitative data analysis. This has led both organizations to work on joint fundraising opportunities to develop methods of community science data collection, which can further build skills with SETF’s community members and increase data coverage of the area. The partnership process has been repeated with CNT’s other partners, improving CNT’s relationships and credibility, expanding CNT’s future projects and increasing fundraising dollars.
Some big pictures outcomes have resulted from this partnership process. Due to the positive experience of this partnership, the executive director of SETF agreed to become one of CNT’s board members. As of 2023, CNT’s board is now two-thirds people of color and three members are from community-based organizations, which is up from one-third and zero in 2018. As CNT continues to support CBOs meaningfully, more will feel invested in CNT’s operations, may be willing to participate in CNT’s leadership, and further steer CNT towards work that improves conditions for marginalized communities. Further, because of the trust developed between organizations, CNT is now held accountable for ensuring that other non-CBO partners (like municipalities or larger non-profits) act right by CBO partners. This impacts the broader ecosystem of partners making it more supportive of CBOs.
Carolina Planning Journal : Volume 48 / Urban Analytics 44
CHALLENGING THE STATUS QUO
The modern data analytics field has been monopolized by technical practitioners with gate-keeping measures –measures that reinforce exclusivity of knowledge and limit access to power, such as high-cost education and training or software - which deter marginalized communities from meaningful participation. When community members are asked to engage, research is often extractive. Technical experts determine the research agenda, products, and methods to benefit their institutions and CVs; residents are treated merely as easily available data sources; and the budget does not consider meaningful compensation for community expertise.
Data analytics organizations committed to supporting CBOs challenge extractive research. First and foremost, the technical practitioners center the community, partnering with CBOs to identify a research agenda that will advance issues that benefit residents and, ideally, that has already been named as a priority or is connected

to other community priorities. This collaboration is sufficiently funded so it builds CBO capacity, rather than overextending the organization for research purposes. The funding amount is determined in conversation with the CBO in anticipation of the project budget to cover their community expertise, time, and administration of the research project. Where relevant, the budget also includes compensation to individual residents (i.e., local experts) who may participate in the project. Further, the CBO builds skills through the partnership, so they can lead and participate in future endeavors.
Challenging the status quo includes valuing the process as much as the outcome. Often the quality of an organizational research project is measured by the final published product. However, the quality of a non-extractive partnership is determined by how the partnership worked - procedural justice. Procedural justice disrupts typical power dynamics, so that power and decision-making is shared more broadly (Paley 2002) such as between the technical practitioners and CBOs.
FEATURE ARTICLES 45
FIGURE 3 - Key pillars of data analytics supporting community-based organizations. Visual by Center for Neighborhood Technology.
The “how” of partnership includes respectful engagement, dignified analytics methods and narrative creation, and persuasive communications. Respectful engagement requires that all organizations can work within their capacity to meaningfully participate and co-lead. Dignified analytics methods and narrative creation considers how the data methods used and the resulting interpretation uplift communities, build on previous data partnerships, acknowledge gaps, and challenge the systems that have created disparate impacts (informed by Thomas 2022 & Wright 2023).
This includes challenging the assumption that specific modeling or complex statistical techniques are the reliable option simply because of their complexity. Instead, dignified analytics methods mean collaborating with the CBO to determine robust analytical methods (quantitative or qualitative) that can be easily interpreted and thoughtfully critiqued by the public. Persuasive communications means that the data is incorporated into a product that is meaningful for the audiences that the CBOs care about, instead of focusing only on long reports. Valuing the process as an outcome requires iteration.
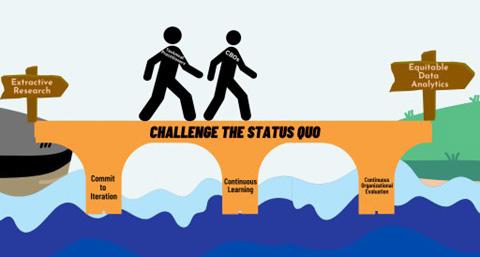
COMMITMENT TO ITERATION AT MULTIPLE SCALES
Iteration is core to successful partnerships and project progress. It allows projects to take new directions considering changes to the information known. Supporting CBOs means acknowledging and respecting that they are responsive to their community needs and local government processes. This may mean that a previously meaningful scope may need to be altered because of an upcoming government policy or because of an important situation that has occurred in the community. Partners may need to revisit the scope of work to consider additional topics, modify research questions or methods, change the project timeline, and if necessary, identify additional funding sources to allow for the changes.
Iteration is rooted in agility and curiosity. Sometimes, the data itself reveals opportunities to iterate. For example, analyzed data may reveal a narrative that is contradictory to or falls short of fully capturing the lived experience of residents. The partnering organizations can curiously consider reasons for the discrepancy by asking questions such as:
Carolina Planning Journal : Volume 48 / Urban Analytics 46
FIGURE 4 - The bridge to equitable data analytics. Visual by Center for Neighborhood Technology.
What are the limitations of the datasets?
Do chosen analytical methods obscure local nuances?
A commitment to agility and curiosity to explore questions and concerns as they arise can encourage a search for additional datasets or other methodologies, and an openness to stating clearly where there are data gaps and limitations Fruitful CBO-data analytics partnerships require being open to unknowns and being agile when the unknown becomes known.
CONTINUOUS LEARNING AND ORGANIZATIONAL EVALUATION
Collaborations with CBOs challenge typical power dynamics and decision-making, requiring many data analytics organizations to unlearn their modus operandi. Data analytics organizations should commit to continual growth from the inevitable mistakes that come from learning a new way of being or relating. Evaluate the partnership through open discussion with the CBO over the course of the project period, not just after the work is done. Organizations might start a partnership by checking in with the CBO about what questions they would like to include as a part of the continuous learning and evaluation effort. Some questions to consider:
What is going well? What can go better?
When were the Jemez Principles (or other engagement principles) pushed to the wayside? Why? How do we recenter them?
After discussions with the CBO, internally reflect as an organization to get to the root of the issues. Consider what lessons can be learned and what it would take to implement the lessons within the organization. Evaluate and reflect early and often to shift organizational culture to improve future CBO partnerships.
CONCLUSION
Data analytics to support CBOs requires a different type of practice: One that centers and sees the community as co-
experts, alongside the technical practitioners. It requires shifting an organization’s culture to challenge typical power dynamics and reveal the narratives in the data. It also requires that technical organizations codify these practices to benefit the practitioners leading this work. Codifying an agreed upon and enforceable non-extractive engagement standard provides support and resources that will have staying power as an organization’s composition shifts over time.
Technical organizations providing data analytics support to CBOs have a responsibility to ensure that their engagement and analytics approach 1) is underpinned by a “do no harm” precept and 2) treats CBOs as full partners, experts in their field, and leaders in the development of solutions that will work in their community.
The outcomes underscore that the partnership process itself is a worthy outcome because improving operations of an organization can have reverberating effects in its ecosystem of partners. This may seem fanciful, but the system of racism violently impacts marginalized communities and the CBOs working in them. By strengthening the ecosystem of actors and creating partners who work in solidarity with CBOs, CBOs are equipped with more tools to dismantle oppressive policies and practices.
WORKS CITED
Satter, Beryl. “‘The Right to Define the Question’: The Center for Urban Affairs and Neighborhood Activism in 1970s Chicago, Journal of Urban History (2022), 9.
Paley, Julia. “Toward an Anthropology of Democracy.” Annual Review of Anthropology 31, no. 1 (2002): 469–96. https://doi.org/10.1146/annurev. anthro.31.040402.085453.
Thomas, Dr. Destiny. 2022. “About Dignity Institute 2023.” Thrivance Project. 2022. https://thrivancegroup.com/dignity-institute.
Wright, Lakeshia. 2023. “Thoughtful Data Interpretation.” Lakeshia’s Portfolio. 2023. https://www.lakeshiawright.com/thoughful-data.
FEATURE ARTICLES 47
ERRORS OF OMMISSION: UNDERCOUNTS OF INDIGENOUS PEOPLE AND TRIBAL HOUSING
DAVID DIXON
David Dixon is a Research Associate with Big Water Consulting, where he conducts needs assessments and strategic planning for Tribes and Tribally Designated Housing Entities to support data-driven decision making in housing, health, and economic development.
HARRY MAHER
Harry Maher is a Data Analyst at Big Water Consulting where he helps Tribes and Tribally Designated Housing Entities collect and act on their own data. He holds a B.S. in Psychology from Grinnell College.
ABSTRACT
Data collected by the US Census Bureau has significant implications for the ability of Indigenous communities across the United States to identify and address their local needs. Despite efforts by the Census Bureau to improve outreach and collaborate with these communities, the most recent decennial census conducted in 2020 showed to undercount American Indians and Alaska Natives (AIANs) living on tribally-governed lands by an estimated 5.6 percent, and data collected as a part of the American Community Survey (ACS) used to allocate funding for the Indian Housing Block Grant (IHBG) also appear to undercount the level of need for many tribal nations.
This report proposes that tribal nations be provided with adequate funding to conduct their own census and survey operations, working to eliminate disparities between actual and reported populations and addressing current and historical issues of discrimination, disinvestment, and exclusion experienced by Indigenous people and communities in the United States.
STATEMENT OF POSITIONALITY
The authors of this article acknowledge their position as non-Indigenous professionals, having no affiliation with any tribal nation nor American Indian or Alaska Native identity. The research presented reflects their combined five years of experience working with tribal nations and programs concerning data collection on tribal lands.
Carolina Planning Journal : Volume 48 / Urban Analytics 48
HISTORY
American Indians and Alaska Natives (AIANs) have experienced a long history of undercounts in U.S. censuses. The first U.S. Census, mandated by Article I, section 2 of the U.S. Constitution, occurred in 1790 and outright excluded “Indians not taxed” from the enumeration process based on the belief that Native Americans living on tribal lands were exempt from taxation and therefore did not need to be counted for the purposes of representation in Congress (U.S. Census Bureau, N.D.). The U.S. Census Bureau did not attempt to count AIANs living on reservation lands in the United States until 1890, and most AIANs living on reservation lands were not considered U.S. citizens until the Indian Citizenship Act of 1924 (U.S. Census Bureau, N.D.).
Distrust of the federal government stemming from land dispossession, broken treaties, forced boarding schools, inadequate federal funding, language barriers, geographic difficulties, a lack of addresses and mail service on reservation lands, and recent inequitable internet access on reservation lands has led to undercounting of Native populations living in the United States (US Commission on Civil Rights, 2018). Despite some progress made by recent efforts to improve census accuracy, AIANs on reservation lands continue to be undercounted, reflecting a longstanding history of systemic exclusion. Over the last few decades, many tribes have increased their capacity for data collection and analysis, supporting long-term goals of data sovereignty and economic self-determination (Lozar, 2023). However, much work still remains to address outstanding inequities.
BACKGROUND AND PROBLEM STATEMENT
Many federal and tribal programs and planning endeavors rely upon census data but present issues with collection and accuracy render estimates insufficient in measuring need within tribal households. Furthermore, the US Government has a unique responsibility to prioritize the needs of tribal nations due to their sovereign status as well as a long history of their economic and cultural exclusion and oppression.
Since the US Decennial Census and the American Community Survey (ACS) both yield crucial data used widely for everything from demographic analyses and market studies to the distribution of federal funding programs, their validity rarely gets questioned. Findings from post-census population counts on tribal lands demonstrate, however, that extra care must be taken to ensure the numbers are accurate and reflective of the size and makeup of Indigenous communities.
To address the issue of undercounts of American Indian and Alaska Native people on tribal lands in the 1990, 2000, and 2010 Census, the Census Bureau has made efforts to increase response rates through outreach and education in Indigenous communities. Some efforts include: developing the Census Barriers, Attitudes, and Motivators Survey (CBAMS) to determine which groups are more motivated and less motivated to complete the census and why; developing a formal 2020 Census Tribal Consultation Process; performing outreach to leaders and partners of tribal nations to help create Tribal Complete Count Committees; developing outreach materials and customized outreach strategies for use on Indian reservations and villages; tailoring enumeration approaches to local tribal needs and preferences (i.e., providing paper forms, online forms, or in-person enumerators); and recruiting local enrolled members for enumerator positions in their own communities (NCAI 2018; US Department of Commerce 2017).
Despite these efforts, the most recent decennial census undercounted AIANs living on reservation lands by an estimated 5.6 percent (Khubba, Heim, and Hong 2022). This was the highest undercount among racial groups reported in the Post-Enumeration Survey and conformed to the general trend of undercounting Native people living on Native lands while overcounting people in other racial groups including Asians and Non-Hispanic Whites (see Figure 1).
In addition to the Decennial Census, the Census Bureau oversees several other surveys including the American Community Survey (ACS), which includes far more detailed information about households. The ACS is used
FEATURE ARTICLES
49
to distribute more than $675 billion dollars in federal and state funds every year. In Indian Country, ACS data are used to develop the Indian Housing Block Grant (IHBG) data set which in turn has been used for Tribal Transportation Program and CARES Act COVID-19 relief funding. However, evidence described in this report, including from data collected by tribes themselves, indicates that ACS data inaccuracies can lead to significantly reduced funding for essential services including housing and transportation.
Unlike states or counties, tribal nations are distinct, sovereign entities and have unique relationships with the federal government, and the provision of basic needs related to housing, healthcare, and education are guaranteed by nations’ treaties with the US which are regarded as “the supreme Law of the Land” (U.S. Constitution 1788). The data used to allocate funding to tribal nations should accurately represent their population sizes and demographics in order to fulfill the federal government’s obligations.
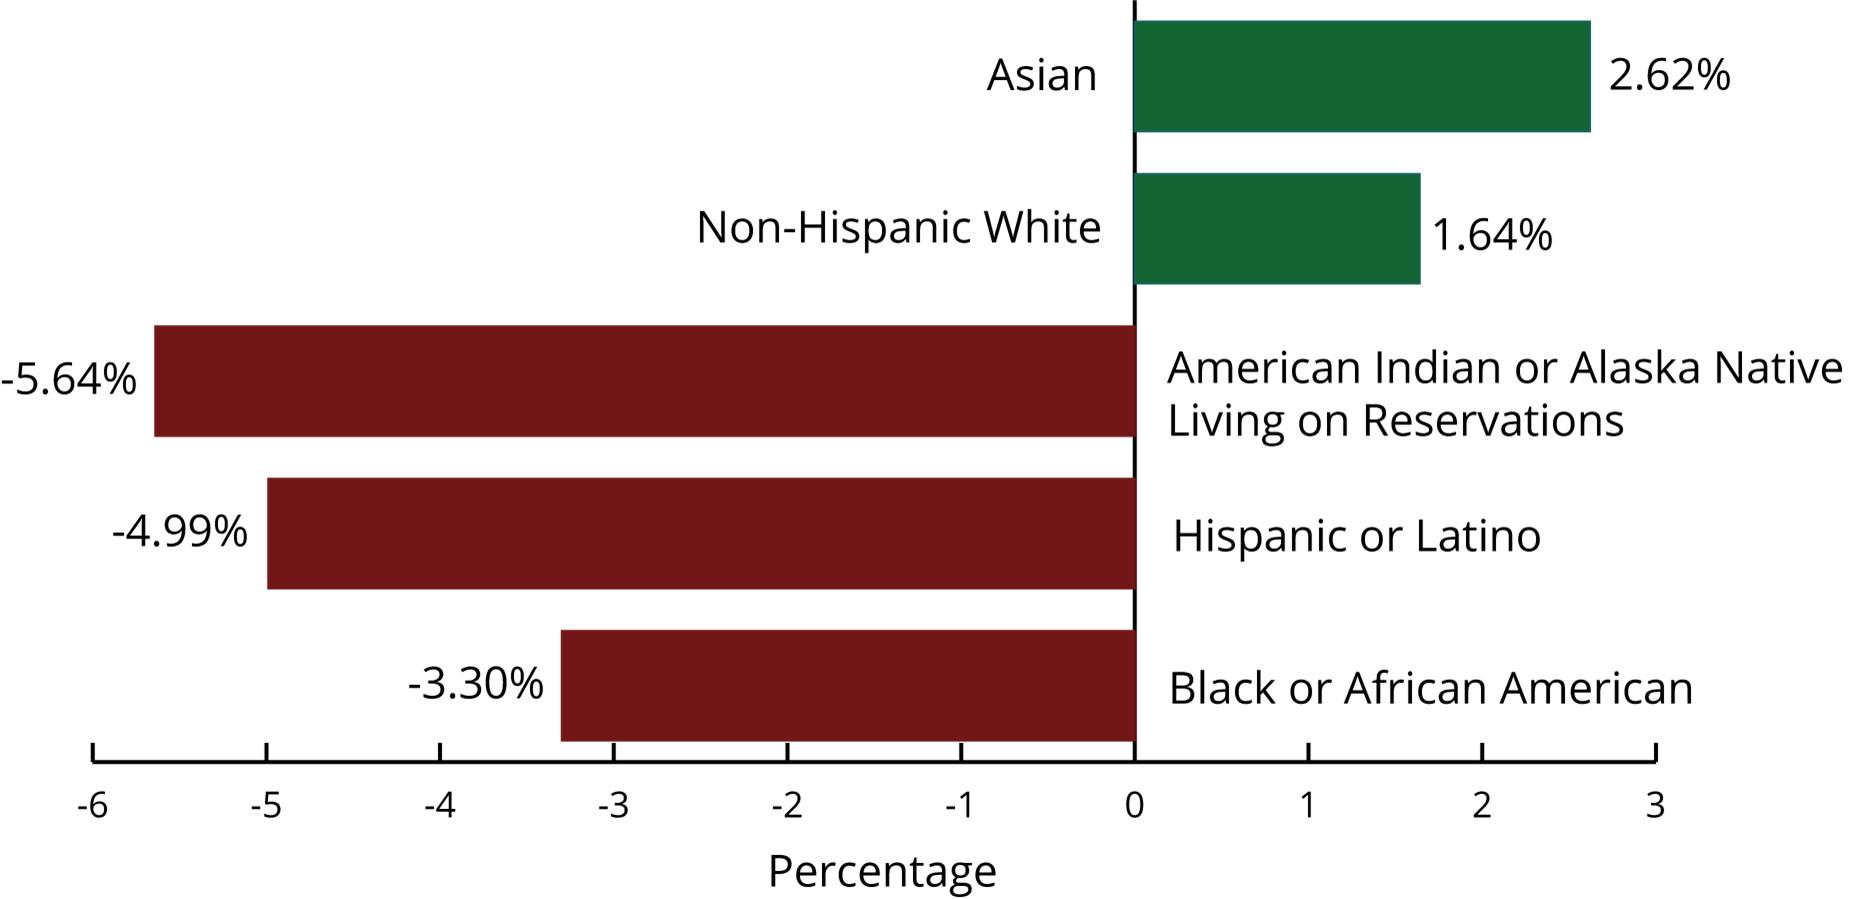
WHY THIS MATTERS
Having accurate data related to demographics, household conditions, and employment, along with other community indicators, is a prerequisite to data-driven planning. Planners and legislators in areas regulated by city, county, or state governments often do not need to contest the accuracy of their datasets regarding basic community information. On the other hand, tribal planners and programs may have no choice but to rely on data that does not fully capture their communities’ population sizes and demographics. Further, the federal programs that provide resources to tribal nations and programs reinscribe the disparities of data accuracy onto the landscape of economic opportunity.
This dynamic has played out through both short- and long-term funding programs. The Indian Housing Block Grant program, described in detail below, is one of the most well-known programs spurring development and supporting households in Indian Country. However, as with many rational systems, the establishment of the program may inspire overconfidence in its validity, despite
FIGURE 1 - Estimated Undercount and Overcount Rates in the 2020 Decennial Census. The figure compares undercounts and overcounts experienced by different racial groups, according to the U.S. Census Bureau Post Enumeration Survey. (Khubba, Heim, and Hong 2022)
Carolina Planning Journal : Volume 48 / Urban Analytics 50
the inaccuracies of the underlying data. During the initial response to the COVID-19 pandemic, the allocation of pandemic relief funds (through the Emergency Rental Assistance Program and Homeowner Assistance Fund) explicitly used the IHBG mechanism to distribute funds to Indigenous communities and nations across the U.S. (U.S. Department of Treasury 2020). As a result, some nations were unable to spend the full amount of their allocated funds, while others are still expending funds (Nair, Siebach-Glover, and Aurand 2022).
CONCRETE EXAMPLE: DESCRIPTION OF IHBG PROGRAM AND FORMULA
The Indian Housing Block Grant (IHBG) is a formula grant overseen by the US Department of Housing and Urban Development. It provides housing funding to tribes and tribally designated housing entities based on U.S. Census Bureau data. The IHBG was developed after the passage of the Native American Housing and Self Determination Act (NAHASDA) which gives tribal nations and housing entities the ability to determine how to spend housing block grants to meet their own needs.
To allocate the annual funding block among all tribal housing programs as fairly as possible, the U.S. Department of Housing and Urban Development (HUD) compiles decennial census data and American Community Survey Estimates every year to allocate funding according to the level of need experienced by the different tribal nations and housing entities. The compiled information includes seven variables that consider a tribal service area’s AIAN population; the number of low-income, very low-income, and extremely low-income households; the number of households that are overcrowded or lack complete kitchens or plumbing; the number of households with severe housing cost burden ; and a measure of affordable housing built before 1997 relative to the number of lowincome households.
In acknowledgment that IHBG data may not accurately describe local conditions, HUD has developed a formal process, referred to as a “census challenge,” that allows tribes to collect and challenge federal census data in order
to potentially receive a higher block grant allocation if the data they collect indicates a higher level of need in terms of the aforementioned variables (U.S. Department of Housing and Urban Development 2017).
While a census challenge has stringent requirements that must be met, these requirements may act to limit the number of tribal nations that can successfully complete a challenge. HUD requires that a census challenge record complete survey responses from the minimum of either seventy percent of all households in a service area or seventy percent of 572 randomly selected households in a service area (US Department of Housing and Urban Development 2017). Census challenge questions also require that households report personal information including household income, household expenses, and the number of people living in a household. Tribal nations may also require more expensive in-person data collection relative to other areas, since around thirty-five percent of households on tribal lands lack broadband internet access and many homes on reservations and in Alaska Native villages neither have addresses nor receive USPS mail. These obstacles thus make for more time-intensive survey data collection (McGill 2018; Wiersema 2020).
Due to these limitations, tribal nations conducting successful census challenges must provide respondents with meaningful monetary incentives as well as hire and train field staff to visit households to conduct in-person surveys with potential respondents, often necessitating multiple home visits (Maher 2020). The resources required to collect, clean, compile, and submit a census challenge, along with the limited utility of the data—which can only be used to challenge IHBG funding data—has likely limited the number of successful census challenges. Records indicate that only five of the 574 federally recognized tribes have successfully collected and submitted data to challenge all seven IHBG needs variables since HUD’s last IHBG revision in November 2016 (U.S. Department of Housing and Urban Development Office of Native American Programs N.D). Additionally, census challenge data submitted to HUD do not increase the overall amount of funding towards the Indian Housing Block Grant; the data merely increase the tribe’s
FEATURE ARTICLES
51
proportion of overall funding (U.S. Department of Housing and Urban Development Office of Native American Programs N.D).
IHBG funding falls short to individual nations due to substantial undercounts. For example, the successful census challenge by Tohono O’odham Nation in Arizona was accepted by HUD in March 2018 and increased their funding allocation by approximately $4.2 million over five years (Manuel and Verlon, 2019). In other words, without submitting a census challenge, they would have received about $4.2 million less toward housing development, operation, and maintenance. While data are limited, we have compiled the results from the five nations that have successfully conducted census challenges for all IHBG variables in Figure 2. The figure indicates that across four of the five displayed data points, tribally collected data showed that needs were, on average, thirty percent higher than indicated by ACS data. On the reservations that have submitted successful census challenges wherein HUD certified the validity of collected data, ACS data
have substantially undercounted need across all variables.
The Census Bureau oversamples in tribal areas and other places with low populations to help account for inaccuracies due to small sample sizes in these areas, but data can still have wide margins of error and high coefficients of variation (measures indicating lower data validity). In total, 22.6 percent of tribal lands had a coefficient of variation indicating very low reliability of ACS population data in the 2020 five-year ACS estimates (CV > forty percent) (Census 2020a; ESRI 2021).
For example, the Shinnecock Indian Nation in New York has 819 people living on the reservation, according to the 2020 Decennial Census. However, ACS five-year estimates ending in 2020 indicate that just sixteen people live on the reservation with a margin of error of thirty-one people (CV = 117.78 percent) (US Census Bureau 2020a; 2020b).
IHBG data, which rely on the same inaccurate ACS data, report zero households having an annual income of less
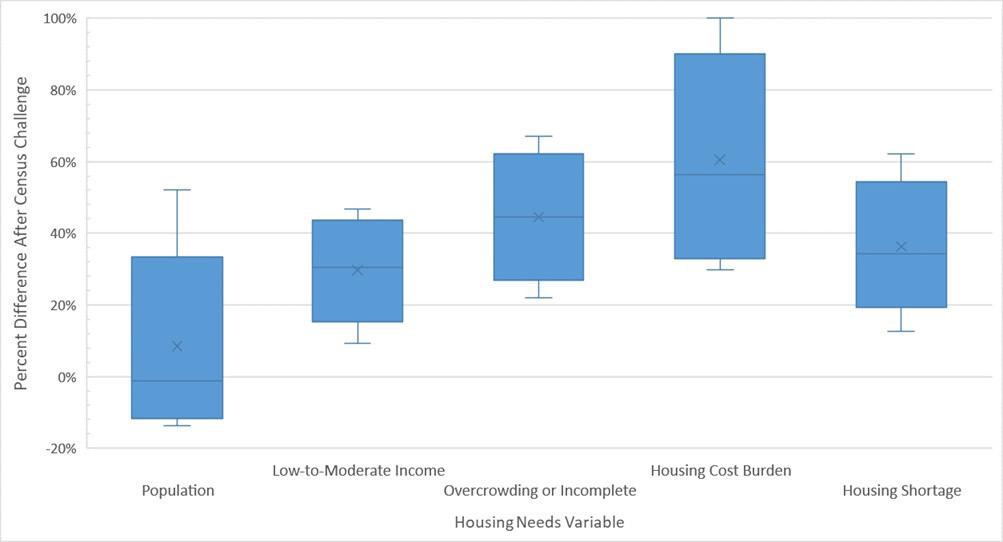
Carolina Planning Journal : Volume 48 / Urban Analytics 52
FIGURE 2 - Percent Change in Needs Variable After Census Challenge. Among the five Tribes that conducted and submitted a successful Census Challenge where HUD accepted tribally-collected data, almost all variables indicated higher level of need, on average. Note: this chart combines Low-to-Moderate Income (income less than eighty percent) into one variable, but the formula distinguishes between income under thirty percent, income under fifty percent and income under eighty percent separately).
than eighty percent of the Area Median Income. For the Shinnecock Nation, it is likely that the data highly underrepresented the need for housing funding, and, as a result, the Shinnecock Nation Housing Authority received the minimum annual needs portion of its IHBG allocation in 2022 of $60,417 (US Department of Housing and Urban Development Office of Native American Programs N.D).
Even tribal areas with low coefficients of variation (below twelve percent), which indicate high reliability (ESRI 2021), can have substantial differences between ACS-reported population estimates and census-reported populations. For example, the Akiachak Alaska Native Village Statistical Area (ANVSA) has a relatively low coefficient of variation, 9.63 percent, yet the population reported in the 2020 Census was 48.2 percent higher than the population reported in the American Community Survey five-year estimates ending in 2020 (Census 2020a; 2020b).
Furthering the harms of apparent inaccurate data for Indigenous tribal entities like the Shinnecock Indian Nation or Akiachak Native Community, other formula grants have used IHBG data to determine funding allocations. For example, the Tribal Transportation Program uses IHBG population data to help allocate $505 million in annual funding to help address transportation needs across tribal lands (DeWeaver, Winchell and Sultan 2019; US Department of Transportation 2022). Furthermore, at the start of the COVID-19 pandemic, IHBG data were used to determine allocations of eight billion dollars in CARES Act COVID-19 relief funding for tribal governments.
PROPOSED ALTERNATIVE
Rather than treating tribal lands, reservations, and nations as an afterthought in the collection of US Decennial Census and American Community Survey data, the Census Bureau should first affirm tribal sovereignty by attending to their unique geographies, and second meet the needs of its own existing data products.
To accomplish this, the Census Bureau should provide an option for tribal governments and entities to conduct their own data collection, with technical support and direction that meet the requirements of the Decennial Census and
American Community Survey. These programs should allow compatibility with existing census data products and provide the opportunity for tribal nations to collect additional data points that are needed to plan effectively. The fidelity of data should be sufficient to merge with existing census geographies, accounting for the mismatch between the lands within reservations and Alaska Native villages and the states, counties, or block groups.
Each tribal nation has a unique history concerning land and geography. While some reservation lands are larger than US states, others control only a small portion of their reservation land or have few members, if any, able to live on the reservation. A significant number do not even have dedicated reservations, instead maintaining a local service area where they provide basic services to their members.
To accommodate the unique needs of the tribal nations with small or non-existent reservation lands, the Census Bureau should provide technical assistance and funding for data collection that provides the administrators with reliable and accurate data regarding membership, as they provide many services including housing and healthcare.
The proposed program has the potential to serve as a catalyst for economic development in Indian Country through creating employment opportunities and building capacity. The program should prioritize a nation’s enrolled members when hiring data collection staff, ensuring that the benefits of employment are received locally and retained within each community. Furthermore, data accuracy will be improved when staff are familiar with their communities and can attend to any cultural sensitivities.
The proposed data collection program should also include the provision of an incentive payment for survey completion. In the authors’ experience with data collection in Indian Country, providing a meaningful survey incentive (as defined by the community in question) is critical to achieving high-quality survey responses. While this practice is not currently employed in the Census Bureau’s methods, the use of a survey completion incentive affirms the importance and value of obtaining
FEATURE ARTICLES
53
data from otherwise excluded communities and addresses past injustices and usurpations of census data on Indigenous people.
Finally, the Census Bureau should consider a joint data ownership agreement for the data collected on tribal lands and about Indigenous communities. Data unique to a tribal nation’s land, history, or programs should be held in exclusive ownership by that nation. However, for the program to mesh with the Census Bureau’s existing data products, data collected in support of the American Community Survey or other programs should be managed by the Bureau, allowing compatibility with all census geographies.
DISCUSSION AND LIMITATIONS
The use of census data in tribal lands has led to problematic outcomes for Indigenous people, governments, and programs. AIAN households living on reservations or in Alaska Native villages have been systemically undercounted in the decennial census and therefore underfunded, and evidence presented in this paper indicates that ACS data, especially when used in the IHBG dataset, may be unreliable. While the Census Bureau has developed programs to increase data accuracy in Indian Country, these programs have not had their intended impact, and AIANs living in these areas continue to be the most undercounted. Providing both training and technical assistance as well as funding for tribal nations to collect their own census datasets could result in much more reliable and accurate data to be used not only by tribal governments but also by state and federal governments that depend on accurate census data to fairly allocate resources. Collecting accurate information about tribal communities’ populations can help address persistent poverty and ongoing challenges to community development.
While a new data collection program for tribal nations could address issues surrounding data accuracy and reinforce tribal sovereignty within the data realm, such a program would require an act of congress to provide the requisite funding and legal basis. The 2020 Decennial Census cost about $14.2 billion, or approximately ninety-six dollars per household (US Government Accountability Office 2021); the American Community Survey has proposed a budget of $245.6 million
in 2023 which would cost approximately seventy dollars per sampled household (Census Bureau 2022). As described in this paper, rural lifestyles coupled with a lack of access to mail and broadband can make data collection even more expensive on reservation lands compared to these averages. These barriers would likely make such a data collection program unlikely to happen anytime soon, given the US Government’s long track record of underfunding programs promised to tribal nations in treaties, including requisite provisions that concern criminal justice, health care, housing, education, clothing, economic support, and enumeration (US Commission on Civil Rights 2018).
WORKS CITED
Akee, Randall K.Q., Eric C. Henson, Miriam R. Jorgensen, and Joseph P. Kalt. “Dissecting the US Treasury Department’s Round 1 Allocations of CARES Act COVID#19 Relief Funding for Tribal Governments.” COVID-19 Response and Recovery Policy Briefs, no 2. Harvard University, Cambridge, MA, May 18, 2020. http://nrs.harvard.edu/urn-3:HUL.InstRepos:42672265
DeWeaver, Norm, Dick Winchell, and Shadana Sultan. 2019. “TRB Webinar: Understanding and Using Census Data for Tribal Transportation Programs.” Transportation Research Board, October 17, 2019. https://www.trb.org/ DataInformationTechnology/Blurbs/179573.aspx
ESRI. 2021. “An ESRI Technical Paper: Methodology Statement: 2015–2019 American Community Survey.” ESRI. March 2021. https://downloads. esri.com/esri_content_doc/dbl/us/J10020_American_Community_ Survey_2021_MARCH.pdf
Kauffman & Associates, Inc. 2017. “2020 Census Tribal Consultations with Federal Recognized Tribes: Final Report.” Kauffman & Associates Inc. for the U.S. Census Bureau, Summer 2017, https://www2.census.gov/library/ publications/decennial/2020/tribal-program/2020-tribal-consultationsfederally-recognized-tribes.pdf
Khubba, Shadie, Krista Heim, and Jinhee Hong. 2022. “National Census Coverage Estimates for People in the United States by Demographic Characteristics. 2020 Post-Enumeration Survey Estimation Report.” U.S. Government Publishing Office. Washington, DC. March 2022. https:// www2.census.gov/programs-surveys/decennial/coverage-measurement/ pes/national-census-coverage-estimates-by-demographic-characteristics. pdf
Lozar, Casey. 8 March 2023. “Indian Country gains momentum in addressing data gaps.” Federal Reserve Bank of Minneapolis, Center for Indian Country Development. https://www.minneapolisfed.org/ article/2023/indian-country-gains-momentum-in-addressingdata-gaps?utm_source=cc&utm_medium=email&utm_ campaign=CICD
Maher, Harry and Kevin Klingbeil. 2020. “Conducting A Successful
Carolina Planning Journal : Volume 48 / Urban Analytics 54
Housing Needs Assessment During COVID-19” NAIHC Legal Symposium, Las Vegas, Nevada. December 8, 2020. https://naihc.net/wp-content/ uploads/2021/12/PDF-Block-3-Barbados-A-Conducting-successful-Housing-Needs-Assess-Red-Cliff-Housing.pdf
Manuel, Edward and Jose Verlon. 2019. “O’odham Ha-We:Hejed (For the People) Public Service Announcement: Tohono O’odham Census Challenge Prevents Loss of Millions in Housing Funding” Tohono O’odham Nation Office of the Chairman and Vice Chairman. May 7, 2019. http://www.tonationnsn.gov/wp-content/uploads/2019/05/PSA-Census-Challenge-HUD-Approval.pdf
Margaret H. McGill. 2018. “The Least Connected People in America.” Politico, February 2, 2018. https://www.politico.com/agenda/story/2018/02/07/ rural-indian-reservations-broadband-access-000628/
Nair, Neetu, Sophie Siebach-Glover, and Andrew Aurand. 2022. “Serving Native American Households Using ERA: Learning from High-Spending Programs.” National Low-Income Housing Coalition, December 1, 2022. https://nlihc.org/resource/new-report-serving-native-american-householdsusing-era-learning-high-spending-programs
NCAI. 2018. “Making Indian Country Count: Native Americans and the 2020 Census.” https://www.ncai.org/attachments/Testimonial_ XthTHlGvDFbmdhaqGuvUFJPmxYsbAlsiWrcEApIkxIhddmWBvBp_2018.02.12%20NCAI%20Census%20Testimony.pdf
U.S. Commission on Civil Rights. (2018). “Broken Promises: Continuing Federal Funding Shortfall for Native Americans.” Washington, DC: U.S. Commission on Civil Rights, December 2018. https://www.usccr.gov/pubs/2018/12-20-Broken-Promises.pdf
U.S. Census Bureau. N.D. “Censuses of American Indians.” https://www.census.gov/history/www/genealogy/decennial_census_records/censuses_ of_american_indians.html
U.S. Census Bureau. 2020a. “American Community Survey, 2020 American Community Survey 5-Year Estimate”; generated by Harry Maher; using data.census.gov; https://data.census.gov/table?q=population&g=2500000US9370&tid=ACSST5Y2020.S0101
U.S. Census Bureau. 2020b. “2020 Decennial Census Redistricting Data (PL 94-171)”; generated by Harry Maher; using data.census.gov; https://data. census.gov/table?q=population&g=2500000US9370&tid=DECENNIALPL2020.P1 U.S. Census Bureau. 2022. “Fiscal Year 2023 Budget Summary.” https://www2.census.gov/about/budget/census-fy-23-budget-infographic-bureau-overview.pdf
U.S. Constitution, Article VI, Clause 2. (June 1788) https://constitution.congress.gov/browse/article-6/
U.S. Department of Housing and Urban Development. 2019. “Challenging U.S. Census Data: Guidelines for the Indian Housing Block Grant Formula. U.S. Department of Housing and Urban Development Office of Public and Indian Housing, July 17. https://www.hud.gov/sites/dfiles/OCHCO/ documents/4119Census.pdf
U.S. Department of Housing and Urban Development Office of Native American Programs. N.D. “IHBG Formula.” https://www.hud.gov/program_offices/ public_indian_housing/ih/codetalk/onap/ihbgformula
U.S. Department of Transportation. 2022. “Office of Tribal Transportation: Tribal Transportation Program.” U.S. Department of Transportation: Federal Highway Administration, November 1, 2022. https://highways.dot.gov/federal-lands/programs-tribal
U.S. Department of Treasury. 2020. “Coronavirus Relief Fund Tribal Allocation Methodology.” U.S. Department of Treasury. May 5, 2020. https:// home.treasury.gov/system/files/136/Coronavirus-Relief-Fund-Tribal-Allocation-Methodology.pdf
U.S. Government Accountability Office. 2021. “2020 Census: Innovations Helped with Implementation, but Bureau Can Do More to Realize Future Benefits” June 14, 2021. https://www.gao.gov/products/gao-21-478
Wiersema, Alisa. 2020. “Experts Worry Push for 2020 Mail Voting Could Leave Native American Voters Behind” ABC News, May 7, 2020. https:// abcnews.go.com/Politics/experts-worry-push-2020-mail-voting-leave-native/story?id=70411683
U.S. Marine Corps Installations East. 2017. Marine Corps Installations East: Economic Impact 2017. UNDP. 2008. Human development report 2007/2008. Fighting climate change: Human solidarity in a divided world, UNDP. World Bank. 2010. World development report 2010: Development and climate change. (World Bank).
FEATURE ARTICLES
55
THE VALUE AND APPLICATION OF DIGITAL DATA FROM LOCATION-BASED SERVICE VENDORS
CYNTHIA ALBRIGHT, FAICP, CUD, GISP
Cynthia Albright serves as Vice President of Planning for Motionworks International. She oversees the company’s transportation and municipal planning verticals, including the Citycast.io enterprise software, promoting the company’s mission of making population mobility data and location intelligence more accessible and actionable to consultants, agencies, communities, and enterprises. She has thirty-three years of experience working with spatiotemporal data and software. The American Planning Association (APA) recognized her and her team in 2019 with the Gold National Planning Achievement Award in Transportation. Her recent awards include the 2019 DeBoer Excellence in Planning Award by the Nevada Chapter of APA; 2018 Distinguished Professional Planner, State of Nevada APA; 2018 Steadman’s People’s Choice Award, The Western Planner; 2018 “Reno People Project”, and earlier awards from the Nevada Chapter APA, Nevada ASLA, and the Builder’s Association. Her 2018 TEDx talk, “The Pearls of Urban Design” is viewable on YouTube. Her work has been featured in Planning Magazine, Airsage Magazine, Zeroing In, an ESRI publication, California Planning & Development Report, Nevada Planner, APA’s Transportation Planning Division News, ACEC Engineering in British Columbia, and others.
ABSTRACT
Data science is becoming an integral component in urban planning, and planners must become comfortable with leveraging such data and integrating it into workflows. This article generally summarizes “big data,” (heretofore referenced as “population movement data”) and its usefulness to the planning profession, as well as how to engage with data vendors in productive ways. It provides guidance for planners engaging with location-based service vendors, framing the options available for data management and visualization.
Carolina Planning Journal : Volume 48 / Urban Analytics 56
INTRODUCTION
Population movement intelligence aggregates data about movements of individuals (for example, travel mode and distance) and their movement activities (such as destinations and dwell times). This information is gathered from a multitude of technologies, like smartphones and credit card usage. It is then stored and distributed via various vendors and agencies. This information can— and should—be utilized to tailor plans to a community’s needs, as it provides historical, real-time, normative, and predictive mobility insights.
Population movement intelligence often takes the form of ‘location-based services’ (LBS) data, which is a mix of navigation-GPS, sensor proximity data from apps on our devices, combined with in-vehicle navigation-GPS data. Together, the data provides a date and time stamp, as well as a geographic location (commonly expressed in latitude and longitude).
After years of expensive and peer-reviewed research, the Transportation Research Board recognized LBS data as a valuable substitute for traditional travel demand survey modeling. The information is more robust, affordable, readily available, and accurate within acceptable R2 values when compared with traditional traffic counting measures.
Planning agencies cannot ignore the utility of such “big data.” This data can be used to learn about intercity mobility, the local market variance, market gaps or saturation, redevelopment opportunities, or identify geographic areas that lack healthy food options and grocery stores.
The data can also identify visitor travel routes to these destinations which enables planners to investigate transit and other public mobility services such as bike share and e-scooters along these travel routes, as well as land use densities, employment locations, and social demographics. to create policies and services to address social inequities in goods and services.
BEST PRACTICES FOR RESEARCHING VENDORS AND PRODUCTS
Population movement vendors have relationships with telecommunication companies and other sources to obtain mobile location data (Albright 2023)1. Vendors acquire a relatively small percentage (market penetration rate) of the total data generated from these combined sources. This percentage varies by vendor. A vendor’s percentages should be between three percent and eight percent at minimum.
When addressing cost, it is helpful to understand how and why vendors are pricing their products the way they are. The cost for LBS data is determined primarily by three factors:
• The size of the study area;
• The number and type of data metrics; and
• The delivery method.
An increasing number of vendors offer webbased self-service platforms with pre-packaged data metrics, referred to as software-as-a-service (SaaS). With SaaS, the provided user interface eases typical difficulties of handling and managing tens of millions of data points. Though SaaS may make processing data easier, it can pose a hefty upfront cost. Additionally, SaaS removes the ability to choose visualization tools for the data. This may be a boon for some planning agencies, but agencies with more skilled users may want access to the raw data where they can choose the visualization tools themselves.
When researching potential vendors, one should request a personalized demonstration. As many vendors have data overlaps, planners should pay attention to the look and feel of the vendor’s user interface—something that a personalized demonstration can help to uncover. Planners should also consider the economics of vendors, as pricing plans vary widely. Planners should ask vendors the following questions
FEATURE ARTICLES
57
that can address commonly relevant concerns:
1. How is the data aggregated? Is it extrapolated to represent the total population or is it an actual digital (or synthetic) population?
2. If extrapolated, what are the typical market pentration rates and sample sizes for the particular region and for the requested type of analysis? Do these rates vary across urban, suburban, or rural locations?
3. Is the historical aggregated by mode share? Such as rail, transit, bike, and pedestrian.
4. What is the data’s spatial precision? This is usually expressed in meters.
5. What is the data latency? That is, how long before the data is delivered?
6. Is the data capture frequency the same for all products?
7. Is historical data available to compare with current data?
8. Does the vendor sell products as a subscription service, or can it be purchased as a one-off project?
9. In general, how are the data solutions and products priced?
VENDORS’ USE OF DATA EXTRAPOLATION PROCESS
Data vendors curate their data panels and retail their population movement products generally in two ways: extrapolation or synthetic population. The science of creating LDS data is extremely complicated, but planners should be aware of the different methods used to create data products. The most common method employed by almost all vendors involves an “extrapolation” process. Simply stated, suppliers provide vendors raw data from tens of millions of individual devices and GPS-data from commercial truck trips for processing (Albright, 2023)2.
These tens of millions reflect a percentage of the total smart phone users and commercial vehicles traveling daily generating location-based data. The ratio of devices in a vendor’s data panel is their market penetration rate and data sample for processing. The data is processed into travel patterns at a comprehensive scale by extrapolation. In order to simulate the travel patterns of the total population, vendors correlate the home locations of their data sample to the US Census block group population estimate and extrapolate the sample to emulate the total.
This method allows vendors to aggregate their data to a specific geofence and provide reliable data from a sample of devices in lieu of collecting data from the nationwide population, currently 331.9 million (Albright 2023)3. By contrast, “synthetic population” is a nationwide digital population created by Motionworks.
For example, Airsage focuses its products on the transportation and tourism industries with nationwide data coverage, variable pricing models and an annual subscription offering. The extrapolated origin and destination data is delivered with attributes identifying trips made by residents, workers, or visitors by the day and time, trip purpose, home locations and social demographics of trip makers.
Carolina Planning Journal : Volume 48 / Urban Analytics 58
Airsage also offers an Activity Density product, which is the GPS coordinates of the aggregated trip ends and is highly effective when processed with ESRI’s Hot Spot Analysis tool. The output illustrates the most popular destinations in geographies of any size. Planners can also examine travel distances, low use amenities, and populations missing from the visitor pool to determine what barriers, if any, affect park visitation (See Figure 1).
By contrast, the vendor Near has a global footprint of extrapolated population movement data with a focus on consumer spending and trade area analyses. The Near platform offers several levels of access from a simple report of all observed devices for a specific area, complete with a variety of metrics, to a complex trade area model.
Like others, Near allows users to define a boundary
polygon (such as a downtown) and retrieve a report that includes visitation heatmap of popular locations, visitation peaks and valleys over time, popular days and times of day, visitors’ common daytime and evening locations (to understand feeder markets to the downtown), visitors’ routing before and after they visit the downtown, and demographic data on visitors observed within the boundary polygon. Near’s reach currently extends to forty-four countries. The vendor is a desirable option for cities and states that share international borders in order to understand the full spectrum of movement between geographies.
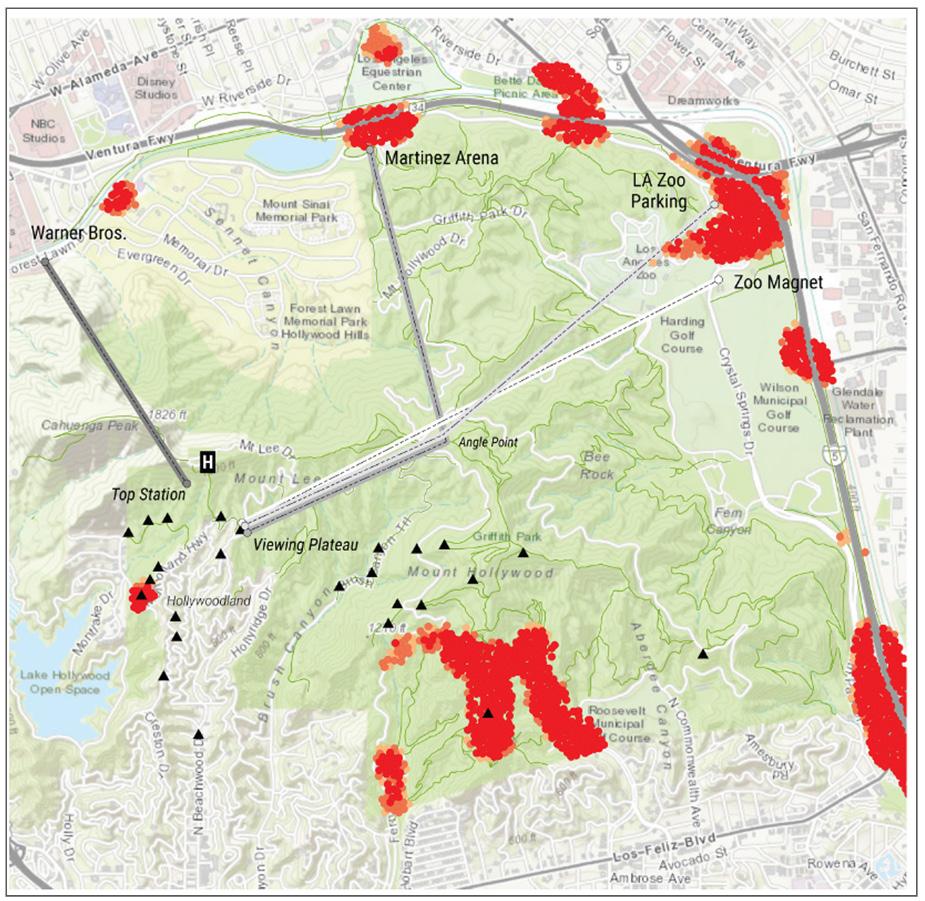
Streetlight administers extrapolated nationwide data with metrics specifically designed to serve transportation professionals and MPOs responsible for regional travel demand models and congestion analyses. Their data
products are delivered via an ondemand, self-serve platform with easily uploaded geography for analysis and downloaded data results to .csv file formats. Their onscreen visualizations include 3D profiles of popular destinations along travels routes as well as easy-to-read charts and graphs.
VENDORS’ USE OF SYNTHETIC POPULATION TECHNIQUES
An alternative to the approach of processing data from tens of millions of devices and commercial truck trips is a nationally curated “synthetic” or “digital” population. A synthetic population is generated by a complex modeling and algorithmic approach that digitally represents a true population at time and place without the need for a geofence (Kressner 2023). The model processes inputs from over 300 million devices, US Census sociodemographic and locational information, national transportation network and travel data, and travel ground-truth behaviors.

FEATURE ARTICLES
FIGURE 1 - Hot Spot Analysis Output for Griffith Park, City of Los Angeles. Hot spots identify the highest-use areas among points of interest throughout the 4,000-acre city park to reduce congestion and minimize visitor arrivals and parking in adjacent neighborhoods. Image by author.
59
FIGURE 2 - An example of an adjacency matrix tool. This tool isolate locations with large movements between them to quantify mode share and implement strategies to reduce carbon emissions; compare the built environments with neighborhoods that have strong connectivity with those that have low connectivity to explain the variance. This tool allows the user to evaluate public services and public infrastructure as destinations, examining movement patterns between neighborhoods of various social demographic classes to inform decision making.. Image by author.
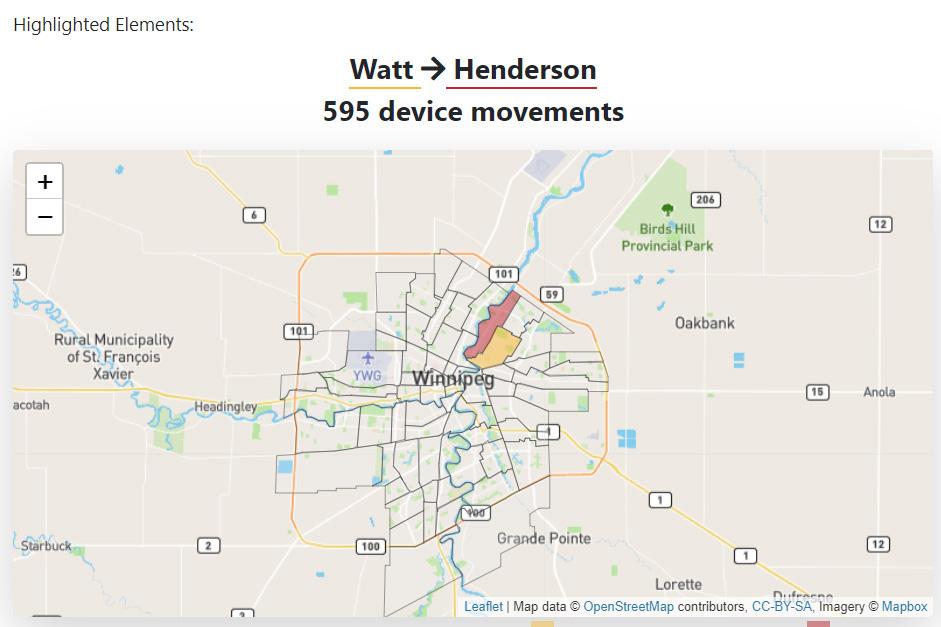
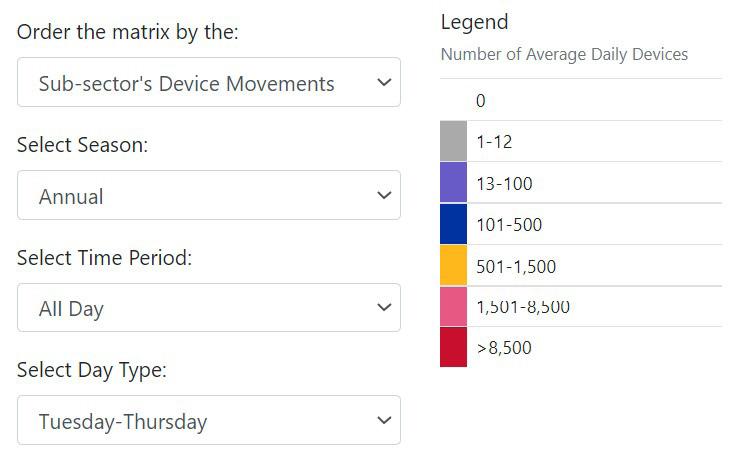
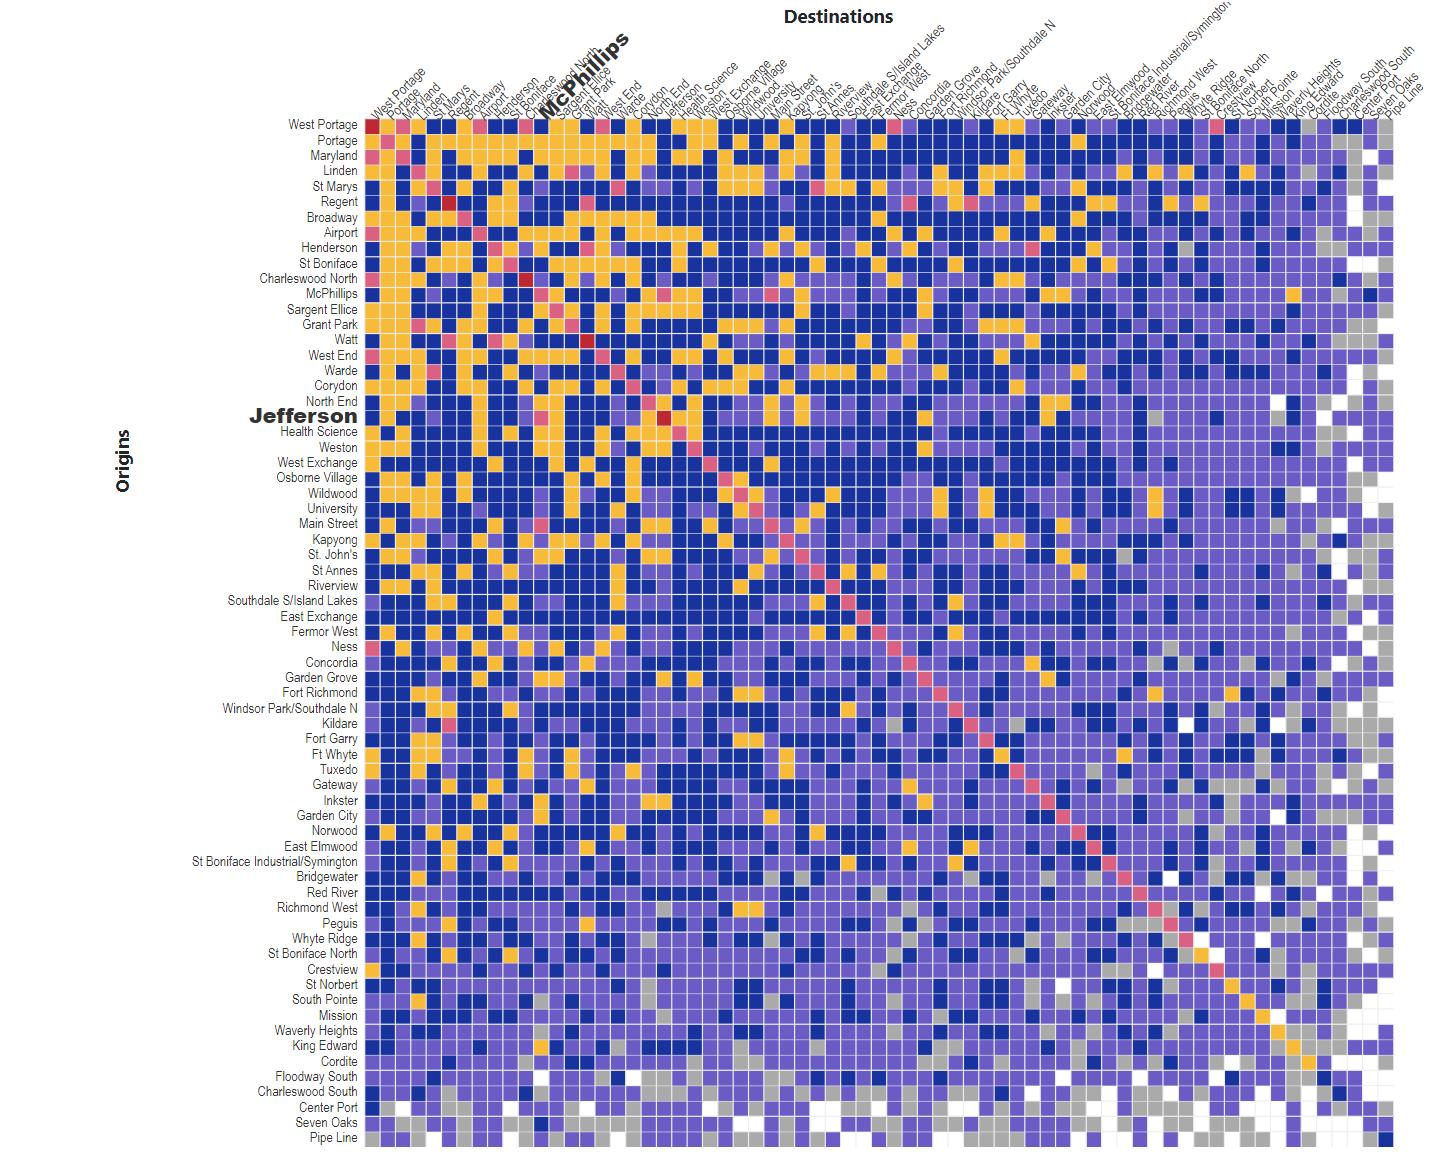
Carolina Planning Journal : Volume 48 / Urban Analytics 60
This allows the user to generate and calibrate a simplified, microscopic representation of an actual population (Kressner 2023). It is simplified in the sense that it does not contain all the possible population attributes--only those part of its intended design. It is also microscopic, meaning that every person and household is represented individually. Synthetic or digital population is not identical to a real population, meaning you will not find an exact virtual copy of yourself or anyone else within it. Rather, it is generated in such a way that a virtual person exists that is statistically representative of you and everyone else in the population.
A synthetic population enables practitioners to analyze the travel behaviors of the population anywhere in North America based upon the synthetic travel diaries. The diaries detail each person’s travel and activities at locations in a timeline format. The methodology is not only the most accurate representation of the total population available, but it also has the added benefit of protecting individuals’ privacy4.
The Transportation Research Board of the National Academies under the TRB-IDEA program (NCHRP-184) funded an extensive technical research report on the viability and legitimacy of building a data-driven synthetic population. Josie Kressner, PhD, developed a methodology that produced locally sensitive synthetic populations for three different metropolitan planning organizations (MPOs): Seattle, Atlanta, and Asheville. Dr. Kressner’s findings concluded that synthetic travel diaries successfully compared with those of the activity-based models in use by each of the three MPOs, the Census Transportation Planning Package flow data, and the Longitudinal Employer-Household Dynamics data5.
Dr. Kressner’s early research is supported by numerous other accounts from professionals in the transportation field. Synthetic population provides the highest level of confidence that the data represents the travel behaviors of the total population regardless of geographic size and community context.
Motionworks is unique among vendors for several relevant
reasons. First, Motionworks’ data is a synthetically generated representation of the entire population. Second, the company’s products include a scenario planning software called Futurecast that enables planners to modify growth rates, land uses, employment figures; densify or shrink population; and expand or contract transportation infrastructure to forecast change over time and conduct trend analysis based upon its nationwide population movement intelligence.
Third, all its metrics are reported at the person level for everyone in the US and Canada. Finally, Motionworks nationwide Placecast product summarizes insights on a place or group of places (e.g., all the fast-food restaurants) from an inventory over 10 million locations and the paths used for travel.
SELECTING PLANS
For urban planners, population movement intelligence has “the strong potential to enrich various stages of plan making, including visioning, problem assessment, scenario planning, and plan implementation” (Desouza and Smith 2016)7. It is especially true for data-driven planning meant to advance social equity and efficient transportation infrastructure investment, improve fire protection management and public safety, and realize economic development.
To advance social equity and investment in transportation, communities need to understand where people made vulnerable by poverty live in relation to:
• Essential public services;
• Primary employment destinations;
• Existing transit, public bike shares, or e-scooters;
• Gaps in public transportation access;
• Travel routes with large volumes of short distance (< 2 mi.) trips;
• Most frequent travel times by route; and
• Opportunities to add pedestrian and bicycle
FEATURE ARTICLES
61
infrastructure.
The US Census supplies some data and transit agencies generally collect ridership; ideally through automated passenger counters that tabulate boardings and alightings per stop. Departments of transportation tally traffic volumes along primary roadways. But LBS data fills essential blanks such as corroborating travel volumes throughout the complete roadway network with a granular day of week and time of day counts, travel distances and length of trips, and actual versus posted travel speeds by roadway. Travel mode usage (car, transit, LRT) provides trip counts for each mode to establish usage benchmarks or compare target rates. Analyzed together, planners gain insights into suitable locations for active transportation infrastructure (trips less than two-three miles in length) or commuter transportation services (long distance trips). Counts by origin and destination zones, coupled with traveler demographic profiles furnish a deep understanding of the behaviors of vulnerable populations and the frequency of accessing public services, employment destinations, and proximity to transit.
To improve public safety, population intelligence affords agencies the wherewithal to dynamically shift personnel and equipment resources between station locations. They can do so based on the knowledge of where high concentrations of the population spend large amounts of time by day of week or season, rather than simply by calls for service. Predominant travel routes and travel times, popular destinations, and average dwell times enable agencies to respond accordingly. With historical data going back to 2019, agencies can audit extreme community events such as holidays and/or fire locations to map transportation bottlenecks and prepare emergency evacuation plans.
Economic development requires a clear understanding of the market, including employers, employees, home and work locations, transportation services and usage, and popular commercial destinations. LBS data can be aggregated for numerous comparative markets and compared to gain key insights into common features contributing to a markets’ success.
CONCLUSION
The field of population intelligence and urban data analytics continues to grow exponentially. The various vendors and their software solutions can unlock insights that were previously unattainable. However, some critique big data vendors on the basis of their sales approaches. Inquiries are handled by salespersons. Often, sales staff don’t understand the planning sector. Meanwhile, the planner may not appreciate big data. This can result in a disconnect. More than once I found myself with more big data than I was fully prepared to manage.
Planners are advised to start small. Ask questions. Develop relationships. I found several vendors employ transportation professionals because transportation is a disproportionately large market share. Motionworks is one of the few vendors with professional urban planners and survey researchers on staff to guide planners.
A general rule of thumb is to buy LBS data in as granular a format as possible, then to aggregate it to various geographies, time scales, and days for analysis. This is a better approach because once a vendor aggregates the data to a specification, it cannot be disaggregated without incurring additional costs. Investigate the data with other known sources, such as traffic counts, available visitor counts, and US Census data, to make sure the data aligns with other sources before spending a lot of time analyzing.
Finally, online courses offered by ESRI and Coursera can educate planners in data management, integration and processing, basic programming, distributed computing, modeling and management systems, deep learning, and machine learning. Creating valuable information from millions of data points requires confidence. A planner’s time invested to learn the analytical and visualization tools will pay significant dividends to problem solve using robust big data and help make our communities livable, resilient, and relevant.
Carolina Planning Journal : Volume 48 / Urban Analytics 62
END NOTES
1 There are less than a dozen relevant population movement vendors. They include Airsage, Environics, INRIX, Near, Moovit, Motionworks, Replica, Safegraph, StreetLight, Waze, and Wejo. Data vendors Motionworks, Safegraph, StreetLight, and Wejo also deliver their data through the ESRI Marketplace and through direct contact.
2 Data vendors onboard suppliers frequently producing growth in their data supply along with regularly updated datasets for sale.
3 For data aggregation purposes, a geofence is any type of geographic boundary for study. This may encompass a neighborhood, downtown, street corridor, or any U.S. Census geography.
4 Josephine D. Kressner, Ph.D. “Synthetic Household Travel data Using Consumer and Mobile Phone Data,” IDEA Innovations Deserving Exploratory Analysis Programs. Transportation Research Board. National Academies of Sciences, Engineering, Medicine. NCHRP IDEA Project 184. March 2017. https://apps.trb.org/cmsfeed/TRBNetProjectDisplay. asp?ProjectID=3993.
5 The Census Transportation Planning Package (CTPP) is a special tabulation of U.S. Census data that includes demographic characteristics, home and work locations, and journey to workflows designed for transportation uses. https://www.ctpp.transportation.org/20112-2016-5-year-ctpp.
The Longitudinal Employer Household Dynamics (LEHD) data is a U.S. Census product generated by merging employee and employer data for over 95% of employment nationwide. https://lehd.ces.census.gov. 6.
Full disclosure, I joined Motionworks in January 2022 because of their digital, microscopic population. Motionworks data represents every person and every household individually which is ideal for planning. 7.
Devin C. Desouza and Kendra L. Smith, “Big Data and Planning,” PAS Report 585, December 2016, page 2.
6 I joined Motionworks in January 2022 because of their digital, microscopic population. Motionworks data represents every person and every household individually which is ideal for planning.
7 Devin C. Desouza and Kendra L. Smith, “Big Data and Planning,” PAS Report 585, December 2016, page 2.
WORKS CITED
Andrews, Clint, Keith Cooke, Alexandra Gomez, Petra Hurtado, Tom Sanchez, Sagar Shah, and Norman Wright. 2022. “AI in Planning White Paper.” American Planning Association. https://www.planning.org/ publications/document/9255930/
Desouza, Devin C., and Kendra L. Smith. 2016. “Big Data and Planning.” PAS Report 585: page 2. https://www.planning.org/publications/ report/9116397.
Flitton, Alex. 2018. “GPS vs Cellular Locating Technology.” https:// www.agmonitoring.com/blog/industry-news/gps-vs-cellular-locatingtechnology.
Kressner, Ph.D. Josephine D. 2017. “Synthetic Household Travel data Using Consumer and Mobile Phone Data.” IDEA Innovations Deserving Exploratory Analysis Programs. Transportation Research Board. National Academies of Sciences, Engineering, Medicine. NCHRP IDEA Project 184. https://apps.trb.org/cmsfeed/TRBNetProjectDisplay.asp?ProjectID=3993
FEATURE ARTICLES
63
EXPLORING OPTIMUM HOMELESS SHELTER SERVICE DELIVERY
JIWON PARK
Jiwon Park is a graduate of Yonsei University and the Harvard University Graduate School of Design. Her research interests span urban infrastructure and the application of GIS to solving resilience challenges. As Bloomberg Harvard Summer Fellowship, Jiwon worked at the City of Moncton / Ville de Moncton on addressing homelessness through expanding social services. She is currently a land use planner at the Metropolitan Area Planning Council (MAPC) of Massachusetts.
ABSTRACT
Can GIS help municipalities make service delivery decisions for people experiencing homelessness? This paper reflects on the capacity and limitations of GIS modeling for making locational decisions for emergency shelters, beginning with an examination of the challenges and considerations in expanding shelters experienced by many municipalities, such as NIMBYism, accessibility, and community impact. It then showcases how the GIS model can integrate those considerations into site suitability analysis based on the work done in Moncton, New Brunswick, Canada, where buffer analysis between current homeless services, transportation nodes, and areas of community concern has been used to determine ideal locations for future shelters. Lastly, it discusses the broader implications of the presented work in terms of using GIS for social service planning and the ways to integrate other aspects of the technology in a more holistic manner.
Carolina Planning Journal : Volume 48 / Urban Analytics 64
INTRODUCTION
Moncton, New Brunswick faces a growing set of challenges as it seeks to meet the needs of its homeless population. In this respect, the mid-size Canadian city is hardly unique. As elsewhere, local officials in Moncton continue to adapt their strategies for resolving this seemingly intractable challenge, with the human suffering and community concern that it entails.
No single tactic or tool will solve homelessness. It will need to be addressed by every community based on its specific circumstances, and it will involve a range of solutions in every place. Yet communities do need tools to determine how best to house the homeless in their localities. Geographic Information Systems, or GIS, may be one of the best tools available to planners in Moncton and beyond to get the most out of the resources they invest in housing those in need. Here, Moncton serves as a case study for how GIS can support decision-makers that seek to improve their housing strategies.
EMERGENCY SHELTER AS PART OF THE HOUSING FIRST STRATEGY
Many countries throughout the developed world face enduring challenges linked to homelessness. The causes of homelessness reflect an intricate interplay between structural factors, systems failures, and individual circumstances. Key factors can include the lack of adequate income, insufficient access to affordable housing and health supports, and the experience of discrimination (Homeless Hub, n.d.).
One well-known approach for addressing homelessness is the Housing First strategy. Housing First prioritizes providing permanent housing to people experiencing homelessness, thus ending their homelessness, and serving as a platform from which they can pursue personal goals and improve their quality of life. This approach is guided by the belief that people need basic necessities like food and a place to live before they successfully ipursue a job, budget properly, or attend to substance use issues (National Alliance to End Homelessness, 2022).
Usually, the ‘housing’ in the Housing First approach means ‘supportive housing’, a non-time-limited affordable housing assistance with wrap-around supportive services for people experiencing homelessness, as well as people with disabilities (United States Interagency Council on Homelessness, 2018). Affordability and social services are key components of supportive housing, addressing the needs of people who have been likely to experience the trauma of being chronically homeless and mental health and addiction issues.
In the housing continuum (see Figure 1), a framework often used to communicate access to housing for people experiencing homelessness, emergency shelters are located in the lowest stage of the continuum. In some cases, homeless shelters are not even recognized as proper housing as such; therefore, they end up not being part of official housing policy.
Shier at al. (2007) defined success in the homeless shelter service delivery with three major themes: systemic characteristics of a shelter; community relationships; and the built environment. Systemic characteristics of shelter are the principles that guide the behavior of the sheltering organization’s operation and are primarily comprised of characteristics such as shelter programs, shelter management, and shelter attention to client dignity and safety. Community relationships are the ways shelters interact with the surrounding community through perceptions. This includes perceptions of the homelessand of public safety, challenges of NIMBYism, and positive community involvement. Built environment is related to the physical layout and relationships of shelters with surrounding built environment. It includes shelter congruency, shelter size, shelter location and accessibility, and a shelter’s community impact.
Although shelters are often omitted in the housing policy discussions, they can provide basic housing services when there aren’t readily available supportive housing options for homeless individuals. Even if city governments try their best to expand housing as fast as possible, in many cities where homelessness reaches a severe level there will be still people sleeping on the street every day. Securing
FEATURE ARTICLES
65
the capacity of emergency shelters in the community is very critical so that no one sleeps on the street in extreme weather conditions. Moreover, shelter can be a great tool to end homelessness if used effectively, providing immediate safety and creating paths to permanent housing.
CHALLENGES AND CONSIDERATIONS IN EXPANDING SHELTERS
Location poses one of the most significant barriers to expanding the capacity of shelters. The idea of increasing the size or number of shelters frequently gets pushback from community members who worry about the negative impacts of shelters on their safety. Property owners also raise concerns about property value decrease due to shelters being located near their buildings and negative effects on the educational environment for their children. Typically known as Not In My Back Yard (NIMBYism), organized opposition against homeless shelters is well archived in the existing literature (Davidson & Howe, 2014; Dum et al., 2017; Lyon-Callo, 2001; Young, 2012).
Another factor that city governments are supposed to consider is accessibility. Accessibility here means the accessibility to other essential social services and urban amenities to which homeless people need to have access. Those services can include primary health care, mental health and addiction, and employment support services, etc.
The meaning of and measures to achieve accessibility may vary as well. The meaning of accessibility here is primarily about access to other types of essential social services through different mobility options. For instance, in a city where public transportation is highly affordable or where they have transportation subsidies/voucher policies for lowincome and homeless persons, the area considered ‘accessible’ can be wider than cities where walking is the only available option. Accessibility can be defined in specific ways in analytic processes, such as x-minute walkshed or physical distance.
Governments should also consider community impact, meaning that the negative impacts of shelter establishment in the community should be minimized. The impacts of
shelters can vary depending on their size, physical layout, and congruency with surrounding buildings and land use.
Two major planning responses to balance accessibility and community impact can be ‘dispersal’ and ‘concentration.’ Dispersal means requiring a specified distance between problematic land uses to address undue or excessive concentration. Regarding shelters, the dispersal approach could mean shelters of smaller scales are scattered throughout the community. On the other hand, concentration approach can be effective when related services are put in one place together to create synergies between them in providing services for certain populations. It can also ease the burden of transportation needs. A planning approach corresponding to concentration for shelters would be to attract shelters and relevant social services into one site and provide more holistic services.
APPLYING GIS TO IMPROVE SERVICES TO THE HOMELESS
Governments interested in improving the services they provide to homeless members of their communities can leverage Geographic Information System (GIS) technology. A GIS is a system designed to capture, store, manipulate, analyze, manage, and present all types of geographic data. GIS can be used for variety of purposes including as a tool in both problem solving and decision-making processes, as well as for visualization of data in a spatial environment (University of Wisconsin-Madison, n.d.).
GIS has been used as a practical tool in social service planning and research. One of such uses is the analysis of current service provision. By identifying gaps related to certain types of services, GIS can indicate spatial disparity in service provision (Liu et al., 2021; Neutens et al., 2012; Walker et al., 2016). GIS can also be used to conduct spatial statistics such as spatial regression to analyze the relationships between geographic space and other variables (Chan et al., 2014; Davidson et al., 2011; Parker, 2019; Semborski et al., 2022).
GIS has rarely been used much in social service planning,
Carolina Planning Journal : Volume 48 / Urban Analytics 66
Walking distance from bus stops was used to determine the accessibility to the transit network. Depending on the walking distance, they are assigned different scores: Land parcels within a 5-min walk-shed (score5), land parcels within a 10-min walk¬shed (score3), land parcels within 15-min walkshed (score2), land parcels outside of 15-min walkshed (score1).
Walking distance from shelters is used to determine the level of dispersion of shelters. Depending on the walking distance, they are assigned different scores: Land parcels within 15-min walkshed (score1), land parcels within 30min walkshed (score3), and land parcels outside of 30-min walk¬shed (score5).
Walking distance from sensitive uses (day care centers and schools) to determine the adequate distance from points of concerns. Depending on the walking distance, they are assigned differ¬ent scores: Land parcels within 15-min walkshed (score1), land parcels within 30-min walkshed (score3), and land parcels outside of 30-min walk¬shed (score5).
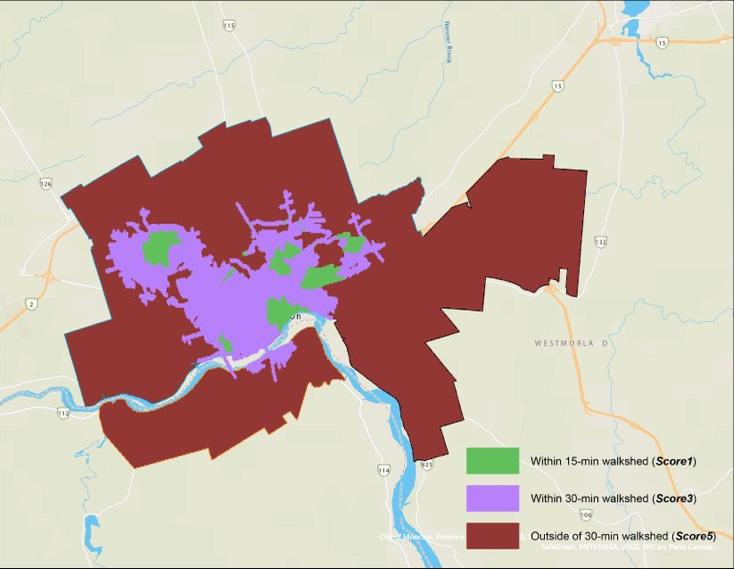
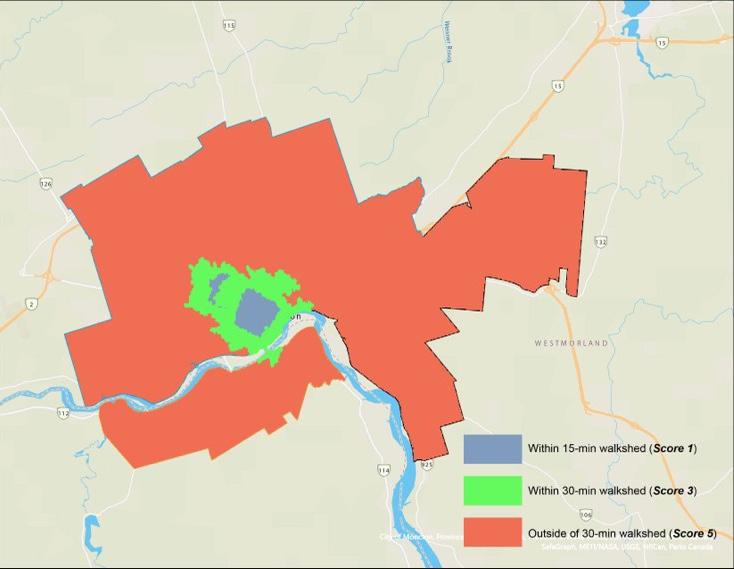
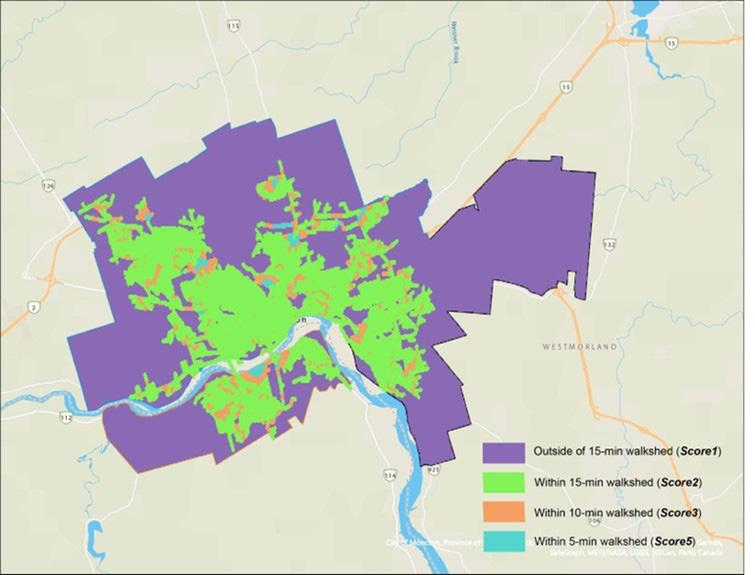
FEATURE ARTICLES
Figure 1 -
Figure 2 -
Figure 3 -
67
despite the obvious relevance of spatial analysis to site selection and suitability analysis. Such an analysis can be used to determine the best place or site for any service, based on various criteria set by the user (Briney, 2014). Weighted site selection analysis allows users to rank raster cells and assign a relative importance value to each layer when identifying those sites.
Site selection method has been used in many different areas such as economic planning, real estate planning, and crisis management. Especially site selection methods were used in many post-disaster planning literatures, for instance selecting suitable sites for temporary sheltering for disaster victims (Jahangiri et al., 2019) and evaluating spatial-temporal availability of open spaces for emergency shelters for evacuation (Yao et al., 2021). Here, weighted site selection is used to determine and suggest potential sites for emergency homeless shelters for this study.
MAPPING SHELTER LOCATIONS IN MONCTON, NEW BRUNSWICK, CANADA
MONCTON AND ITS HOUSING CHALLENGES
The City of Moncton, located in southeastern New Brunswick, is the largest city in the province. As of the 2021 Census, the city had a population of 79,470, making up 35,120 households. Compared to the 71,889 population in Moncton in 2016, the population has increased more than 10%. The metropolitan population is 157,717, which includes the City of Dieppe and the Town of Riverview.
Greater Moncton is the largest urban center in New Brunswick and, over the past five years, has been the fastest-growing metropolitan area east of Ontario. Out of more than 150 small and larger urban centers across Canada, Greater Moncton has the third-highest concentration of insurance industry employment. The community also has high concentrations of employment in manufacturing and transportation (Immigration, Refugees and Citizenship Canada, 2019).
So far, Moncton has maintained relatively affordable housing market. According to the Residential Market Analysis Report (2020), the Shelter-Cost-to-Income Ratio – a measure of how
much of the average household income is spent on shelter costs, covering both owners and renters – in 2019 was 18.7% in the City of Moncton (Turner Drake & Partners Ltd., 2020). Considering 30 percent of monthly gross income going to housing is regarded as a threshold for the affordable housing market, Moncton can still be considered relatively affordable. However, a more recent study by the Royal Bank of Canada rated Moncton as one of the least affordable cities for young people in Canada (Huizinga, 2022). It partially shows the changing housing market in Moncton, especially for people with different housing needs than single-family housing for traditional families.
As the city has grown, homelessness has emerged as one of the major community concerns. According to the public survey undertaken for the housing need assessment in 2017, homelessness was identified as one of the current issues over half of Moncton residents who responded to the public survey (Pacini & Hashim, 2019). To address this challenge, the city’s affordable housing strategy approved by the City Council in 2019 called for creating a housing authority, which led to the establishment of Rising Tide as a housing entity. Rising Tide received $15.4 million from the federal, provincial, and municipal governments over three years to supply 160 units by 2023 to reduce homelessness in the city.
The Human Development Council manages the data dashboard compiled with data from the Homelessness Individual and Family Information System (HIFIS) and the By Names List (BNL), a real-time list of all people known to be experiencing homelessness in the community. According to the dashboard, the total number of individuals experiencing homelessness as of June 2022 is 222, and individuals experiencing chronic homelessness is 174.
In Moncton, homelessness is managed through Coordinated Entry system which is a standardized approach to assessing individuals or families experiencing homelessness needs and the services they may require to achieve housing stability. The Housing Assessment Review Team (HART) was established in 2016 to implement Coordinated Entry and improve service delivery to
Carolina Planning Journal : Volume 48 / Urban Analytics 68
individuals and families experiencing homelessness in the Greater Moncton region. Service providers that make up the HART table work together to assess people’s housingrelated needs, prioritize them for resources, and link those in need to housing and a range of other supports (Greater Moncton Homelessness Steering Committee, n.d.).
PREMISES OF THE WORK
To address the challenges of increasing level of homelessness in the city, I suggested City of Moncton to consider increasing shelters. But they did not intend to locate any more shelters in downtown because two large existing shelters – 44 and 100-bed capacity each – were already getting a lot of community pushback for shelter clients congregating and walking around the
neighborhood. They wanted to locate shelters outside of downtown, which could detract from the accessibility factor to other services. To balance the interest to locate shelters farther away from core of the city and accessibility, I explored village-type shelters where multiple smaller shelters can be concentrated on one site with other social services provided in combination.
DEVELOPING INDICATORS FOR WEIGHTED SITE ANALYSIS
Community impact, accessibility, and NIMBY were considered when mapping the potential sites. Quantifiable indicators were developed for each factor to establish a formula for weighted site analysis.
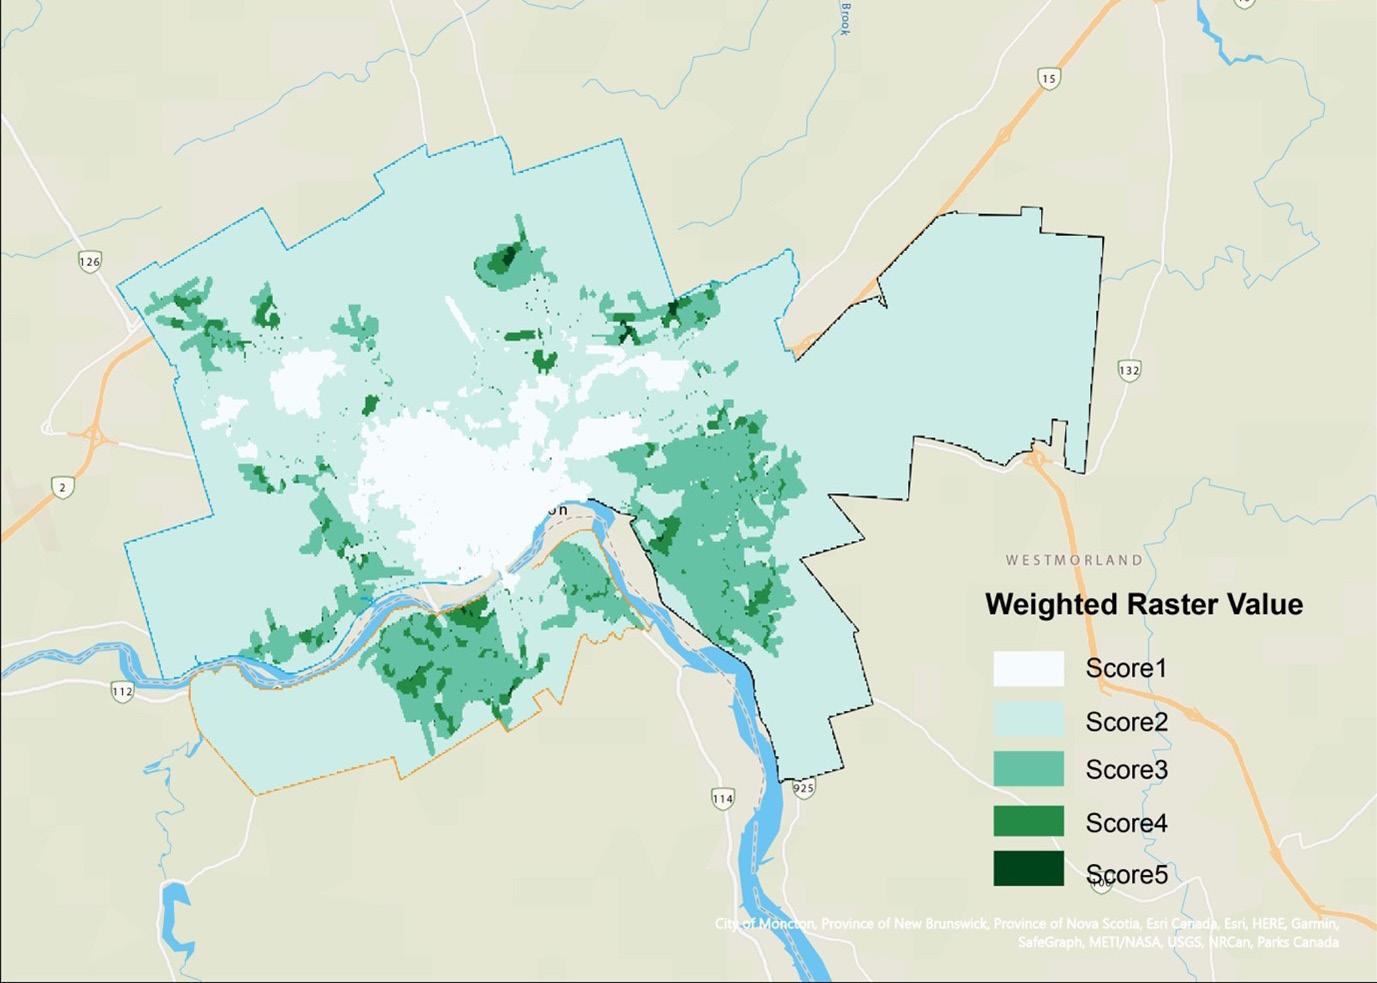
FEATURE ARTICLES
69
FIGURE 4 - Weighted raster calculation map showing the five-criteria suitability test to the Moncton area. Image by author.
For accessibility, the proximity to the bus network was used as an indicator. Considering that there was no readily available data on homeless individuals’ locations and activity areas, access to the bus network was assumed to serve as an entry point of access for them to different areas of the city. Additionally, as shelters are expected to be relatively self-sufficient in meeting the needs of the homeless people as critical services are on-site together, there is less need to move around on an everyday basis than status quo.
For community impact, the distance from existing shelters was used as an indicator. One of the concerns raised in the research process was the ghettoization of shelters due to their concentration and therefore having negative impacts on the community. Even though the impact of congregated shelters is not empirically examined as part of this study, the dispersion model was adopted in principle. Weighing in the distance from the existing shelters would help avoid excessive congregation of emergency shelters.
Lastly, NIMBY-triggering factors have been considered through the distance from the daycare facilities and schools. Though NIMBY has been expressed in various ways, one of the community’s concerns that have earned a lot of empathy was the impact on youth and children. Considering the distance from daycare centers and schools will help relieve NIMBY when establishing the shelters.
MAPPING PROCESS AND METHODOLOGY
Identify Available Land: The first step was to identify the land availability. Data about underutilized lands and properties was provided by the planning department of the City of Moncton. The data included geographic location, ownership, and assessed land values.
Consider Environmental Hazards: The second step was to exclude lands and properties on the flood zone from a list of potential sites. Moncton’s Zoning By-law ensures that all new habitable space in new constructions be built
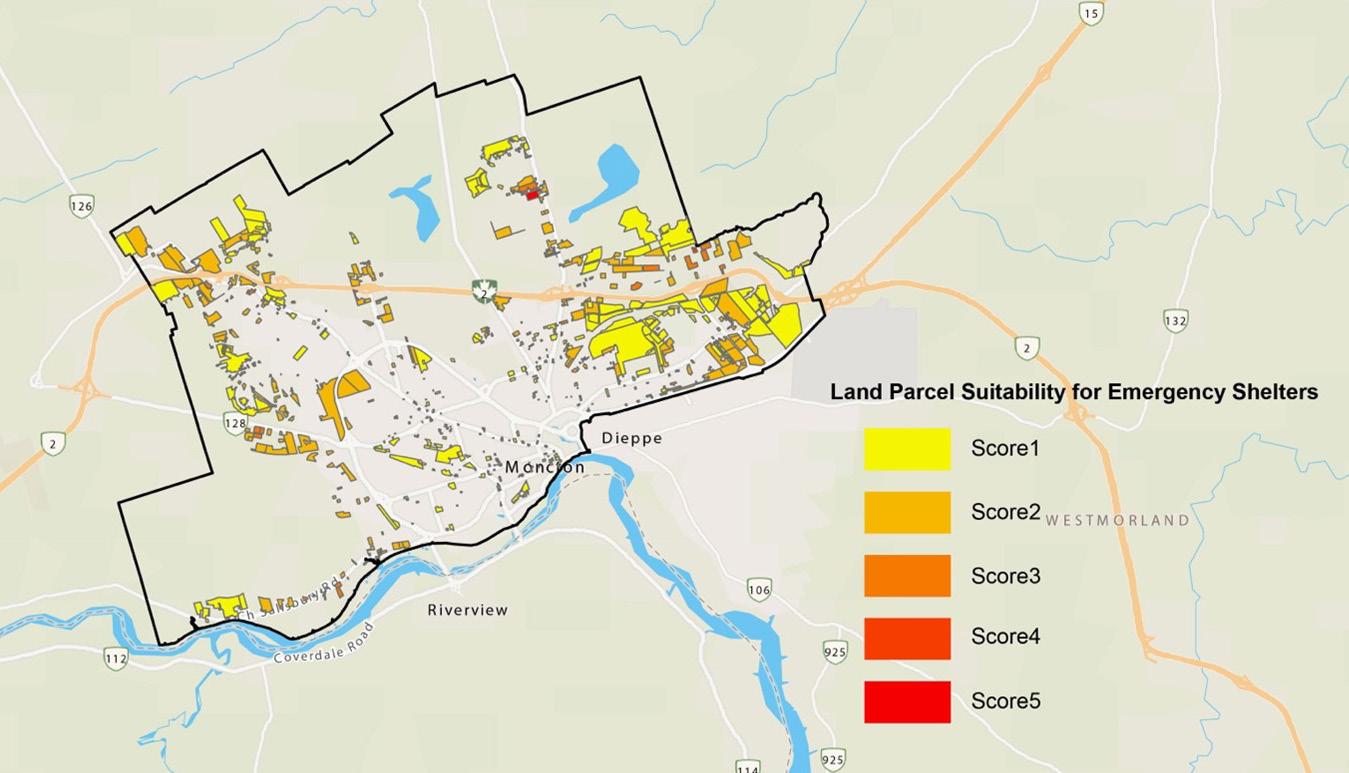
Carolina Planning Journal : Volume 48 / Urban Analytics 70
FIGURE 5 - Weighted raster calculation map applied to existing parcels in the Moncton area. Image by author.
at a minimum elevation of 10.5m to help protect properties from flooding events that may occur in the next 100 years.
Relationships with other Amenities: The third step was to construct a formula for weighted site selection. Weighted site selection and suitability analysis was used as a core mapping methodology. Weighted site selection analysis allows for the rank of raster cells and assigns a relative importance value to each layer. The result is a suitability surface that ranks potential sites from 1 to 5. Sites with a value of 1 are least suitable, and those with a value of 5 are most suitable. Weighted site selection is vital because it includes options for viewing the next best sites when the ideal sites do not work. Detailed steps are like the following:
Walkshed analysis: Walkshed analysis was conducted based on the locations of bus stops, existing shelters, and sensi¬tive uses. A walkshed is the area around a specific point of interest that is reachable on foot for the average person. Each variable was weighted 60%, 20%, and 20%, respectively, to develop a map showing the distri¬bution of suitable areas and land parcels for shelter placement. limitations
Weighted Raster Calculation: After the walkshed analysis for each variable, they are weighted based on their significance to the mapping process. Accessibility to the transit net¬work was weighted 60%, and the other two vari-ables (distance to the existing shelters and sensi¬tive uses) were weighted 20%, respectively. As a result, the raster map above shows the gen¬eral trend of land suitability for shelters. Darker the color means that they got higher suitability. One of the most noticeable trends is that downtown is the least suitable area, presumably because of the concentration of shelters, daycare centers, and schools. In Moncton, the area around Elmwood Drive, and Frenette Avenue, the area around Magnetic Hill got relatively higher suitability.
Land Suitability Analysis: After producing a weighted raster calculation map, those suitability scores were applied to the land parcel data. Land parcels were assigned the raster value based on their geographic location. In the interactive map, when users click on each parcel, they can see the
information on those parcels, including but not limited to zoning, current use, ownership, and the assessed value).
DISCUSSION
The analysis performed here can provide an example of a data-driven site selection process for a specific type of service (shelter) for people experiencing homelessness. When a municipal government tries to identify a potential site for shelter, it might not be straightforward to consider multiple factors simultaneously. GIS can help address this problem by integrating multiple factors through its core functionalities such as weighted site selection and suitability analysis. However, regardless of its merit, the GIS-led analysis can have limitations. Below are some of the limitations for discussion, specifically regarding the analysis done as part of this project. I believe they can imply broader discussions about advantages and limitations of using GIS for social service planning and the ways to integrate other aspects more holistically. limitations
RECONSIDERING THE CRITERIA USED TO DEVELOP SHELTER SITES
In identifying potential shelter locations, three factors were taken into consideration: accessibility, community impact, and NIMBYism. These three factors demonstrate tensions between different values around support for homeless individuals. Accessibility is about ensuring that people experiencing homelessness have sufficient access to resources to meet their everyday needs and get out of homelessness as soon as possible. Focusing on accessibility could encourage the congregation of different types of social services, including shelters, to make sure that people have easy access to all these services within reachable distance.
On the other hand, considering community impact and NIMBYism are usually about making sure that these services are not excessively concentrated in one area or keeping distance from where a lot of urban amenities are. While accessibility prioritizes taking into consideration the rights of homeless individuals to access different
FEATURE ARTICLES
71
services, the other two factors are more focused on meeting broader interests, including those of residents, business owners, and property owners. Simply integrating these factors into a single GIS formula might not be subtle enough to address these tensions in decision making processes.
NIMBYism and community pushback are real challenges faced by many municipal governments. They are expected to manage them through considerate planning to establish shelters successfully. However, officially recognizing NIMBYtriggering factors in decision making process can reinforce negative connotations against shelters. Besides, these considerations may lead to the result of shelters concentrated in historically neglected neighborhoods where residents tend to have lesser voice and power to influence planning. Therefore, planners and decision-makers should also consider other aspects such as income, race/ethnicity, and existing land uses of the neighborhoods in making final decisions.
RECONSIDERING THE INDICATORS
In the analysis, only a single indicator was used to represent each factor, that is: ‘proximity to the bus network’ for accessibility, ‘distance to the existing shelters’ for community impact, and ‘distance to the daycare facilities and schools’ for NIMBYism, primarily due to the time constraint of the project and data availability.
However, these indicators are predicated on certain conditions. For instance, for ‘proximity to the bus network’ to be a proper indicator of accessibility, bus networks should be reliable, frequent, and affordable enough so that they can be used on an everyday basis. The meaning of community impacts can vary depending on the context of the analysis and are dependent on many other factors such as shelter design and management. NIMBY-triggering factors may vary as well, depending on what the major concerns raised in the community were. Researchers developing GIS models and decision-makers should be aware and cautious of the premises of the analysis.
ETHICAL ISSUES
In urban planning, concentration and dispersion approach have been used for a long time to spatially distribute certain
uses. In this analysis, the distance from other shelters was considered to avoid a heavy concentration of shelters in downtown.
But it is important to recognize that setting distance between shelters could raise ethical issues. In 2019, Toronto revised a Zoning By-law to delete the existing 250-meter separation distance requirement between shelters. The recommendation came as staff were having a hard time finding sites for new shelters, with direction from the City Council to open 1,000 new beds by 2020 (City Planning Department of Toronto, 2019). In fact, in 2018, staff identified 379 potential sites for new shelters, but only 11 made the shortlist after sites were ruled out for various reasons (City Planning Department of Toronto, 2019). Moreover, the distance rule had been previously pointed out by Ontario Human Rights Commission as it could be discriminatory. It can be seen as “placing onerous restrictions on housing serving people from Code-protected groups that are not placed on other housing types.” (Ontario Human Rights Commission, 2009) Additionally, they can also contribute to the social isolation of group home residents, particularly people with psychiatric disabilities (Ontario Human Rights Commission, 2009).
The suggested consideration of the distance between shelters in the GIS analysis was not meant to imply the need for such rules in the zoning by-law. However, the developments toward abolishing buffer rules for emergency shelters in big cities like Toronto raises a question around whether the use of the distance rule could be a legitimate and desirable goals. Moncton’s current Zoning-By-law doesn’t set distance rules around shelters, which is a good starting point; the aforementioned developments in Toronto suggests possible legal implications for planning departments that institute such regulations, and emerging best practices suggest that planners shouldn’t discriminate against any type of shelter considerate while balancing concentration and dispersion approaches of social service planning.
Carolina Planning Journal : Volume 48 / Urban Analytics 72
CONCLUSION
Housing First is an important goal in addressing homelessness, but it is not always straightforward. It tends to take more time, effort, and resources to build supportive housing while people sleep on the street every night. Worsening extreme weather conditions makes the situation even more challenging during extreme heat and cold. As an interim step, increasing the number of emergency shelters is a course of action many municipalities must consider to house people on the street immediately.
Moncton, NB, Canada, had a challenge where lots of emergency shelters and social services were congregated in downtown. As a result, there were concerns expressed by landlords and business owners about the extent of congregation in downtown as they can decrease the property values and deter economic activities. In addition, as the homelessness issue is highly intertwined with drug abuse issues, there was a community sentiment that they don’t want those amenities near children-involving institutions such as daycare centers and schools. But at the same time, from a social service planning perspective, it was very critical to place them in the vicinity of the homeless individuals so that they have actual access to those amenities.
In order to integrate these seemingly conflicting interests and needs into the siting decisions for emergency shelters, GIS was identified as a useful tool. GIS integrates multiple factors through core functionalities such as weighted site selection and suitability analysis. In this analytic process, the land parcels were scored based on the walking distance from bus stops, walking distance from shelters, and walking distance from daycare centers, and schools. Those three indicators were weighed differentially – 60%, 20%, 20% - to reflect the importance of each indicator in identifying the candidate parcels.
Though GIS shows potential as an effective tool for site analysis, it shouldn’t be considered as a definitive ground for decision-making. Legal compliance and moral decision-making are required to complement the shortcomings of using GIS analysis. For instance, officially recognizing NIMBY-triggering factors in decision-making by requiring a set distance from shelters could reinforce
negative connotations around shelters. Ontario Human Rights Commission pointed out the distance rule between shelters in the zoning code is a discriminatory practice that stigmatizes shelters. Considering and institutionalizing those factors should be dealt differently, and municipal governments have to be more cautious about their approaches.
Lastly, the indicators can be more diversified and adjusted to better reflect reality. Due to the timeline of the project, only a single indicator was developed to account for three considerations – accessibility, community impact, and NIMBYism. Further research is necessary to develop a more inclusive set of indicators.
WORKS CITED
Briney, A. (2014, April 10). Overview of Weighted Site Selection and Suitability Analysis. GIS LOUNGE. https://www.gislounge.com/ overview-weighted-site-selection-suitability-analysis/#:~:text=Site%20 selection%20or%20suitability%20analysis,or%20school%20among%20 many%20others.
Chan, D. V., Gopal, S., & Helfrich, C. A. (2014). Accessibility patterns and community integration among previously homeless adults: A Geographic Information Systems (GIS) approach. Social Science & Medicine, 120, 142–152. https://doi.org/10.1016/j.socscimed.2014.09.005
City Planning Department of Toronto. (2019). Zoning Revisions for Municipal Shelters. https://www.toronto.ca/legdocs/mmis/2019/ph/ bgrd/backgroundfile-130545.pdf
Davidson, P. J., & Howe, M. (2014). Beyond NIMBYism: Understanding community antipathy toward needle distribution services. International Journal of Drug Policy, 25(3), 624–632. https://doi.org/10.1016/j. drugpo.2013.10.012
Davidson, P. J., Scholar, S., & Howe, M. (2011). A GIS-based methodology for improving needle exchange service delivery. International Journal of Drug Policy, 22(2), 140–144. https://doi.org/10.1016/j.drugpo.2010.10.003
Dum, C. P., Socia, K. M., & Rydberg, J. (2017). Public Support for Emergency Shelter Housing Interventions Concerning Stigmatized Populations: Results From a Factorial Survey. Criminology & Public Policy, 16(3), 835–877. https://doi.org/10.1111/1745-9133.12311
Greater Moncton Homelessness Steering Committee. (n.d.). Coordinated Entry System Guide Housing Assessment Review Team (HART). https:// static1.squarespace.com/static/582ceb3c8419c27e99e518a7/t/5d5d76b5e2 b586000170e30d/1566406326899/Coordinated+Entry+System+Guide++HART.pdf
FEATURE ARTICLES
73
Homeless Hub. (n.d.). About Homelessness: Supporting communities to prevent and end homelessness. Retrieved November 30, 2022, from https://www. homelesshub.ca/about-homelessness/homelessness-101/causes-homelessness
Huizinga, R. (2022, June 2). Hashim. https://www.cbc.ca/news/canada/newbrunswick/moncton-least-affordable-study-1.6474224
Immigration, Refugees and Citizenship Canada. (2019). Economic Profile Series: Greater Moncton, New Brunswick. https://www.canada.ca/content/ dam/ircc/migration/ircc/english/pdf/immigration-matters/economicprofilemoncton-newbrunswick-en-final.pdf
International Housing Association. (n.d.). IH
A Housing Continuum. Retrieved January 8, 2022, from https://www. internationalhousingassociation.org/generic.aspx?genericContentID=259737
Jahangiri, K., Borgheipour, H., Gendeshmin, S. B., Matin, A., & Monazami Tehrani, G. (2019). Site selection criteria for temporary sheltering in urban environment. International Journal of Disaster Resilience in the Built Environment, 11(1), 58–70. https://doi.org/10.1108/IJDRBE-06-2018-0025
Liu, N., Kruger, E., & Tennant, M. (2021). Identifying the gaps in public dental services locations for people living with a disability in metropolitan Australia: A geographic information system (GIS)-based approach. Australian Health Review, 45(2), 178. https://doi.org/10.1071/AH19252
Lyon-Callo, V. (2001). Making Sense of NIMBY poverty, power and community opposition to homeless shelters. City <html_ent Glyph=”@ amp;” Ascii=”&”/> Society, 13(2), 183–209. https://doi.org/10.1525/ city.2001.13.2.183
National Alliance to End Homelessness. (2022, March 20). Housing First. https://endhomelessness.org/resource/housing-first/
Neutens, T., Delafontaine, M., Scott, D. M., & De Maeyer, P. (2012). A GIS-based method to identify spatiotemporal gaps in public service delivery. Applied Geography, 32(2), 253–264. https://doi.org/10.1016/j.apgeog.2011.05.006
Ontario Human Rights Commission. (2009). Comment of the Ontario Human Rights Commission on the City of Toronto’s Proposed Zoning By-law. https:// www.ohrc.on.ca/en/comment-ontario-human-rights-commission-citytorontos-proposed-zoning-law
Pacini, C., & Hashim, J. (2019). Moncton’s Community Implementation Plan for Affordable Housing.
Parker, C. (2019). Bicycle use and accessibility among people experiencing homelessness in California cities. Journal of Transport Geography, 80, 102542. https://doi.org/10.1016/j.jtrangeo.2019.102542
Semborski, S., Winn, J. G., Rhoades, H., Petry, L., & Henwood, B. F. (2022). The application of GIS in homelessness research and service delivery: A qualitative systematic review. Health & Place, 75, 102776. https://doi.org/10.1016/j. healthplace.2022.102776
Turner Drake & Partners Ltd. (2020). Residential Market Analysis Report Moncton, New Brunswick.
United States Interagency Council on Homelessness. (2018, August 15). Supportive Housing. https://www.usich.gov/solutions/housing/supportivehousing/
University of Wisconsin-Madison. (n.d.). Mapping and Geographic Information Systems (GIS): What is GIS? Reserach Guides. Retrieved January 8, 2023, from https://researchguides.library.wisc.edu/GIS
Walker, S. C., Hurvitz, P. M., Leith, J., Rodriguez, F. I., & Endler, G. C. (2016). Evidence-Based Program Service Deserts: A Geographic Information Systems (GIS) Approach to Identifying Service Gaps for State-Level Implementation Planning. Administration and Policy in Mental Health and Mental Health Services Research, 43(6), 850–860. https://doi.org/10.1007/ s10488-016-0743-4
Yao, Y., Zhang, Y., Yao, T., Wong, K., Tsou, J. Y., & Zhang, Y. (2021). A GISBased System for Spatial-Temporal Availability Evaluation of the Open Spaces Used as Emergency Shelters: The Case of Victoria, British Columbia, Canada. ISPRS International Journal of Geo-Information, 10(2), 63. https:// doi.org/10.3390/ijgi10020063
Young, M. G. (2012). Necessary but insufficient: NIMBY and the development of a therapeutic community for homeless persons with comorbid disorders. Local Environment, 17(3), 281–293. https://doi.org/10. 1080/13549839.2012.665856
Carolina Planning Journal : Volume 48 / Urban Analytics 74
FEATURE ARTICLES 75
IMPACTS OF URBAN HEAT ISLAND ON RENTERS IN PORTLAND, OR
MELISSA ASHBAUGH
PROJECT SUMMARY
In Portland, OR, extreme heat events are increasing in frequency, causing more people to rely on air conditioning to protect against death, disease, and discomfort. As wealthier homeowners adapt by purchasing cooling equipment, renters face unique barriers to installing and paying for air conditioning. These barriers are compounded by urban heat island (UHI) effects, where the built environment and waste heat lead to higher temperatures in urban areas.
Using UHI and energy expenditure data, I identify 13 census tracts where renters live in hotter areas and pay a larger percentage of their income on energy (Figure 1). I also find that renters experience higher energy burdens than homeowners and that residents in hotter tracts have significantly higher energy burdens than those in cooler tracts (Figure 2). These data suggest that renters may require targeted interventions to increase air conditioning affordability during heat waves, particularly in East Portland. Interventions may include bill assistance, energy efficiency subsidies targeted toward rental properties, and investments in public cooling centers.
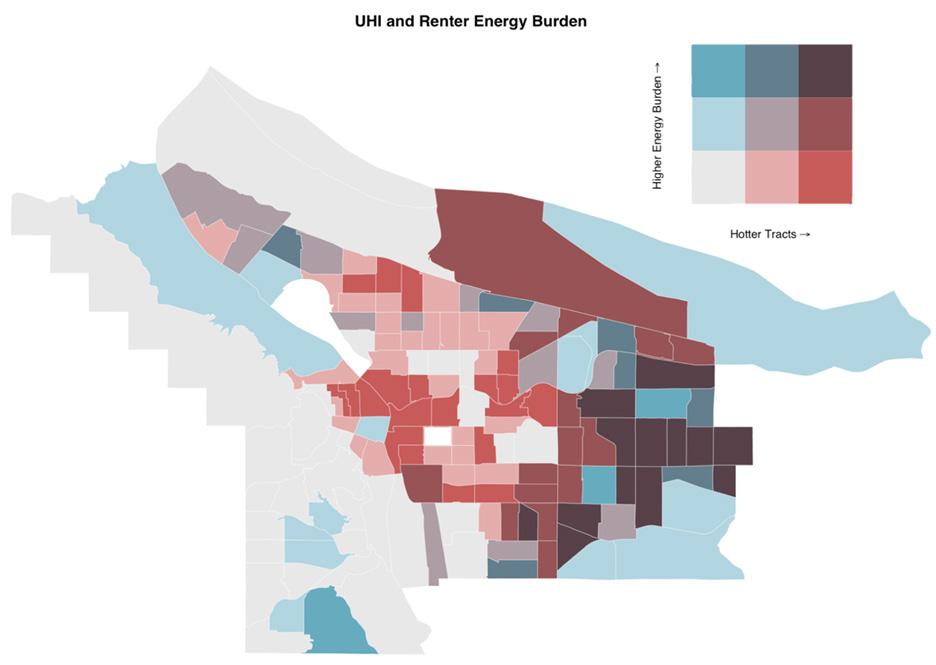
1 - High energy
and UHI
Carolina Planning Journal : Volume 48 / Urban Analytics 76
FIGURE
burden
effects are concentrated in census tracts in East Portland.
PROJECT METHODS
The 2018 Low Income Energy Affordability (LEAD) and the Oregon Metro Urban Heat Island datasets make this analysis possible (LEAD, 2020; Oregon Metro, 2019). The LEAD data reports energy expenditure and average income by census tract, housing tenure, year of first building construction, number of dwelling units, and primary heating fuel type. The UHI data derives from NASA/USGS Landsat imagery and shows deviation from the regional average land surface temperature at the census tract level.
To calculate the average energy burden, I aggregated household energy expenditures by census tract and tenure, divided expenditures by household income, and merged the LEAD and UHI data. I then visualized the data in a bivariate choropleth map and a violin plot. The map uses the biscale package (Prener et al., 2022) and divides energy burden and UHI into three quantiles. The violin plot uses the ggplot 2 package (Wickham, 2016), bucketing UHI by quartile. All analyses were performed using R Statistical Software (R Core Team, 2021).
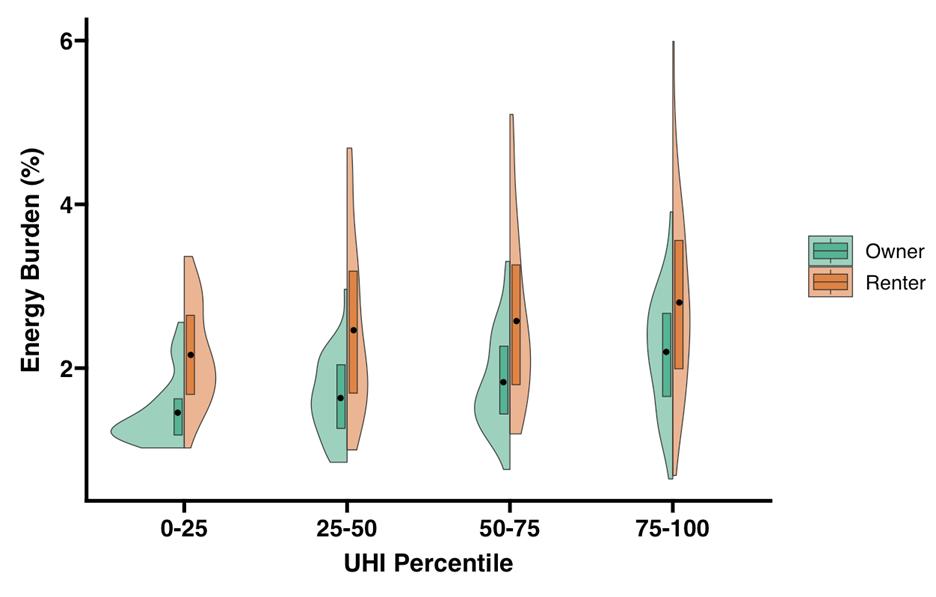
DATA VISUALIZATION 77
FIGURE 2 - Renters have a higher average energy burden than owners at all UHI percentiles and energy burden increases at higher UHI indexes.
VISUALIZING WEATHER-RELATED ROAD CLOSURES IN NORTH CAROLINA
JULIA CARDWELL
BACKGROUND
Extreme weather events will become more frequent and more intense under climate change scenarios in North Carolina and the United States more generally. The transportation sector is vulnerable to impacts from extreme weather in a variety of capacities. In particular, a major contributor to transport system vulnerability is the potential for weather-related road closures caused by a number of different hazards including flooding, winter storms, and high wind events that result in downed trees.
My research examines the impact of weather-related road closures on road network function in North Carolina with a focus on differing impacts in rural and urban areas. Although urban areas are typically prioritized in climate change and transportation planning, rural areas may be particularly vulnerable to the impacts of weather-related road closures due to a lack of redundancy, which considers the availability of alternative routes during periods of network disruption, such as road closures.
DETAILED METHODS AND FINDINGS
The North Carolina Department of Transportation maintains a rich archive of historical road closure events which can be analyzed for temporal (time chart) and spatial (cartogram) trends in road closure concentrations. While most closure events are small-scale (3-5 closures in a small geographical area), major events such as hurricanes can also cause largescale closure events on the order of hundreds to thousands of closures.
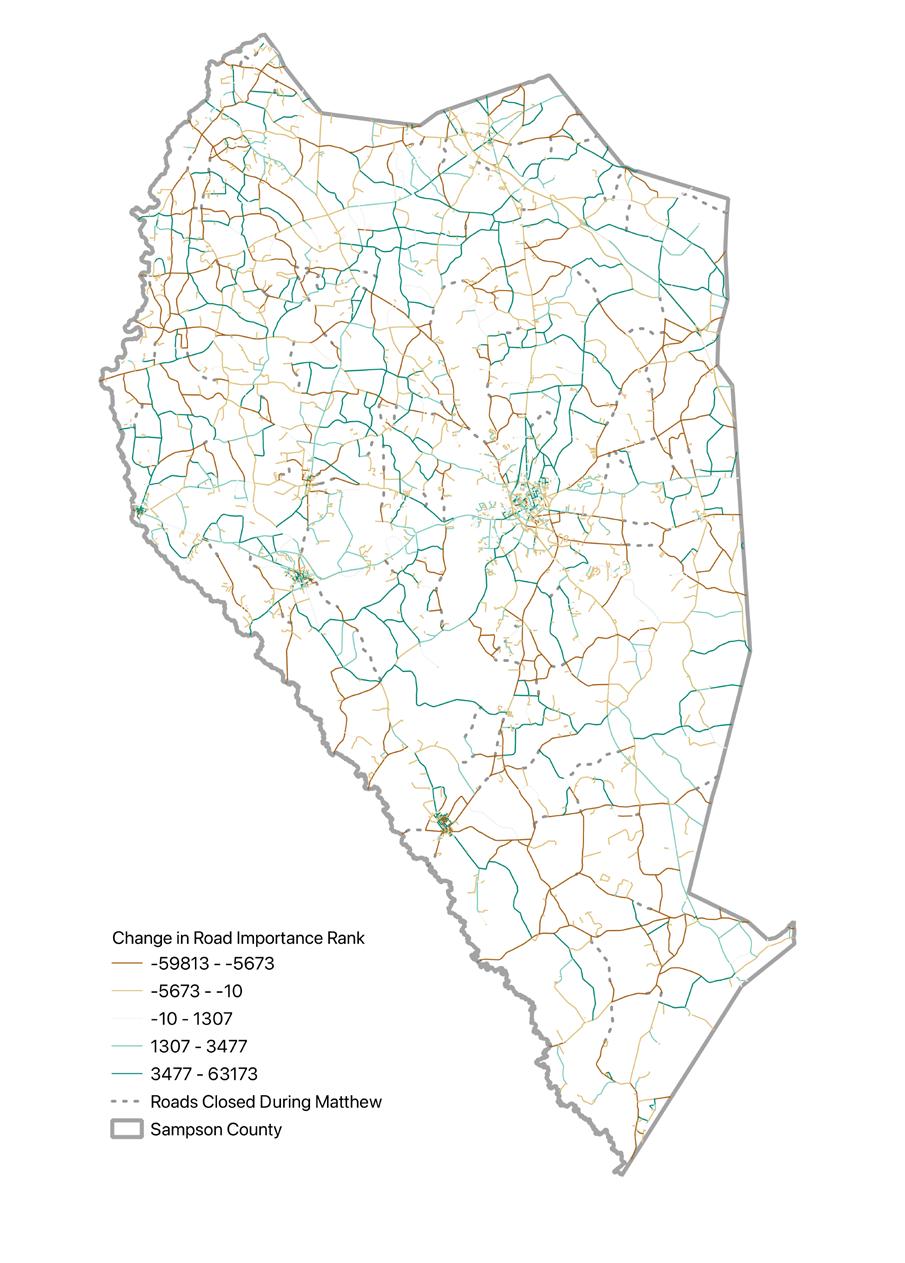
In addition, I utilize a graph theoretical approach to analyze the impacts of these historical closures on road network connectivity. Using graph theory allows a transportation network to be represented as an abstract graph, where the intersections are represented as nodes and the street
segments are represented as edges. This allows a mathematical approach to understanding the connectivity of these nodes and edges, and subsequently, the network connectivity impacts of removal of closed edges. For instance, a metric called Edge Betweenness Centrality (map) measures the importance of each edge (or road segment) for completing shortest-path trips on the network. These findings may be useful to state and local transportation planners to guide future investements in the road network.
Carolina Planning Journal : Volume 48 / Urban Analytics 78
FIGURE 3 - Map of road importance rank changes using Edge Betweenness Centrality measurements.
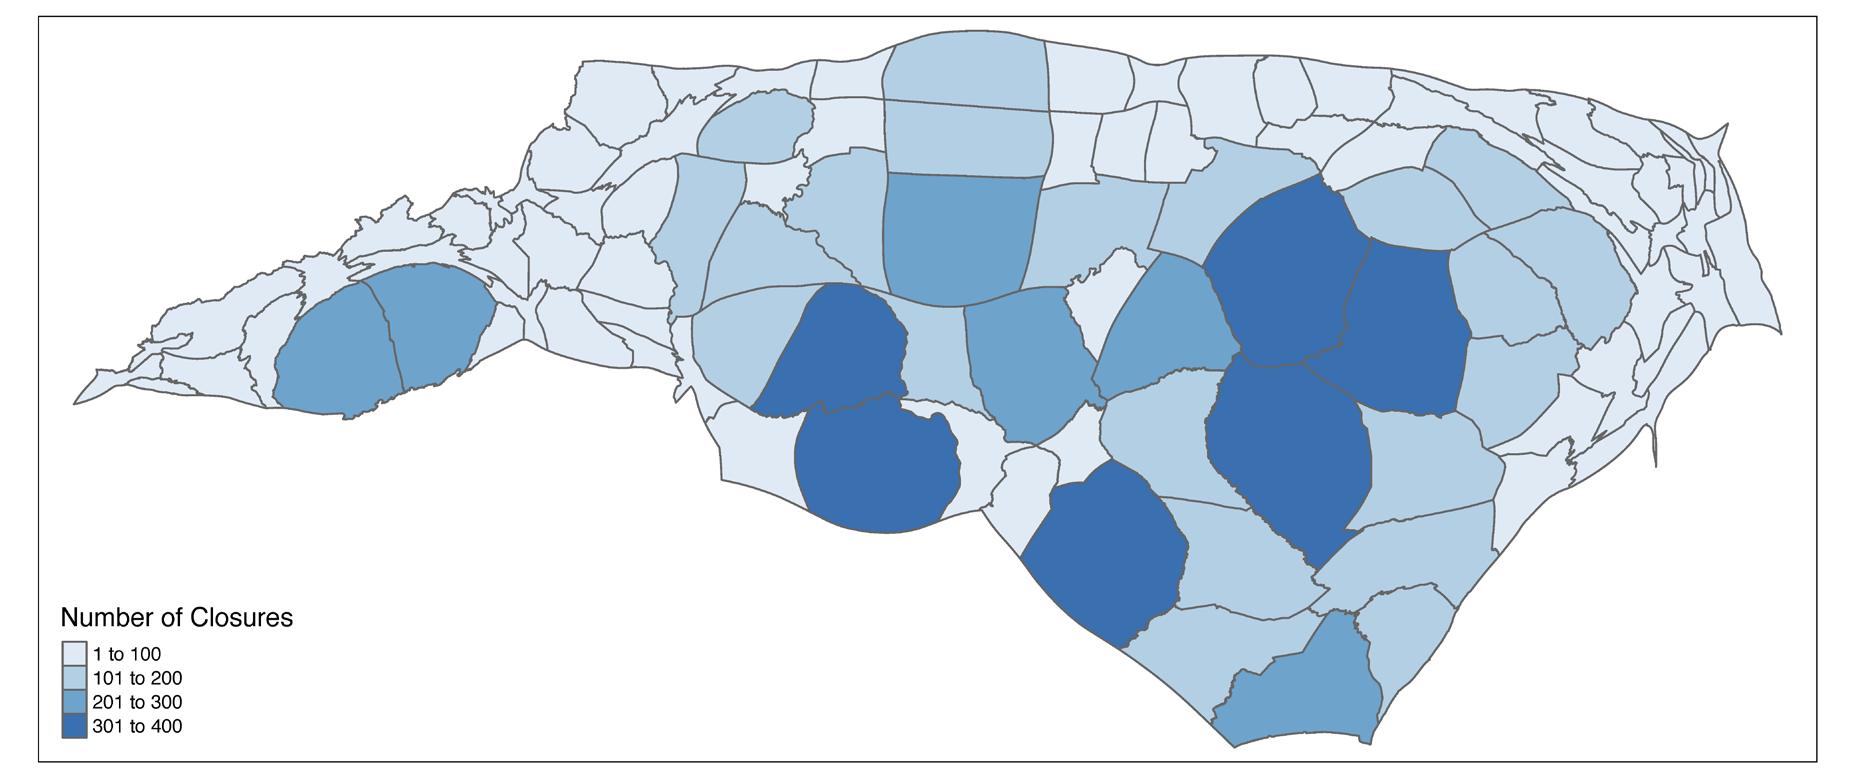
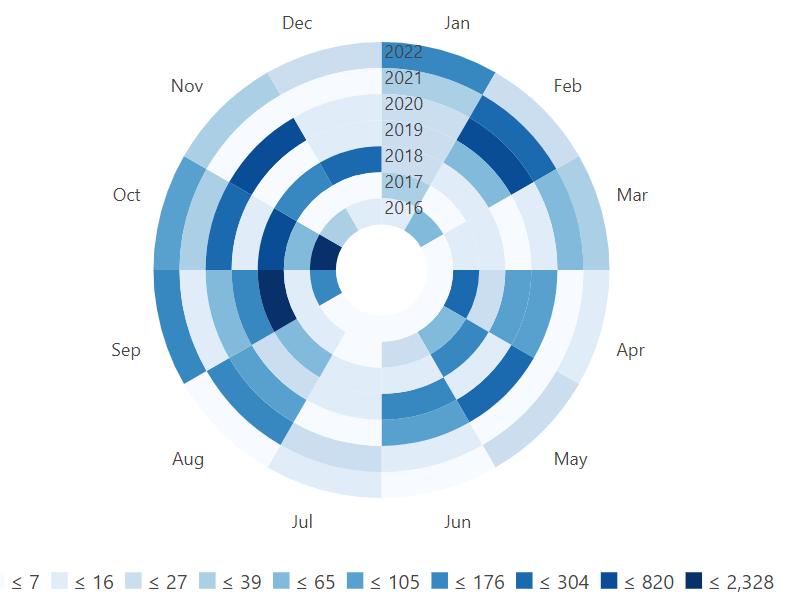
DATA VISUALIZATION
FIGURE 2 - Temporal chart of road network closures in North Carolina from 2016-2020.
79
FIGURE 3 - Cartogram of road network closures in North Carolina from 2016-2020.
NAVIGATING THE PULSE OF SHANGHAI’S DAILY TRANSIT
PROJECT DESIGN
In today’s era of big data, we can analyze information from various sources and sensors. Geographic Information Systems (GIS), remote sensing, and Global Positioning System (GPS) techniques allow us to understand the dynamic patterns of cities and examine the impact of planning efforts on daily life. This figure depicts the daily transit patterns of Shanghai, China, in 2015. This is a city known for its meticulous planning in recent decades. The figure compiles multiple datasets, including:
• Remote sensing images that identify the urbanization process from 1978 to 2015;
• Shanghai Public Transportation Smart Card data that records each trip’s time;
• Starting and ending stations of bus and metro trips; and
• Taxi GPS point data that records taxi cabs’ location and passenger status every 3 seconds between April 1 and April 30, 2015;
METHODS
With this data, we can look back at almost 40 years of urban planning and expansion in Shanghai while revealing the hourly transit patterns of different travel modes. Hot spots, indicated with red bars, show high trip volumes for the noted mode and time of day. Trip volumes are superimposed on data depicting the timeline of urbanization across the cityscape.
Shanghai taxi GPS point data was analyzed with GEE (RS image processing), using Python (image classification modification), ArcGIS pro (spatial data processing and analysis), and R (smart card data and GPS cleaning, processing and final visualization).
Analyzing the travel hotspots during both weekday and weekend scenarios shows that—despite being shaped by top-down planning forces—planned subcenters have not significantly impacted the daily flow of residents. Hot spots clearly cluster in areas of the city that were densely developed before 1900. That is, the historical urban center remains a constant attraction for urban flow, despite efforts to distribute traffic more evenly.
FINDINGS
Even in 2015, the burden of urban flows on the city center was still not shouldered sufficiently by planning interventions aimed at dispersal. Overall, this study provides valuable insights into the interaction between urban planning and daily life in Shanghai, demonstrating the challenges of shaping the city’s urban flow solely through planning forces. It also shows the power of combining disparate datasets to shed light on complex conditions.
LI
XIJING
Carolina Planning Journal : Volume 48 / Urban Analytics 80
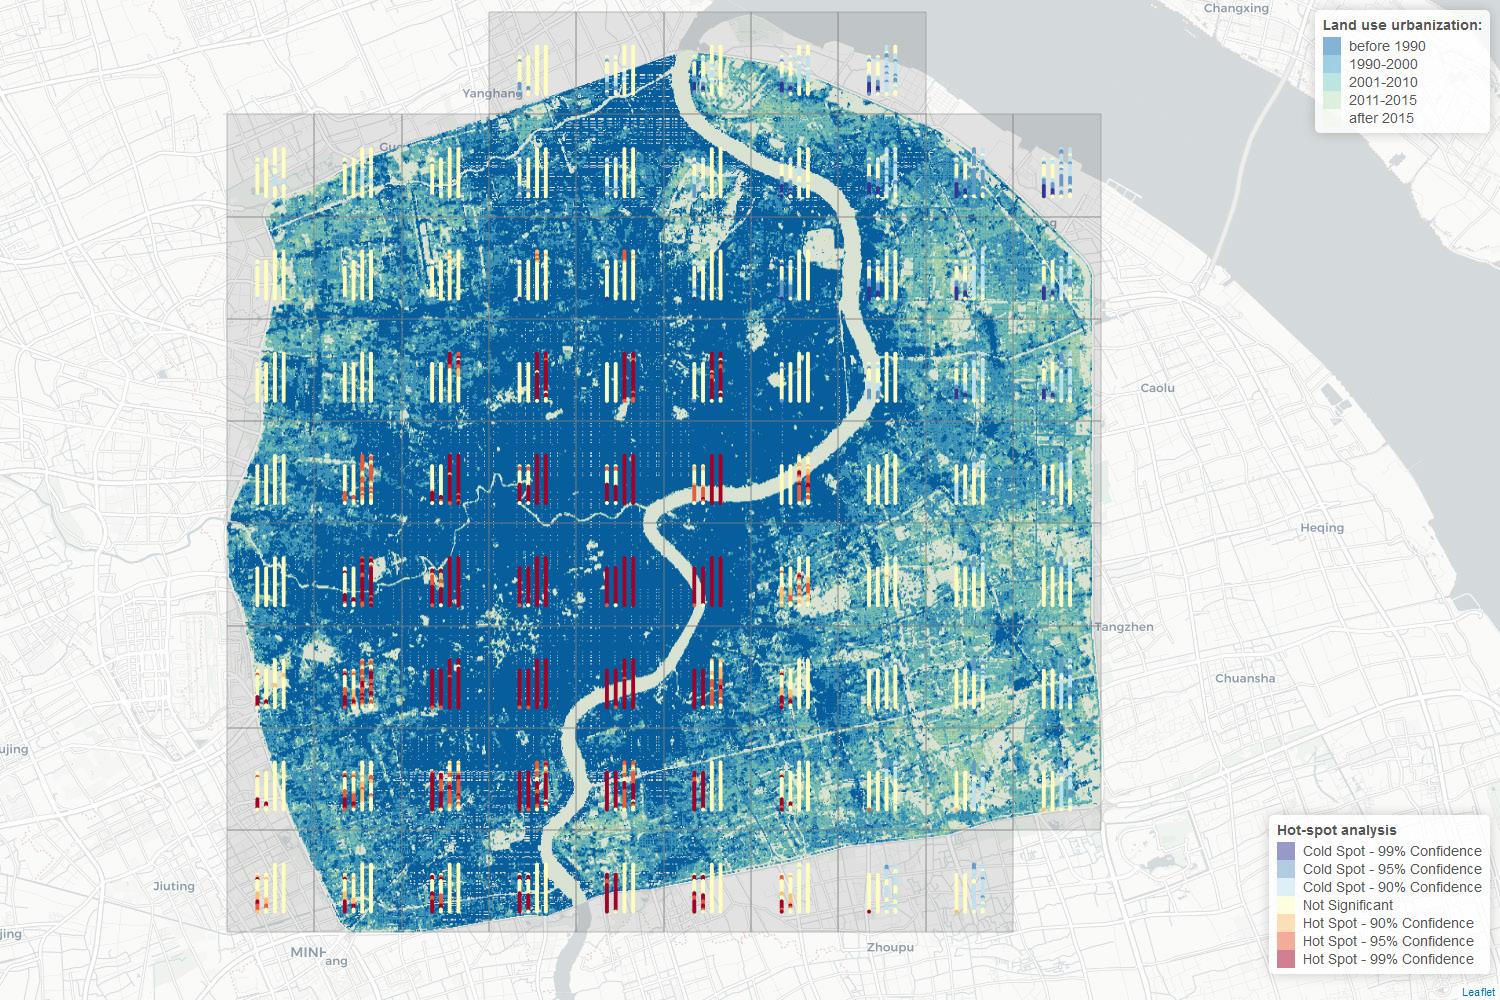
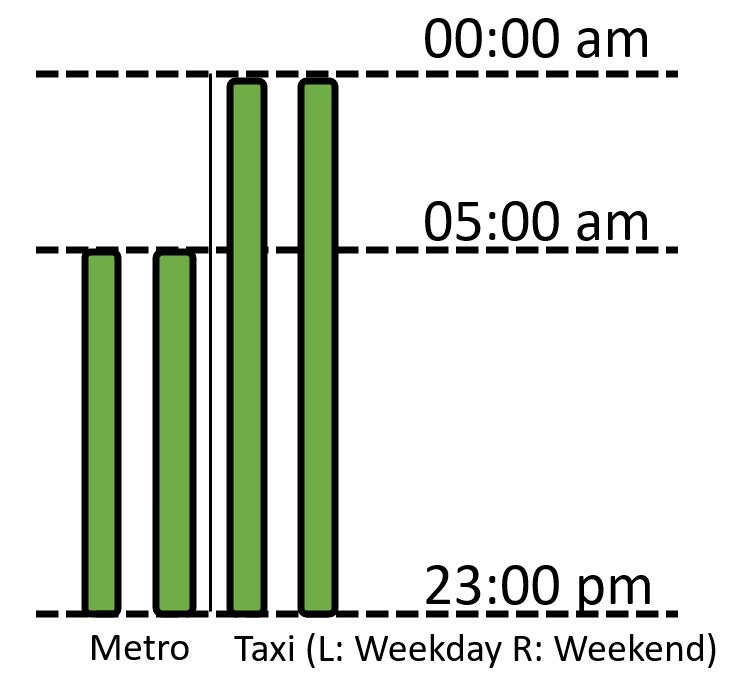 FIGURE 1 - Traffic hot sport analysis of Shanghai’s road and metro networks in 2015, overlaid on urban growth data from 1978 to 2015.
DATA VISUALIZATION 81
FIGURE 2 - Traffic intensity by transportation mode and day of week.
REVIEW | SOUL CITY:
Race, Equality, and the Lost Dream of an American Utopia
 AUTHOR/ THOMAS HEALLY
Review by Candela Cerpa
AUTHOR/ THOMAS HEALLY
Review by Candela Cerpa
Soul City: Race, Equality, and the Lost Dream of an American Utopia by Thomas Healy chronicles the dream of the eponymous Blackcentric city in rural North Carolina. Healy illustrates what Soul City’s achievements and eventual demise tell us about Black opportunity, capitalism, and power in the 1960s and 70s. Through meticulous research, Healy outlines the complex intricacies of years of social, political, and financial negotiations and concessions that contextualize why the project failed. In this story, readers can observe the ways that racism, desegregation, Black Power, powerful politicians, and the local and national media worked to support and dismantle this project.
The lived history of the project is personified in Floyd McKissick, a lawyer and civil rights activist who conceptualized and developed the city. He had an extensive career, integrating the UNC Law School, organizing sit-ins, taking part in freedom rides, working as a lawyer against segregation, leading CORE (the Congress of Racial Equity), promoting the Black Power movement, and marching alongside Martin Luther King Jr. He also served in the military where, in the wake of World War II, his unit helped rebuild rural French towns after the bombings.
This reconstruction stuck with him into the mid-60s, when President Johnson’s administration unveiled the Model Cities program, an effort to promote urban development, ease crowding, and reduce poverty. This program and his own lived experiences inspired McKissick to envision Soul City, a community that centered the empowerment, life improvement, economic prosperity, and autonomy of Black people.
“Like nearly every other effort to improve the lives of Black people, [Soul City] was subjected to a level of scrutiny, secondguessing, and outright hostility that other ambitious ventures rarely encounter. Some of this scrutiny was motivated by blatant prejudice, but some of it is simply embedded in our social structures. If a project is designed primarily to help Blacks, it is automatically held to a higher standard of justification”
--Thomas Healy in Soul City (p. 42)
Metropolitan Books. 2021. 448 pages.
Carolina Planning Journal : Volume 48 / Urban Analytics 82
CANDELA CERPA is a first-year master’s student in the Department of City and Regional Planning at UNC-Chapel Hill. She is interested in equitable disaster planning, particularly around floods. Born and raised in Uruguay, she received her bachelor of science in Environmental Science and Policy from the University of Maryland, College Park. Outside of work and school, she enjoys cooking and eating good food, listening to audiobooks, and organizing around climate and social issues.
To realize his project, McKissick put his hopes on the Nixon administration. Though the deal was implicit, McKissick switched political parties and vocally supported the president’s reelection, which coincided with a large grant from Nixon’s U.S. Department of Housing and Urban Development. McKissick also received support from private funders, a plan review by our very own Department of City and Regional Planning at UNC – Chapel Hill, and a dedicated team of staff that lived in subpar housing on the grounds while they worked to build the city.
Yet still, Soul City faced many challenges in its development and implementation. Government bureaucracy was, at times, weaponized. Critics portrayed the project as a separatist city. Some considered the name divisive. Segregationist Senator Jesse Helms swore to block any government funding for the project. Journalist Pat Stith purposefully misrepresented facts in his reporting for the News & Observer, turning the public against the project and inciting a fruitless audit by the federal government. Prospective business partners were apprehensive. In the end, HUD foreclosed on Soul City, shutting down any hope of funding and support.
Healy delves beyond the facts of the case to emphasize what Soul City’s development represents about the contemporary and continued state of oppression of Black people in the U.S. by contrasting what McKissick envisioned with what remains today. The land for the project was previously a tobacco plantation in rural, economically-depressed Warren County, NC, which lacked basic amenities and infrastructure.
As the project progressed, McKissick brought the necessary infrastructure, such as a regional water system, education funding, and healthcare services for not only Soul City but also to Warren, Vance, and Granville Counties. The surrounding white population, initially hesitant to the construction, came to see the benefit of the resources the project brought, and
began accepting it. If the project had progressed as McKissick envisioned, there would have been a sewage treatment plant, local jobs, a railroad, and an education system, all of which would have also benefited the broader community.
Unfortunately, little of that infrastructure still stands. HealthCo, the healthcare clinic opened to provide Soul City and the neighboring counties with comprehensive care, closed in the past decade. The office space McKissick designed to attract industry has been converted into an industrial plant that produces janitorial supplies relying on the forced labor of the majority-Black people held at a nearby medium-security prison. Ironically, this space built for the express betterment of Black people was used against them.
At times, the narrative loses its focus on Soul City and the people it meant to serve to the detriment of the narrative. There are stories detailing the careers of journalist Pat Stith and Senator Jesse Helms, but little on the broader context of what Soul City meant for Warren County, for North Carolina, and for the rest of the country. We did not get to hear what the project meant for Black Americans not involved in the project, nor what non-Black Warren County residents thought, despite the emphasis of the project being built on “Klan country.” The book could have also gone further to ask the question, what if McKissick had succeeded? Would a Black-run city with capitalism at its core had served the community the way he envisioned?
Soul City: Race, Equality, and the Lost Dream of an American Utopia is a wonderful exloration into a piece of history that is seldom discussed. While set in North Carolina, readers beyond the South have much to learn about what the project reflects of the country’s broader history.
BOOK REVIEW
83
REVIEW | THE MINISTRY FOR THE FUTURE
 AUTHOR/ KIM STANLEY-ROBINSON
Review by Isabel Soberal
AUTHOR/ KIM STANLEY-ROBINSON
Review by Isabel Soberal
Climate anxiety is a real thing, and honestly, the introduction of The Ministry for the Future did little to quell my fears. Set in the not-very-distant future, the novel from renowned science-fiction author Kim Stanley Robinson begins with a chilling portrait of an extreme heatwave in northern India. The first narrator, Frank May, spends the opening few pages fighting off an inescapable heat while he tries to shepherd others to safety.
In the end, his efforts fail—he wakes up and everyone around him has died from the extreme conditions. In the face of globally dangerous climate events, the existing Conference of Parties creates the Ministry for the Future in the year 2025, which is “charged with defending all living creatures present and future who cannot speak for themselves, by promoting their legal standing and physical protection” (p.16).
Our protagonist is Mary Murphey, a diplomat tasked not only with the leadership of the Ministry but also associated diplomacy and policy efforts. One such policy involves the creation of a carbon coin used as a carbon sequestration method. Mary pushes for buyin from the public and from other leaders, which tragically does not come until the Ministry’s headquarters is bombed. Because the Ministry is based in Zurich, the Swiss government steps up enough to provide support for the Ministry’s.
Despite the inevitable bureaucratic drag, the combination of focused policy work and intervention catalyzes the gradual fall of carbon dioxide levels in the atmosphere. The novel ends on an uplifting note as Mary begins a new chapter of her life after the Ministry.
Island Press, 2018. 344 pages.
Robinson succeeds in this compelling work by writing with immediacy. Unlike other “utopian novels”, including ones written by Robinson, The Ministry for the Future takes place in a more immediate future. Rather than painting a picture of a sci-fi world which we can only abstractly conceptualize, Robinson’s world is familiar because it is our world. The author achieves this urgency to great effect. Depriving the reader of temporal distance, Robinson thrust the reader into the crumbling façade of The Ministry’s world.
Carolina Planning Journal : Volume 48 / Urban Analytics 84
ISABEL is a first-year master’s student in the Department of City and Regional Planning. She graduated from Grand Valley State University, where she studied geography and Spanish. She is also the Weiss Urban Livability Fellow for 2023-24, reflective of her passion for social justice and equity.
As readers, we feel Mary’s frustration of supporting an agenda that deserves more support, as well as the struggle for survival against all odds. The urgency portrayed obviously conveys a sense of warranted haste, but it also encouraged me to reflect on my own charge as an emerging planner. By virtue of the Ministry’s mission, Robinson asks the reader to consider not only those who already exist but those who have not been born yet. How do we reckon with this monumental question, and what technologies will help us along the way?
From a city and regional planning perspective, the book’s trajectory can help reassure planners that our efforts will make lasting positive change. After all, the book ends on the right track: emissions are down and things are looking better, thanks to political intervention. This best-case outcome does not lessen the novel’s sense of profound urgency. It clearly makes a plea to our own world leaders to finally take impending climate change seriously. The novel’s message of urgency is so well received by the reader because Robinson embeds the crisis in deeply and uniquely human experiences— like my own climate anxiety—that come with impending catastrophe.
Viewed as a whole, The Ministry for the Future offers a balanced depiction of what is possible with equal parts pessimism and optimism. It is a story of dichotomies: survival and death; love and disgust; excess and famine. It diffuses the grim picture of what could be by employing a unique brand of sarcastic humor. But, perhaps most importantly, it gives us hope, which can be stronger than fear.
BOOK REVIEW
85
REVIEW | UNDOING OPTIMIZATION:
Civic Action in Smart Cities
AUTHOR/ ALISON B. POWELL
Review by Amy Patronella
Over the past decade, many cities embraced new technologies to collect and interpret data on their citizens. These innovations may streamline the logistics of daily urban life. They are also critical to the smart cities paradigm. Predictive algorithms run traffic signals. Cameras capture license plates to enforce congestion zone tax policies. Sensors placed throughout cities support a new era of state management of the urban commons.
In her book, Undoing Optimization: Civic Action in Smart Cities, Alison Powell analyzes the technologies that have defined Smart City projects in recent decades. What began in the early 1990s with programs to provide free broad-band internet access through privatepublic partnerships has evolved into the full-fledged Smart Cities approach we recognize today. Of late, these efforts to optimize urban functions rely heavily on civilian surveillance.
Powell shows that the justification for surveillance in cities assumes that models for processing the surveillance data are rational. These models’ assumed rationality—linked to its reliance on hard numbers—appeals to city officials. Many such officials have accepted invasive data collection to automate governance of common spaces and public goods, but Powell shows that ceding governance decision-making to a data platform limits civic participation for underprivileged communities.
For Powell, urban opitimization is a cycle with dangerous consequences. Cities break down municipal services into increasingly small parts, collect data on those components, and then use the data to perform municipal services more effectively. Third-party data management companies collect, visualize, and maintain the infrastructure required for these processes, making it necessary for cities to collect on their citizens. Thus, as cities seek to optimize urban services, Powell believes that urban managers have embraced a narrow focus on one goal: collecting more data.
The reality of this process belies its innocuous appearance. Data is stored in an open-source format to establish a virtual commons for
Yale University Press, 2021. 224 Pages.
Carolina Planning Journal : Volume 48 / Urban Analytics 86
RYAN FORD is a Master’s student in the Department of City and Regional Planning at UNC Chapel Hill. He is interested in the intersection of urban design and transportation specifically around active mobility. Outside of classes, you can find Ryan playing tennis or catching a movie at Varsity Theater.
ISABEL MALETICH is a first-year Master’s candidate in the Department of City and Regional Planning. She is also a graduate of the University of Chicago and has worked with the HOPE Fair Housing Center.
laypeople to view, interpret, and act on. Such public databases or data commons are meant to encourage participation in civic life, but they wrongly assume participants have equal access to (and understanding of) the urban commons (p. 31). On the surface, the data collection process appears democratic, but to “opt-in,” civilians need database management skills. Cities claim democratic participation in optimizing urban life, but they inadvertently limit engagement to the well-educated.
Beyond participatory challenges, Alison Powell argues that data analysis often creates gaps to understanding urban life because it interprets the city only through limited units of analysis in an attempt to make it more legible. While Powell concedes that data is necessary for policymakers to understand the problems they face, it is insufficient to facilitate the relationships between actors that genuine problemsolving requires. Instead, Powell argues for “minimum viable datafication” where cities use different methods of problem solving for their residents, rather than relying on data collection as the primary solution in all cases (p. 133).
Enter datafication and digital technologies. These methods are meant to augment planning processes. Instead of cognitive overload for local decision-makers, governments rely on the assumed rationality of third-party intermediaries to process and make sense of data. Intermediaries create dashboards to visualize data streams in the hope of achieving objectivity.
Powell argues that data cannot tell the complete story due to gaps in the collection process and challenges with data interpretation by third-party intermediaries. A case study by the Bristol Approach in 2016 studied how sensors to detect mold in households did not increase government action. As government funding for mold inspection officials decreased, there was the belief that landlords would take advantage of renters that had insufficient resources to move to better housing. Bristol Approach’s proposed solution was to place
damp sensors within apartment units to identify if humidity levels suggested the presence of mold (p. 98-9).
Ultimately, the datafication of civic life “does not speak directly or establish a robust civic voice” for these individuals with sensors, as more data collection and submission are required to invoke action (p. 99). Urban data is assumed to streamline government services and prevent power imbalances, but its application continues to silence historically underrepresented groups, such as low-income households.
Smart city data gathering assumes that algorithms can be universally applied. City officials believe third-party companys’ claims that these algorithms can accurately understand any urban space with enough data. They accept that any city can be governed by a replicable model.
Data intermediaries, which are key to smart cities’ notion of governance as platform, rely on generalized sensordata in attempts to avoid the tragedy of the commons. City governments readily buy into the concept of a generalized approach to managing their commons because they accept “ideas of interchangeable infrastructure that could or should be used to manage any city” (p. 154). In contrast, Powell argues that generalized theories are unapplicable without local context.
Undoing Optimization analyzes urban officials’ growing reliance on surveillance and participatory civic sensing to maximize efficiency and render the city legible. Although city governments believe data-collection is comprehensive and objective, Powell’s makes a compelling case against complete datafication of urban life. She shows that data collection, analysis, and application fails to account for the lived experiences of those who cannot affect strategic decision-making.
BOOK REVIEW
87
ARBITRARY LINES:
How Zoning Broke the American City and How to Fix It
AUTHOR/ M. NOLAN GRAY
Review by Amy Patronella
In Arbitrary Lines, Matthew N. Gray diagnoses the ills of Euclidean zoning. The author examines technical components of zoning and the failures it has precipitated in American communities. He attends to the outsized role of special interests in zoning and the “backward relationship between planning and zoning” (26). In this way, he offers a sobering reminder of the chasm between the theoretical purpose of zoning and how it actually affects American urban life. Yet, Gray takes these well-founded critiques in an unhelpful direction. He sees no merit in zoning reform and prescribes US planners just one simple antidote—zoning abolition—for one of the field’s most complex ailments. He offers no accompanying framework for future land use planning. The result is compelling yet ultimately unhelpful.
The first two-thirds of Gray’s treatise work quite well. In Part I, he traces the history of zoning, pulling back the curtain on its exclusionary origins. Part II details the role of zoning in the housing affordability crises, low economic opportunity, and the tangled matrix of mobility, segregation, and sprawl. The book falls apart in Part III, where Gray attempts to offer solutions. Each pathway he identifies leads to zoning abolition. “As long as zoning exists in the United States,” he writes, “special interests will find ways to suppress housing construction, our most prosperous and productive places will be held back, affluent municipalities will find ways to lock out the marginalized, and growth will be focused in a sprawling pattern” (131). Gray contends that zoning’s fails not in application, but in “its very conceit,” arguing that the real world is too complex for the longterm planning of land uses and density that zoning requires (142).
Even if zoning did make sense in theory, Gray suggests that practice has strayed too far to be corrected. He rightfully criticizes the disjuncture between the stated aim of zoning codes to be informed and updated by regular comprehensive planning and their tendency to succum to inertia. Many codes are indeed dinosaurs, outdated and conflicting with stated goals of local comprehensive plans. The bathwater has evidently gone cold. But Gray would have us throw out the baby, too, leaving us with… what, exactly? Enforcement of public nuisance rules and adopting building codes would be no better a mechanism for bringing comprehensive plans to life.
Island Press, 2022. 256 pages.
Carolina Planning Journal : Volume 48 / Urban Analytics 88
AMY PATRONELLA is a second year Master’s student in City and Regional Planning. Her upbringing in Houston, TX informs her interest in the nexus of mobility, green space, and climate resilience. She received an undergraduate degree in Political Communication with minors in Public Policy and Sustainability from George Washington University. In her free time, she enjoys reading, biking, and talking Texas politics with anyone who will listen.
Predictably, Gray’s case for zoning abolition rests on his case study of Houston, TX. In this largest “unzoned” city in the US, development has largely been dictated by real estate companies’ ideas of highest and best use. Houston has become the poster child for free market urbanism. Infill development has proceeded with an ease unimaginable in zoned metros. From the perspective of a native Houstonian, Gray’s narrative reduces the complexity of Houston’s planning and housing challenges. Infill achievements today are an unintended consequence of the city’s legacy of laissez-faire development and lack of land use planning. These factors also generated sprawl and exacerbated environmental hazards—exactly the problems that free market urbanism is now supposedly fixing.
New infill development also reflects a change in market demands, as wealthier populations are returning to central areas and pushing out lower-income residents in the process.
A 2019 analysis by the Federal Reserve Bank In Dallas revealed Houston to be gentrifying fastest among big cities in Texas. Another study found one zip code in Houston was the third fastest gentrifying in the country. Long-time residents in newly desirable communities as well as lower and middle-income home buyers find now chase affordability into the suburbs.
In his final chapter, Gray admits he isn’t sure what planning looks like without zoning. Houston doesn’t know the answer, either. Despite its patchwork system of deed restrictions, building codes, and parking minimums, it doesn’t plan. The closest thing it has to a comprehensive plan is its 28-page Plan Houston Report, with its series of vague goals and actions and an explicit disclaimer that it is “not about establishing land use controls.” Houston does not project growth and housing needs, map future land uses, or conduct community engagement for future planning as, without zoning, it cannot carry out plans.
Zoning alone may not have prevented the reckless development in flood-prone areas. Yet, the comprehensive and land use planning process enabled by zoning may have informed
stronger regulations and more thoughtful regulations. Plans are processes, not just documents; failure to zone appears to have hobbled such processes.
Modeling growth, migration trends, changes in housing stock, and environmental conditions allow municipalities to guage future needs. It is not an exact science, but today’s planners largely do have tools to plan for their community’s future. Certainly, comprehensive plans should be better translated into zoning codes. This does not justify localities ceding all planning powers to developers and special interests who Gray warns are manipulating zoning codes. Couldn’t Gray’s concerns about outdated ordinances be addressed with more commitments to regularly update these codes?
Gray has the opportunity to offer a vision for the future that balances a need to plan for environmental hazards, accommodate housing needs, insulate residents from the fickle will of developers, and encourage a healthy mixture of uses. This is a tall order. But if advocating for abolishing zoning, it would be helpful to have an alternative approach to land use planning. Weak gestures toward leveraging federal housing funds and using community land trusts–both possible under zoning–fall short. Gray also gives short shrift to zoning reform through form-based codes or flexible zoning.
Arbitrary Lines demonstrates how Euclidean zoning has hindered smart growth and entrenched urban inequality through its myopic focus on regulating the wrong things. Gray fails at his hardest and most important task, but other planners would do well to try their hand at it. We do need better zoning. We may need to dispense with single-family zoning and the more capricious requirements for uses, setbacks, lot size, FAR, and parking. We need to adapt zoning to more meaningful goals, like mixed uses, public services, and environmental sensitivity. But we don’t need cities run for profit, with plans reduced to flimsy pamphlets about goals.
BOOK REVIEW
89
BICYCLE / RACE:
Transportation, Culture & Resistance
AUTHOR/ ADONIA LUGO, PHD
Review by Lauren Caffe & Kathryn Cunnigham
Whizzing around on a bicycle yields constant excitement. The cyclist’s heart pounds with the exertion, the thrill of speed, and the perpetual fear of fast-moving, two-ton killing machines. The cyclist also profits from the camaraderie of fellow bicyclists who choose this against-the-grain transportation in an America that incentivizes car travel in almost every way. The iconoclastic cyclist may cherish this sense of community. But how often do cyclists assess who is riding bicycles, and how the experiences of cyclists may differ?
Cultural anthropologist Adonia E. Lugo, PhD, in her 2018 book Bicycle / Race: Transportation, Culture, & Resistance, sheds light on the answer. Her inquiry into bicycle culture and infrastructure shows that partaking in the bicycle movement hinges heavily on race and class. Constraints posed by identity divides, policing, and property values form a narrow gate through which many cyclists must pass.

Lugo uncovers details of an influential cultural binary between recreational cyclists and the bike-dependent. Lugo found that recreational cyclists made up most local advocacy groups and were vocal at planning meetings. They focused on street design and safety but offered “no analysis of how its strategies played out in landscapes of inequality” (p.140). They fought for improved infrastructure, and sometimes even framed gentrification as a positive consequence of these improvements to obtain governmental support.
Conversely, bike-dependent individuals, or people “who relied on two wheels due to poverty,” were seen as “suspicious” and “undesirable” (p. 38, 39). They were “left out of organized efforts to influence public policy and street design” (p. 97). Street design was not their priority, nor would it always benefit them, given the likelihood that investment would lead to displacement.
To compound the issue, Lugo notes, LA’s bicycle advocacy groups often tried to distinguish themselves from truly bike-dependent individuals. They “seemed to want the public to view bicycling the way they did: as something for normal (i.e., white or at least economically secure) people, not something for the poor (who were probably black or brown)” (p. 143-144).
Simon & Schuster Publicity, 2019. 336 pages.
Carolina Planning Journal : Volume 48 / Urban Analytics 90
LAUREN CAFFE is a first-year Master’s candidate in the Department of City and Regional Planning. Her research research focuses on community resiliency along the coast of Maine and hazard mitigation methods for rural municipalities.
KATHRYN CUNNINGHAM is a first year Master’s student with the Department of City and Regional Planning whose interests include climate change adaptation, parks, and public space. She studied Environmental Studies at Williams College.
This elite image of bicycling extended by these advocacy groups likely appealed to the biases of decision-makers. Whiter and wealthier themselves, these decision-makers had the power to invest in infrastructure. In Lugo’s experience, bureaucrats that lent an ear to other bicycle advocates were generally “uninterested and skeptical” in her more radical ideas (p. 111).
While biking the streets of Los Angeles and organizing group ride events, Lugo noticed that law enforcement and planning apparatuses loomed large over the spaces where Angelenos of color dwelt and moved. This resulted, in part, from racial differences in transportation. The author records a “palpable feeling of unwelcome for immigrants” in the street, from which the whiter and wealthier escaped by insulating themselves in private cars (p. 13).
On car-dominated streets, Lugo describes biking as inferior, akin to being confined to the back of the bus (161). Because these streets are often too dangerous for cyclists, many cyclists choose to ride on sidewalks. Biking on sidewalks is also a means to avoid attracting police attention. This is not a perfect solution. Police officers in LA often target sidewalk riders because the officers interpret traffic laws in such a way that frowns upon the practice (p. 105).
While cyclists dodge traffic and tickets, automobilists flow relatively freely down streets designed expressly for their benefit. Combined with the demographic difference in cycling usership, this results in a pattern of planning and policing that preferentially upholds white safety and freedom of movement.
Lugo does brilliant work to uncover the causes of this difference. Lugo records a police instructor stating that each police officer interprets ordinances at their own discretion. This creates an opening for bias. The LAPD has issued tickets to immigrant cyclists for not wearing helmets, even though LA has no mandatory helmet law for adults. A ticket for lacking a helmet or riding on the sidewalk can spell disaster for a low-income household already in debt. For those living undocumented, the consequences can be dire (105).
Places also express cultural identity. Commonly, the factors that make a place “good” or “bad” are tied up with racialized and classed notions of whose culture matters. Places also have economic functions and property values, which respond to those cultural concerns. Lugo makes a compelling case that the relationship between property values and cycling often results in exclusionary planning.
Lugo observes that many bicycle advocates spread a doctrine that bike infrastructure increases property values. However, she notes that these advocates tend not to acknowledge that investing in cycling infrastructure—thereby raising property values—can create neighborhoods too expensive for many immigrants and the poor.
During meetings about introducing more bike infrastructure, Lugo observes homeowners arguing that their historic neighborhood would be harmed by the addition of bicycle infrastructure. They decry unsightly road signage and raise the specter of bicycle thieves (p. 37). They don’t object to the act of bicycling, but rather to certain cyclists in certain places.
The goals of homeowners and bike advocates tend to be formally silent on race and class, but the impacts of their conflicting discourses leaves poorer, darker-skinned cyclists in a bind. These cyclists need better bicycle infrastructure in their neighborhoods, but they do not want to be priced out of their homes when it arrives. Meanwhile, wealthier, whiter homeowners appear to be deterring new investments in bicycle infrastructure as a proxy for deterring cyclists of color.
Bicycle/Race offers a deft assessment of stratification in the cycling world. Lugo shows that not all cyclists are equal in the eyes of the powerful. The marginalized persevere and make do in the face of both personal and structural adversity. Planners can make a difference by using their “expert status to expand the paradigm of urban planning,” shifting the narrative and making real changes in urban management (p. 92).
BOOK REVIEW
91
BEST MASTER’S PROJECTS
CLASS OF 2023
CHRISTY FIERROS
INUNDATED: AN ANALYSIS OF FLOODED ENVIRONMENTAL DISAMENITIES IN EASTERN NORTH CAROLINA
Best Master’s Project
Flood events do not impact communities equally and often expose the legacy of public policies, practices, and plans that result in certain communities experiencing more damage after flood events. At the same time, extensive research has shown environmental disamenities (also referred to as Locally Unwanted Land Uses) are often located in Black, Indigenous, People of Color (BIPOC) and low-income communities compared to white and wealthier communities. Outside these areas of affluence, BIPOC communities are often exposed to a variety of hazards, whether that be flooding, polluting industries, or a mixture of natural and human-made hazards. Differences in impacts and recovery from disasters can widen societal inequalities. Communities with high social vulnerability (as defined by income, race, age, educational attainment, and other characteristics) typically have a slower recovery trajectory than those with low social vulnerability. There is little known about how communities are impacted from the interaction between environmental hazards (flooding) and human-made hazards (living near polluting industries).
In this project, I examine the impact of flooding from Hurricane Matthew (2016) and Hurricane Florence (2018) on four different types of environmental disamenities (hog concentrated feeding operations, solid waste facilities, hazardous waste facilities, and toxic release inventory sites (TRI) in 22 southeastern North Carolina counties and compare the level of social vulnerability of communities with flooded disamenities. The study area is ideal for this analysis because of its extensive flood risk and numerous unwanted land uses, with hog concentrated animal feeding operations (CAFOs) as the most prominent. Through geospatial analysis of disamenities guided by the theoretical frameworks of social vulnerability and environmental justice, I find the odds of the presence of flooded environmental disamenities increases in census block groups for every one unit increase in the social vulnerability score. This demonstrates a relationship between areas of high social vulnerability and the presence of environmental disamenities. Unpacking and addressing these disparities is essential to ensure everyone can live, work, and play in safe and healthy spaces regardless of their demographic characteristics or geography.
Carolina Planning Journal : Volume 48 / Urban Analytics 92
JAMES HAMILTON
USING RETROFIT CASE STUDIES AS THE FOUNDATION OF A REGIONAL SPRAWL MANAGEMENT POLICY FRAMEWORK
People’s Choice Award Master’s Project
This report summarizes the planning strategies used in 40 cases of sprawl retrofit. It identifies accompanying success factors and need measurements. These criteria are combined to inform suitability analyses that optimize the land use arrangement, growth management tools, finance mechanisms, and supporting processes that can be employed in regional policy frameworks aiming to curb sprawling development. The report also applies the novel, replicable framework to a hypothetical case in the Research Triangle area of North Carolina.
BEST MASTER’S PROJECTSCLASS OF 2019
93
CLASS OF 2023 MASTER’S PROJECT TITLES
ROBERT ADDINGTON Encouraging Missing Middle Housing in Apex
WILL ANDERSON Electric Vehicle Charging Station Analysis: Recommendations for Greensboro, NC
JORDAN APRIL Variable Risk, Evolving Standards, and Unsafe Housing: The Status of Environmental Investigation Protocols for Lead Poisoned Children in Fifteen States
ANA SOFIA ARAUJO D’ELIA Assessing the Impact Of the Expanded Child Tax Credits from The American Rescue Act (2021) on Proxy Measures Of Poverty: The Case Of North Carolina
MELISSA ASHBAUGH After the Heatwave: Evaluating Plans and Policies to Address Renter Access to Air Conditioning in Portland, OR
CHLOE DONOHOE Tracking North Carolina’s Investments in Flood Resilience: An Evaluation of the Spatial Distribution of Funding in the State Budgets between 2017-2022
MICHAEL ENGLISH Analyzing the Anchor Institution Strategy of Urban Colleges and Universities
HANNAH ETTER Public Participation in Public Art: Case Studies of North Carolina
CHRISTY FIERROS Inundated: An Analysis of Flooded Environmental Disamenities in Eastern North Carolina
KEVIN GIFF Neighborhood Engagement at Habitat for Humanity of Orange County, NC: A Baseline Report
LANCE GLOSS Planning Urban Forests for Ecosystem Services in the Drought-Prone West
SYLVIA GREER Stakeholder and Community Engagement in Vision Zero Plan Development
JAMES HAMILTON Using Retrofit Case Studies as the Foundation of a Regional Sprawl Management Policy Frameworkeworks aiming to curb sprawling development.
Carolina Planning Journal : Volume 48 / Urban Analytics 94
WALKER HARRISON Renewing Equity, Safety, and Townwide Collaboration in Sidewalk Construction Prioritization
ZOE HUEBNER Wake Forest High School GIS Feasibility Study
HAKI JOHNSON Investigating the Racial Tax Appeal Bias in Mecklenburg County, North Carolina
DUNCAN JONES Discount Variety Stores and the Mitigation of Food Access Issues in Wilmington, NC
JOSEPHINE JUSTIN Equity In Planning Evaluation: An Analysis of California’s Hazard Mitigation & Climate Action Plans
TALYA KRAVITZ “From Parking Lot to Place”: A Case Study of Pike and Rose Infill Development in Montgomery County, Maryland
DAVID KUNZ Comparative Analysis of Street Connectivity Ordinances in North Carolina: Recommendations for a Street Connectivity Ordinance in Chapel Hill
TAYLOR LANG Southeastern North Carolina Rail Study and Vision Plan: An Independent Analysis
GABRIELLA LOTT Exploring 21st-Century Reverse Migration in North Carolina
COLIN LOWE Adding to the Disc-course: The Case for Urban Disc Golf
RENE MARKER-KATZ Disaster Risk Reduction and Resilience: A Case for the Creation of an Internationally Recognized Gender-Based Vulnerability Index
KATIE MILLER Comparative Analysis of Incentives in Form-Based Codes in North Carolina
LUKE MORIN Pre-Existing Supports and Factors Influencing Rapid Implementation of COVID-19 Public Space Accommodations
STUDENT WORK 95
CLASS OF 2023 MASTER’S PROJECT TITLES
SOPHIA NELSON Is it Fare? A Comparison of Public Transit Fare Enforcement Strategies
ISABELLA NIEMEYER A Guide to North Carolina’s Broadband Funding: Understanding the Funding, the Guidelines, and How the Programs Can Help Close the Digital Divide
JUSTIN NOLAN Building a Curriculum for Formalized Planning Courses in High School
AMY PATRONELLA Metropolitan Planning Organizations as a Vehicle for Regional Housing Planning
KRISTIN PODSIAD A Surveillance Tool for E-Bike Fatalities
JORDAN POWELL Urban Highway Revisioning as A Non- Traditional Planning Process; A Synthesis of Information Related to Reparative Justice
HENRY READ Vass Street Tree Plan
DUNCAN RICHEY Creating a Zoning Atlas for Raleigh and Cary, NC: Addressing Exclusionary Zoning and Equity
MARY ELIZABETH RUSSELL Impacts of the Rise in Industrial Warehouse Development on Economic, Environmental, and Social Equity in North Carolina
FRANCESCO TASSI Clean and Just? Modeling Least-Cost Low-Carbon Coal Plant Retrofit Decarbonization Meeting Regional Employment and Economic Impacts of North Carolina’s Coal Fleet
JOHN THOMPSON How to Plan Like an Ally: An Analysis of LGBTQ+ Planning in Carrboro, NC
BEAR TOSE Developing An Anti-Displacement Toolkit For Charlotte, NC: An Assessment Of Strategies From The Fastest-Growing US Metros
JIAYIN WANG Research on the Trend and Influencing Factors of Residential Property Sales Prices in Charlotte City, North Carolina
Carolina Planning Journal : Volume 48 / Urban Analytics 96
YUHUA WANG Mapping and Predicting Gentrification across US: From Theory to Practice
YUEJUN ZHAO What Is Your Modality Type? Identifying Traveler Typology in North Carolina
CHENQI ZHU How Streets Adapt to New Generation Transportation
STUDENT WORK 97
YEAR IN REVIEW
An Update From New East
LANCE GLOSS
The Department of City and Regional Planning had another wildly successful year of growth, change, and student accomplishments. The following snapshot highlights just a few of the wins at DCRP in Academic Year 2022-23.
GLOBAL URBANIZATION FELLOWSHIP: This year, DCRP launched the Global Urbanization Fellowship, which aims to increase the global reach of our curriculum by partnering students and faculty to research and create class modules focused on global urbanization issues. In its inaugural year, the winning students submitted a joint proposal to research the Arctic. Winners Nik Reasor and Samantha Pace have taken on this research with advising by Dr. Danielle Spurlock and Dr. Miyuki Hino, respectively.
FULBRIGHT: Amanda Ullman was awarded a Fulbright research grant. She embarked this year on research into Coal Community Priorities for a Just Energy Transition in La Guajira, Colombia, hosted by the Universidad de Bogotá Jorge Tadeo Lozano.
PLANNERS’ FORUM : Co-Presidents Jen Farris and Cameron McBroom-Fitterer shepherded Planners’ Forum, the umbrella organization for DCRP student committees, through the calendar year and have now turned their positions over to first-years Laurina Bird and Maggie Simon.
SPEAKER SERIES : DCRP hosted a plethora of guests for the Planning in Practice Speaker Series throughout the year, providing a window into the working lives of planners for students in the department and beyond.
DEI ADVANCES : The department has invested new resources in diversity, equity, and inclusion initiatives. Dr. Meenu Tewari has taken on the role of Associate Chair for DEI, and Isabel Soberal has done a spectacular job as DCRP’s first DEI Student Coordinator. DCRP also welcomed a sequence of highly-regarded practitioners and academics for a new speaker series focused on diversity, equity, and inclusion.
PIONEERS : This year, DCRP graduates its first cohort of students who completed the dual Bachelor/MCRP program, Will Anderson and Hannah Etter.
HONORS AND AWARDS : Isabel Soberal received the Weiss Urban Livability Fellowship and Gabriella Lott received the Excellence in Diversity Fellowship, both of which are awarded by DCRP. From outside the department, first-year MCRP students Carolyn Klamm and Abigail Cox were awarded scholarships from WTS International, celebrating their continued success as women in the transportation field. Sophie Nelson was awarded the Eisenhower Transportation Fellowship and enjoyed taking part in associated programming. Lance Gloss received the Thomas A. and Yolanda Stith Leadership Award from the Kenan Institute for Private Enterprise.
Carolina Planning Journal : Volume 48 / Urban Analytics 98
ECONOMIC DEVELOPMENT RESEARCH : DCRP alumna and post-doctoral fellow Sophie Kelmenson—in cooperation with Dr. Nichola Lowe, RTI International and the Urban Manufacturing Alliance—has launched a new project on inclusive innovation in advanced manufacturing, entitled Made With Equity. Dr. Donald Planey secured an impressive grant from the Robert Wood Johnson Foundation to study the impact of “Meds and Eds” (medical and academic establishments) in small and mid-sized metros. This work will be undertaken over several years in conjunction with faculty at UNC-Chapel Hill and Rice University.
NC-APA CONFERENCE : Many students and alumni attended the North Carolina chapter of the American Planning Association in Winston-Salem. The CPJ presented a panel on the role of media in advancing planning practice.
CLIMATE COP : DCRP students Rene Marker- Katz and Melissa Ashbaugh attended the 27th Conference of Parties (COP) to the UN Climate Convention in Sharm el-Sheikh, Egypt. Afterward, they presented their experiences to the UNC community.
TRB CONFERENCE : Numerous DCRP students attended the Transportation Research Board conference in Washington, DC, including Sophia Nelson who made a well-received poster presentation.
APA NATIONAL CONFERENCE : A dozen DCRP students traveled, again, to the nation’s capital for the national conference of the American Planning Association.
NEW FACULTY HIRES : A new faculty member has joined DCRP! The department welcomed Dr. Ashley Hernandez as an Assistant Professor, who has come to DCRP from a research role in the Department of Urban Planning and Public Policy at the University of California, Irvine. Students have described her as “brilliant” and “the perfect hire for DCRP.” Dr. Matthew Palm will also join the department for the Fall 2023 semester as an Assistant Professor. Dr. Palm comes to DCRP from the University of Toronto, where he has been working on transportation equity research as a postdoctoral fellow.
MUSICAL CHAIRS : Dr. Noreen McDonald has elected to vacate her position as the Departmental Chair at DCRP to pursue a role as Senior Associate Dean for Social Sciences & Global Programs. She will remain a DCRP faculty member as she fills this leadership position for the next five years. Dr. Nichola Lowe stepped in as Interim Chair upon this announcement. Dr. Yan Song will serve in the permanent role of Chair beginning in Fall 2023.
TENURED : Dr. Danielle Spurlock, who began her journey with DCRP in 2003 as a master’s student, has been granted tenure. Congratulations to Dr. Spurlock!
STAFF HIRES : The department hired Melanie Whisnant to fill the role of Accounting Technician, Aidan Aciukewicz as Grants Manager, Sarah Ward in the role of Student Services Coordinator. All three have been incredible additions to the department and have already made a positive impact on the culture at New East.
FACULTY FAREWELL : The department is saddened by the departure of Dr. Nichola Lowe, who has accepted a faculty position at the Hubert Humphrey School of Public Affairs at the University of Minnesota. We wish her luck!
99

Save the date! | Wednesday, October 11 - Friday, October 13 NC-APA 2023 CONFERENCE Durham, NC Durham Convention Center Learn more at https://northcarolina.planning.org/conference-and-events/ Carolina Planning Journal : Volume 48 / Urban Analytics 100
CAROLINA PLANNING JOURNAL
VOLUME 49 CALL FOR PAPERS
Carolina Planning Journal is accepting abstracts for papers relating to:
EVERYDAY LIFE AND THE POLITICS OF PLACE
During the COVID-19 lockdowns, the importance of space, place, and daily experiences in our lives resurfaced. In Volume 49 of the Carolina Planning Journal, we want to reflect on the meaning, politics, and experiences of space, place, and daily life. We will explore questions such as: How do we produce space? What values shape the production of space? Who produces space? Who has the right to the city or a specific space? How have social movements worldwide created alternative spaces? What role do our disciplines play in these considerations?
This debate has been explored in the fields of urban planning, geography, cultural theory, sociology, architecture, and anthropology, among others. It allows us to imagine space beyond a two-dimensional, empty backdrop solely for building structures. Instead, space is social and political, it is a living relationship with nature and each other, and it is a place for community and festivity. By examining our conception of space, we can question how capitalism, colonialism, racism, globalization, and more have diminished our relationship with space and one another.
TOPICS OF INTEREST INCLUDE BUT ARE NOT LIMITED TO :
• EVERYDAY LIFE and how we can generate new possibilities for resistance and political change amid triviality;
• SENSE AND POLITICS OF PLACE and the influence of globalization on sense of place;
• URBAN REVOLUTION and the role of urbanization in shaping society and relationships with nature;
• RIGHTS TO THE CITY and who claims space, including issues related to informal economies, housing justice, and immigrant experiences; and
• THIRD SPACES and the depletion of spaces that are neither work nor home in American urban life.
SUBMISSION GUIDELINES
By August 31, 2023 interested authors should submit a two-page proposal. Proposals should include a title, description of the proposed topic and its significance, a brief summary of the literature or landscape, and a preliminary list of references (not counted toward the two-page limit). Final papers typically do not exceed 3,000 words. Proposals and questions should be submitted to CarolinaPlanningJournal@gmail.com.
By September 30, 2023, Carolina Planning Journal will notify authors regarding their proposals. Drafts of full papers will be due by December, and editors will work with authors on drafts of their papers over the course of the winter. The print version of the Journal will be published in the Spring of 2021. Carolina Planning Journal reserves the right to edit articles accepted for publication, subject to the author’s approval, for length, style, and content considerations.
Bridging Planning Theory and Practice Since 1974
101
CAROLINA PLANNING JOURNAL Carolina Planning Journal : Volume 48 / Urban Analytics 102
