


Approved and Adopted by the Board of Directors December 15, 2022


Suffolk County Department of Health Services
Gregson Pigott, MD, MPH, Commissioner of Health
3500 Sunrise Highway, Suite 124
P.O. Box 9006
Great River, New York 11739-9006 (631) 854-0100
Coalition: The Long Island Health Collaborative (LIHC) is a coalition of the region’s hospitals, local health departments, academic institutions, community-based organizations, medical societies, health plans, clinics, and others dedicated to improving the health of all Long Islanders. The LIHC is overseen by the Nassau-Suffolk Hospital Council, the association that represents Long Island’s hospitals. The LIHC provided oversight and management of the Community Health Needs Assessment processes, including data collection and analysis for the Long Island region (Nassau and Suffolk counties).
This Community Health Needs Assessment (CHNA) represents a collaboration between Catholic Health, the Long Island Health Collaborative (LIHC), local community-based agencies, patients living in our community and the Suffolk County Department of Health. Catholic Health retained DataGen in the summer of 2022 to provide research analysis to facilitate this report, which defines the identified community health needs and barriers expressed by community members and the local community-based organizations that serve the region. This report’s primary data was collected by the Long Island Health Collaborative from January 2021 through August 2022. It includes input and comments from community members and community leaders. The secondary data used is from years 2018 – 2021. The results from multiple analyses will enable Catholic Health to deploy new and existing chronic disease prevention strategies, address relevant social determinant of health risk factors, and work to reduce the health disparities identified. The COVID-19 Pandemic placed a stark spotlight on health inequities in this region and this has reinforced Catholic Health’s enduring mission to bring health and social care to all communities. Good Samaritan University Hospital is one of six hospitals in the Catholic Health system. Located in West Islip, New York, Good Samaritan University Hospital offers Long Islanders the highest level of care. Known for women and children’s services, cardiac care, chronic disease management and mental health, our doctors, nurses and supporting medical staff deliver clinical excellence and compassionate care in numerous specialties.
At Catholic Health, we are dedicated to addressing the significant health needs of the communities we serve. Catholic Health’s six hospitals continue to build community health services and education programs in five core areas: chronic disease management, providing mental health services, treating and reducing substance use disorder, preventing communicable diseases and addressing the social determinants of health. In partnership with our community members and local nonprofits, churches, schools, and health departments, we are creating a healthier community, one patient at a time.
Good Samaritan University Hospital, along with Catholic Health’s other five hospitals, worked with the Long Island Health Collaborative (LIHC) and the Suffolk County Department of Health Services (SCDOHS), and dozens of community-based organizations, libraries, schools and universities, local municipalities, and other community stakeholders to produce this CHNA. SCDOHS representatives offered input and consultation, when appropriate, regarding the data analyses conducted by the LIHC and DataGen. Top, highlevel findings include a continued prevalence of chronic disease incidence, particularly heart disease, diabetes, obesity and cancer. Further, surging rates of mental health and
substance misuse issues among all demographic categories was found, with disparity seen among youth, and low-income communities of color continuing to experience a higher burden of disease overall. In 2022, members of the LIHC reviewed extensive data sets selected from both primary and secondary data sources to identify and confirm New York State Prevention Agenda priorities for the 2022-2024 Community Health Needs Assessment cycle. Data analysis efforts were coordinated through the LIHC, which served as the centralized data return and analysis hub. As directed by the data results, community partners selected:
1. Prevent Chronic Disease
Focus Area 4: Chronic Disease Preventive Care and Management
2. Promote Well-Being and Prevent Mental and Substance Use Disorders
Focus Area 2: Mental and Substance Use Disorders Prevention
Primary data was obtained from a community health needs assessment sent to individuals and a similar survey to community-based organization leaders1. Additionally, we looked at results from two qualitative studies to round out our primary data.2 Secondary data was derived from publicly-available data sets curated by DataGen into its proprietary data analytics platform, CHNA Advantage ™ , offering 200 plus metrics to determine health issues within Suffolk County.3 As such, priorities selected for the 2022- 2024 cycle remain unchanged from the 2019 – 2021 cycle selection, and the selected health disparities in which partners are focusing their efforts rests on the inequities experienced by those in historically underserved communities and communities of color. Additional Prevention Agenda priorities/disparities being addressed by Good Samaritan University Hospital are outlined in the 2022-2024 work plan (See Appendix E).
Good Samaritan University Hospital works with a broad range of partners to connect with the community, to assess their needs through distribution and promotion of data collection tools, and to provide interventions in collaborative settings, when appropriate. See page 9 for our extensive list of partners. We also rely on the LIHC and its role as neutral convener and regional leader, espousing the collective impact model and framework.4 As such, the LIHC serves as a backbone organization, providing its diverse partners with data analytics and administrative support in the areas of community outreach and education, and media relations support. LIHC’s networking capabilities, its programs around walking and chronic
1 Community Health Assessment Survey (CHAS) assessing responses from individuals, summary report and survey instrument (Appendix A) CBO Survey Analysis 2022, assessing responses from community-based organization leader, summary report and survey instrument (Appendix B)
2 Qualitative Analysis of Key informant Interviews Conducted among Community-Based Organization Leaders (Appendix C) Long Island Libraries: Caretakers of the Region’s Social Support and Health Needs: Qualitative Analysis (Appendix D)
3 Statewide Planning and Research Cooperative System (SPARCS), New York State Prevention Agenda dashboard, Behavioral Risk Factor Surveillance System (BRFSS), Extended Behavioral Risk Factor Surveillance System (eBRFSS), New York State Community Health Indicators by Race/Ethnicity Reports, Community Health Indicator Reports, Prevention Quality Indicators, CDC Places, and U.S. Census Bureau. The CHNA Advantage™ data analytics platform includes these and other state and national level indicators. It also encompasses social risk measures offered by Socially Determined, Inc.
4 https://collectiveimpactforum.org/
disease awareness, and health messaging efforts reinforce and augment the interventions we provide in the chronic disease and mental health needs spaces so that we are continually in touch with the broader community See Appendix F for a list of LIHC partners
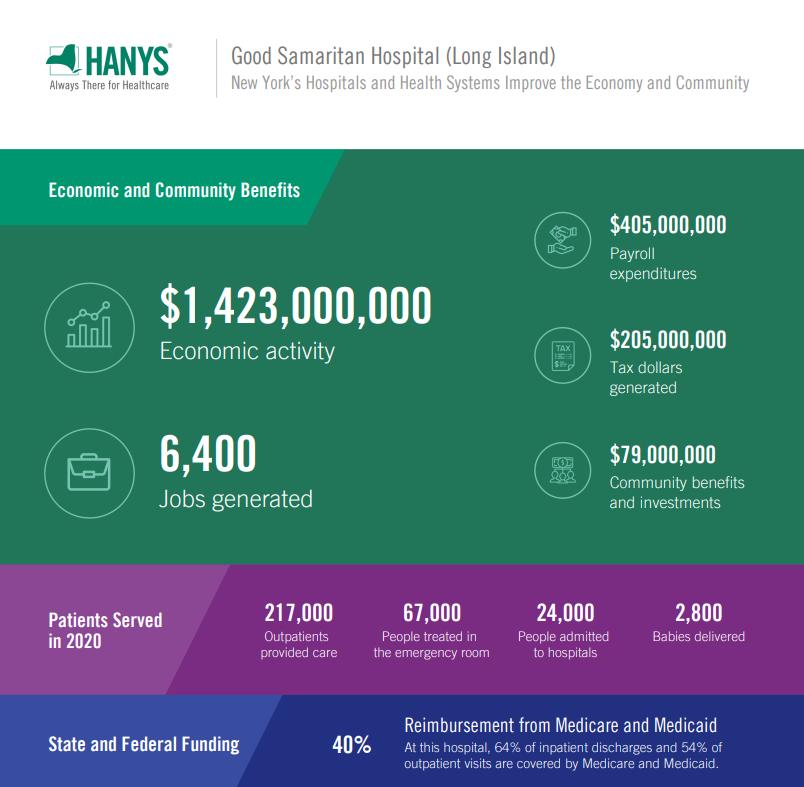
Source: Healthcare Association of New York State (2020 Community Benefit)
Suffolk County’s total population as of 2020 is 1,481,362 (47.2% male; 50.8% female). Those ages 15-44 represent 35.4% of females; 36.7% of males; ages 60 plus represent 23.7% of males and 25.6% of females; those 18 years and older represent 78.8% of males and 79.8% females. The region is predominately White at 65.3% with 7.7% Black/African American and 4.4% Asian. Hispanic or Latino represent 22.4% of the population,5 about a four percent increase from the last report.
Interestingly, according to the Robert Wood Johnson Foundation’s 2022 County Health Rankings, Suffolk County ranks 10th for health outcomes and eight for health factors6 . Health factors represent health issues that can improve length and quality of life. Health outcomes represent how healthy a county is right now.
Geographic description
Suffolk County is 2,373 square miles and is the second largest county in New York. Catholic Health’s three hospitals in Suffolk County service this easternmost county in New Yok State. The county is divided into 10 towns: Babylon, Huntington, Islip, Smithtown, Brookhaven, Southampton, Riverhead, East Hampton, Shelter Island and Southold.7 Suffolk County is an area of growing diversity, cultures, and population characteristics.
Socioeconomic information
In terms of household income, 35.2% of the population earn less than $74, 999 with 15% of that group earning less than $34,999 annually Of the population, 8% of those under 18 years of age live in poverty, while 6% of those ages 18 to 64 live in poverty and for those ages 18 -34, 6.7% live in poverty.8
The percentage of the population (5 years and over) that speaks a language other than English at home is 30.3%, with Spanish the dominant other language spoken 14.7% followed by other Indo/European languages 8.7% and Asian languages 5.1%. In terms of education, for those age 25 and over, 89.4% are high school graduates or higher, 31.9% hold a bachelor’s degree or higher. The percent of the total population uninsured is 4.2%. Of that percent, non-citizens represent 32% of the uninsured. Hispanic/Latino represent 42.1% of the uninsured followed by Black/African American 10%, White 63.9%, Asian 6.5%. Of the uninsured, 37.6% earn less than $74,999 household income and 9.1% earn under $25,000 household income
Approximately 9.6% of the total non-institutionalized population is disabled. By race/ethnicity, 10.6% of the Native Hawaiian/Pacific Islander population is disabled, 13.6% of the American Indian/Alaska Native population is disabled, 10% of the White population is disabled, 9.6% of the Black/African American population is disabled, and 7.2% Hispanic/Latino
5 U.S. Census Bureau, 2020 Decennial Census
6 https://www.countyhealthrankings.org/app/newyork/2022/rankings/suffolk/county/outcomes/overall/snapshot
7 https://www.ny.gov/counties/suffolk
8 U.S. Census Bureau, 2016-2020 American Community Survey, Five-Year Estimates
population is disabled. Interestingly, Native American/Pacific Islanders account for less than one percent of the county’s population.9
Income – one social determinant of health – precludes individuals from low-income communities from accessing preventive and/or medical care due to their difficulty to afford co-payments/deductibles (if insured) or care at all if they are uninsured. The inability to afford co-pays and deductibles consistently rises to the top as a barrier to health care on LIHC’s Community Health Assessment Survey year and after year. The median household income in the past 12 months by race is $107,422 (White), $85,840 (Black), $91,711 (Hispanic/Latino). Mean income in the past 12months, per capita by race is $50,352, $33,170 and $28,414, respectively10 . According to research conducted by the United Way of New York’s ALICE report, 11Long Island residents are earning wages that do not cover life’s basic costs. As of 2020, 31.5% of Long Island households fall below the set income threshold needed to live and work, which equates to 171,921 households in Suffolk County and 130,599 households in Nassau County and that are struggling to afford these basic needs.
Municipalities in target community
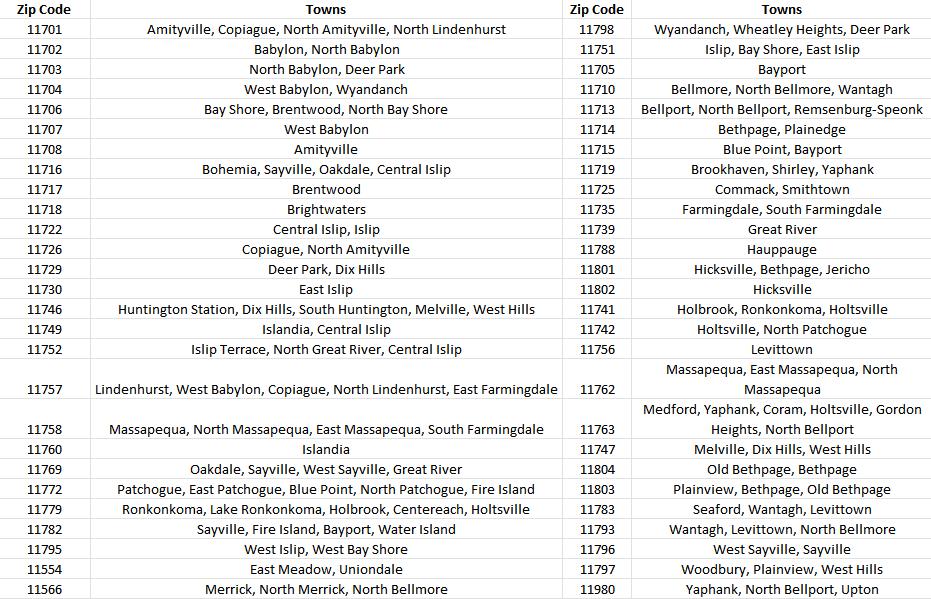
Good Samaritan University Hospital’s primary service area is Suffolk County. The chart below defines the zip codes and municipalities (towns) comprising the hospital’s service area.
9 U.S. Census Bureau, 2016-2020 American Community Survey, Five-year Estimates
10 U.S. Census Bureau, 2016 – 2020 American Community Survey 5-Year Estimates
11 https://www.unitedwayli.org/ALICE2020
Throughout Suffolk County, there are 17 identified communities in which a variety of socioeconomic factors lead to vast health disparities. These identified communities were determined by the Suffolk County Department of Health Services with concurrence from hospital partners. These communities are: Wyandanch, Central Islip, Brentwood, Riverhead, Bay Shore, Copiague, Mastic, Mastic Beach, Bellport, Amityville, Calverton, Patchogue, Shirley, Greenport, Lindenhurst, West Babylon, and Ridge.
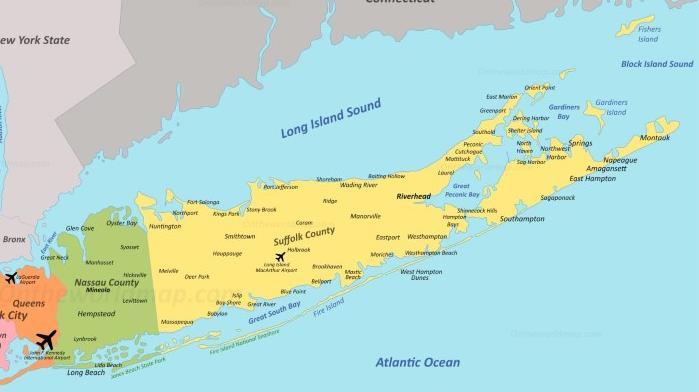
Source: https://ontheworldmap.com/usa/state/new-york/long-island/
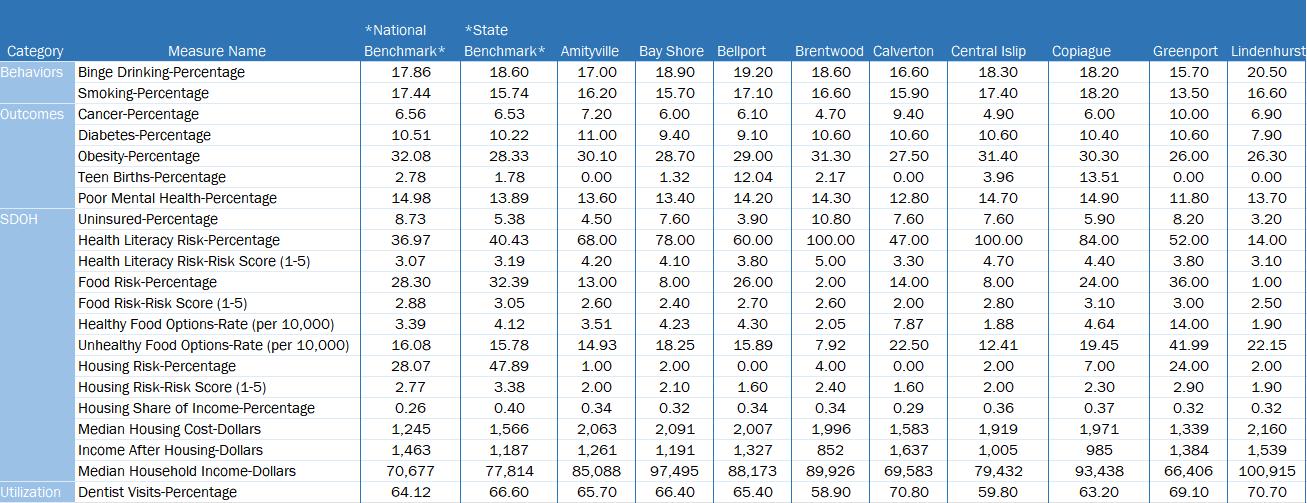
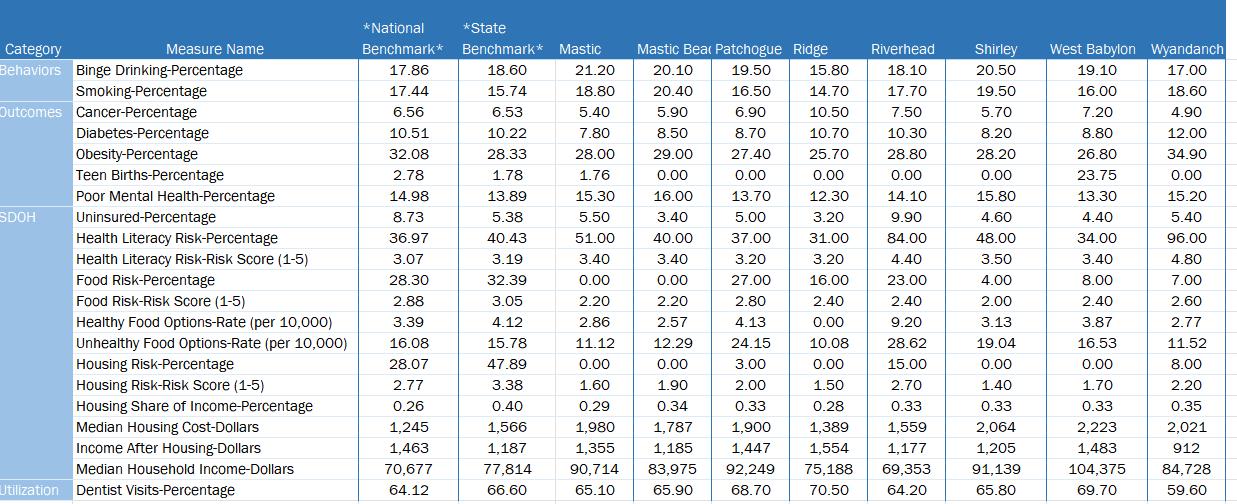
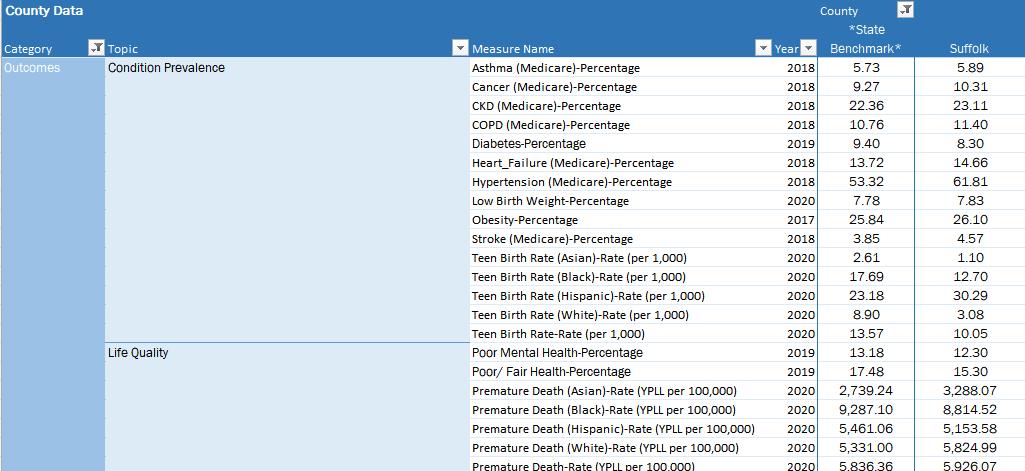
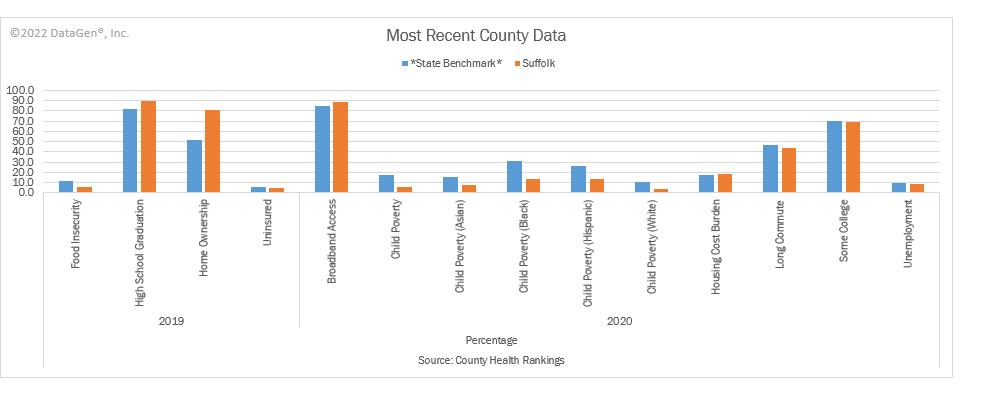
Health behaviors, outcomes, and social determinants of health indicators in the chart below compare Good Samaritan University Hospital key outreach communities.
CHNA Advantage™ Analytics Platform
As part of our collective impact strategies to promote health and well-being for residents in our communities, Good Samaritan University Hospital has strong relationships with local and regional community-based organizations, libraries, schools, faith-based organizations, the local health department, local fire departments and municipalities that support and partner with us to reduce chronic disease, mental health and substance misuse, and to promote health equity. Following is an extensive partner list of health care and other key institutions.
American Cancer Society
American Diabetes Association
American Legion
American Stroke Association
Amityville Fire Department
Amityville Public Library
Amityville School District
Ancient Order of Hibernians
Argyle Theatre
Babylon Beach Estates Association
Babylon Breast Cancer Coalition
Babylon Chamber of Commerce
Babylon Lions Club
Babylon Public Library
Babylon Rescue
Babylon Rotary
Babylon Village Chamber of Commerce
Bay Shore Beautification Society
Bay Shore Chamber of Commerce
Bay Shore School District
Bay Shore/Brightwaters Public Library
Bay Shore/Brightwaters Rescue Ambulance
Bay Shore Fire District
Bethpage Federal Credit Union
Big Brothers Big Sisters of Long Island
Bohemia Fire Department
Boy Scouts of America
Brentwood Chamber of Commerce
Brentwood Legion Ambulance
Brentwood Rotary
Brentwood LI Tropical Festival
Brightwaters Village
Cancer Services Program of Suffolk County
Catholic Charities
Catholic Home Care, Farmingdale
Central Islip/ Hauppauge Ambulance
Chabad of Islip
Commack Volunteer Ambulance
Connetquot School District
Copiague Fire Department
Copiague Public Library
Coram Fire Department
Cornell Cooperative Extension/Eat Smart NY
Crohn’s & Colitis Foundation
Deer Park Fire Department
Dix Hills Fire Department
East Brentwood Fire Department
East Farmingdale EMS
East Islip Chamber of Commerce
East Islip School District
Economic Opportunity Council of Suffolk
EJ Autism Foundation
Emergency Ambulance Services (EAS)
Exchange Ambulance of Islip
Fair Harbor Fire Department
Gift of Life
Good Samaritan Nursing Home, Sayville
Good Shepherd Hospice, Farmingdale
Great South Bay YMCA
Hunter/GMR Emergency Medical Services
Impact Melanoma
Islip Arts Council
Islip Breast Cancer Coalition
Islip Chamber of Commerce
Islip Food for Hope
Islip School District
Islip Rotary
Islip Terrace Fire Department
Jake K Foundation
Kiwanis of Islip’s & Bay Shore
Lindenhurst Fire Department
Lindenhurst Public Library
Lions Club of Bay Shore
Lions Youth Cheerleading
Long Island Alzheimer & Dementia Center
Long Island Blood Services
Long Island Cares
Long Island Ducks
Long Island Elite
Long Island Fight for Charity
Long Island Health Collaborative (LIHC)
Long Island Neurosurgical & Pain Specialists
Maryhaven Center of Hope, Port Jefferson
Massapequa Coast Little League
Massapequa Road Runner Club
Mercy Hospital, Rockville Centre
Mondays at Racine
New York Institute of Technology College of Osteopathic Medicine, Central Islip
North Babylon Chamber of Commerce
North Babylon Lions Club
Ocean Beach Community Fund
Ocean Beach Association
Operation Vest
Our Lady of Consolation Nursing & Rehabilitative Care
Center, West Islip
Paige Keely Foundation
Pink Tie Foundation
Postpartum Resource Center of NY
Pronto
Sachem School District
Sagtikos Manor Historical Society
Save the Great South Bay Foundation
Sayville Community Ambulance
Sisters United in Health
Society of St. Vincent de Paul
Splashes of Hope
St. Anthony’s High School, Huntington
St. Catherine of Siena Hospital, Smithtown
St. Catherine of Siena Nursing & Rehabilitation Care Center, Smithtown
St. Charles Hospital, Port Jefferson
St. Francis Hospital, Roslyn
St. John the Baptist High School, West Islip
St. Joseph Hospital, Bethpage
St. Patrick Elementary School, Bay Shore
Stony Brook Medicine
Suffolk County
Suffolk County Police Department
Teachers Federal Credit Union, Bay Shore
Telecare
Thirst Project
Town of Babylon
Town of Islip
West Babylon Fire Department
West Babylon Football League
West Babylon Public Library
West Islip Association
West Islip Breast Cancer Coalition
West Islip Country Fair
West Islip Chamber of Commerce
West Islip Fire Department
West Islip Historical Society
West Islip Library
West Islip Little League
West Islip School District
West Islip Symphony Orchestra
West Islip Teachers Association
West Islip Touchdown Club
Westfield Mall, Bay Shore
Women of West Islip Inc.
Good Samaritan University Hospital also relies on the LIHC to disseminate information about the importance of proper nutrition and physical activity among the general public to assist Suffolk residents in better managing their chronic diseases and/or preventing the onset of chronic diseases. Good Samaritan University Hospital also relies on the LIHC to disseminate information about mental health prevention and treatment services and programming, as well as relevant information about substance misuse. Dissemination of information is achieved through the bi-weekly Collaborative Communications enewsletter, which is sent to 588 community-based organization leaders, and strategic use of social media platforms. These efforts are ongoing. The work plan (see Appendix E) outlines anticipated measures and activities for 2023 supported by the LIHC Finally, the hospital participates in the LIHC’s quarterly stakeholder meetings and avails itself of LIHC’s extensive network. See Appendix F for a list of partners. A representative from the Suffolk County Department of Health also participated in the monthly 2022 CHNA Workgroup – September 2021 – April 2022. (See Appendix G for list of workgroup members)
Low-income communities of color, especially those in the identified 17 communities, bear a greater burden of chronic disease, which is exacerbated by social determinant of health need factors.
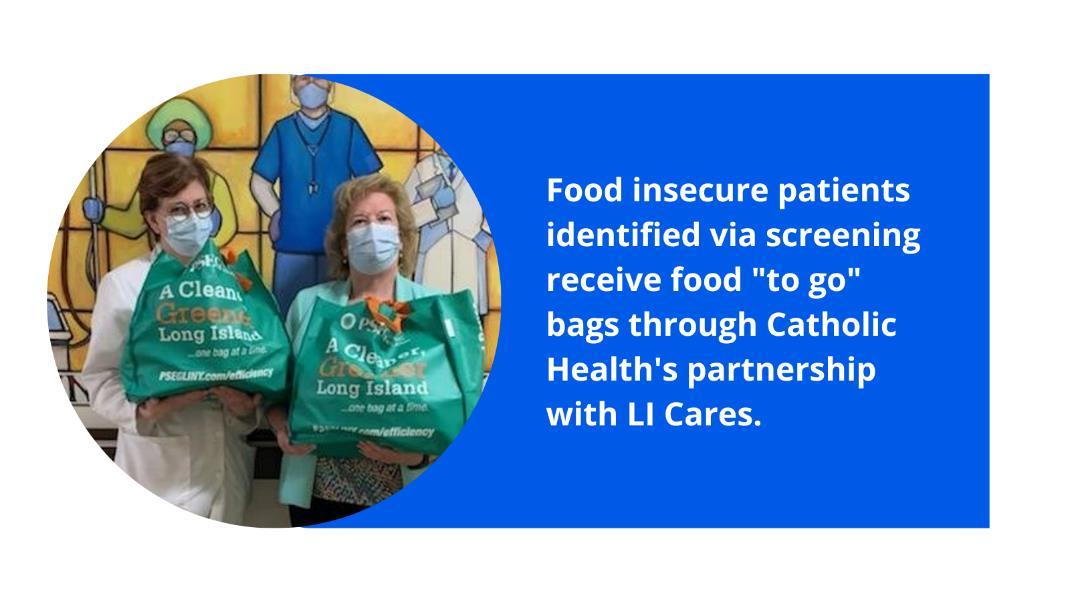
Financially stressed individuals have difficulty affording nutritious foods, leaving them more vulnerable to poorer chronic disease management outcomes, since nutrition and diet play a pivotal role in every chronic disease. This is one of the reasons why Catholic Health has embarked on new food insecurity initiatives with community partners Long Island Cares, Catholic Charities, and the Health and Welfare Council of Long Island. Catholic Health is also collaborating with Catholic Charities and Health and Welfare Council of Long Island to enroll individuals and families identified as food insecure in the Supplemental Nutrition Assistant Program (SNAP).
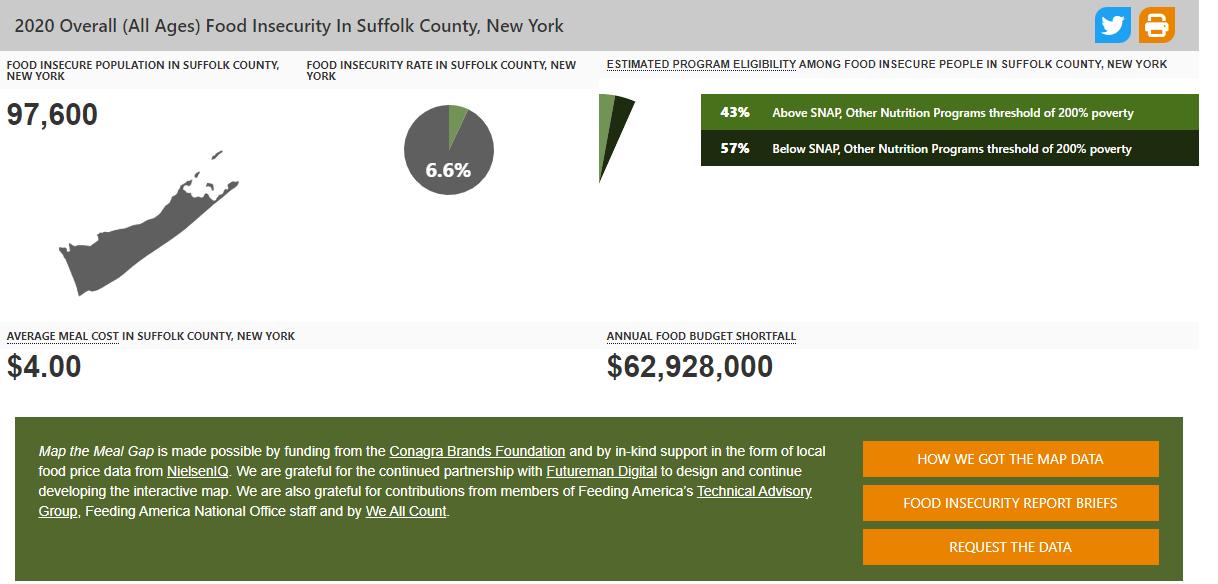
According to Feeding America, 6.6% of Suffolk County residents are food insecure, which represents 97,600 community members. Another Feeding America study, Map the Meal Gap 2020, examined the cost of food and cost of living in zip codes across the United States. Suffolk County’s Annual Food Budget
Shortfall represents $62,928,000, according to the study, and 44% of adults are living above the 200% federal poverty level for SNAP.12
Through the CHNA process, reducing chronic diseases and mental health illness/substance misuse have been identified as the top two priorities in our communities. Embedded within these priorities are areas of need, which the primary and secondary research revealed.
Areas of Identified Need
Access to care, mental health, health literacy, education, economic security (poverty), obesity and weight loss, food access, clean air and water.
Primary data and secondary data demonstrate that residents living in Suffolk County are experiencing poor mental health status. The 2021 Robert Wood Johnson Foundation County Health Rankings examining Suffolk County in Quality-of-Life Health Outcomes demonstrates an average of 4.0 poor mental health days per 30 days in Suffolk County.13 Mental health issues have soared in the past two years, spurred in part, by the effects of the pandemic. Using data from the U.S. Census Bureau’s COVID19 Household Pulse Survey (April 23, 2020 – October 26, 2020), a New York State Health Foundation analysis found that more than one-third of adult New Yorkers reported symptoms of anxiety and/or depression, with racial and ethnic groups of color as well as low-income New Yorkers, reporting the highest rates of poor mental health. However, the 18 – 34-year-old age group reported the highest rates (49%) of poor mental health.14 High school students (grades 9 through 12) fared just as badly. A number
12 https://map.feedingamerica.org/county/2020/overall/new-york/county/suffolk
13 https://www.countyhealthrankings. org/app/new-york/2021/compare/snapshot?counties=36_059%2B36_103
14 https://nyhealthfoundation.org/resource/mental-health-impact-of-the-coronavirus-pandemic-in-new-yorkstate/#:~:text=The%20proportion%20of%20New%20Yorkers,health%20throughout%20the%20survey%20period
Good Samaritan University
Community Health
2022 of studies found poor mental health along with suicide ideation intensified during the pandemic for high schoolers, especially among females. An April 2022 analysis of data from the 2021 Adolescent Behaviors and Experiences Survey revealed that 37.1% of students experienced poor mental health during the pandemic, and 31.1% experienced poor mental health during the preceding 30 days.15 The pandemic made a bad situation worse, especially for youth, as mental health issues and suicides were already increasing prior to the COVID-19 pandemic.16 17 18 19 With the shortage of mental health care workers and the lingering psychological effects of the pandemic, mental health services remain a top priority for the region.
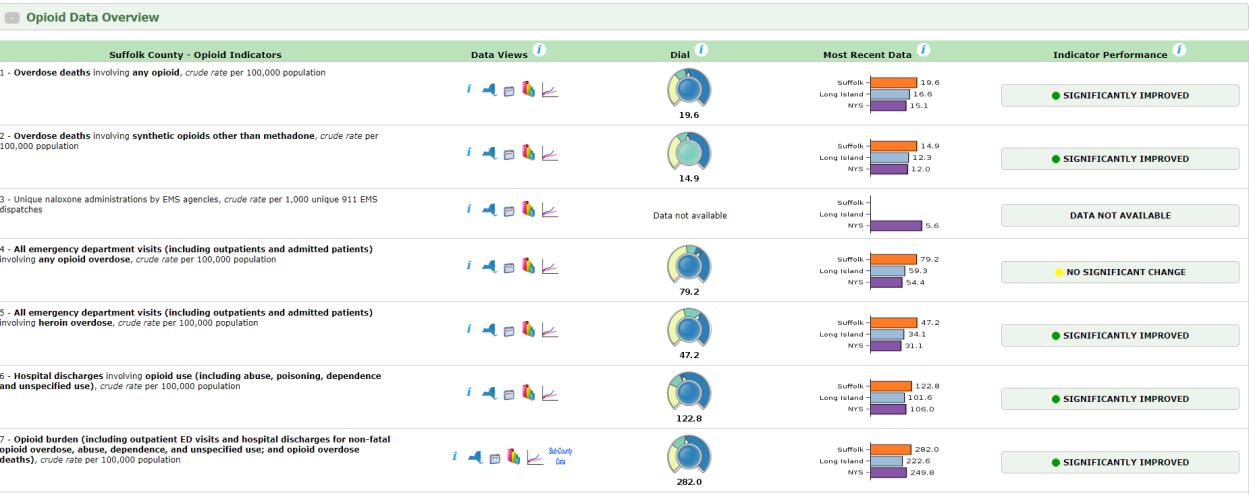
The county also saw an uptick in opioid-related overdoses and deaths after having made some gains prior to the pandemic. As of 2019, Suffolk County still exceeds the New York state benchmark of 15.1 in overdose deaths per 100,000 due to opioids. According to data provided by Suffolk County’s Department of Health, the rate of opioid overdoses is currently 19.6. In addition, emergency department visits involving heroin overdoses is extremely high in the county. As of 2019, the Suffolk County rate is 47.2 compared to New York State’s benchmark of 31.1 per 100,000 population.20
15 https://www.cdc.gov/mmwr/volumes/71/su/su7103a3.htm? s_cid=su7103a3_w
16 https://www.cdc.gov/mmwr/volumes/66/wr/mm6630a6.htm
17 https://www.cdc.gov/nchs/fastats/mental-health.htm
18 Weinberger, A. et al. (August 2017) Trends in depression prevalence in the USA from 2005 – 2015: widening disparities in vulnerable groups. Psychological Medicine, 1-10
19 Bitsko, R et al. (2018) Epidemiology and impact of healthcare provider-diagnosed anxiety and depression among US children. Journal of Developmental and Behavioral Pediatrics, 1-9.
20https://webbi1.health.ny.gov/SASStoredProcess/guest?_program=/EBI/PHIG/apps/opioid_dashboard/op_dashboard&p=ch&cos=47
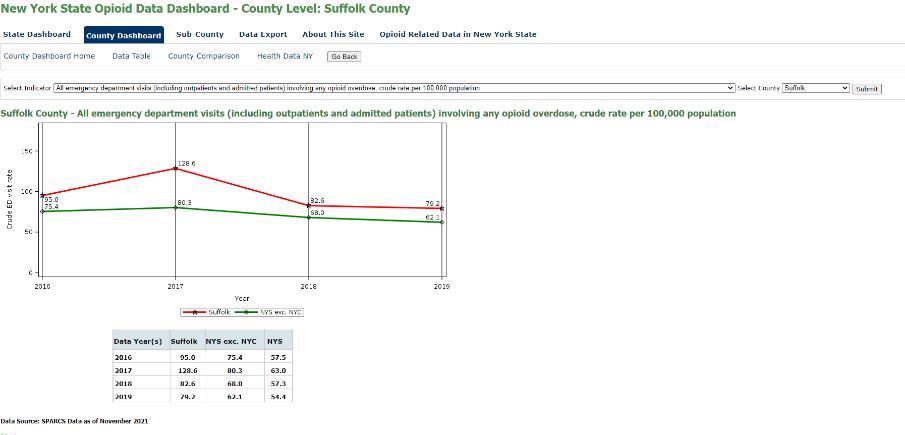
In the above chart, data on emergency room visits illuminate the opioid pandemic in Suffolk County. The New York State Department of Health statistics report that for 2020 in Suffolk County there were 362 deaths from any opioid, 59 heroin overdose deaths, and 335 deaths involving opioid pain relievers (including illicitly produced opioids such as fentanyl).21 For 2019, the numbers were 173, 47, and 163, respectively via categories listed above.22
Another health disparity identified in primary and secondary research is adult obesity. According to the Robert Wood Johnson Foundation’s County Health Rankings for Suffolk County,23 27% of the population (18 and older) reports a body mass index (BMI) greater than or equal to 30 kg/m.24 In 2019, The New England Journal of Medicine studied projected adult obesity in the United States by 2030 based on today’s obese and overweight adult populations.25 By 2030, the obesity epidemic is projected to impact nearly 1 in 2 adults.
21 https://www.health.ny.gov/statistics/opioid/data/pdf/nys_apr22.pdf
22 https://www.health.ny.gov/statistics/opioid/data/pdf/nys_jan21.pdf
23 https://www.countyhealthrankings.org/app/new-york/2022/measure/factors/11/map
24 https://www.health.ny.gov/statistics/prevention/injury_prevention/information_for_action/docs/2021-02_ifa_report.pdf
25 https://www.nejm.org/doi/full/10.1056/NEJMsa1909301
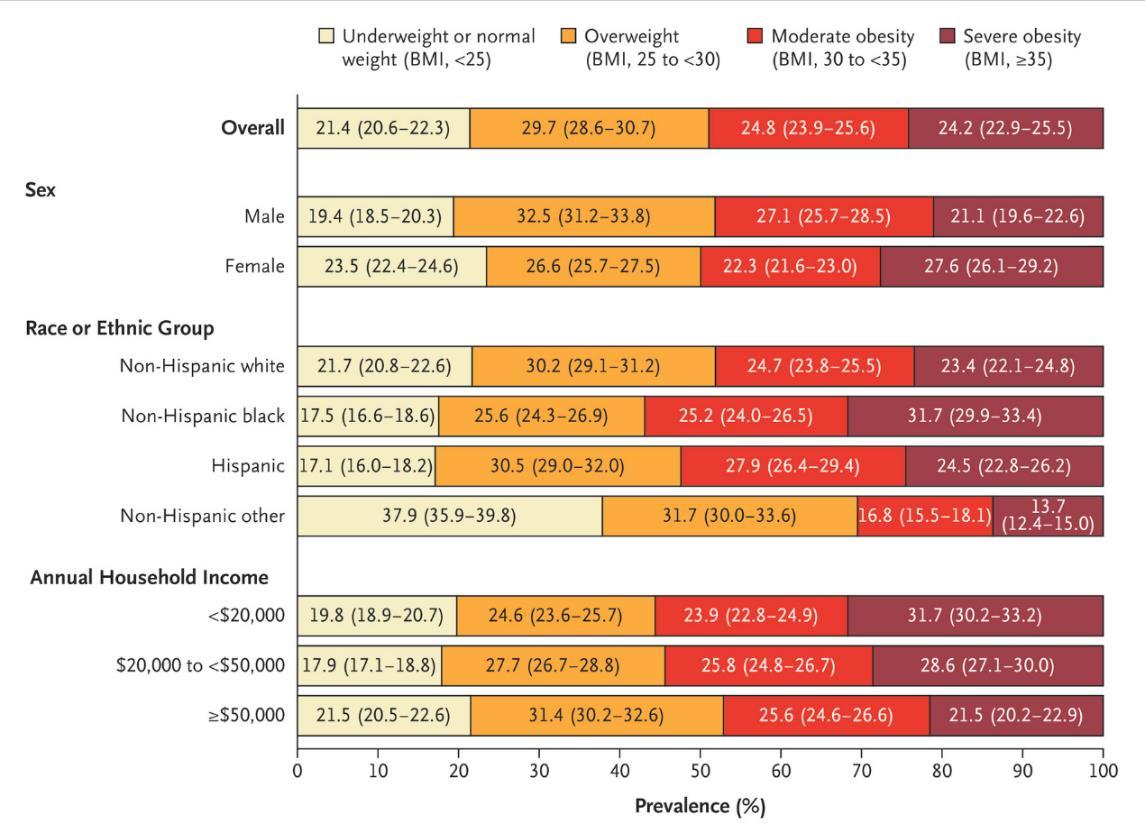
Source: New England Journal of Medicine, Projected U.S. State Level Prevalence of Adult Obesity and Severe Obesity (2019).
According to the New York State Department of Health, obesity is a significant risk factor for many chronic diseases including type 2 diabetes, high blood pressure, asthma, stroke, heart disease and certain types of cancer. The prevalence of chronic diseases is persistent in the county. Nationally, communities of color experience higher rates of chronic disease. Using diabetes as an example, the American Indian/Alaska Native population represents 14.5 percent of adults 18 or older who are diagnosed with diabetes followed by Black, non-Hispanic at 12.1% and Hispanic overall at 11.8% in the United States. Asians and Whites experience the disease at 9.5% and 7.4% respectively.26 Health providers report that many individuals delayed preventive care and routine screenings due to the pandemic, leading to more complicated cases and unfavorable outcomes. Chronic diseases are preventable conditions sensitive to lifestyle (diet/physical activity) habits but hampered by the obstacles presented by social determinant of health factors - income/employment, race/ethnicity, food access, housing/neighborhood location, and level of education. The county and hospitals identified in this report through collaborative efforts and facility-specific programming acknowledge and address these determinants regularly.
26 https://www.cdc.gov/diabetes/health-equity/diabetes-by-the-numbers.html
These are the main health challenges and contributing causes affecting residents of the county, especially in low-income communities of color. That these social determinants of health are predictors of chronic disease is well documented.27 28 29 Health care access issues are mostly tied to economics (quality of health insurance, employment, and cost of living). In the mental health/substance misuse space, access is further hampered by a dearth of providers. Fear, which includes immigration status, is also a detriment to health care access.
27 Cockerham WC, Hamby BW, Oates GR. The Social Determinants of Chronic Disease. Am J Prev Med. 2017 Jan;52(1S1):S5-S12. https://doi.org/10.1016%2Fj.amepre.2016.09.010. PMID: 27989293; PMCID: PMC5328595.
28 Pantell MS, Prather AA, Downing JM, Gordon NP, Adler NE. Association of Social and Behavioral Risk Factors With Earlier Onset of Adult Hypertension and Diabetes. JAMA Netw Open. 2019;2(5):e193933. Https://doi:10.1001/jamanetworkopen.2019.3933
29 Vennu, V., Abdulrahman, T.A., Alenazi, A.M. et al. Associations between social determinants and the presence of chronic diseases: data from the osteoarthritis Initiative. BMC Public Health 20, 1323 (2020). https://doi.org/10.1186/s12889-020-09451-5
As the pandemic revealed, Black and Hispanic individuals experienced higher rates of COVID-19 disease and death. These higher rates correlated to low-income areas and the higher rate of chronic disease seen in these communities. According to the Centers for Disease Control and Prevention (CDC), chronic disease is a leading risk factor for COVID-19 morbidity and mortality. The 2021 National Healthcare Quality and Disparities Report30 notes that significant disparities still exist among racial or ethnic minority groups. Although the report’s most recent data reference is 2018, we can examine one chronic disease –hypertension – and extrapolate that in recent years the incidence has not improved. The report notes that the rate of hospital admissions for hypertension was 212.9 per 100,000 population for Black adults compared with 38.4 per 100,000 cases for White adults and just over 50 cases per 100,000 for Hispanics. The New York State COVID-19 Fatalities Tracker31 shows that the number one COVID-19 co-morbidity was and is hypertension.
The Long Island Vaccination HUB, the entity charged by the state with ensuring equitable distribution of vaccines, tracked vaccine distribution by the week until the spring of 2022. Catholic Health participated in the HUB, holding point of distribution (POD) clinics at churches and other community venues. Among patients who tested positive for COVID-19, Black, Hispanic, and Asian patients remained at higher risk for hospitalization and death compared to White patients with similar socioeconomic characteristics and underlying health conditions, suggesting racism and discrimination may affect outcomes.32
30 https://www.ahrq.gov/research/findings/nhqrdr/nhqdr21/index.html
31 https://coronavirus.health.ny.gov/fatalities-0
32 https://www.kff.org/coronavirus-covid-19/issue-brief/covid-19-racial-disparities-testing-infection-hospitalization-death-analysisepic-patient-data/
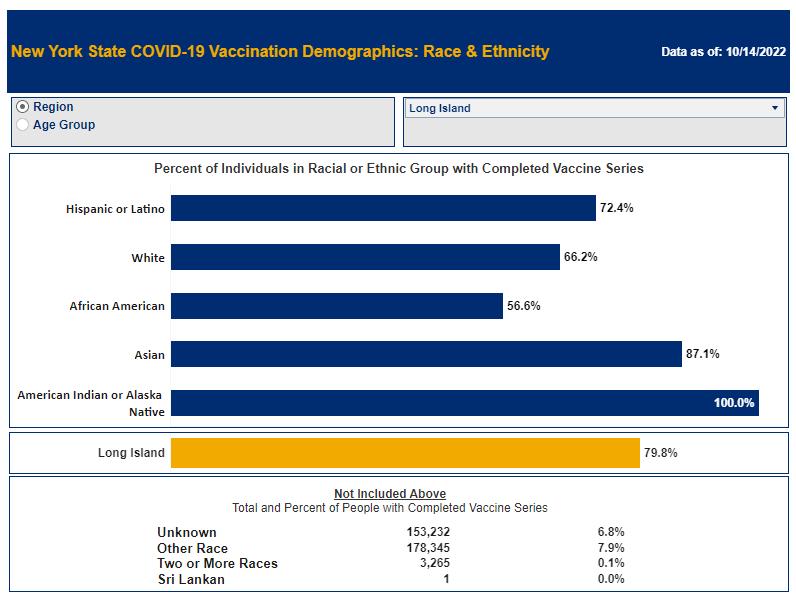
Source: Demographic Vaccination Data | Department of Health (ny.gov)
As of October 14, 2022, 2022, 92.5% of Suffolk County residents have received at least one dose. Race and ethnicity data is available for vaccinated adults living on Long Island and shows that 72% of Latino adults, 66% of White adults 56% of Black adults have been fully vaccinated against COVID-19. Ongoing partner efforts will continue to promote booster vaccines to eligible community residents
Guided by the LIHC, Catholic Health and all regional partners reviewed results from the two qualitative analyses and two quantitative analyses, our sources of primary data, and a variety of secondary data analyses provided by DataGen, which were drawn from national, state, and county publicly available datasets, as well as proprietary health determinant data metrics from Socially Determined, Inc.
The engagement process we used to select the two priorities was purposeful and collaborative. On April 5, 2022, at 8 a.m., the LIHC posted results of all its data analyses. The members of the 2022 CHNA Workgroup were asked to review the results in advance of the priority selection meeting, which occurred on April 5, 2022, at 1 p.m. via Zoom. The data analyst walked participants through screenshots of the relevant findings. Participants also viewed the Prevention Agenda dashboard, diving deep into the goals, objectives, and recommended interventions for each priority. Present at the meeting were representatives from Long Island’s two health departments and representatives from Long Island’s hospitals/health systems, as well as staff of the LIHC. Attendees discussed primary and secondary data results and based the selection of priorities on the following criteria:
The overwhelming evidence presented by the data, especially the first two questions of the Community Health Assessment Survey
The activities/strategies/interventions currently in place throughout the region
The feasibility of achieving momentum and success with a chosen priority, taking into account the diversity of partners and community members served
Comments from community members and others regarding the previous CHNA
After an official vote, the priorities were selected unanimously. The April meeting was a culmination of seven LIHC work group meetings held each month, beginning in September 2021 and concluding in April 2022. At these meetings, in addition to representatives noted above, community-based organization leaders from a range of sectors offered input.
Engagement of the broader community, for assessment purposes, is achieved through the LIHC’s and its partners’ ongoing distribution of the Community Health Needs Assessment – the main primary research tool used to gauge community health needs, social support needs, and barriers to health care on an ongoing basis. This survey is offered online via a SurveyMonkey link and is available in paper format to residents at public events, workshops, educational programs, and interventions which are offered by Good Samaritan University Hospital and other LIHC partners. A paper version is also distributed among physician offices, hospital waiting areas, libraries, schools, federally qualified health clinics, insurance enrollment sites, and other public venues. The LIHC vigilantly promotes the survey through social media and asks LIHC participants to post the survey link on each of their websites. The LIHC provides a social media toolkit with an opportunity for co-branding to facilitate participation and Good Samaritan University Hospital has availed itself of this service. Good Samaritan University Hospital posts this survey and the SurveyMonkey link on its website and in electronic and print community newsletters. The survey can also be accessed via a QR code. Results from the Community Health Assessment Survey are analyzed yearly. Findings are shared with all LIHC participants, with the media, and posted on the LIHC website. A certified translation of the survey is available in the following languages: Spanish, Polish, and Haitian Creole. Large print copies are also available to those living with vision impairment.
Engagement of the broader community, for implementation purposes, is assisted by the LIHC’s encouragement of community members to participate in programs, workshops, support groups and educational programs offered by Good Samaritan University Hospital and all LIHC partners. In addition, the LIHC offers limited programming itself, such as the Walk Safe with a Doc events and Talk with a Doc events (presented in collaboration with AARP-LI). All LIHC quarterly meetings are open to the public and recordings of the meetings are housed on its website. The LIHC, on behalf of all its participants and the community members each participant serves, supports the following evidence-based activities and programs:
Awareness Campaign (Live Better) about chronic disease via social media and traditional media platforms (this campaign captures any mentions about chronic diseases and relevant programs/education efforts)
Awareness Campaign about mental health prevention and treatment programs/education, as well as relevant treatment and prevention programming relative to substance misuse via social media and traditional media platforms (this campaign captures any mentions about mental health/substance misuse programs/events/workshops, etc.)
Walk Safe with a Doc are community walking events that combine pedestrian safety education with chronic disease education all while walking. The LIHC maintains an active Walk with a Doc chapter for the region.
Talk with a Doc are Zoom-delivered educational programs led by physicians from the region’s hospitals covering a variety of chronic diseases.
When they first gathered in 2013, LIHC partners embraced walking as a simple, low-cost, easy activity that most anyone of any age can perform. Walking is an evidence-based intervention that offers proven
benefits to one’s physical and mental health. The Walk with a Doc chapter is the activity through which LIHC, and its partners promote the health benefits of walking. See Research and Supporting Evidence in Appendix H. Collaborative participants rely upon LIHC’s use of social media and traditional media to crosspromote collaborative partners’ programs, interventions, events, workshops, etc., as well as general messaging about healthy lifestyle behaviors (physical activity and proper nutrition). Awareness campaigns use best practices for message conveyance. There is evidence as to the user engagement and sustainability effects of social media and mass media regarding health messaging. Investigation in this area is ongoing (See Research and Supporting Evidence in Appendix H). The Community Guide, a website that houses the official collection of all Community Preventive Services Task Force findings and the systemic reviews on which they are based, was also referenced.33
Catholic Health obtained population level and zip code analyses on social determinant of health drivers and health/risk factors dominant in Catholic Health’s service area from its data partner, DataGen. We also looked at hospital utilization data and emergency department data to discern top diagnoses. A survey completed by individual community members, a similar survey completed by community-based organization leaders, key informant interviews with selected leaders, and the results of qualitative research among public library personnel rounded out the research for this cycle’s CHNA. The CHNA approach used both quantitative and qualitative research methods designed to evaluate the perspectives and opinions of stakeholders and health care consumers. The methodology helped develop a broad, community-based list of needs in addition to prioritizing the needs and establishing a basis for continued community engagement.
Quantitative Methods and Research Tools (See appendix for full reports and tools)
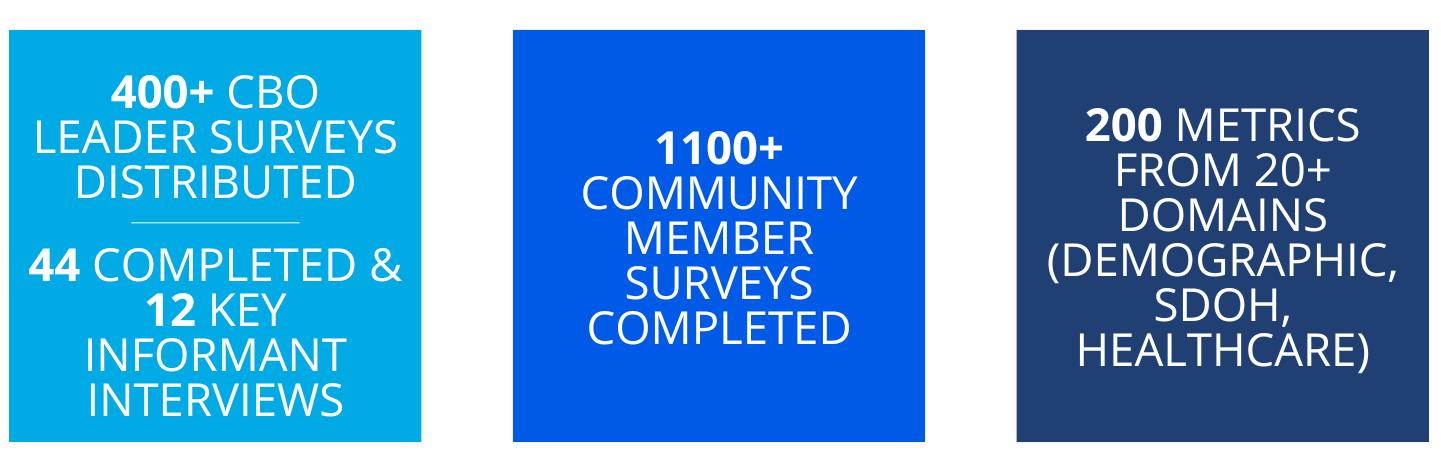
Community Health Needs Assessment Survey (CHAS) – measured individual and community level perception of health needs and barriers. A total of 1,143 were completed during the period of January 2021 –December 2021. A subsequent analysis particular to the zip codes in Good Samaritan University Hospital service area was completed by analyzing 439 surveys collected during the period January 2022 – August
2022. The CHAS provides a snapshot in time of the main health challenges facing communities. It uses the SurveyMonkey platform. Convenience sampling method.
CBO Community Needs Assessment Survey – community-based organization leader perception of health needs and barriers faced by their constituents/patients. A total of 44 surveys were completed (10 from Suffolk County, 25 from Suffolk County, 9 with no location specified). The survey was distributed to 400 plus leaders during the time period December 1, 2021 - January 15, 2022. It uses the SurveyMonkey platform. Purposeful sampling method.
Qualitative Methods and Research Tools (See appendix for full reports and tools)
CBO Key Informant Interviews – of the 44 CBO leaders who completed the above-mentioned CBO community needs assessment, 23 agreed to a follow-up in-depth interview and 12 actually participated. The interviews were conducted February 23, 2022, to March 4, 2022, via Zoom and recorded. Atlas Ti version 22 web-based platform used for grounded-theory analysis.
Library Research Project – a two-year study providing an insider look at the health and social support needs of patrons who frequent Long Island’s public libraries. Library personnel at randomly selected libraries throughout Suffolk County were selected for this study. A total of 96 interviews (Nassau and Suffolk County libraries) were conducted during the time period December 2017 to February 2020. Interviews were recorded, then transcribed, and analyzed using Dedoose qualitative software (grounded theory) for recurring themes with the report “Long Island’s Libraries: Caretakers of the Region’s Social Support and Health Needs” issued July 2021. Stony Brook University Program in Public Health researchers and students completed the analysis. The analysis considered the socioeconomic differences of communities by location, the influence of social determinants of health, and the Prevention Agenda priorities.
The secondary data research included a thorough analysis of previously published materials/metrics that provide insight regarding the community and health-related measures.
SPARCS (Statewide Planning and Research Cooperative System) – analysis of hospitalization data 2018, 2019, 2020.
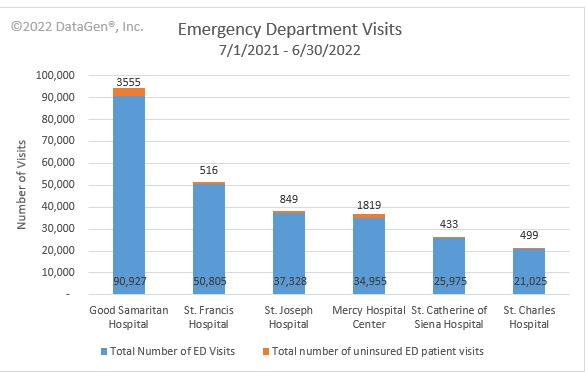
Emergency Department Visits – analysis of Good Samaritan University Hospital emergency department visits during the time period July 1, 2021, to June 30, 2022, to discern top diagnoses.
Socially Determined, Inc. social risk analytics spanning 200 metrics drawn from a variety of publicly available national, state, and county datasets. Zip code and census track level data.
FINDINGS TO SUPPORT IDENTIFIED NEEDS
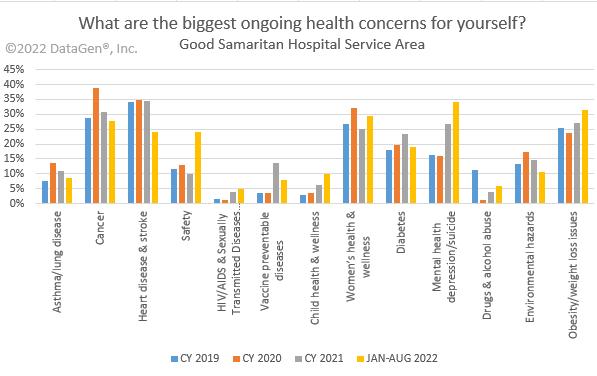
Data from both the primary and secondary research methods revealed the following key themes. Primary data survey results from hundreds of Suffolk County residents reveal obesity, mental health, and drug and alcohol usage, cancer and diabetes as some of the top concerns for 2022.
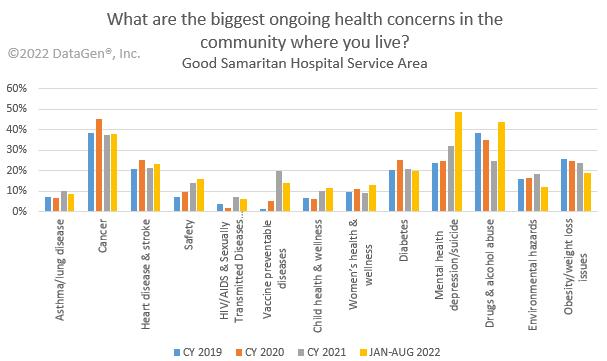
In the above chart, survey respondents answered what their biggest health concerns affecting their community are from their individual perspective. We then compared to annual results from 2019, 2020, 2021 and January – August 2022. The results represent survey responses over three years and eight month for identified health concerns. We focused on the most recent findings – 2022. There is a significant increase in 2022 for mental health, cancer, obesity, depression/suicide and drugs and alcohol abuse. Further, when answering questions about individual health, survey takers indicated mental health/depression, cancer, heart disease, along with obesity/weight loss issues, safety, and women’s health and wellness. That is illustrated in the chart below.
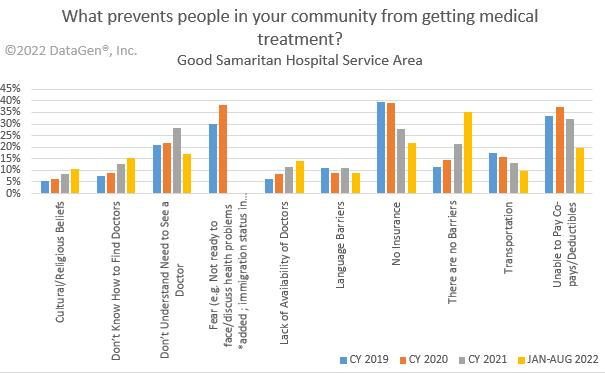
The responses above highlight perceived barriers to care. In what prevents community members for accessing care, responses ranged from language barriers, to fear of seeing a provider, to the cost of care. Poverty and economic distress were also identified in community key informant interviews.
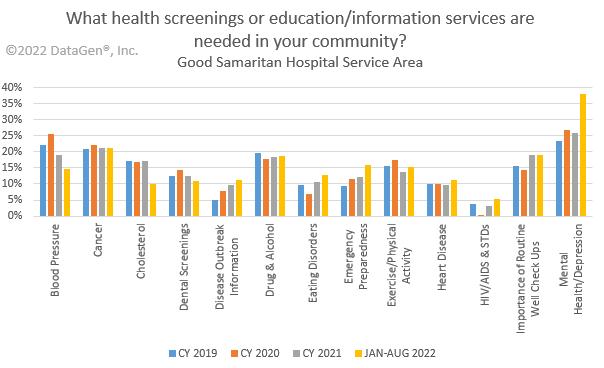
The above chart highlights the needs of community members in important health education services. Top needs include mental health, hypertension, cancer, substance use services, exercise and physical activity and chronic disease management.
SPARCS is a comprehensive all payer data reporting system established in 1979 as a result of cooperation between the health care industry and government. SPARCS currently collects patient level detail on patient characteristics, diagnoses and treatments, services, and charges for each hospital inpatient stay and outpatient (ambulatory surgery, emergency department, and outpatient services) visit; and each ambulatory surgery and outpatient services visit to a hospital extension clinic and diagnostic and treatment center licensed to provide ambulatory surgery services
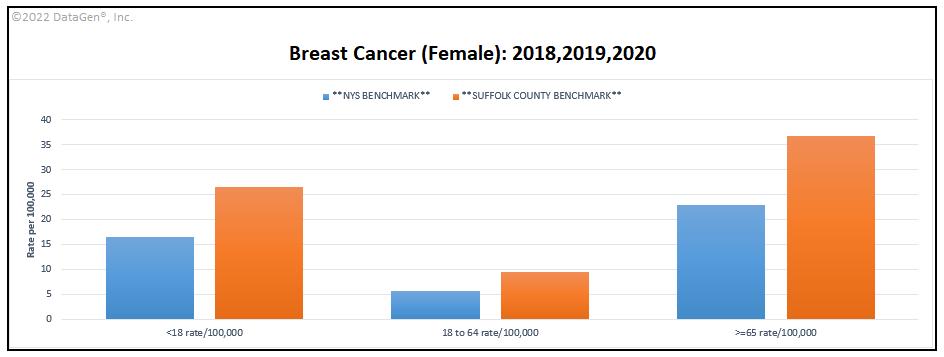
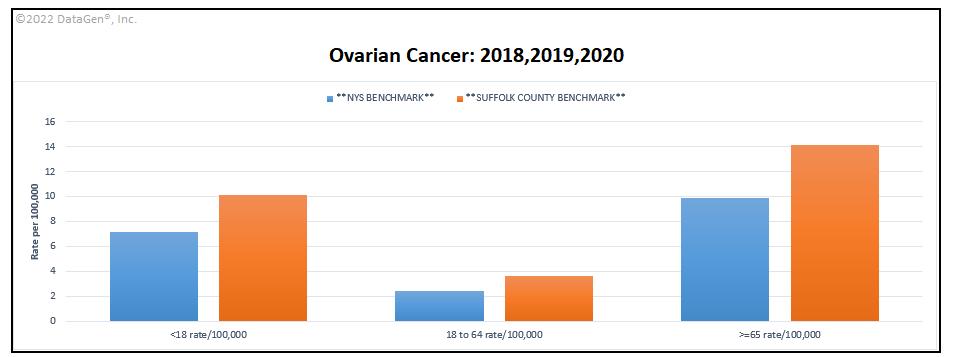
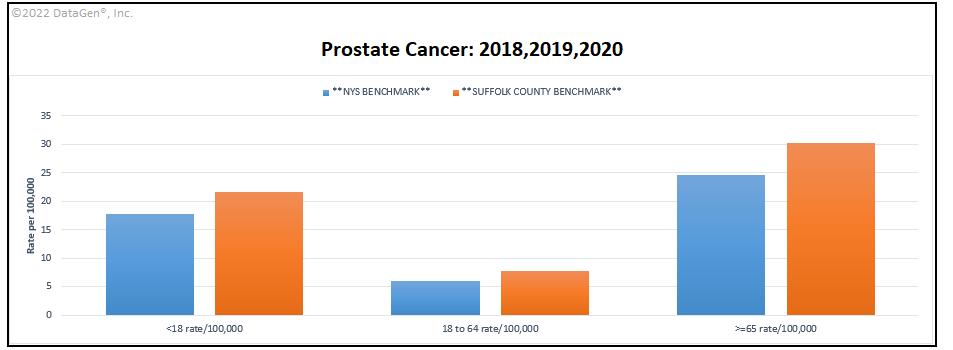
The above hospitalization data for Suffolk County examines types of cancer – breast, prostate and ovarian diagnosis and inpatient rate compared to New York State. Suffolk exceeds the state benchmark having higer rates of cancer inpatient admissions.
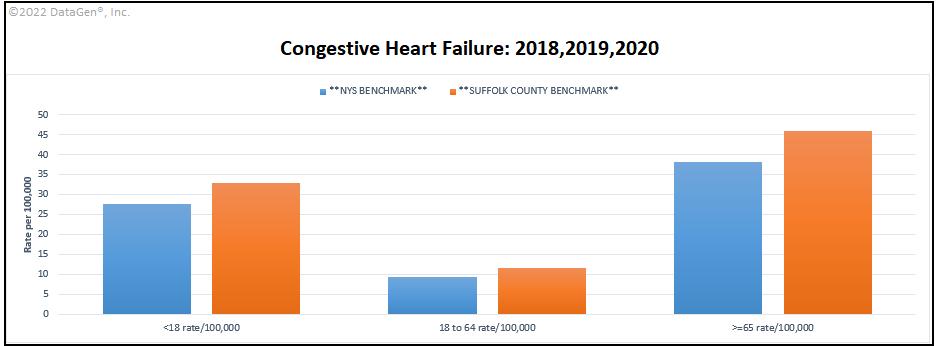
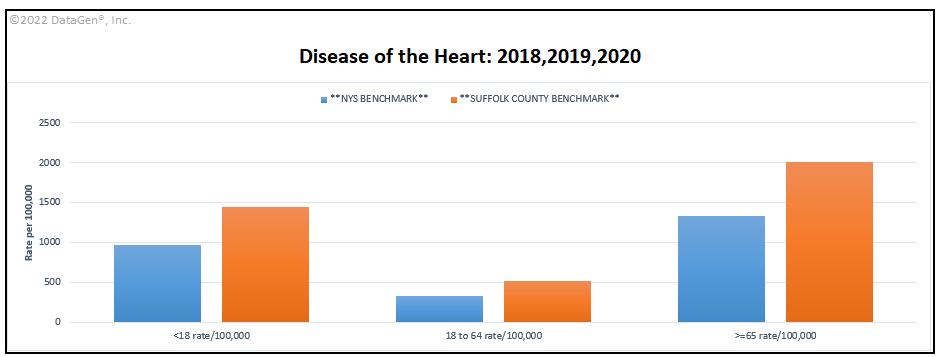
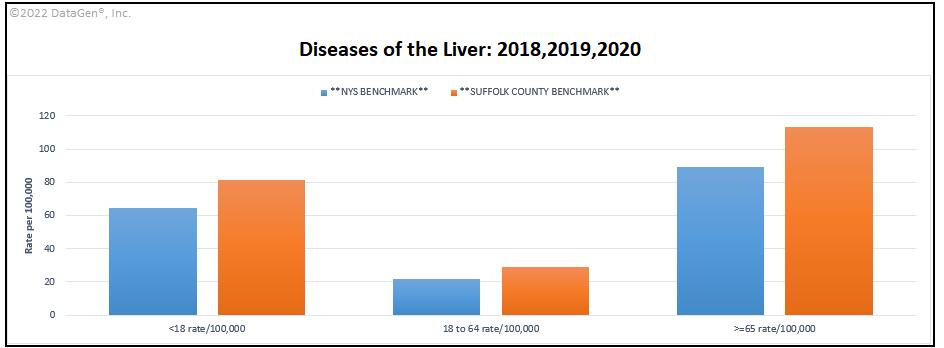
Factors that contribute to chronic disease and hospitization also demonstrate that Suffolk County exceeds New York State in congestive heart failure, diseases of the heart and liver diseases.
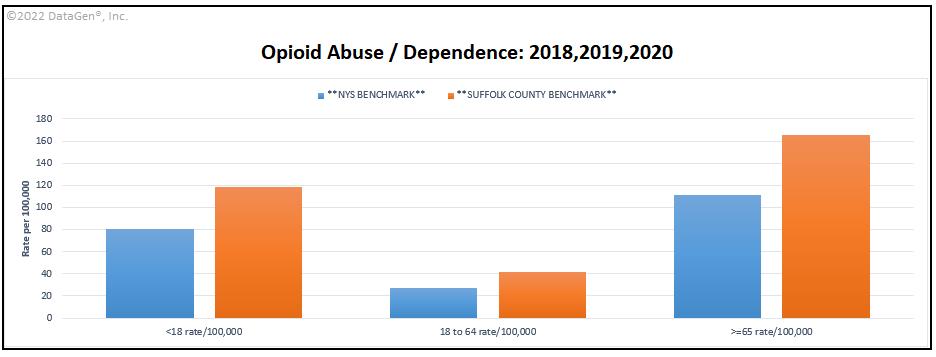
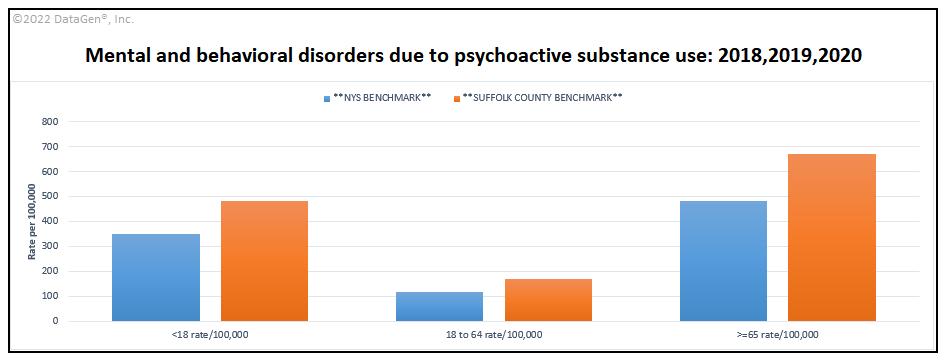
Primary and secondary data findings demonstrate a need for substance abuse and mental health services. The SPARCS data for Suffollk County 2018-2020 also shows high inpatient rates due to opioid abuse and mental health needs.

Examining Good Samaritan University Hospital emergency department data also highlights the need for community health services.
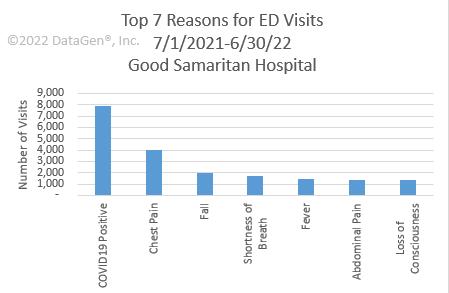
Emergency room data for Good Samaritan University Hospital shows over 90,927 visits from July 2021 to June 2022. Uninsured encounters account for 3,555 visits. Top ICD-10 diagnosis codes reveal the impact of COVID-19 on the community’s health, along with chronic diseases.
What are the biggest health problems for the people/community you serve?”
What would be most helpful to improve the health problems of the people/community you serve?
The results from these two questions reveal that CBO leaders are concerned about food access for their clients and mental health services. They also continue to see drug and alcohol abuse, mental health, and issues related to nutrition and weight loss as major health concerns for their clients.
The top three social determinant of health factors found via this analysis are education, healthcare system (in terms of access) and food. Kaiser Family Foundation Social Determinant of Health domains used as reference.35
35 https://www.kff.org/racial-equity-and-health-policy/issue-brief/beyond-health-care-the-role-of-social-determinants-inpromoting-health-and-health-equity/
Community and Social Context
Economic Stability
Education
Food Healthcare System


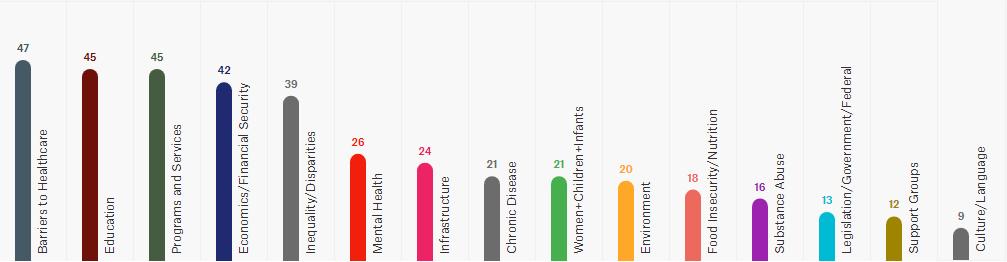
Health care access followed by education and programs/services were the top three codes that emerged from among the transcripts.
Library Research Project, Qualitative Analysis
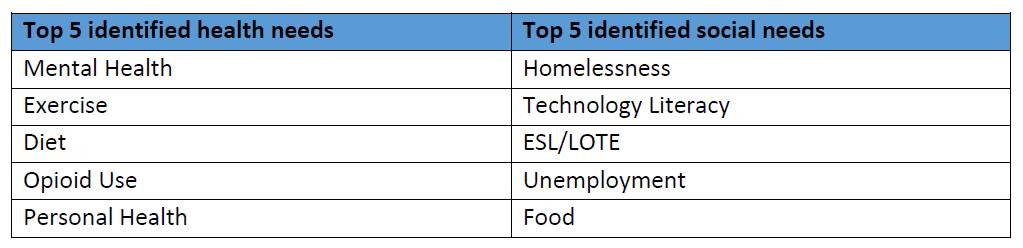
Library personnel at randomly selected public libraries throughout Suffolk County were interviewed for this study. Mental health is the top health need identified followed by exercise and diet, two lifestyle
behaviors that exert a tremendous influence on the incidence of all chronic diseases. Homelessness took the top spot among social needs, possibly because public libraries, especially in low-income, high-need communities, are a haven for the disenfranchised.
In addition to working directly with the Long Island Health Collaborative, Good Samaritan University Hospital has strong relationships with local and regional community-based organizations, libraries, schools, faith-based organizations, the local health department, local fire departments and municipalities that support and partner with us to reduce chronic disease, mental health and substance misuse, and to promote health equity. See page 9 for our extensive partner list of health care and other key institutions. A shortlist of available assets and resources includes:
22 hospitals
2 county health departments
110+ community-based and social service organizations
111 libraries
5 major academic institutions
2 health plans
2 school districts
Media partners
27 state parks
65 county parks
9 YMCAs
41 farmer’s’ markers
100 plus food pantries
20 Federally Qualified Health Centers
Each partner offers unique programming and interventions that align with the goals and objectives of Good Samaritan University Hospital. These assets and resources can be mobilized and employed to address the health issues identified. See the work plan in the appendix E for a detailed description of interventions and our partners with whom we are working.
In support of our Community Service Plan, during the past three years, Good Samaritan University Hospital partnered with community-based organizations in multiple communities to hold culturally relevant chronic disease management educational programs, vaccination clinics, support groups, health screenings, emotional wellbeing workshops, and lectures among other outreach activities. Due to the COVID-19 pandemic, many outreach activities traditionally held in the community were paused in March 2020 but resumed in the fall of 2021. With lessons learned, many successful virtual education events still continue.
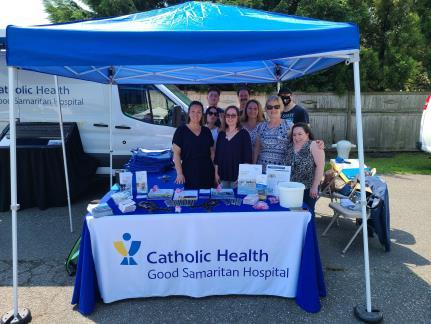
Mission moment highlights (Represents community outreach activities for years 2020, 2021, and through August 2022):
Screenings (Outreach Bus, Healthy Sundays Program, Other Locations): 198 individuals
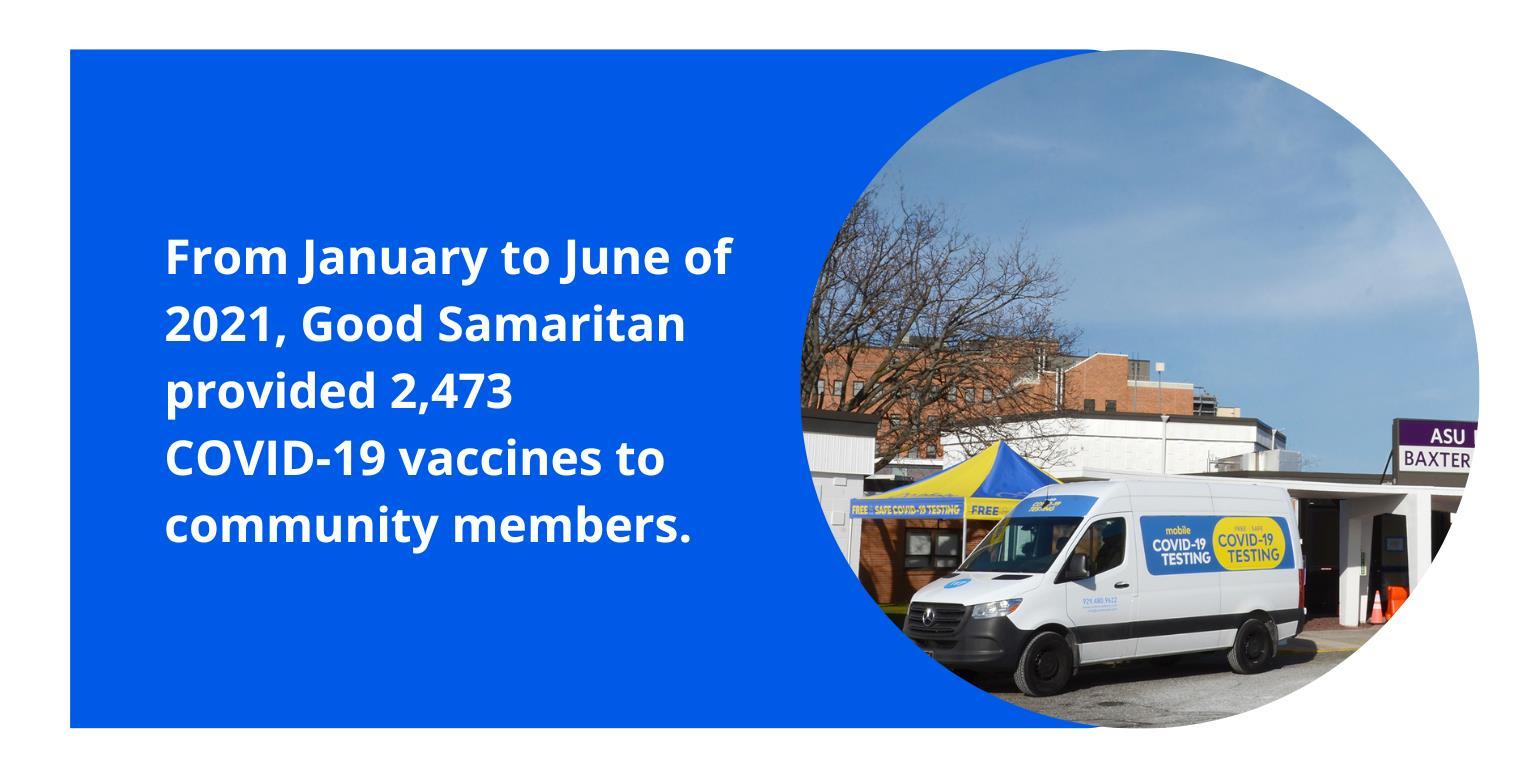
Vaccination Clinics and PODS: 2,473 administered
Community Lectures/Workshops: 38,544 views, 532 in-person attendees
Bariatric/Weight Management Support Group: 1,743 attendees
Trainings (CPR, Stop the Bleed, Narcan): 637 individuals trained
Support Groups (Condition Specific): 3,252 attendees
Blood Drives (Behavioral Health): 1,652 donors
Evidence-based interventions
Good Samaritan University Hospital remains committed to providing the community with evidencebased and promising practice programs that address chronic diseases and mental health/substance misuse. Additionally, as a faith-based provider, it has always been our mission to address the social needs of our patients and community members. Our interventions are broad and far reaching. Refer to our work plan for specific interventions, measures, partners, goals and objectives.
Work plan
See appendix E
This report is a comprehensive study of the health needs and barriers experienced by the community members served in this region. After extensive research and interaction with partners and the public, the following priorities were selected:
1. Prevent Chronic Disease
Focus Area 4: Chronic Disease Preventive Care and Management
2. Promote Well-Being and Prevent Mental and Substance Use Disorders
Focus Area 2: Mental and Substance Use Disorders Prevention
The public needs to understand the findings of this report and Catholic Health’s vision for meeting these priorities and closing the gap in health disparities.
This report is being made available to the public and will be posted on Catholic Health’s website.
This CHNA and resulting implementation plan meet the 501(c)(3)(r) federal requirements for conducting a CHNA and implementation plan. The regulations are part of the Affordable Care Act and became effective in 2015. The document also meets New York State guidelines for community health needs assessments and community involvement.
Catholic Health is pleased to provide this comprehensive report to community members and the wider public. It reaffirms each organization’s commitment to meeting the health needs of our communities and working every day to mitigate health disparities. Targeted interventions and strategies, driven by the data outlined in this report, reflect meaningful and reasonable approaches to improving the health of our communities during the next three-year cycle, 20222024. We will report on the status of these interventions and strategies throughout the implementation period.
Prevent Chronic Diseases Focus Area 1: Healthy eating and food security Goal 1.0 Reduce obesity and the risk of chronic disease 1.03: Educating and informing through classes. Distributing written information or utilizing obesity educational software.
Prevent Chronic Diseases Focus Area 4: Preventive care and management Goal 4.2 Increase early detection of cardiovascular disease, diabetes, prediabetes and obesity
Prevent Chronic Diseases Focus Area 4: Preventive care and management Goal 4.2 Increase early detection of cardiovascular disease, diabetes, prediabetes and obesity
4.2.1: Promote strategies that improve the detection of undiagnosed hypertension.
Health issues related to obesity affect all populations
Bariatric educational seminars are held onsite with GSH physicians and staff. The seminars are offered to pre- and postbariatric surgery patients
Uninsured and underserved communities and those without access to care. Free blood pressure screenings are provided at local public libraries, community lectures and mall health fair events with clinical support of GSUH.
4.2.2: Promote testing for prediabetes and risk for future diabetes in asymptomatic people in adults of any age with obesity and who are overweight. Partner: Westfield Mall
Prevent Chronic Diseases Focus Area 1: Healthy eating and food security Goal 1.0 Reduce obesity and the risk of chronic disease chronic disease 1.0.2: Quality nutrition (and physical activity) in early learning and child care settings. Partners: Bay Shore School District and Bay Shore Wellness Alliance.
Uninsured and underserved communities and those without access to care. BMI screenings are offered at 2 events at the Westfield South Shore Mall health fairs in Bay Shore.
# of seminars offered and total # of attendees. 24 seminars are held annually with an average of 25 attendees per session. Hospital Participant
# events and # of screenings. 400 free blood pressure screenings across all events Community-based organizations Participant
# of screenings provided. 55 individual screenings Business Mall to provide screening venue
Prevent Chronic Diseases Focus Area 4: Preventive care and management
Prevent Chronic Diseases Focus Area 1: Healthy eating and food security
Goal 4.1 Increase cancer screening rates 4.1.5: Remove structural barriers to screenings such as offering screening in non-clinical settings. Partners: Local churches, who host CH.
Goal 1.3 Increase food security
Prevent Chronic Diseases Focus Area 4: Preventive care and management
1.4: Decrease the percentage of adults ages 18 years and older with obesity (among all adults)
Goal 4.1 Increase cancer screening rates 4.1.2: Conduct one-on-one or group education (presentation or other interactive session to a church, home, senior center or other setting).
Uninsured and underserved communities and those without access to care.
Healthier Families is a free, 10-week educational series that promotes a healthy lifestyle. This offers collaboration with the identified underserved area in Bay Shore School District and the Bay Shore Wellness Alliance. Student activity sessions are held twice per week during the 10-week period, with parent involvement for the once weekly dietician piece of the program. # of families enrolled; pre- and postprogram survey results.
15 families enrolled in the Healthier Families Program
K-12 School Schools to disseminate program information to students and parents
Prevent Chronic Diseases Focus Area 4: Preventive care and management Goal 4.1 Increase cancer screening rates 4.1.2: Conduct one-on-one or group education (presentation or other interactive session to a church, home, senior center or other setting).
Prevent Chronic Diseases Focus Area 4: Preventive care and management
Goal 4.1 Increase cancer screening rates 4.1.2: Conduct one-to-one or group education (presentation or other interactive session in a church, home, senior center or other setting).
Partners: volunteer clinical staff
Uninsured and underserved communities and those without access to care.
Healthy Sundays: BP and BMI screenings, flu vaccinations, health education and referrals to follow up care.
Broader Community Food for Your Soul lecture and workshop will provide attendees with information on healthy eating choices and cooking demo
To promote healthier lifestyle to the broader community and provide education and information of highlighted topics
The 7th Theresa Patnode Santmann Heart and Soul Symposium, Healthy Living 24/7, will provide lectures on heart health, stroke and cancer updates. Each lecture will include a presentation on nutrition related to the main topic. The keynote presentation will be a cooking demo with a presentation on diabetes.
Broader community, uninsured and underserved communities and those without access to care. Lectures and Speakers Bureau presentations on the prevention of disease and injury, improve health and enhance quality of life. Women's Health at the Bristal Assisted Living in West Babylon: lecture topics - Stroke and Urology.
Broader community, uninsured and underserved communities and those without access to care.
Open Your Heart to Health at the Westfield South Shore Mall in underserved area of Bay Shore. Free program for community. Attendees talk to cardiologists, registered dietitians, cardiology technologists and nurses regarding cardiac health and disease prevention.
# of individuals screened, # BP screenings, # free flu vaccinations; # uninsured individuals referred for free follow up care.
# of attendees, # screenings, # referrals to followup care.
3-4 Healthy Sundays outreach events Faith Churches host the events
1 lecture
# of attendees at symposium. 1 symposium Hospital Participant
# of attendees at program and results of post-event survey.
2 events Senior Center Senior Center hosts the program
# of individuals educated; # of screenings; # of flu vaccinations provided.
300 individuals reached Business Mall hosts program
Prevent Chronic Diseases Focus Area 4: Preventive care and management
Prevent Chronic Diseases Focus Area 4: Preventive care and management
Goal 4.1 Increase cancer screening rates 4.1.2: Conduct one-to-one or group education (presentation or other interactive session to a church, home, senior center or other setting).
Goal 4.1 Increase cancer screening rates 4.1.2: Conduct one-to-one or group education (presentation or other interactive session to a church, home, senior center or other setting).
Partner: oncology physicians and staff
Underserved and uninsured men 50 years and over and men 40 and over at high risk.
Free Prostate Cancer Screenings, PSA blood test a # of men screened and # referred for further testing.
Broader community and those without access to care.
Oral, head and neck Cancer (OHNC) screenings. # of screenings provided and # referred for followup care.
2 event Community-based organizations CBO provides venue for screenings
1 screening event Hospital Hospital provides staff for screenings
Planning Report Liaison Justin Jaycon
E-mail: justin.jaycon@chsli.org
Priority Focus Area (select one from drop down list)
Prevent Chronic Diseases Focus Area 3: Tobacco prevention
Prevent Chronic Diseases
Focus Area 2: Physical activity
Goal Focus Area (select one from drop down list) Objectives through 2024 Disparities Interventions
Goal 3.1 Prevent initiation of tobacco use 3.2.3: Use health communications to encourage use of evidence-based quitting, increasing awareness of available cessation benefits (especially Medicaid), and removing barriers to treatment. Partner: Suffolk County Department of Health.
Goal 2.1 Improve community environments that support active transportation and recreational physical activity for people of all ages and abilities.
1.7: Increase the percentage of adults 18 years and older who participate in leisure-time physical activity (among all adults)
Prevent Chronic Diseases Focus Area 4: Preventive care and management Goal 4.3 Promote evidence-based care to prevent and manage chronic diseases including asthma, arthritis, cardiovascular disease, diabetes and prediabetes and obesity
4.3.11 Increase the percentage of adults with HTN who are currently taking medicine to manage their high blood pressure and 4.3.12
Increase the percentage of aduith arthirits who have been told be their doctor or health professional to be physically active/exercise to help with arthritis or joint symptoms by 5%
Broader community, uninsured and underserved communities and those without access to care. In conjunction with the Suffolk County Department of Health, host a Learn to Be Tobacco Free 6-week smoking cessation program
Family of Measures
# of participants, # of participants who quit smoking and quit rate.
By December 2023, we will have completed .
Implementation Partner (Please select one partner from the dropdown list per row) Partner Role(s) and Resources
2 programs offered Local health department Program offered in conjunction with DOH
Low-income. Communities of color Walk Safe with a Doc Process measures: Number of attendees; Intermediate measures: Knowledge gained via pre/post survey; Outcome measures: change in % population walking
Low-income communities of color Talk with a Doc Process Measures: Number of talk events, number of attendees. Intermediate measures: Knowledge gained pre and post survey. Outcome measures: reduced blood pressure, reduced joint pain, more people walking for exercise
10 Walk Safe with a Doc events held and analyzed all pre/post data
Community-based organizations Pedestrian safety expertise
10 number of talk events held and analyzed all pre/post event data
Hospitals Physician expertise
Promote Well-Being and Prevent Mental and Substance Use Disorders
Focus Area 1: Promote Well-Being Goal 1.2 Facilitate supportive environments that promote respect and dignity for people of all ages
Ensure communities have access to resources about mental health, well-being, and substance abuse services available at CH, its partners and other resources in the community. Partner: local churches and community benefit organizations also serve as distribution points for this resource.
Well-being affects persons in all socioeconomic categories.
Distribute CH's Mental Health Substance Use Disorder Services Guide to CH community partners at all outreach events, including hospital health fairs and Healthy Sundays events. Make the guide available as a download from the CH website.
# of events where the Mental Health and Substance Use Disorder Services Guide is offered.
50 points of distribution Community-based organizations CBOs serve as distribution points
Promote Well-Being and Prevent Mental and Substance Use Disorders
Focus Area 1: Promote Well-Being Goal 1.1: Strengthen opportunities to build well-being and resilience across the lifespan
1.1.5: Enable resilience for people living with chronic illness: Support Groups for those living with chronic illness.
Well-being affects persons in all socioeconomic categories.
Bariatric Support Group information and support for patients pre- and post-surgery. Bi-monthly and and evening meetings will be offered.
# of participants
An average of 30-35 people attend the evening meetings; 10-20 people attend the day time meetings
The group will continue as dicatated by community needs. Hospital Participant
Promote Well-Being and Prevent Mental and Substance Use Disorders
Focus Area 1: Promote Well-Being Goal 1.1: Strengthen opportunities to build well-being and resilience across the lifespan
1.1.5: Enable resilience for people living with chronic illness: Support Groups for those living with chronic illness.
Well-being affects persons in all socioeconomic categories.
Life Goes On Cancer Support Group provided weekly for all diagnosis of cancer.
# of participants. On an average 12 people attend this afternoon meeting. The group will continue as dicatated by community needs. Consumer Patient
Promote Well-Being and Prevent Mental and Substance Use Disorders
Focus Area 1: Promote Well-Being Goal 1.1: Strengthen opportunities to build well-being and resilience across the lifespan
1.1.5: Enable resilience for people living with chronic illness: Support Groups for those living with chronic illness.
Well-being affects persons in all socioeconomic categories.
Breast Cancer Support Group for women diagnosed with breast cancer meets bimonthly.
# of participants. An average of 15 ladies attend this evening meeting. The group will continue as dicatated by community needs. Consumer
Promote Well-Being and Prevent Mental and Substance Use Disorders
Focus Area 2: Prevent Mental and Substance User Disorders
Goal 2.2 Prevent opioid overdose deaths
2.2.5: Establish additional permanent safe disposal sites for prescription drugs and organized take-back days
Broader community Drug Take Back Day # of controlled prescription drug units collected 1 Drug Take Back Day event Law Enforcement Law enforcement to collect and dispose of the drug units
Promote Well-Being and Prevent Mental and Substance Use Disorders
Focus Area 1: Promote Well-Being Goal 1.2 Facilitate supportive environments that promote respect and dignity for people of all ages
1.2.3: Policy and program interventions that promote inclusion, integration and competence
Broader community Efforts by Patient and Family Advisory Committee (PFAC), playing a critical role in patient and family engagement and patient- and family-centered approaches to improve quality and safety. Patient and family advisors are valuable partners in efforts to reduce medical errors and improve the safety and quality of health care.
# of community members on committee and # of meetings per year. 2-3 group meetings. Six community members serve on the hospital PFAC committee. Community-based organizations CBO provides patient and family advisors
Provide services to 50 individuals
Promote Well-Being and Prevent Mental and Substance Use Disorders
Focus Area 2: Prevent Mental and Substance User Disorders
Goal 2.2 Prevent opioid overdose deaths 2.2.4: Build support systems to care for opioid users or those at risk of an overdose.
Anyone at risk for opioid overdose Sherpa Program, a free service provided by Family & Childrens Association. Sherpa comprises recovery coaches trained to meet with overdose survivors and their families in the Emergency Department. The team directs people to treatment, offers encouragement and follow-up.
# of individuals at-risk of an overdose who received services through the SHERPA program.
Promote Well-Being and Prevent Mental and Substance Use Disorders
Focus Area 2: Prevent Mental and Substance User Disorders
Goal 2.2 Prevent opioid overdose deaths Participant in the Town of Islip Opioid Task Force. Broader community Participants promote awareness of mental wellness and the risk of substance abuse disorders and support community programs that decrease number of drug overdoses in the community.
# of regularly scheduled monthly meetings called by the partners in which GSH participated.
Good Sam staff will continue to articipte in the Town of Islip Opioid Task Force.
Community-based organizations Partner: Family & Children’s Association (FCA) provide volunteers who serve as peer recovery coaches for the SHERPA program.
Law Enforcement Partner: The Town of Islip
of all
members that speak to the
by
of mental
substance use disorders. Posts in LIHC weekly communications newsletter, social media postings, cross promotion of member events, programs on all media platforms. Promontion on CFN and CH social media, website, and community-targeted publications.
Outcome Measures. Prevention Agenda Indicator (59) Percentage of adolescents (youth aged 12-17 years) reporting non-medical use of pain relievers in the past year; (60) Age-adjusted percentage of adults with poor mental health for 14 or more days in the last month Process Measures. Number of SUD/mental health-related programs, events included in LIHC weekly email communication; number of SUD/mental-health related posts on LIHC social media platforms.
Decrease in Prevention Agenda indicators Other (please describe partner and role(s) in column D) Collaborative participants and media
Promote a Healthy and Safe Environment Focus Area 1: Injuries, Violence and Occupational Health Goal 1.1: Reduce falls among vulnerable populations 1.1.1: Connect older adults and people with disabilities with evidence-based falls prevention programs such as Stepping On or A Matter of Balance.
Vulnerable senior population. Offer fall prevention program designed to heighten awareness, reduce fall risks and build confidence in older adults.
# of programs offered and # of attendees completing the program. Offer 5 fall prevention programs Community-based organizations Participant
Promote Healthy Women, Infants and Children Focus Area 2: Perinatal and Infant Health 2.2.1: Increase access to professional support, peer support, and formal education to change behavior and outcomes. Support nursing mothers, encourage breastfeeding and increase breastfeeding rates for new mothers.
Breastfeeding support and education affects all populations.
Promote Healthy Women, Infants and Children Focus Area 2: Perinatal and Infant Health Goal 2.2: Increase breastfeeding Breastfeeding Café Ongoing meetings to promote health benefits and peer support to nursing mothers
Participate in the Global Big Latch On during World Breastfeeding Week (August).
Promote and support breastfeeding families.
# of attendees 1 Global Big Latch On event Local governmental unit Partner: Suffolk County Executive's office
The Good Samaritan Breastfeeding Café is available weekly to promote health benefits of breastfeeding and provide peer support to nursing mothers.
# of attendees at weekly meetings
8-12 mothers attend weekly Participant Breastfeeding mothers to participate