3 minute read
Appendix A: General and Local Data


National Mental Health Data:
Mental Health Facts
1 in 5 children ages 13-18 have or will have a serious mental illness
20% of youth 13-18 live with a mental health condition
11% of youth have a mood disorder
10% of youth have a behavior or conduct disorder
8% of youth have an anxiety disorder
Suicide Impact
Suicide is the 3rd leading cause of death in youth ages 10-24, 90% of those who died by suicide had an underlying mental illness
50% of all lifetime cases of mental illness begin by age 14 and 75% by age 24
37% of students with a mental health condition age 14 and older drop out of school; the highest dropout rate of any disability group
70% of youth in state and local juvenile justice systems have a mental illness
Palm Beach County Data by Individuals, Relationships, and Community (Related to ACEs):
INDIVIDUAL DATA: (*Data from Birth to 22 Data Deck unless otherwise noted)
Total Births: 15,043
(Children’s Services Council of Palm Beach County via department of Health and Vital Statistics)
0-5 Population: 87,211 (2017 5-year estimate)
Data Source: US Census Bureau, 2013-2017 American Community Survey 5 Year Estimate (B17020)
Population under 3: 646,379
Percentage of children less than 18 years old who are infants and toddlers (under 3) : 15% (under 18 years is 4,010,846)
Low Birth Weight – 8.5% (2017)
Preterm – 94% (2017)
Mothers receiving prenatal care 748% (1st), 168% (2nd), 63% (3rd), (22%) No prenatal care
Data Source: Florida CHARTS; DOH 2017
Special Needs: 10,854 unduplicated children receiving ASQ3, 15% concern/risk for delay, 1,640 eligible IEP
Drug withdrawal syndrome in newborns: 147 (15,043 Number of births)
Healthy Beginnings System referrals: 12,163 (CSC FY15-16)
Children feeling hopeless: 226% (556% for LGB)
Students attempting suicide: 83%
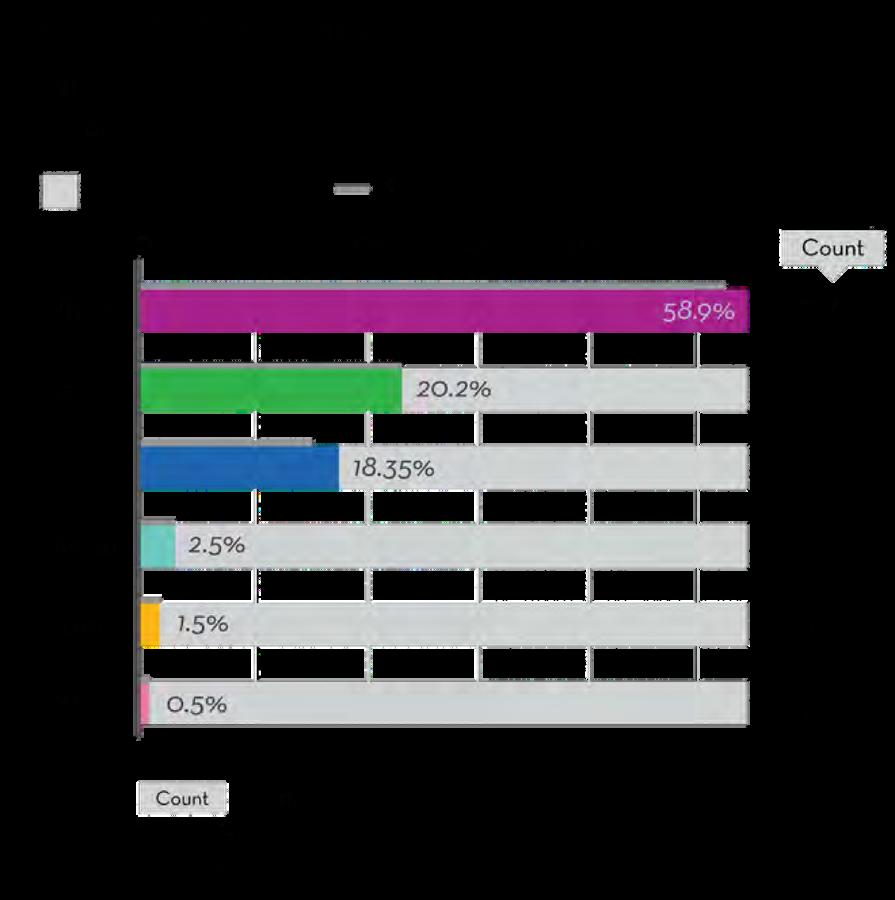
Race and Ethnicity
Percentage of the Total Population
Scope:
Population of Florida and Palm Beach County
PARENTAL/ RELATIONSHIP: (*Data from Children's Services Council of PBC unless otherwise noted)
Mothers receiving prenatal care: 1st trimester: 759%, 2nd Trimester: 168%, 3rd Trimester 61%
Mental Health:
Healthy Start risk screen data –a state risk screen offered to all pregnant moms Questions 6, 7, and 8 all have to do with mental health, but they are asking the mother in the last month, while ACEs focus on the childhood experiences of the mother
The questions:
6)In the last month, have you felt down,depressed or hopeless?
7)In the last month, have you felt alone when facing problems?
8)In the last month, have you ever received mental health services or counseling?
9)In the last month, has someone you know tried to hurt you or threaten you?
In 2017, there were 12,500 Prenatal Risk Screens recorded and of that number 3,148 (252%) answered “Yes” to at least one of those questions.
Breaking down those 3,148 further, 2,091 (664%) answered “Yes” to one of those questions; 763 (242%) answered “Yes” to two of the questions, and 255 (81%) answered “Yes " to three questions and 39 (12%) answered “Yes” to all four questions.

Data Source: Healthy Start Prenatal Risk Screens entered into CSC’s Healthy Beginnings Data System (HBDS)
FAMILY VIOLENCE AND HOUSEHOLD DYSFUNCTION:
Child Maltreatment (verified 0-5): 4,248 (2014-2018), 456% under 5, 829% under 13 Period: 2018
Data Source: Children in Investigations by Most Serious Finding, Florida Department of Child and Families
Dashboard
Parental substance abuse (substance misuse alcohol, illicit drugs, prescription drugs) 229% Period: calendar year
2018
Data Source: Alleged Maltreatments, Florida Department of Child and Families Dashboard FamilyViolence(intimate partner violence or house hold violence threatens child): 21.9%. Period:2018.
DataSource:AllegedMaltreatments,FloridaDepartmentofChildandFamiliesDashboard Divorce: 4,684 (Florida Public Health 2017)
Paternity:
Community Environmental: (*Data from Birth to 22 Palm Beach County unless otherwise noted)
Children 0-5 in poverty: 251%
Children homeless: 4,321
Children in subsidized childcare: 21, 805 (Birth -12), 11,115 (Birth-5), (FY2014-FY2016
Children ready for school: 90% (down 2%)
Student Reading Proficiency 3rd Grade: 54%
Children Being Bullied: 25.5%
Circuit 15 Juvenile Arrests: 3,479 (Fy16-17) ages 9-23
Baker Acts: 15th Judicial Circuit 9,290 Involuntary Examinations and 1736% of total are children under 18 (from Baker Act Annual Report)
CareerReady-Achieving Degrees from Post secondary Institutions: Associates-17% ,Bachelors 38%, Masters 1%
Idleness (No school or work): 39% (16-19years 63,245)
Unemployment: 82 (1,156,597) ages 16-24
Appendix B: Graphs and Charts
2015 Child Population by Age Group, Poverty Level, and Geographic Area

Percentage of Palm Beach County Children Living in Poverty (by Race)
Source: US Census Bureau, 2011-2015 American Community Survey 5 year estimate (B17020A-I) Children includes individuals from birth to 17 (under 18)

Parental Substance Concerns in Palm Beach County

P a s t / C u r r e n t S u b s t a n c e A b u s e ( P e r c e n t a g e To t a l ) i n Y o u t h a n d Th e i r F a m i l i e s ( F Y
2017 Palm Beach County Areas with High Food Insecurity and Area Pantries

Food Insecurity: https://www.feedingamerica.org/sites/default/ les/research/map-the-meal-gap/2016/child/FL_AllCounties_CDs_CFI_2016.pdf2018
2016 Palm Beach County Population by Race

Percentage of Children Entering Kindergarten Ready to Learn in Zip Code Areas Performing Below the County Rate (FY 2016 & 2017)

Based on Work Sampling System
Source: School District of Palm Beach County, Department of Research Evaluation & State Assessment Special Request: 2017
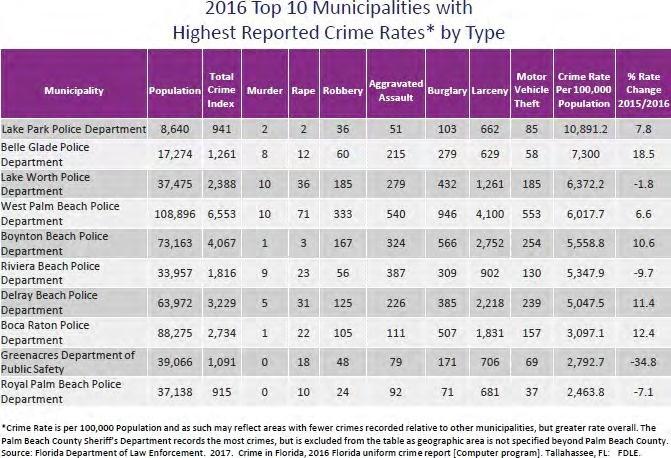
2016 Top 10 Municipalities with Highest Reported Crime Rates* by Type