
5 minute read
Out and About


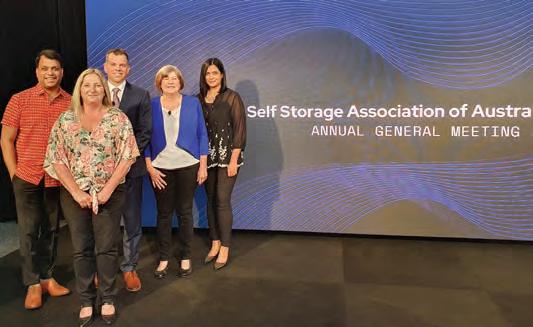
SSAA 2020 AGM – 26 NOVEMBER RICHMOND, MELBOURNE
The SSAA AGM was a little bit different this year. Members of the Board presented to attendees online and in-person down stairs. Attendees in person viewed the presentation from a comfortable setting at the premises and were joined later by the Board members for a networking function. Other SSAA Members logged in and viewed the presentation remotely. All in all it was a very successful evening with everyone in Melbourne very happy to be face to face again.
Advertisement
Brent Hayes Store – More Self Storage, Susan Phillips, Shay McQuade – USC.

SSAA AGM 2020 Attendees. Ned Coten – Sunshine Self Storage, Craig Salter – Action OHS and Martin Fallon – Fallon Valuers.


SSAA AGM Attendees watching the live presentation. SSAA 2020 AGM Virtual meeting set up.

SSAA Team. Sam Kennard – Kennards Self Storage, Ivor Morgan – SSAA Chairman, Linda Sharkey – Cushman & Wakefield.

STATE OF THE INDUSTRY 2020
MARKET HIGHLIGHTS: SUPPLY SIDE
The Market section of State of the Industry 2020 explores the self storage market, examining trends in demand and supply across the industry.
Aconsiderable amount of supply has entered the market in recent years, with a solid pipeline of development and expansion activity set to see this growth continue into 2021 and beyond.
Self storage as an asset class remains an attractive investment opportunity, particularly when compared to other real estate offerings. The sector continues to generate investment interest from both institutional and private investors, as interest grows in alternative asset classes and returns compare favourably to traditional real estate offerings (despite some recent softer operating conditions).
Interest from new entrants, existing developers and storage operators is evident across all major self storage markets. There are strong correlations between new developments and forecast population growth clusters which, if growth continues, should help absorb new supply and limit impacts on existing facilities over time.
NEW SUPPLY
Looking at the supply data from 2018 and forecasting known development activity out to 2022 and beyond, the extent of proposed new supply becomes increasingly evident.
A review of supply trends across Australian east coast capital cities illustrates the increase in supply, with the rate of increase in new facilities having doubled since 2018. In 2018, the east coast market was growing by 1.5% with new supply, whereas the 2020 rate of growth is 2.7%. This rate is forecast
30
NO. OF FACILITIES
25
20
15
10
5
0 NEW SUPPLY TRENDS
2018 2019 2020 Pipeline 2021 Pipeline 2022+ Pipeline Total Pipeline
Sydney Melbourne Brisbane Auckland Adelaide Perth
620 EAST COAST CITIES – NEW SUPPLY (BY NO. OF FACILITIES)
600
540 560 580NO. OF FACILITIES%&''()$*+,$%'+,-$ @4)*)"+*)"&0*$%:"#$**)-+0'$%&",)07))%"%)7"()8)-$2.)%0&"+%("1$*)#+&0"2$2/-+0'$%":*$704"#-/&0)*& >"" @4)"1/--"?0+0)"$1"04)"C%(/&0*3";<;<"*)2$*0"#$%0+'%&"1$*)#+&0"2$2/-+0'$%":*$704"4)+0".+2&" $8)*-+'("7'04" 04)"-$#+0'$%"$1"2*$2$&)("&)-1"&0$*+:)"1+#'-'0') &>"N4'-&0"04)&)"2$2/-+0'$%":*$704"1$*)#+&0&"7)*)" 1$*./-+0)("2*'$*"0$"QPRCSM=T6"04)"'.2+#0&"+*)")92)#0)("0$",)"1)-0"'%"04)"&4$*0M. )('/."0)*.":'8)%"04)" *)(/#)("-)8)-&"$1".':*+0'$%"0$"!/&0*+-'+>""
520 @4)".+2&":)%)*+--3"().$%&0*+0)"04)"#$**)-+0'$%",)07))%"()8)-$2.)%0"+#0'8'03"+%("1$*)#+&0"2$2/-+0'$%" 500:*$704>"U*'&,+%)"'&"04)"$%-3")9#)20'$%6"74)*)"1+#'-'0')&"+*)":)%)*+--3"#-/&0)*)("'%"04)"&$/04")+&0)*%" &/,/*,&"74)*)"04)*)"'&"%$")8'()%0"2$2/-+0'$%":*$704"0*)%(>"" 480C%"04)"?3(%)3".+*5)0"%)7"2*$2$&)("1+#'-'0')&"+*)":)%)*+--3"#-/&0)*)("'%"04)"V$*04"N)&0"W*$704" #$**' 2018 2019($*"+%("X$.),/&4YE'(#$.,)"+*)+&> " 2020 2021 2022+
Existing Proposed
to reach 3.6% in 2021 and could surpass 4.0% in 2022 if all planned developments proceed. In addition, storage supply is also increasing across markets as established facilities expand and build-out project stages. Whilst the sector continues to generate investment interest and new supply continues to be built out, the equilibrium between demand and supply may tend towards oversupply in some localised areas. Operating performance in these areas is likely to remain constrained until growth in demand or a change in market fundamentals restores the balance.
SUPPLY HOT SPOTS
There are strong correlations between new developments and forecast population growth clusters.
The full State of the Industry 2020 report contains forecast population growth heat maps overlaid with the location of proposed self storage facilities. Whilst these population growth forecasts were formulated prior to COVID-19, the impacts are expected to be felt in the short-medium term given the reduced levels of migration to Australia.
The maps generally demonstrate the correlation between development activity and forecast population growth. Brisbane is the only exception, where facilities are generally clustered in the south eastern suburbs where there is no evident population growth trend.
In the Sydney market new proposed facilities are generally clustered in the North West Growth corridor and Homebush/Lidcombe areas.
20 18 16 14 12 10 8 6 4 2 0 PROPOSED FACILITIES (BY STAGE)
Brisbane Sydney Canberra Melbourne Adelaide Hobart Perth Auckland
DA Preparation DA Submitted DA Approved

In the Melbourne market, new proposed facilities are generally more spread out and concentrated to the north and west, with no significant supply clusters.
Proposed Facility
DEVELOPMENT ACTIVITY
New developments have primarily been driven by existing operators looking to expand their existing portfolios and turn-key developers who are selling facilities on completion to existing operators.
New self storage development under construction is primarily being undertaken in the population growth centres of Sydney, Melbourne and Auckland.
Sydney has the largest amount of new self storage developments with seven new facilities under construction. Once complete these new facilities will add approximately 3,730 new units to the Sydney market. Auckland currently has four facilities under construction, adding approximately 3,200 units to that market. Melbourne also currently has four facilities under construction, adding approximately 1,850 units to that market.

SPOTLIGHT: INDUSTRY CONSOLIDATION – INNER MELBOURNE EXAMPLE
The self storage industry has, for many years, been considered highly fragmented when compared to other forms of real estate asset classes. A trend of industry consolidation has been occurring across the market, with top tier (institutional type) investors and strong second tier investors expanding their portfolios via acquisition and new development. Patterns in facility acquisitions show a clear focus on consolidating operations in key self storage markets – generating operating efficiencies, economies of scale and increased marketing impacts.
SPOTLIGHT: INNER MELBOURNE
An example of the impacts of industry consolidation can been seen in Melbourne’s south-east, where National Storage REIT has acquired eight operating self storage facilities within a 15-kilometre radius over the past five years, representing 12% of market share. Fellow Brisbane-based investor group StoreInvest has acquired three operating facilities, while local owner-operator Wilson Storage has significantly increased its portfolio in the same area, growing from 2% to 14% market share.
The result in this example is less fragmentation with ‘other’ or nonmajor owners in this particular market reducing from 67% of market share to 47% of market share. Interestingly, total supply increased by approximately 53% over this period.
The next State of the Industry 2020 feature will explore consumer profiles, purchasing behaviour and perspectives.
State of the Industry 2020 highlights changing fundamentals in an industry full of opportunity. l
To read the full report and discover insights and opportunities for your business, login to your SSAA member portal.
WITH THANKS TO OUR GENEROUS INDUSTRY PARTNERS:


