8 minute read
A Tale of Two Streets


A TALE OF TWO STREETS
U20013
Advertisement
The exercise ‘Mapping and Data Representation’ required us to make maps that would convey information that isn’t available on Google Maps. It encouraged me to think about my own experiences of the neighbourhood and all aspects that only someone who has lived here for some time would notice. I chose to highlight the contrast in vehicular and pedestrian traffic on two busy roads in my neighbourhood of Kothrud, Pune.
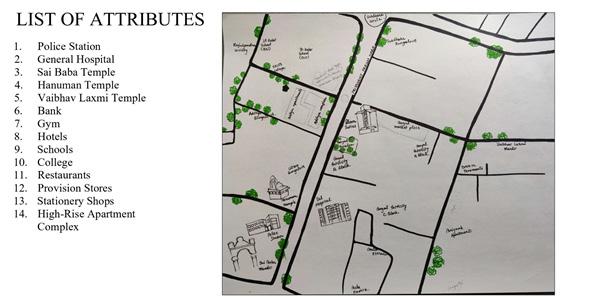
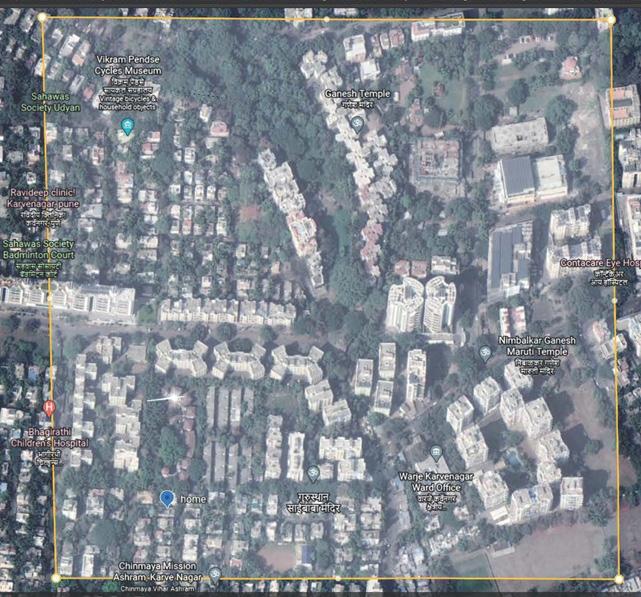
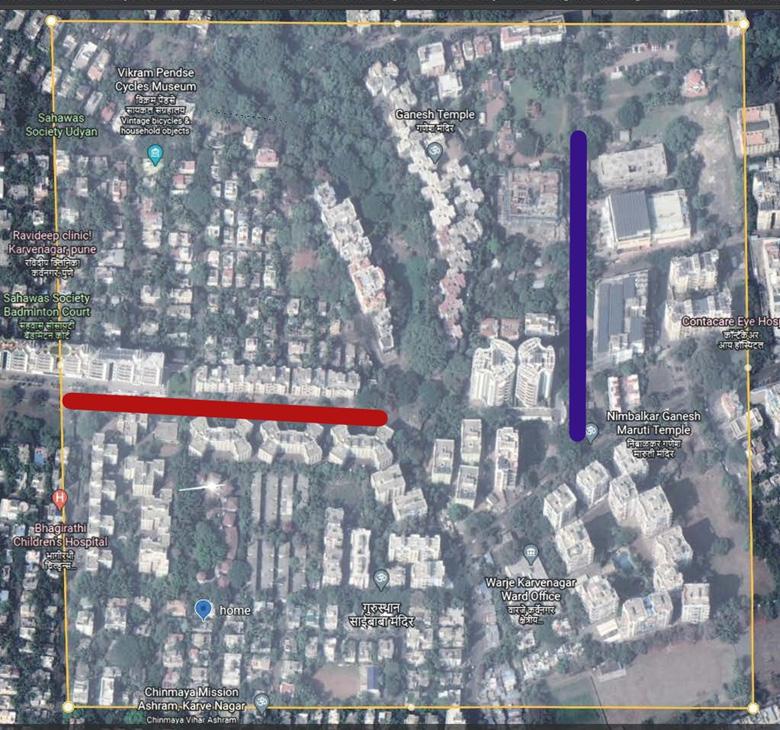
Identification of Area: The first step in creating the map was to select an area in my neighbourhood that had several attributes like temples, walkways, etc. which could be studied further. After going over a large area, and including and removing several parts multiple times, I finally selected a 600m x 600m square area for mapping (Fig. 1). Preliminary Observations of the Area + Identification of Thematic Focus: As the Covid-19 situation in my area was very bad, I mostly had to work based on my memories of the neighbourhood. Having lived here all my life, this was fairly easy. First, I identified and listed down all the major attributes of my neighbourhood. These attributes included1. Presence of Banks and ATMs 2. Many Cafes 3. Three gyms 4. Open Grounds 5. Movie Theater 6. Lots of trees 7. Temples 8. Regional Government office 9. Badminton Court 10. Small shops – Clothing stores, Grocery stores, Hardware shop, Oil shop, Motor repair shop, Electronics shop, Medical Store, Incense shop, Tailoring shop, Jewellery shop, salon, Courier shop, etc. 11. Business Bay
12. Mixture of residential, mixed-use and commercial buildings 13. Big Bazaar 14. Croma 15. Roadside Parking (P1, P2) 16. Footpaths 17. Canopy benches 18. Street Vendors – Jewellery stall, used books stall, tea stall 19. High-rise luxury condos
After discussing with my tutors, I decided to focus on two main roads (Fig. 2) in my area and highlight the differences between them using zoomed-in illustrations of different sections of the street. What interested me most about these roads was that despite having almost the same dimensions, there was a stark contrast in the vehicular and pedestrian traffic on the two roads.
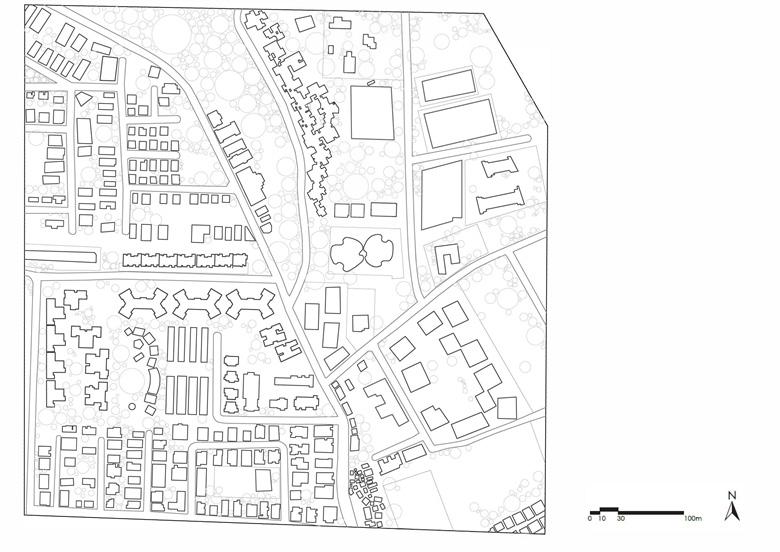
Preparing a Basemap: Next, I prepared an accurate basemap by tracing over the elements either digitally or hand-drafting with tools. A basemap is the background layer with only essential geographic information on which further layers of data are added. It is the core of the map. I chose to make my basemap digitally in Autocad.
Lineweights were of utmost importance while preparing the basemap. Different line weights were used for different types of buildings, trees and roads. This ensured enhanced readability of the map. I used five different line weights, one each for roads, residential spaces, commercial spaces, mixed-use buildings and trees. The trees are circles having lighter lineweight and reduced opacity. As we can see in Fig. 3, the roads have a slightly heavier lineweight, but they’re still not as prominent as the buildings, which have the heaviest lineweight.
A “scale” is a must while making any map. The scale for my basemap was 1:1000, as can be seen in the graphical scale at the bottom right corner in Fig. 3.
Figure 2: The Roads in Focus Note. The roads that I chose to study are highlighted in red and blue. Adapted from Google Earth. Copyright by Google Earth. Figure 3: Basemap Note. The upper right corner has been cut off as there was no relevant information. Notice the graphical scale and North direction symbol in the bottom right corner of the map. Copyright 2021 by Anandita Onkar.
Figure 1: The Selected Area Note. My house is at the bottom left corner of the square. Adapted from Google Earth. Copyright by Google Earth.
Collecting data: Most of the data used in the maps was from memory. I studied the buildings on these two streets, whether they were residential or commercial, the parking spaces, roads that the two streets led to, and many other aspects which could affect vehicular and pedestrian traffic. I made quick sketches of sections of the two roads to represent the various aspects I was going to be looking at in the final map.
Fig. 4 shows a quick sketch of the first road in focus. While making this sketch, I explored the key aspects of this road - the presence of mixed-use buildings on both sides of the road, an abundance of parking space, many cafes and restaurants with tables put between the road and the buildings and the road’s connectivity to main roads from both sides. These were the factors that could affect the traffic on the road. Fig. 5 shows an exploration of the second road in focus, similar to that as in Fig. 4. This was a fairly commercial street, so it had a few additional attributes like street vendors and dedicated parking for each building in the basement.
It was very interesting to study the differences and similarities between these two roads as I noticed many details about them that I had overlooked all my life. I used my own experiences and those of my family and friends to prepare a database for my final map.
Samples for Data Representation: Our tutors advised us to go through maps on the internet and see various data representation methods. I tried out a few different methods like using 2D icons throughout the maps to represent different activities and 3D isometric representation of the roads, that could represent all the necessary and relevant information and narrowed it down to two possible methods. This process included a lot of trial-and-error to find the one method that could have the most impact,
Figure 4: Quick Look at Road 1 Note. The sketch shows a quick representation of the road. It highlights the major activities seen along this road and the notes at the right talk about the possible reasons for the type of traffic seen here. A small legend has been made just below the road section. Copyright 2021 by Anandita Onkar.
Figure 5: Quick Look at Road 2 Note. This quick sketch shows a section of the second road. Notes, similar to the ones in Fig 4, have been made here too. There is a legend at the bottom of the sketch. Copyright 2021 by Anandita Onkar.50
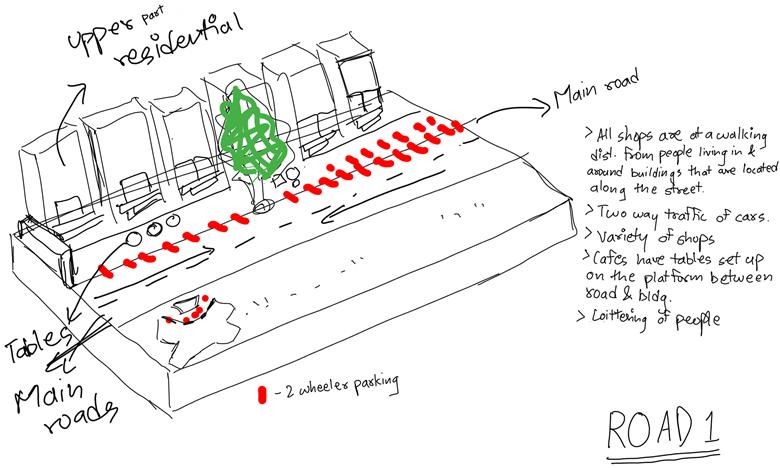
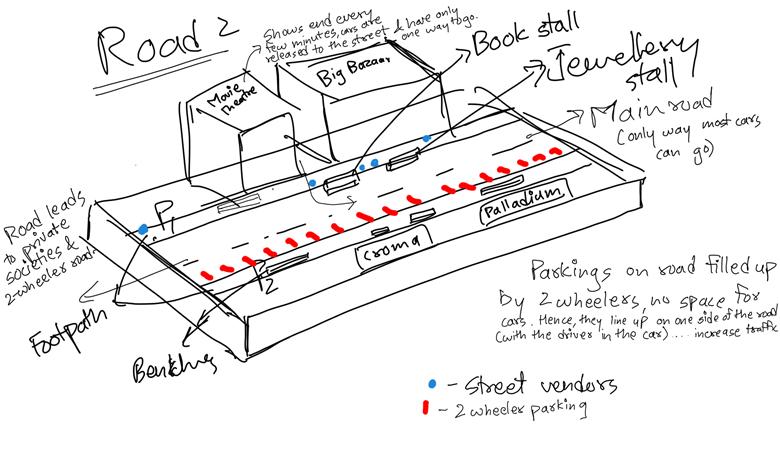
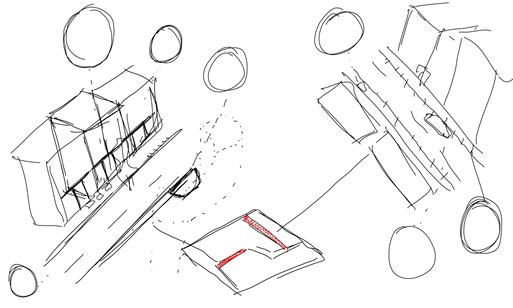
Figure 6: Possible Methods of Data Representations Note. Both methods use 3D representations. Copyright 2021 by Anandita Onkar.
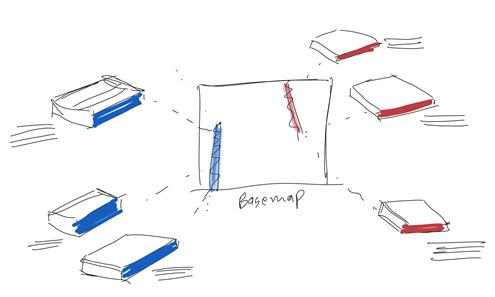
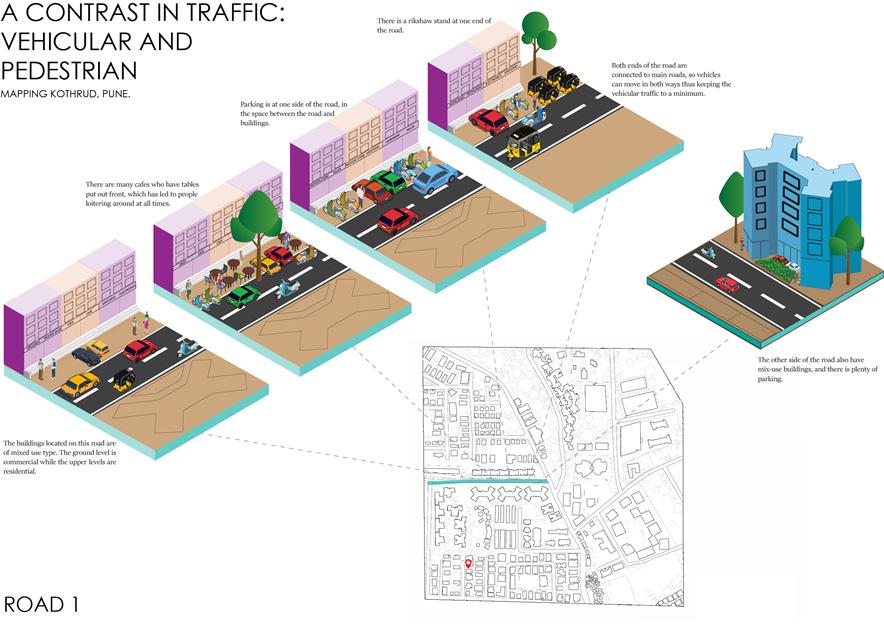
Figure 7: Final Map of Road 1 Note. Each road was colour coded, the first road was assigned a teal-green colour. This colour is also seen in the isometric section of each part. The sections are arranged to continuously represent the road. Copyright 2021 by Anandita Onkar.
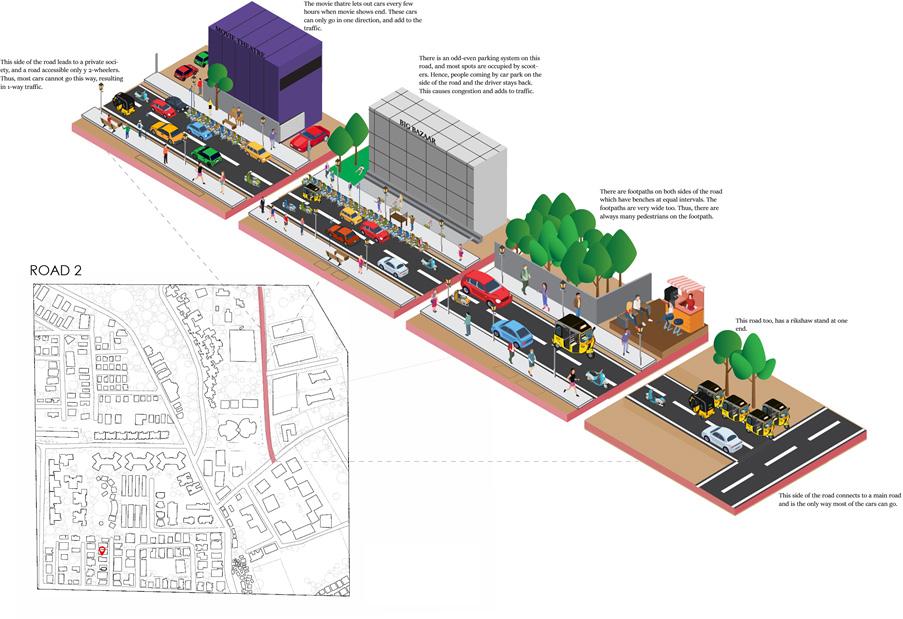
Figure 8: Final Map of Road 2 Note. This road is colour coded magenta. Copyright 2021 by Anandita Onkar.
and could convey most of the information.
Final Decisions Regarding Data Representation: Both possible methods were capable of conveying the required information. However, after discussing them with the tutors, I decided to go with the second method in Fig. 6 as the first one would have made the final sheet look too congested. The second method entailed breaking down each road into smaller sections with the main attributes like shops, parking spaces, footpaths, benches, street vendors, rickshaw stands, etc. and zooming in on those sections. This method would help me focus on every part of the road in detail, leave enough room for annotations, and ensure the sheet’s neatness.
I chose to make the final map in Adobe Illustrator as it creates vector-based illustrations ensuring high-quality files. As I hadn’t used this software a lot before, it was very challenging to create so many illustrations in merely a few days. The entire process involved a lot of googling and watching YouTube tutorials to learn how to use various tools. Deciding what illustrations to show was fairly easy as I had decided to represent the street and its elements as they were in real life. I made a few human figures, a car, a scooter and a rikshaw; and just repeated them throughout by changing their colours.
Final Outcome: The final outcome consists of two maps - one for each street. It contains zoomedin sections of the roads, as was mentioned before. These maps explain concisely the contrast between the two roads, without the use of technical jargon and hence
can be read by anybody, regardless of their knowledge on the subject. These maps could help the reader understand the area better. This map of Road 1 shows five different sections of the road, arranged in a way to show the road in its entirety. Every section has a layer of added information, and a small note explaining what the section shows, and how that particular aspect of the road affects the traffic. Similar sections have been made in the second map. Sections in both maps show one side of the road in detail, while the other is kept in plan view.
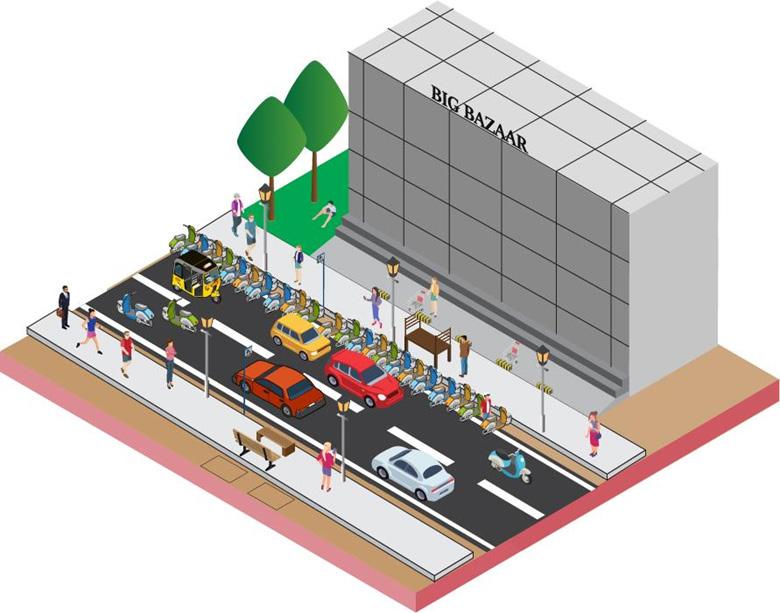
In this section, we can see the vehicular and pedestrian activity on the road. Various pedestrian activities have been captured in the section - Jogging on the footpath, sitting in the side garden, waiting for taxis and rickshaws and standing by the shopping carts after coming out of Big Bazaar. Various vehicles can also be seen on the road, these are the vehicles that we usually see in the area.
Sections like these with easy-to-understand illustrations, annotations and labels that go along with these illustrations make reading the map easy for everyone.
Figure 9: Close up of Road 2 Section 2 Note. The scale of one side of the road has been increased to show every element clearly. Copyright 2021 by Anandita Onkar.